LkH 225 (V1318 Cyg) South in Outburst
Abstract
Magakian et al. (2019) called attention to the current bright state of LkHa 225 South, a well-known highly embedded, intermediate-mass young stellar object that over the past two decades has brightened visually from to . We present recent optical photometric monitoring showing colorless, non-sinusoidal, periodic brightness oscillations occurring every 43 days with amplitude 0.7 mag. We also present new flux-calibrated optical and near-infrared spectroscopy, which we model in terms of a Keplerian accretion disk, and high dispersion spectra that demonstrate similarity to some categories of “mixed temperature” accretion outburst objects. At blue wavelengths, LkHa 225 South has a pure absorption spectrum and is a good spectral match to the FU Ori stars V1515 Cyg and V1057 Cyg. At red optical and infrared wavelengths, however, the spectrum is more similar to Gaia 19ajj, showing emission in TiO, CO, and metals. Sr II lines indicate a low surface gravity atmosphere. There are also signatures of a strong wind/outflow. LkHa 225 South was moderately bright in early the 1950’s as well as in the late 1980’s, with evidence for deep fades during intervening epochs. The body of evidence suggests that LkHa225 South is another case of a source with episodically enhanced accretion that causes brightening by orders of magnitude, and development of a hot absorption spectrum and warm wind. It is similar to Gaia 19ajj, but also reminiscent in its long brightening time, and brightness oscillation near peak, to the embedded sources L1634 IRS7 and ESO Ha 99.
accepted to AJ 20211229
1 Introduction
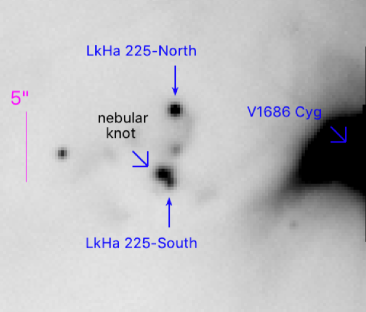
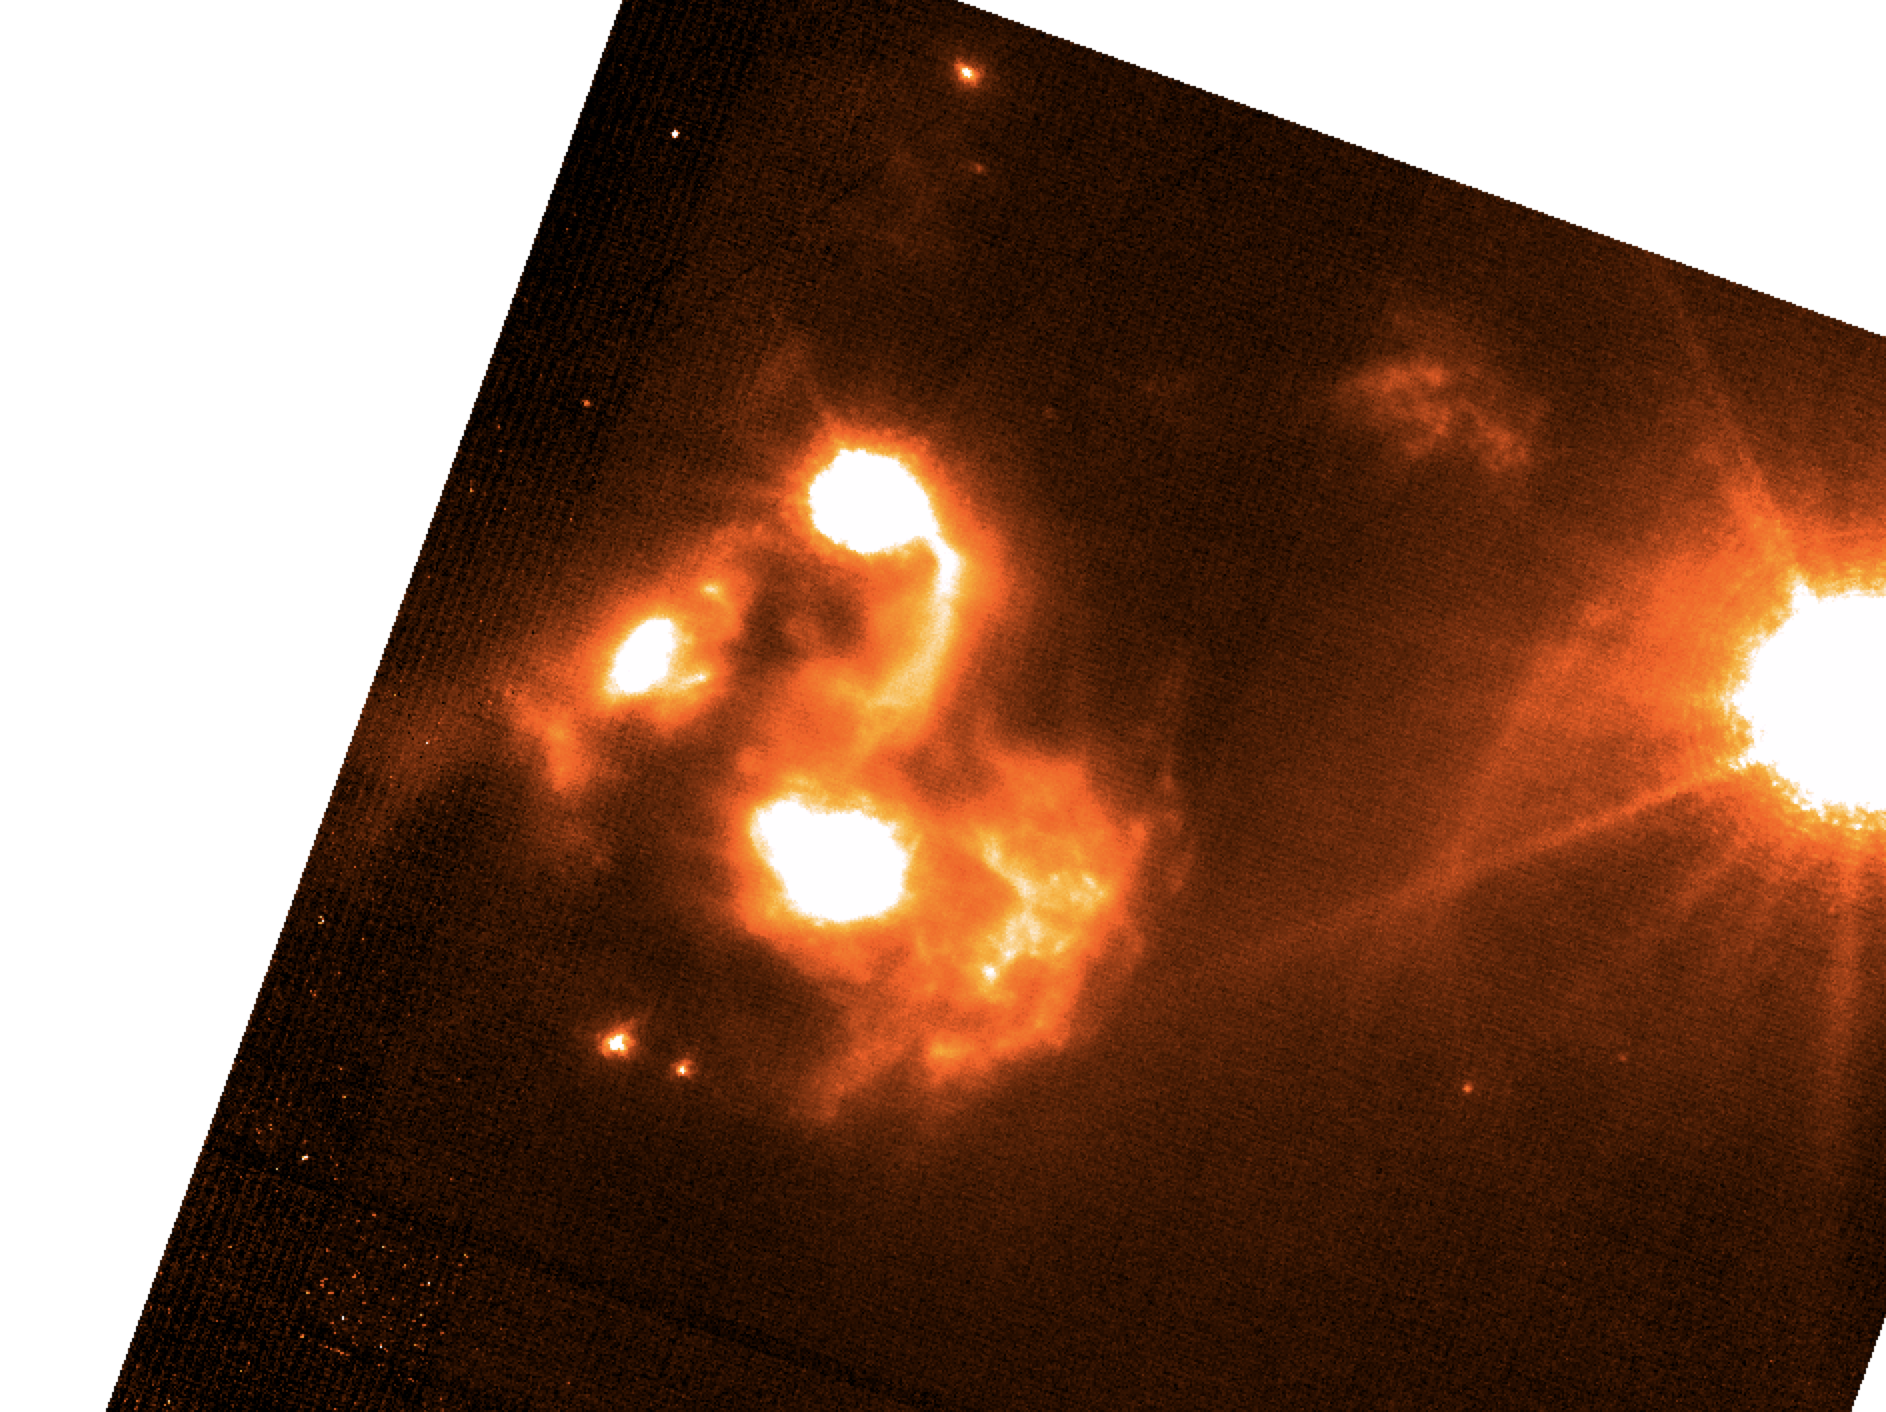
The young stellar object LkH 225 South (also designated V1318 Cyg South) is located at 20:20:30.59 +41:21:26.3 (J2000) and is associated with a small cluster of young stars usually identified as the BD+40∘ 4124 cluster. The two nebulous early type emission-line stars BD+40∘ 4124 (V1685 Cyg) and LkH 224 (V1686 Cyg) that define the optical appearance of the cluster (see Figure 1) are long-recognized – and in fact original – Herbig Ae/Be stars (Herbig, 1960). But it is LkH 225 South that is the dominant source in mid-infrared, far-infrared, and millimeter maps (e.g. Aspin et al., 1994, ; see also Spitzer and WISE images). The distance to the region is approximately 900 pc.
Historically, LkH 225 is considered a potential wide binary, with a north-south pair separated by about 5″ and an adjoining ridge of dense nebulosity. Both the northern and southern sources have protostellar Class I type spectral energy distributions.
LkH 225 South is generally touted as the source responsible for much of the star formation “activity” in the overall region, and is one of its more well-studied objects. In addition to being the brightest source locally at mid-infrared wavelengths, LkH 225 South has strong millimeter continuum. Indeed, it is well-known in the massive star, star formation community as a deeply embedded, moderate-luminosity protostellar object that drives a multi-component, massive bi-polar outflow.
Outflowing gas was first indicated in the spectrum of Andrillat & Swings (1976) via strong absorption in the He I 10830 Å line, consistent with a wind, along with strong emission in the Ca II triplet lines. Magakian & Movsessian (1997) reported on a spectrum from 1978 with described as “rather intense and possibly has a P Cyg profile” and Na D as “distinct”. Shocked H2 gas in the near-infrared was first detected by Aspin et al. (1994) and later mapped by Navarete et al. (2015, their Figure A90). van den Ancker et al. (2000) studied mid-infrared H2 and also present forbidden-line emission maps. (Sandell et al., 2012) detected the outflow in higher spatial resolution [C II] profiles. The molecular outflow was investigated in low-J CO by Palla et al. (1995); Matthews et al. (2007) and in high-J CO by Sandell et al. (2012). The ionized jet was mapped at radio wavelengths by Purser et al. (2021, their Figure B15) who found alignment with the H2 lobes of Navarete et al. (2015), and calculated a bolometric luminosity six times that of nearby BD+40∘ 4124, which, adjusting to the distance we adopt, amounts to nearly 2600 .
Palla et al. (1995) had reported H2O maser emission. Marvel (2005) further characterized the maser spot distribution and postulated that two outflow sources are involved. Looney et al. (2006) recognized that the maser position is offset to the NE from LkH 225 South, and demonstrated its coincidence with an extended 3.1 mm continuum source, suggesting that there may be yet another embedded protostellar source at this position. Bae et al. (2011) reported methanol maser emission in the area. The potential for spatial confusion seems to render unclear the origin of the large-scale outflow, and whether it is LkH 225 South, as often advocated, or the embedded mm source that is coincident with the masers.
There is also significant uncertainty about the mass of LkH 225 South. It is assumed to be intermediate-to-high mass, based on the integrated luminosity in the SED, with 1600 derived by Aspin et al. (1994). A spectral type of Ae-Fe was declared by Hillenbrand et al. (1995) for each of the two components of LkH 225, but this assessment was from a rather low signal-to-noise spectrum with little in the way of absorption lines. Then there is the spectral type of A4Ve reported by SIMBAD, that is attributed to Mora et al. (2001); this is clearly a typographical error, as the cited paper does not contain LkH 225, only the nearby LkH 224 (V1686 Cyg) which is indeed listed as A4Ve by Mora et al. (2001). Furthermore, the observations in the paper were taken in 1998 when LkH 225 was faint (as discussed below) and thus unlikely to have been a successful spectroscopic target. We make independent progress on a mass estimate in the context of SED fitting (section §7), though do not fare much better in constraining than the loose estimates already made from observations.
There are a total of three young stellar objects in the BD+40∘ 4124 cluster having the characteristics of intermediate-mass pre-main sequence stars, all located within a small molecular core region only pc in size. An accompanying population of lower mass T Tauri type objects is present as well, but the region is unusual in its high percentage of intermediate-mass stars relative to the sub-solar mass population (Hillenbrand et al., 1995).
Our interest in this region was re-piqued when Magakian et al. (2019) reported a slowly developing outburst in LkH 225 South, finding that the current bright state was reached in 2015. These authors recount the variability history of the source and illustrate recent spectra showing a mix of absorption and emission lines, plus evidence for outflowing gas.
In the current paper, we conduct an extensive investigation of the current bright state of the enigmatic source LkH 225 South. Figure 2 shows a recent guider camera image from late 2020. We report new photometric monitoring from Palomar/P48/ZTF that indicates an oscillatory nature to the bright-state. We also present Palomar/P200/DBSP and Keck/HIRES optical spectroscopy, and IRTF/SpeX and Keck/NIRSPEC infrared spectroscopy, all showing strong accretion and outflow signatures. Given its historically faint state, we have not previously had the opportunity to perform a good quality optical photometric and spectroscopic study of LkH 225 South. We also assemble the long term light curve of the source, and present previously unpublished imaging and spectroscopy from the faint state, as further context. Finally, we model LkH 225 South as an accretion disk dominated system, quantifying the outburst accretion rate and the stellar parameters.
2 Historical Light Curve of LkH 225 South
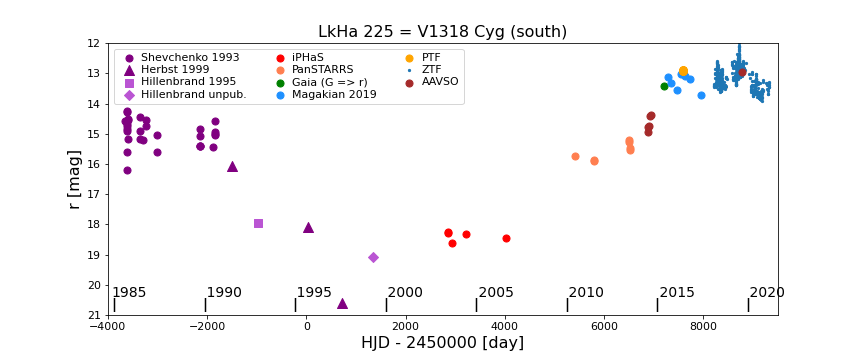
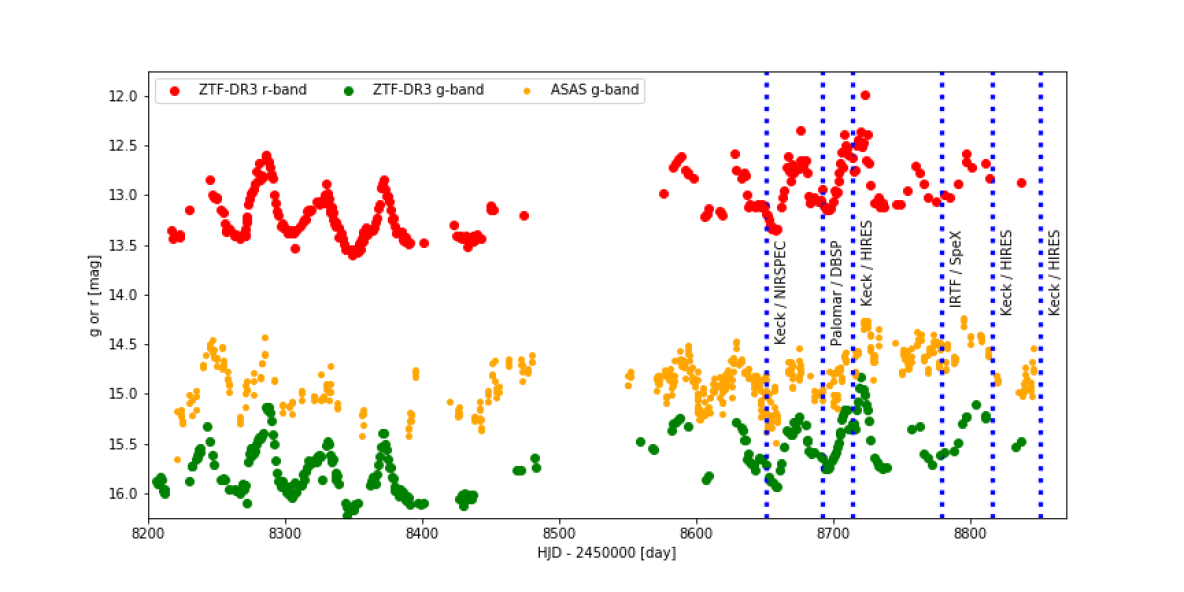
Figure 2 illustrates the light curve that can be assembled for LkH 225 South over the past 35 years, including photometry newly reported here that is highlighted in Figure 4.
The observed brightness in several different red optical filters has been converted to an equivalent -band magnitude for plotting purposes. At epochs earlier than those shown in the figure, variability of the LkH 225 system was well-documented during the 1950’s to 1970’s, as discussed also in detail by Magakian et al. (2019), but the variations were not well-quantified in the literature. Furthermore, due to the small separation (5″) of the north-south pair, the intervening ridge of nebular material, and the likely variability of each of the two components, there can be confusion in interpreting the older photometry. However, the evidence does seem to suggest irregular variations of at least several magnitudes in LkH 225 South. While typical photographic magnitude brightness was 17-18m, two “eruptions” to approximately 15.5m were documented by Wenzel (1972). LkH 225 South can be seen in all available plate data from the 1960’s as the brighter of the north-south pair (e.g. DSS1, Herbig, 1960; Strom et al., 1972). However, the source is somewhat fainter in DSS2 images.
Later, in the 1980’s, the LkH 225 system was monitored more systematically, and magnitudes were reported in known photometric systems. Typically the brightness measurements were below visually. Ibragimov et al. (1988) reported large color variations of several magnitudes. Shevchenko et al. (1993) reported -band variations between over JD = 2446345 and 2448159. Seemingly inconsistent with the other measurements from this era, Terranegra et al. (1994) report along with Strömgren system photometry indicating a mid-B spectral type; these data were taken in either333The observation dates and the objects are specified, but the correspondence between them is unspecified. September 1988 or June 1990, and are several magnitudes brighter than the data given in Shevchenko et al. (1993); we disregard them in what follows, suspecting they may be observations of LkH 224 (V1686 Cyg) just to the west, rather than of LkH 225. As discussed above, the same source confusion issues arise when considering previously reported spectral types for LkH 225.
In the early 1990’s, LkH 225 South clearly faded considerably, with the -band magnitude increasing from the 14-15m measured by Shevchenko et al. (1993) to the 17.3m measured in 1993 by Hillenbrand et al. (1995). Based on early 1994 plate data, Magakian & Movsessian (1997) comment that the source was “virtually indiscernible even in ”. Herbst & Shevchenko (1999) extended the Shevchenko et al. (1993) work to JD=2450710 and documented continued fading to below , along with a color increase in the V=15-19m mag range from to . An additional previously unpublished faint state measurement from 1999 is discussed below. Figure 2 shows that during this time period, LkH 225 South was even fainter than LkH 225 North.
By the time of the in 2003, LkH 225 South had brightened to once again become the brighter of the north-south pair, though no photometry is available at the source position 444There is a reported measurement at a position within the nebulosity between the northern and southern components. In fact, the north-south pair plus the connecting nebular ridge is categorized as a galaxy in catalogs (as also noticed by Magakian et al., 2019).. The measurements reported by Magakian et al. (2019) cover this missing SDSS epoch, however. The subsequent brightening of LkH 225 South began some time between the last epoch in late 2006 Barentsen et al. (2013) and the first epoch in mid-2010 (Flewelling et al., 2020), as highlighted by Magakian et al. (2019).
Finally, a fortuitously-timed set of observations taken by co-author DRP and reported to AAVSO (as user RZD), captured the photometric rise of LkH 225 South during the period from August 2014 to September 2015. This is between the data acquisition and the mean epoch of the DR2 data point. Over the year, LkH 225 South brightened by about 1 mag in and reportedly also became somewhat redder in color, increasing from 1.8 to 2.2 mag. The first Magakian et al. (2019) observation is also in September 2015 and these authors measure a consistent mag. Magakian et al. (2019) document color variation at the mag level over the subsequent two years; see Figure 2.
3 Data Assembly Including Old Observations and New Data Acquisition
3.1 Imaging and Photometry
3.1.1 1999 Keck Imaging Photometry
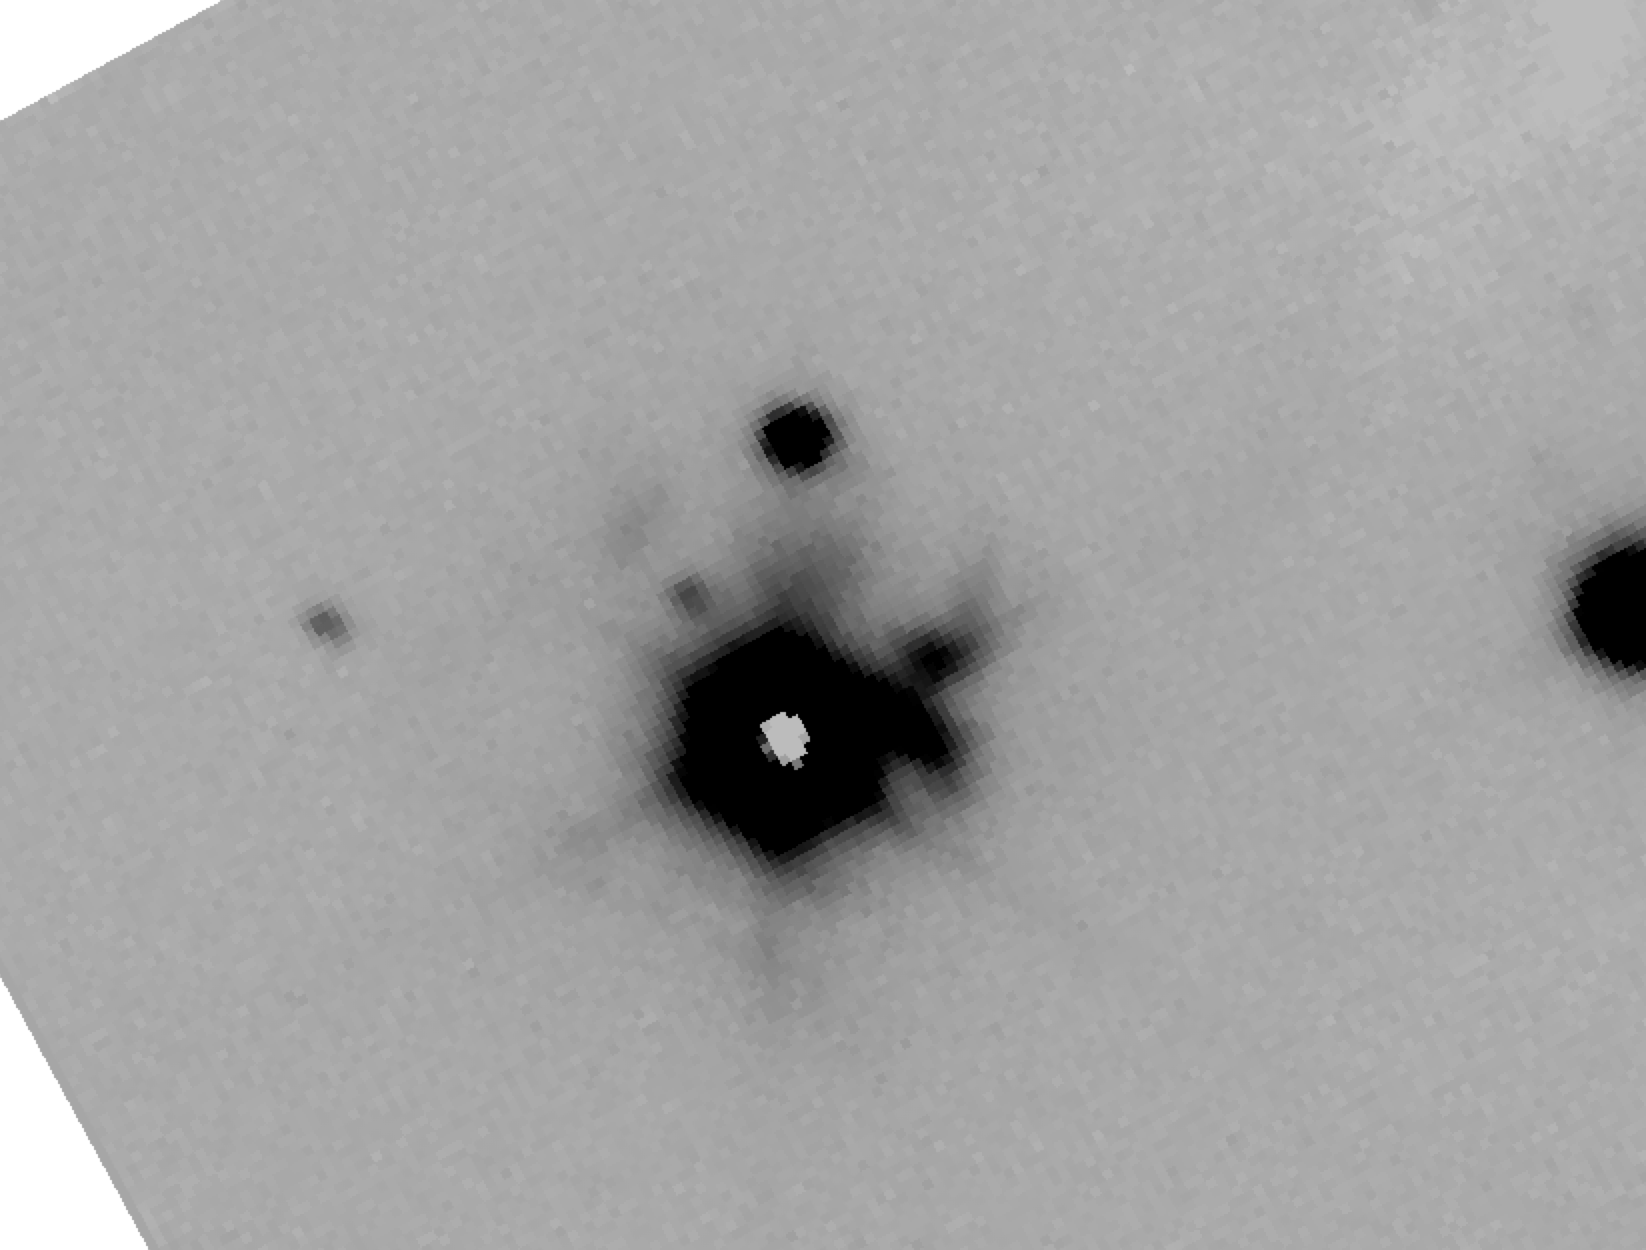
and band images of the entire BD+40∘ 4124 cluster including LkH 225 South were taken in June 1999 using the Keck Low Resolution Imaging Spectrometer (LRIS; Oke et al., 1995). These data are illustrated in Figures 1 and 2 and have FWHM of 0.54″ sampled at 0.22″pixel-1. Astrometric calibration and photometry was performed soon thereafter, as follows. Within the IRAF environment, point sources were identified, centroided, and photometered using a 7 pixel aperture with a sky annulus extending from 10 to 20 pixels. This resulted in measurements for LkH 225 North of mag and mag, and for LkH 225 South of mag and mag. However, as can be seen in Figure 2, the faint state of LkH 225 South reveals an even more complicated morphology with an additional, previously unappreciated, extension to the northeast.
The composite photometry from the 7 pixel aperture must therefore be decomposed. We recently re-examined these images to derive that the separation of the close pair is 3.78 LRIS pixels or 0.83″ at PA= from SE to NW. The LkH 225 South-NE component is 0.35 mag brighter than LkH 225 South itself. Adopting the combined NESW brightness as the 19.08 mag reported above, we find that the individual -band brightnesses are 19.66 mag for LkH 225 South-NE and 20.02 mag LkH 225 South. As discussed in Section 4, it seems likely that this NE component is nebular rather than stellar.
3.1.2 2018 – 2020 Optical Survey Photometry
The Zwicky Transient Facility (ZTF; Bellm et al., 2019; Graham et al., 2019) has measured and photometry for LkH 225 South over three seasons. Photometry was harvested from the IPAC/IRSA service555https://irsa.ipac.caltech.edu/cgi-bin/Gator/nph-scan?submit=Select&projshort=ZTF (Masci et al., 2019) which provides 450 measurements in each filter. magnitudes are calibrated to but do not have color corrections applied.
Over the same time period as the dataset, (Shappee et al., 2014) was also observing the field in the band. As illustrated in Figure 4, the light curve mimics the results, though the photometry is 1 mag brighter. The offset between the ASAS and ZTF -band measurements is not fully explainable by filter or photometric calibration differences, and likely resides in the large photometric aperture of ASAS, which would also encompass LkH 225 North just 5″ away.
3.1.3 Infrared Photometry Check
There is unfortunately no infrared monitoring photometry available for LkH 225 South due to the brightness of the source itself and the crowding of bright sources in this complex region.
In the near-infrared, the J-band data stream coming from the Palomar-Gattini-IR survey (De et al., 2020) shows that the source of interest is both saturated and confused.
In the mid-infrared, we similarly come up short on recent monitoring data, though there is evidence that a brightening has occurred. LkH 225 South is saturated in all four bands of the WISE data products and in the two bands of the NEOWISE reactivation mission. Furthermore, there is a slight positional offset to the west due to the nearby V1686 Cyg. However, earlier 2004 epoch measurements from Spitzer as reported by Gutermuth et al. (2009), indicated [3.6]=5.6 mag and [4.5]=4.4 mag for LkH 225 South and [3.6]=5.1 mag and [4.5]=4.4 mag for V1686 Cyg. The existing WISE data (Cutri et al., 2012) from 2010 provide only lower limits on brightness due to saturation with mag and mag. Although there is contamination by the near-equal brightness V1686 Cyg, the WISE data indicate significant mid-infrared brightening of LkH 225 South between 2004 and 2010. Furthermore, NEOWISE monitoring data (Cutri et al., 2015) between 2014 and 2018, which is also highly saturated, seem to indicate evidence for brightening from [3.4]3.0 to [3.4]1.5 mag. As all of the WISE/NEOWISE data are beyond the limits of any of the derived saturation corrections666http://wise2.ipac.caltech.edu/docs/release/neowise/expsup/sec2_1civa.html, we are unable to comment further on the mid-infrared light curve of LkH 225 South.
3.2 Spectroscopy
3.2.1 Optical
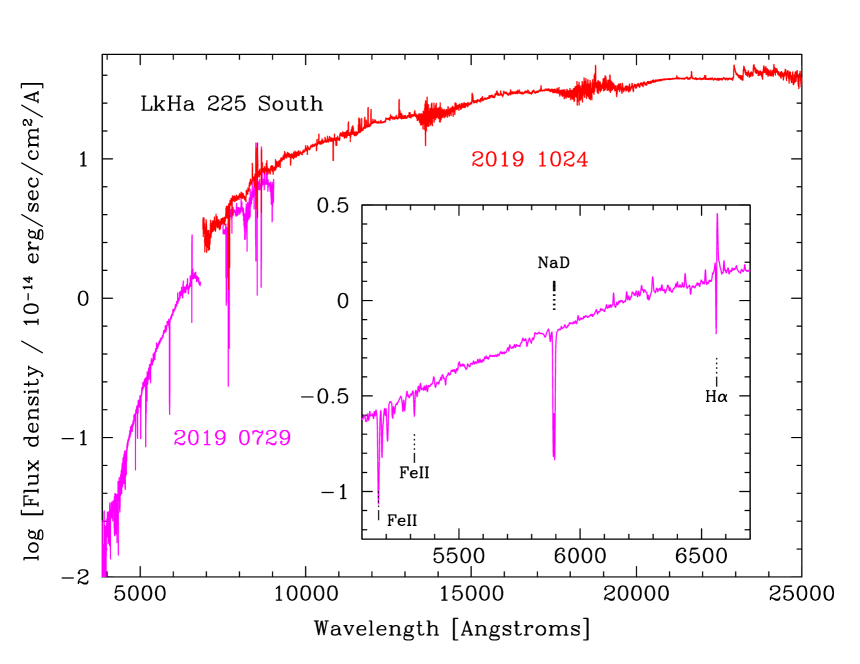
The venerable Double Spectrograph (Oke & Gunn, 1982) was used at the Palomar 200” telescope on 27 July, 2019 (UT) to obtain flux-calibrated spectra of LkH 225 South. The spectra cover 3850-6800Å with the 600/4000 grating on the blue side, at 1.08Å/pixel sampling, and 7500-9000Å with the 1200/7100 grating on the red side, at 0.40Å/pixel. A 1″ slit was used with the slit positioned at the parallactic angle. Spectra were extracted using the python package pyraf-dbsp777https://github.com/ebellm/pyraf-dbsp, developed by E. Bellm and B. Sesar, as a wrapper to IRAF data processing and spectral extraction tools. The realized S/N ratio ranges from 10 in the far blue to 100 in the far red. The resulting optical spectrum is illustrated in Figures 5 and 6.
We obtained an optical echelle spectrum between 3400-7900 Å at resolution R60,000 using the Keck I telescope and HIRES (Vogt et al., 1994) on 18 August, 2019 (UT). Data acquisition used the standard operating procedures of the California Planet Search as described in Howard et al. (2010). A 635 sec exposure resulted in a spectrum with S/N = 45 at 5600 Å and S/N 150 at 7100 Å.
Two additional HIRES spectra were obtained on 29 November 2019 (UT) and 3 January 2020 (UT), both covering 4800-9200 Å at resolution R25,000. These were processed using the MAKEE reduction pipeline888https://astro.caltech.edu/~tb/makee/ written by T. Barlow.
3.2.2 Infrared
We obtained spectra in the 1 m -band region at R18,500 with the Keck II telescope and the recently upgraded (Martin et al., 2018) NIRSPEC (McLean et al., 1998) instrument. The 0.576″ slit was used with rounds of A-B-B-A position nods taken with exposure time of 30 sec per position. Spectra were taken on 16 June 2019 (UT) by E. Petigura and T. David, and on 2 September 2020 (UT) by LAH and J. Spake. The data were processed using the REDSPEC package written by L. Prato, S.S. Kim, & I.S. McLean.
We also observed LkH 225 South over a broader spectral range, covering 0.7-2.4 m at a resolution with the IRTF and SpeX (Rayner et al., 2003) in its SXD (short-wavelength cross-dispersed) mode. On 24 October 2019 (UT) a set of 15s exposures were taken with 4 minutes of total exposure time through the 0.3″ slit. The realized S/N per exposure is 60 in the Y-band and 200 in the K-band.
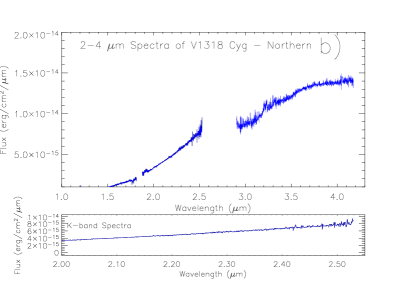
Finally, we make use of IRTF/SpeX spectra of LkH 225 South obtained in a much earlier stage of the long term outburst, closer to the faint state in fact. On 31 May, 2003 (UT) the 0.5″ slit was used to obtain SXD and LXD (long-wavelength cross-dispersed) data covering 1-4 m for both LkH 225 South and LkH 225 North. These spectra are illustrated in Figure 7. Below we compare this older LkH 225 South spectrum to the more recent spectrum taken in the outburst state.
4 Small-Scale Morphology of the LkH 225 Environment
The complexity of the region under study was increased by the revelation provided in our 1999 Keck/LRIS images that, in its faint state, LkH 225 consists not only of the well-known wide separation (5″) north-south pair, but an additional spatially resolved component on smaller scales. This newly appreciated source has a separation of 0.8″ from LkH 225 South (Figure 2).
Careful consideration of the astrometry shows that the source currently outbursting and identified as LkH 225 South, specifically as measured by Gaia Collaboration et al. (2018), coincides with the fainter, SW optical component of the close pair in Figure 2. The NE component was brighter in 1999, with an east-west extension that indicates it may be nebular.
The next available imaging data at sufficiently high spatial resolution is a 2003 infrared image from the Gemini Science Archive, shown in Figure 7. The SW component is clearly seen as the much brighter source at this epoch, while the NE component is still apparent. The H2 emission aspect of the NE component can be isolated by subtracting a spatially registered and scaled continuum image. We do not show such a subtracted image due to strong residuals induced by a temporally variable AO PSF, that affects image alignment and subtraction results. However, we can report that such a subtraction retains only the extended structure several arcsec to the NE and several arcsec to the W-SW of LkH 225 South, as well as the very diffuse material to the NE of V1686 Cyg.
The compact nebular component that we are labeling as NE of the point source LkH 225 South, seems coincident with the location of the maser spot field reported by Marvel (2005), as indicated in their Figure 7. This is likely also the same position as the 3.1mm continuum peak reported by Looney et al. (2006). These coincidences suggests the possibility of an even more deeply embedded companion in the LkH 225 system. Specifically, the optical and infrared nebulosity we see near this same position could be scattered light ( and H2 emission) that escapes along an outflow cone from a protostellar source.
The physical (projected) source separation between the SW and nebular NE sources can be calculated using Gaia DR2 (Gaia Collaboration et al., 2018) parallaxes. The reported parallax of LkH 225 South itself is rather uncertain, and a high renormalized unit weight error is reported with RUWE=8.1, whereas 1.4 is recommended. The nearby source V1686 Cyg also has a large parallax error. We thus use the parallax of the optically brightest source in the vicinity, BD+40∘ 4124 ( mas) which is better determined. Adopting 916 pc as the distance to the region, the projected separation of NE-SE is 760 AU, while the SW (LkH 225 South) to LkH 225 North projected separation is about 4575 AU.
Regardless of the nature of this NE component, we do confirm after considerable astrometric analysis, that the currently outbursting source is the well-known LkH 225 South.
5 Photometric and Spectro-Photometric Analysis of LkH 225 South
In its current outburst state, LkH 225 South is red throughout the optical and near-infrared wavelength range, as illustrated in Figure 5. The overall red continuum slope has a number of contributors, including: a central stellar source, gas and dust emission likely over a range of temperatures, and dust extinction from both the circumstellar and the local cloud environment.
5.1 Faint State to Bright State Changes
While LkH 225 South remains red in an absolute sense, the optical colors in the outburst state seem somewhat, but not dramatically, bluer than those measured much earlier. The color of 2.8 mag (AB) reported by ZTF would correspond to mag and mag. This is based on a conversion from (AB) to (AB) from Jordi et al. (2006), further correction from AB to Vega magnitudes, and then scaling to according to the relation between these colors in the LkH 225 South monitoring data of Shevchenko et al. (1993).
The source colors were similar in the periods in the 1980’s, before the long duration fade to , as well as during the fade e.g. 1994 data (Hillenbrand et al., 1995, ; =1.8: mag and =1.7: mag), and within the deep fade, e.g. the 1999 Keck/LRIS imaging (§3.1; mag).
Color information during the re-brightening is scarce. The 2014 measurements by co-author DRP that were reported to AAVSO (as user RZD) were mag. They show the V-R color becoming redder as the source brightens by about 0.6 mag. This is consistent with the fact that the currently measured mag (AB) is redder than the values of mag (AB), measured in 2013, and 2.3 mag (AB), measured in 2011. The current values are on the blue side of the colors measured in 2015 by Magakian et al. (2019), which also represent the bright state, reported as mag and =1.5-1.8 mag.
We note that for the majority of these photometric measurements, the errors are often unreported. As a guide to approximate values, we consider that the color error in the PanSTARRS (PS1) catalog is 0.1 mag, and we take this as a minimum error for the other color measurements given above.
Even though the current optical colors do not seem significantly different from those measured at much earlier epochs, the evidence seems to suggest a reddening trend as the source rose to its current peak brightness. However, this is not what is seen in the infrared.
Although no colors are available, we do have spectrophotometric measurements. To determine whether the infrared SED has changed during the brightening, we can directly examine the 2003 infrared spectrum relative to the 2019 infrared spectrum; both are illustrated in Figure 9. A ratio of the two spectra shows a flux increase during the burst by a factor of in the J-band, 85 in the H-band, and 50 in the K-band, implying a “blue” nature to the burst.
5.2 Extinction Effects
There is no value of extinction that would truly flatten the infrared flux ratio spectrum described above. This implies that the dramatic brightening can not be explained by a reduction in extinction alone. However, a decrease in by about 3 mag would nearly equate the ratio at -band and -band around a value of , with the -band a little higher. A reasonable scenario is one in which there has been both a reduction in line-of-sight extinction to the infrared continuum, and intrinsic source brightening.
The total line-of-sight extinction is harder to evaluate. A recent estimate by Carvalho & Hillenbrand (2021) makes use of diffuse interstellar bands DIBs absorption features to estimate mag for and for . This is absorption against the outburst optical continuum. Here, we find that de-reddening the flux-calibrated optical outburst spectrum by values in the range 4-9 mag produces a spectral energy distribution at blue wavelengths that is consistent with unreddened FGK stellar templates with the higher values corresponding to the earlier templates). Again, these estimates would be the current extinction to the source of the optical continuum. An additional mag is needed to describe the difference between the bright state and faint state infrared spectral slopes, meaning that the faint-state extinction was in the range mag.
This range of values is consistent with what can be inferred from the [Fe II] lines in the faint-state (2003) infrared spectrum. We use the formalism of Pecchioli et al. (2016) with the intrinsic line ratios of Bautista et al. (2015) and reddening law of Fitzpatrick (1999). From the measured [Fe II] 1.257, 1.321, and 1.644 m line fluxes of 1.47, 0.47, and 2.13 , respectively, we find values of = 7.3 0.1 for . We can not derive a value for the bright-state (2019) spectrum since the continuum brightening renders the [Fe II] lines immeasurable.
It is unclear how much of the total line-of-sight extinction should be attributed to the molecular cloud and how much to the circumstellar environment, but we note that the long-wavelength portion of the pre-outburst spectrum (Figure 7) does not show evidence of the m water ice feature, which is often associated with high-extinction, high-density environments. The lower among the above extinction values may thus be most appropriate.
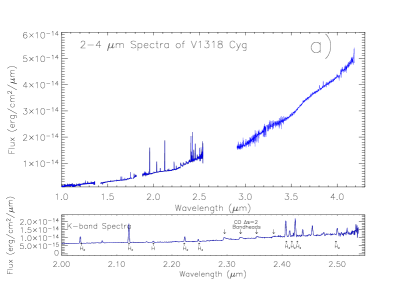
5.3 Bright State Quasi-Periodicity

To assess the periodicity of the photometric oscillations seen in Figure 4, we employed a Lomb-Scargle period search algorithm (see e.g. VanderPlas, 2018, for a thorough discussion) as implemented in the LombScargleFast routine under the gatspy.periodic python package. The period was fit in flux units rather than in magnitudes. Using the full data set, a single strong peak in the periodogram corresponds to a derived period of 43.4 days. While the period has persisted for three years, there is some evidence for a fluctuation over time in the mean source brightness, on top of which the periodicity resides. Including a fit for this drift does not change the mean period or amplitude, but does reduce the scatter as a function of phase. The mean r-band magnitude was 13.0 mag during the 2018 season, which brightened to mag during the 2019 season, then faded to during the 2020 season. In addition, within the seasons, we find that in 2018 there was a downward drift corresponding to 0.42 mag/yr, in 2019 an upward drift of -0.32 mag/yr, and in 2020 the source was fading by 0.22 mag/yr. Correcting for these drifts and phasing the light curve results in the profile shown in Figure 8.
Among individual cycles, the amplitude of the periodic signal ranges from 0.6 to 0.8 mag. A formal analysis using a smoothed version of the light curves yields peak-to-trough amplitude of mag for band and mag for band. The light curve peak-to-trough excursion time is nearly 1/2 of the period, with the derived time between light curve maximum and light curve minimum times the period for both band and band. Notably, the clear periodicity in the and light curves comes without any change in color. We find an essentially constant value over time of mag (AB) and no evidence for color periodicity in the source999The only color periodicity appears to be a few percent signal associated with the 28 day cycle of the moon phase. This period is also seen as a low level brightness periodicity, though at a factor of ten lower significance than the 43 day astrophysical peak..
We note that the current periodicity can not be recovered in available photometry from earlier epochs (Figure 2). Specifically, neither the 2015-2017 data of Magakian et al. (2019) nor the 1980’s data of Shevchenko et al. (1993) show detectable periodicity. However, we have checked whether the Magakian et al. (2019) data can be phased to the currently observed period. As shown in Figure 8, the fluctuations seem significant and tend to display the same trends as the current data, but phase up with two of the seven points having more scatter than the recent ZTF data.
6 Spectroscopic Analysis of LkH 225 South
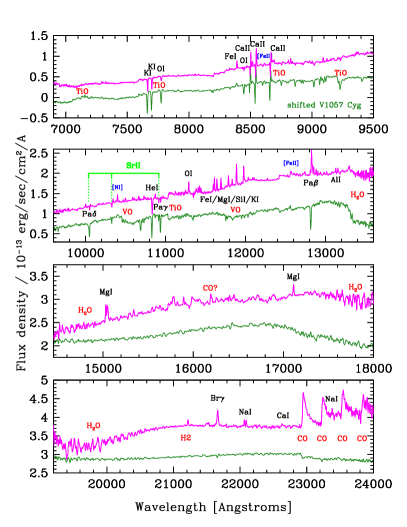
The subsections below present the salient details of the LkH 225 South spectral features. We begin by comparing the outburst infrared spectrum to an earlier pre-outburst spectrum, highlighting changes. We then proceed to discuss the various spectral elements of the outburst spectrum in detail. There is evidence of a strong wind/outflow seen against the optical continuum, but not of a shocked atomic gas component, which would manifest as e.g. strong forbidden lines formed in a jet. However, there are weak shocked gas emission signatures in molecular H2 and atomic [Fe II] in the infrared that have weakened relative to the continuum during the outburst. The outburst also features molecular TiO and CO emission and weak atomic metal line emission that appears mainly at wavelengths longer than 6000 Å. Finally, there is photospheric absorption that apparently arises from a low-gravity atmosphere having mixed temperature, with both hot features (e.g. Fe II) at blue wavelengths and cool features (e.g. H2O) at red wavelengths. After the following detailed description of the outburst spectrum, we close the section by describing the subtle differences among the three HIRES spectrum taken at moderately different photometric phases.
6.1 Spectral Changes between 2003 and 2019
The spectral ratio analysis described above reveals that the H2O absorption seen in Figures 9 and 10 has been enhanced during the outburst. Another finding is that there is essentially no change in the CO line-to-continuum, with only continuum remaining in this wavelength region of the ratio spectrum. Any change in TiO is hard to assess, as it is not possible to determine whether or not the source had TiO before the long-duration outburst. Also, the prominence of narrow H2 emission relative to the continuum has decreased in the bright state.
Regarding the atomic emission, detailed examination shows that essentially all of the 1-2.4 m lines now seen in emission in the bright state were also present in the faint state. The atomic emission line pattern is essentially the same, only weaker in the earlier spectrum. The ratio spectrum shows no change in the line-to-continuum, i.e. no signature of the emission lines in the ratio spectrum. The implication is that the photometric brightening contributes equally to the continuum and the atomic line emission.
Going back even further, the near-infrared spectra shown in Aspin et al. (1994), taken in 1991, compare very well to those illustrated in Figure 7, taken in 2003. The earlier date closely follows the end of the Shevchenko et al. (1993) time series data illustrated in Figure 2, which is just before the deep fade101010Aspin et al. (1994) report fading by 2 mag in the near-infrared between October 1991 and November 1993. from to . The 2003 date was firmly in the deep fade. Thus, the fading and accompanying reddening (Herbst & Shevchenko, 1999) do not seem to have resulted in any change in the source spectrum. Conversely, the brightening from to the current has produced a change in the emission and absorption spectrum in the -band (Figure 10).
6.2 Wind and Jet Outflow Lines
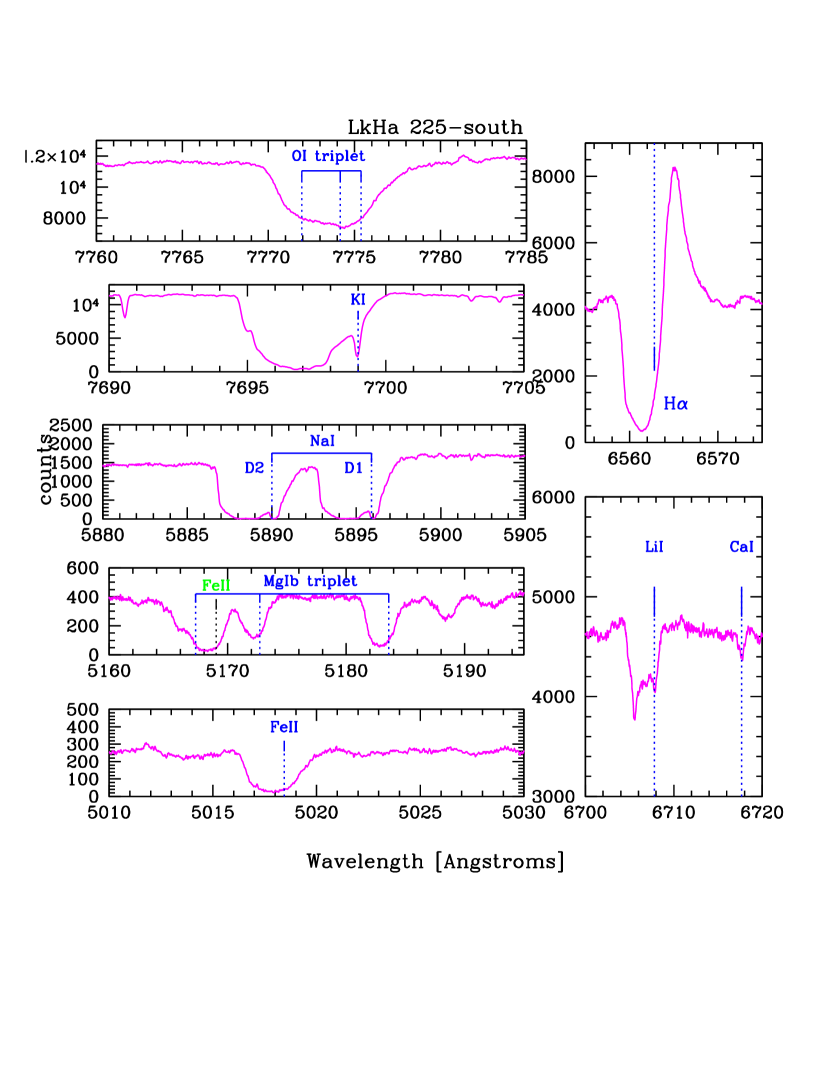

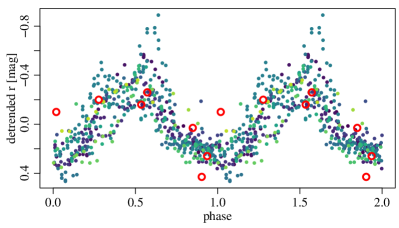
Seen against the very red continuum are a number of indicators of rapidly outflowing gas from LkH 225 South. Figure 11 illustrates deep, blueshifted absorption in the usual prominent optical wind lines, notably Mg Ib, Na ID, K I 7665 and 7699 Å, and O I triplet. Wind signature is even seen in Li I 6708 Å. H along with the Ca II triplet lines (Figure 12) exhibit P Cygni structure.
The Na ID wind absorption is saturated, and the K I nearly so. We note explicitly that the wind evidenced in the red lines of K I, O I, and Ca II is forming against the continuum of the molecular TiO/VO emission. At bluer wavelengths, absorption in lines of Fe II, such as 4172, 4179, 4924, 5018, 5169, 5197, 5234, 5316 Å is evident in our low resolution spectra (e.g. Figure 6) and revealed in our higher resolution spectra (not shown) to also have broad blue asymmetry, indicative of a wind. The typical terminal velocity of these metal lines is about km s-1.
The H and Ca II triplet lines are strong and broad. However, the entire blueshifted portion of the emission profile is not in fact absorbed. Instead, the absorption extends to about -210 km s-1 with an additional wing of unabsorbed blueshifted emission that extends to about -325 km s-1 (see Figures 11 and 12. At low dispersion, our H profile appears very similar to the time series of such profiles that is shown in Figure 4 of Magakian et al. (2019).
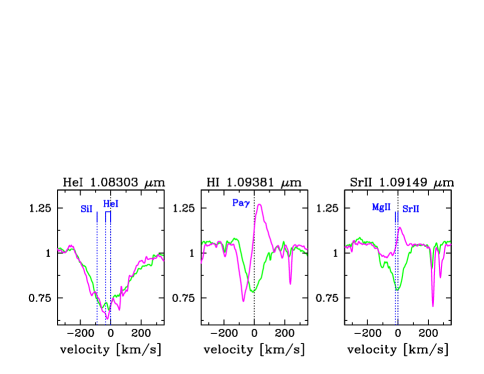
In the infrared, Figure 10 indicates Br and Pa strongly in emission, but the resolution is too low to discern the line kinematics. The Pa line is ambiguously present in Figure 10, but Figure 13 shows this line at higher dispersion. It has a clear P Cygni profile indicating wind signature in our 2019 spectrum, but the 2020 spectrum shows the line in pure absorption, centered at zero velocity.
Figure 13 also shows the He I 10830 Å triplet profile, which has a depth of about 70% of the continuum and width km s-1. The profile is fairly symmetric around the weighted line center of the triplet. Furthermore, the absorption is broader than that exhibited in the nearby hydrogen or metal lines. There is no obvious P Cygni structure or blueshifted asymmetry in He I 10830. In other young star outbursters He I 10830 line depths can reach to only 5% of the continuum in some cases. One object with a He I 10830 profile that is quite similar to that of LkH 225 South is FU Ori itself, with similar centroid, width, and depth.
Notably, there is no change in the He I 10830 Å profile between our two spectra taken approximately 1.2 years apart. As stated in the Introduction, an early spectrum of Andrillat & Swings (1976) also showed strong absorption in the He I 10830 Å line. There is indication of such in the 2003 IRTF/SpeX spectrum as well (see Figure 9), possibly with a P Cygni type profile, which is not present in the current outburst state.
Regarding forbidden line emission, we do not see a strong signature in the [O I] or [S II] lines that are reported as detected by Magakian et al. (2019). However, these authors acknowledge that bad sky subtraction could be an issue in their data, and could cause a false positive. The source is not significantly different in brightness now compared to the Magakian et al. (2019) observations, so continuum brightening is not the explanation for the lack of detection of these lines in our data. We do find, however, unambiguous [Ca II] doublet emission at 7291,7324 Å (Figure 12). This doublet is rarely seen in normally accreting young sources, though was seen in the outbursting case of PTF 14jg (Hillenbrand et al., 2019a). The [Ca II] doublet is the only strongly detected optical forbidden line in the outburst state of LkH 225 South.
6.3 Molecular Emission
Molecular emission in the form of H2 is associated with shocked gas in near-circumstellar environments. This molecule is only weakly seen in the -band region of LkH 225 South in its outburst state. Comparing the recent outburst spectrum to the earlier 2003 pre-outburst or early outburst spectrum, the H2 line-to-continuum is weaker in the outburst spectrum, as discussed above.
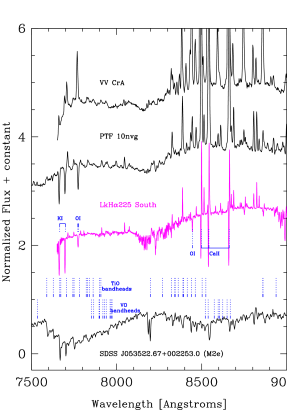
More unusual, in terms of molecular features, is that in outburst LkH 225 South exhibits the rare phenomenon of having TiO bands in emission. This is seen from the red optical out to the 11300 Å band (Figures 6 and 10). There is a hint that the 11300 Å emission was also present in the pre-outburst state (Figure 9). Only a few young stars have been documented with TiO in emission, specifically PTF 10nvg / V2492 Cyg (Covey et al., 2011), IRAS 04369+2539 and IRAS 05451+0037 (Hillenbrand et al., 2012), VV CrA (Herczeg & Hillenbrand, 2014), iPTF15afq (Miller et al., 2015, a.k.a. Gaia19fct), and PGIRN 20dwf (Hankins et al., 2020, a.k.a. Gaia20eae). Figure 10 demonstrates V1057 Cyg to be in this category as well; the spectrum is the same as that shown in Connelley & Reipurth (2018), though the TiO emission aspect was not commented upon in that paper.
Typically, TiO and VO bands are seen in absorption, and signify the presence of warm molecular gas ( K) in a cool stellar atmosphere. These molecules define the onset of the type M spectral class, for example, with increasing absorption seen in the TiO/VO species towards later types, transitioning to CO and H2O molecules at even cooler M-type photospheres. All four of these molecules are observed in absorption from the disk atmospheres associated with FU Ori stars (Connelley & Reipurth, 2018).
In LkH 225 South, we see the optical and near-infrared TiO/VO bands, and the infrared CO lines, all in emission, but the H2O molecule is in absorption.
6.4 Atomic Emission
There is sparse, weak narrow atomic emission in the outburst spectrum of LkH 225 South. The lines are at the rest velocity, and overall the narrow emission spectrum is quite similar to that of V2492 Cyg, suggesting a similar temperature, though weaker in terms of line strength.
In the optical, the emission is seen mainly at the redder wavelengths of Figure 6, with little emission detected shortward of 6000 Å, even at high spectral resolution. The optical lines are mainly Fe I with some Ni I and Ti I. There is an apparent trend in emission vs absorption with line excitation energy. Many lower excitation Fe I and Ni I lines are weakly in emission, but the higher excitation lines in these same neutral species are seen mainly in absorption.
At infrared wavelengths, as depicted in 9, there is a slightly stronger, well-populated atomic emission line forest in the J-band. There is also weak Mg I in the H-band, and weak Na I and Ca I in the K-band.
Magakian et al. (2019) reported that many (optical) lines of Fe II are in emission, which we do not see. Our spectra were taken approximately 4 years later and show these same Fe II lines ubiquitously and unambiguously in absorption. This suggests cooling spectral evolution after the source reached its peak brightness. However, the low excitation Fe I lines remain in emission. The situation in LkH 225 South seems somewhat similar to the one in PTF 14jg, which was categorized by Hillenbrand et al. (2019a) as an unusually hot accretion outburst. That source exhibited strong absorption in Fe II, as well as in other even hotter ionized metals, early on in its outburst. PTF 14jg also showed Fe I and other neutral metal emission lines at the same early times, but these lines faded over several years and became absorption features.
6.5 The Pure Absorption Spectrum
The LkH 225 South absorption spectrum is peculiar, and not readily interpreted as either a normal single star, or a binary star system. Instead, we suggest a more complicated composite spectrum.
Atomic absorption lines become increasingly prominent towards shorter wavelengths – down to the Å limit of our data. The photosphere of LkH 225 South is thus apparently not heavily veiled in the blue. Veiling, or accretion continuum emission that occupies a low filling factor, would weaken the absorption lines. It arises under situations where the accretion rate is modest.
For higher accretion rates, it is possible to produce a predominantly absorbing spectrum that originates in the hot inner regions of an accretion disk. In this scenario, the bluer wavelength absorption lines we observe could originate in such a disk, or a wind emanating from this same region. A relatively cooler emission-line component would fill in the low excitation absorption lines that would otherwise be present, turning some into emission. We present detailed inferences from the observed absorption spectrum in the sub-sections below.
In addition to the absorption lines that originate in the (possibly extended) LkH 225 South photosphere, we also note the presence in our high resolution optical spectra DIBs. Magakian et al. (2019) also mentioned the presence of DIBs features in LkH 225 South. Specifically, we see the 6614, 6379, 5850 (weak), 5797, and 5780 Å DIBs. As mentioned above, these can be used to estimate the extinction to the optical continuum source, as recently done for this source (and others) by Carvalho & Hillenbrand (2021).
6.5.1 Temperature
The low resolution Palomar/DBSP spectrum (Figure 6) is clearly composite at blue wavelengths. Readily visible are Fe I, Mn I, and Ca I amidst a forest of other absorption lines, including strong Fe II (a hotter line). The high dispersion spectrum (e.g. Figure 14) allows us to identify additional lines, spectrally resolving them. Many intermediate excitation neutral lines are seen in absorption. Among them are the Fe I 7569 Å (4.3 eV) and Ni I 7573 Å (3.8 eV) featured by Petrov & Herbig (2008). Also present are various Ca I (2.5-3 eV), Mg I (5-6 eV) and Fe II (4-6 eV) lines. The redder range of the spectrum exhibits several even higher excitation lines like Ca II 8912 and 8927 Å (7.1 eV). Perhaps bounding the temperature on the high side, the hot Si II 6347 and 6371 Å (8.1 eV) lines that have been seen in objects like PTF 14jg are not present in LkH 225 South.
To attempt to discern the approximate temperature of the LkH 225 South outburst, we compared the de-reddened version of the low resolution optical spectrum to single-temperature standard stars. Based on the strongest metal lines, a best-estimate spectral type across the blue optical is somewhere between a late F and an early K star. However, LkH 225 South is a poor match to any single-temperature template spectrum in this spectral range. The LkH 225 South spectrum additionally has a pattern of lines that are matched only in mid- and late-A type stars (appearing much stronger than in the standards) and other lines that are matched only in mid- and late-K type stars. We thus do not report a spectral type for the outburst spectrum beyond “mixed”.
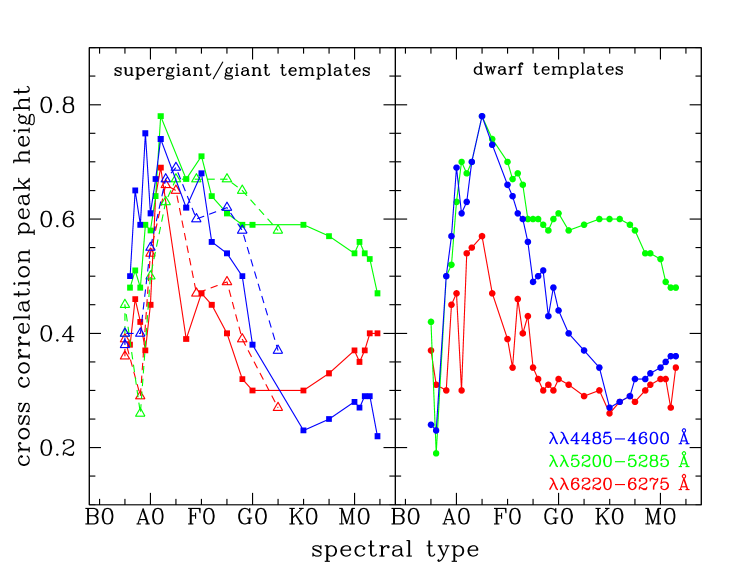
To assess the spectral type at high dispersion, we perform a cross-correlation analysis of the Keck/HIRES spectrum of LkH 225 South and a grid of stellar templates selected from the ELODIE spectral library (Prugniel et al., 2007). Figure 15 shows the results of this analysis over three different wavelength ranges, chosen to exclude spectral regions with strongly wind-affected species like those discussed in §6.2 above. Based on this analysis, the best spectral type for the photosphere of LkH 225 South appears to be A3-A6 V. Our quantitative finding can be confirmed by visual examination of the spectra. The pattern of metal absorption lines is well-matched to the mid-A spectral type range, with similar strength lines that would be expected in FG spectral type comparison stars not as strongly present.
A further conclusion from the cross correlation analysis is that there seems to be little evidence for a systematically changing spectral type with wavelength. Although we found evidence in the low dispersion spectroscopy for a composite spectral type, no clear systematic behavior along these lines is obvious in the optical high dispersion data. However, Figure 15 does show that the e.g. 5200 Å spectral range has a broad plateau of good correlation strength that extends throughout the FG and early K spectral types. Thus the composite or mixed spectral type conclusion seems robust.
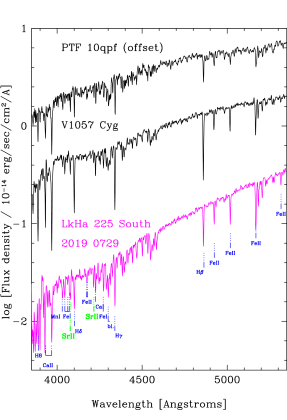
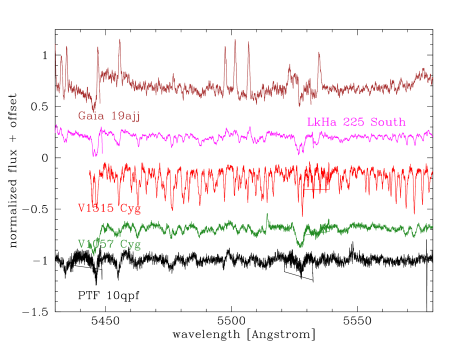
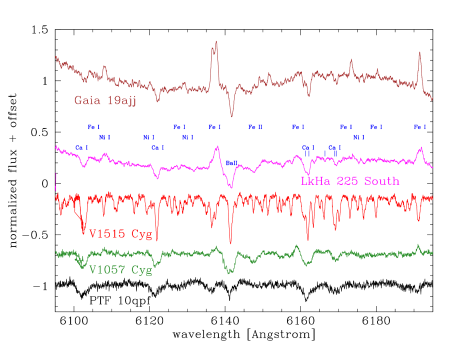
In contrast to the results from single temperature comparisons, the match of the LkH 225 South spectrum at blue wavelengths to the FU Ori stars shown in Figure 6, is quite good. The spectrum shows essentially the same detailed absorption pattern exhibited by V2493 Cyg (PTF 10qpf; HBC 722) and V1057 Cyg. The same is true at high dispersion, as shown in Figure 14 which includes the two objects mentioned above as well as V1515 Cyg. Overall, LkH 225 South appears intermediate between V1515 Cyg and V1057 Cyg in its absorption spectrum, with line widths that are more like the former, and line depths that are more like the latter.
In the infrared, besides the H2O molecular absorption discussed above, there is little basis on which to estimate a spectral type. The only narrow absorption that is plausibly identified can be associated with the Sr II ion, discussed below as a gravity indicator. Neither hot features, which would be consistent with the early spectral type inferred above from the optical spectrum, nor cool features, such as those which would be consistent with the weak H2O absorption, are present. The lack of atomic absorption prevents us from quoting an infrared spectral type. Unlike the situation in the blue optical, the infrared spectrum of LkH 225 South does not appear to be a good match to FU Ori stars (Figure 10).
6.5.2 Gravity Indicators
LkH 225 South has strong Sr II lines. In the optical, these occur at 4077 and 4216 Å (Figure 6), and in FG stars they indicate low gravity when strong relative to the blueward Fe I 4046, 4063, and 4071 Å or redward Fe I 4271 Å lines. These optical Sr II lines are from multiplet 1. The multiplet 2 infrared Sr II lines at 10328 and 10916 Å (Figures 10, 13) are also present, and also indicative of low gravity. They are prominent in A–M supergiants, moderate in F–M giants, and weak in F–early-K dwarfs (Sharon et al., 2010).
LkH 225 South also shows Ba II lines. Figure 14 illustrates the 6142 Å line of Ba II in LkH 225 South. Both this line and the 6497 Å line (not shown) are near-ubiquitously present in FU Ori type objects, and a signature of a low-gravity atmosphere.
6.5.3 Radial Velocity
We derive a radial velocity for LkH 225 South from the first Keck/HIRES spectrum of km s-1. This is determined using telluric lines as the zero point reference, as described in Chubak et al. (2012), and the offset from zero velocity of the absorption spectrum. We note that our value is similar to the velocities quoted by Magakian et al. (2019) based on measurements of Fe I and Fe II emission lines at lower spectral resolution.
The three Keck/HIRES spectra span a nearly 6 month time period and show no detectable shift in radial velocity, with an upper limit of a few km s-1.
6.6 Spectral Changes During 2019
There are perceptible differences in absorption/emission line strength and morphology among our three Keck/HIRES spectra, taken over about 6 months. The DIBs that are present show no changes, however, giving us confidence in our findings below regarding the small photospheric and wind line differences.
Adopting a period of 43.40 days, as derived above, the three HIRES observations taken at HJD = 2458713.8, 2458816.8, and 2458851.8 span three cadences (see Figure 4). They correspond to phases of 0.43, 0.81, and 0.61, respectively, where phase 0 would be minimum light and phase 0.5 would be maximum light over the mag brightness swing. There is no obvious correlation in the limited data set between spectroscopic behavior occurring closer to phase 0.5, vs that closer to phase 0.0.
The overall trend with time, however, is that the narrow emission lines, which are mainly Fe I, became somewhat weaker. At the same time, absorption lines such as from Fe I, Fe II, and especially Ca I became stronger/deeper. There are also morphology changes in some of the wind lines, with blueshifted absorption components that increased in strength and redshifted emission components that weakened in strength and became narrower. These changes are at the 10% level in weaker lines, but 25% in strong emission/absorption features.
Although only [Ca II] was apparent in our first HIRES spectrum, other weaker forbidden lines appeared later. Specifically, weak [O I] 6300 Å and very weak [Fe II] 7155 Å are seen in our second and third HIRES spectra. In the infrared, the SPeX spectrum (Figure 10) taken between the first and second HIRES epochs shows [N I] at 10400 Å, as well as several very weak infrared [Fe I] and perhaps still the [Fe II] 1.25 and 1.644 m features. All of these forbidden lines, in addition to others, were seen in Gaia 19ajj (Hillenbrand et al., 2019b).
7 Spectral Energy Distribution Modelling
We model the 0.4-2.4 m spectral energy distribution of LkH 225 South using a Keplerian disk model. A full description of the model and procedure is given in Rodriguez & Hillenbrand (2022), but we briefly summarize here. We adopt a modified Shakura-Sunyaev temperature profile (Kenyon et al., 1988; Zhu et al., 2007), with each annulus radiating as an area-weighted spectrum given by a NextGen111111BT-NextGen (AGSS 2009) available at http://svo2.cab.inta-csic.es/theory/newov2/ atmosphere Hauschildt et al. (1999) at the appropriate temperature. The model parameters are as follows. We set the source distance as fixed at pc, following Magakian et al. (2019), effectively the same as the pc argued above based on the parallax of the nearby BD+40∘ 4124. We assume an inclination i = 45∘. This value is not well-justified, but we were motivated to choose an inclination lower than the i = 60∘ suggested by a random distribution in sin, based on the evidence presented in (e.g. Matthews et al., 2007) for an outflow orientation close to pole-on. The outer radius of the disk is fixed at 100 but varying this parameter has no affect on the overall SED at the wavelengths of interest in this study. The mass of the central star, , radius of the central star, , accretion rate , and visual extinction , however, are left as independent free parameters. We also explore joint fitting of , since that exercise produces corner plots that are less directly reflective of the prior assumptions.
The SED that we model consists of the low resolution optical (Palomar/DBSP) and infrared (IRTF/SpeX) spectra, both of which are flux calibrated. Thus, they can be taken together as an accurate spectral energy distribution for the source. As the observations were taken several months apart, the possibility of a flux offset between the optical and infrared SED needs to be considered. The date separation is only two periods (see Figure 4), with just a 5% offset in phase, and no obvious offset in flux; thus we do not include any flux adjustment when fitting the SED. We note that the observations correspond to a phase of the light curve near the minima of the 0.7 mag amplitude oscillations.
To sample the model parameter space and determine which values of the free parameters produce a model that adequately fits the data, we assume Gaussian likelihood and perform a Markov Chain Monte Carlo (MCMC) parameter estimation. We use MCMC to sample the non-analytic posterior probability distribution that is created once we develop the full accretion disk model, and have introduced physically reasonable priors for each of our given parameters. The Bayesian nature of MCMC also allows us to marginalize over all parameters except for a single one, and obtain credible intervals which constrain the value of a parameter given our model.
We use the emcee package to perform an affine-invariant MCMC routine to sample the parameter space. We explore both a uniform prior and the adoption of a Salpeter IMF for between and , a uniform prior on between and , a log-uniform prior on between and , and a uniform prior on between 3.0 and 10.0. The log-uniform prior ensures that we sample accretion rates over the many orders of magnitude that are consistent with current FU Ori outburst theories.
We run the MCMC parameter explorations with 16 chains in our affine-invariant sampling, 4 for each free parameter. We run 6000 steps and take 50 percent of the steps as the burn-in period. Furthermore, to avoid autocorrelation in our MCMC techniques, we specify steps of in the appropriate units for each parameter, in addition to our generous burn-in period. After we run our sampler, we test for convergence using the Gelman-Rubin statistic (Vats & Knudson, 2018), , and obtain the following values of for the free parameters: . The higher values of the statistic for and are to be expected, as these two parameters are strongly correlated in the corner plots, and do not converge to sharply peaked values individually. The values for and , however are below 1.1. If our MCMC iteration is to converge after infinite iterations, then should converge to 1. We thus set a reasonable standard for , that it be in the range 1.001 to 1.5 (Vats & Knudson, 2018). Adopting a standard for convergence of , then, allows us to say that the MCMC chains have converged adequately for and .
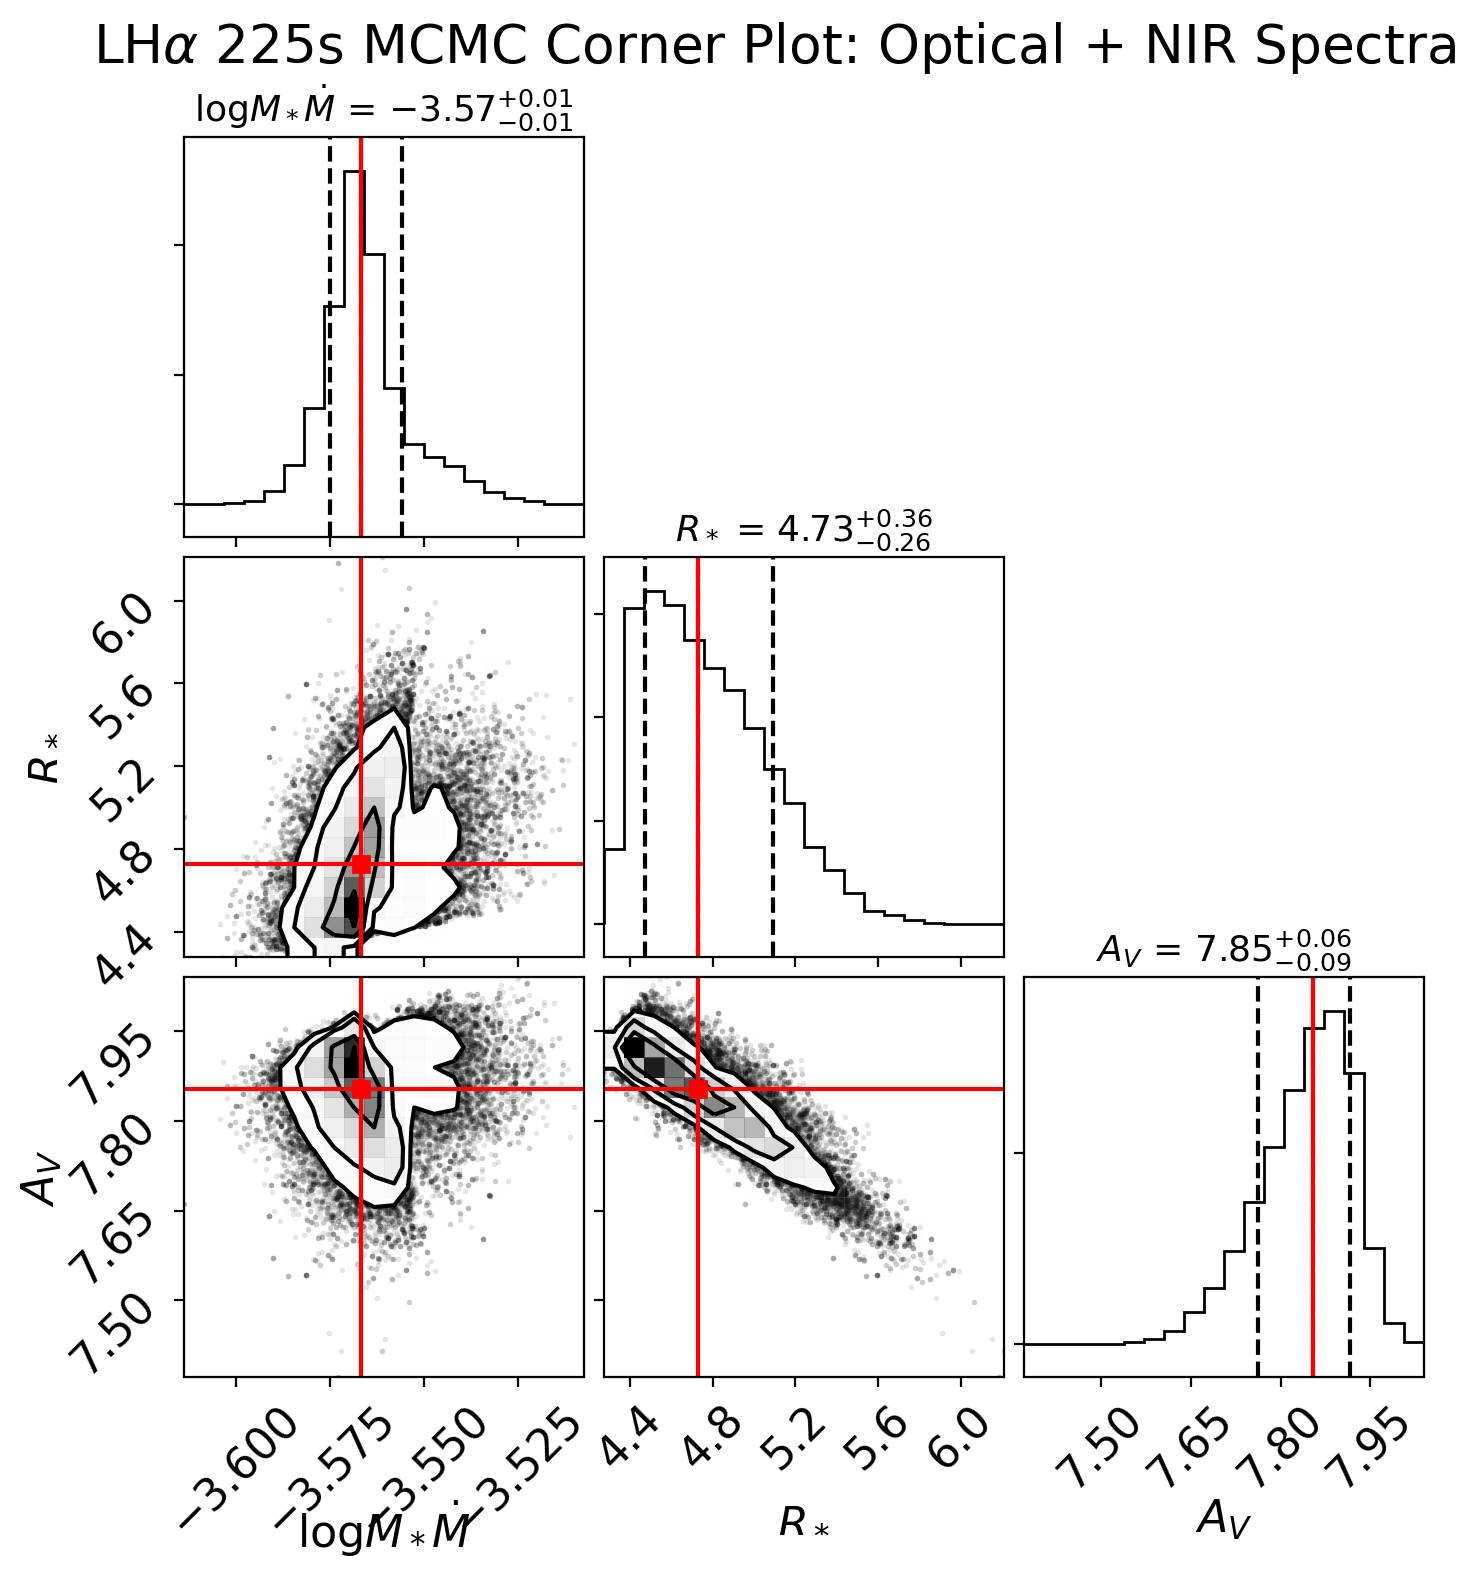
The resulting values for the four free parameters and their uncertainties are: first for the flat IMF, , , log dex , and mag; and second for the Salpeter IMF, , , log dex , and mag. The accompanying corner plots for unfortunately resemble the assumed IMF, rendering this parameter poorly constrained, though it seems clear that must be at least several and possibly as high as . There is strong anti-correlation between and as these two parameters trade off in shifting the SED peak. We further note that the likely more correct Salpeter IMF prior, produces a more poorly constrained fit. Joint fitting, however, yields a much tighter constraint in the corner plots, with log dex . This is consistent with the mean values quoted above for the individual parameters, even though their errors were much higher due to the degeneracy between them.
and each have well-constrained fits in both the four-parameter and three-parameter fitting, from which we conclude that their values are robust to assumptions about the IMF. These two parameters strongly control the overall shape of the SED. Although there is some anti-correlation between and , because modifies the shape of the SED in a different way than , their effects are decoupled by the MCMC parameter exploration, and their values are both meaningfully constrained as a result. The model prediction of an extinction value mag is consistent with our estimate based on the dereddening needed to match FGK spectral templates of 4-9 mag, and also the value of 7.2 mag found by Magakian et al. (2019). The model prediction of a moderate mass, as well as a well-constrained radius are consistent with previous indications that LkH 225 South is an intermediate-mass pre-main sequence star.
In Figure 16 we show the results from the three-parameter ( joint, , and ) fitting. The luminosity in the accretion disk model is , which compares well with the estimated by Magakian et al. (2019) from bright-state observations. This luminosity is that required from accretion to match the optical/infrared spectral energy distribution, and arises in the innermost of the disk; it does not include energy re-radiated by the substantial amount of circumstellar dust in this source. The maximum temperature in the accretion disk model is K.
8 Discussion
Our discussion is centered around three aspects of LkH 225 South: the current bright-state quasi-periodicity, the presentation of a mixed-temperature absorption spectrum, and the overall interpretation and context of this source in the panoply of young stellar object outbursts.
8.1 Interpretation of the Quasi-Periodicity Near Light Curve Peak
Periodicities in astrophysical sources usually find explanation in terms of some form of rotational, orbital, or pulsational behavior. In the case of LkH 225 South, there is no clear explanation.
The observed oscillatory behavior in LkH 225 South is non-sinusoidal but colorless. While the and magnitudes undergo mag periodic changes, the color does not vary significantly. We know that the oscillations are occurring now, and likely have been for the past years of the current brightness maximum of LkH 225 South – given that Magakian et al. (2019) also reported colorless variability, and their photometry lines up fairly well with our phased light curve; see Figure 8. However, there is no evidence that such oscillations were not occurring previously, in the data from earlier decades. One line of evidence against this is that, in contrast to the recent color-less oscillatory behavior, Herbst & Shevchenko (1999) demonstrated a color-magnitude trend in the brightness fluctuations of LkH 225 South, when it was around , and color changes in of accompanying the brightness drop of .
We can consider the observed large-amplitude periodicity of LkH 225 South relative to similar periodicities that have been detected in other young stellar objects. These seem to fall into two categories121212 Another set of accretion outburst sources with claimed low-amplitude periodicities are FU Ori, V2493 Cyg, and ASAS 13db. In these objects, the evidence for truly periodic behavior – as opposed to mere “time scales” for change – seems somewhat weak. In FU Ori, short-timescale (sub-day) variations were reported by Kenyon et al. (2000) as non-periodic “flickering” at the few percent level, and associated with the dynamical time at the inner edge of an accretion disk surrounding a central source (in analogy to cataclysmic variable and x-ray binary systems). Errico et al. (2003), Herbig et al. (2003) and Powell et al. (2012) all detected quasi-periodicities in line profiles of FU Ori, one at days associated with the wind, and one at days associated with the disk. Siwak et al. (2018) used high-precision photometry from to confirm photometric variations on approximately these same two time scales, finding quasi-periodic signals at and days. Green et al. (2013) discussed a potential quasi-periodicity for V2493 Cyg (also known as PTF 10qpf and, in the pre-outburst stage, as HBC 722 or LkH 188/G4), another FU Ori type object. Two timescales were also found for this object, 5.8 and 1.3 days. However, the phasing is not convincing, and the findings have not been independently confirmed. Finally, Sicilia-Aguilar et al. (2017) argue for a day periodicity in the outburst phases of ASAS 13db, an EX Lup type star, which they link to the rotation period of the star and attribute to the circulation of a new hot spot associated with the enhanced accretion event. Again, the phased light curves are not particularly compelling however. . One features regular fluctuations of 0.5-2 mag that are consistent over years to decades, and appear to indicate a cyclic manner of accretion from a disk on to the central star. The other manifests only after a large-amplitude brightness increase, and appears as fluctuations superposed on top of a dominant, long-term accretion outburst.
V371 Ser (Hodapp et al., 2012; Lee et al., 2020), V2492 Cyg (Covey et al., 2011; Hillenbrand et al., 2013), V347 Aur (Dahm & Hillenbrand, 2020) all exhibit long timescale (months to year) quasi-periodicities accompanied by color variations that have lasted for perhaps decades. The authors of the cited papers appeal to some sort of cycling in the inner disk, perhaps driven by an unseen companion, as explanation for the observations. In these sources, there is a seemingly regular change between low-state and high-state accretion, as evidenced by time series spectroscopy or color-magnitude behavior. These sources are distinct from EX Lup type objects, in that their brightenings are more regular, as opposed to more randomly timed, with light curve shapes that are more rounded at their peaks, as opposed to the top-hat like peaks that characterize e.g. EX Lup and V1647 Ori.
More similar to the case of LkH 225 South than the above regularly varying accretors, are sources like L1634 IRS7 and ESO -99. These have both shown brightness quasi-periodicity following a clearly detected, long-timescale, large-amplitude outburst. Hodapp, & Chini (2015) demonstrated L1634 IRS7 to have a remarkable 2 mag amplitude at -band, with a 37 day periodic signal, that is superposed on a slow rise over about 2 decades. Hodapp et al. (2019) classified ESO -99 as an EX Lup type star, but one that exhibits 0.5 mag amplitude variations on timescales of about a month, with a semi-periodic morphology. Again the behavior is superposed on a brightness plateau that followed a 4.4 mag brightening over about a year. The ESO -99 brightness oscillations are interpreted in terms of a rotating structure within the circumstellar disk, an explanation we also explore for the situation of LkH 225 South.
Like L1634 IRS7 and ESO -99, LkH 225 South has a quasi-periodic light curve morphology during its light curve plateau, and the amplitudes are also comparable at about a factor of two fluctuations. However, LkH 225 South has experienced a much larger-amplitude overall brightening (7 mag), on a significantly longer time scale (15 years). If orbital in origin, the 43 day period in LkH 225 South would correspond to changes in brightness occurring on a size scale of AU. This is still inside the outbursting disk according to our disk model (§7), in a region where the temperature of the disk is 1750 K.
The temperature range is interesting, because it corresponds to the approximate temperature where the TiO and VO molecules that we observe start to exist ( K). It is also consistent with the dust destruction temperature ( K), and thus could coincide with a region where the hot disk is cool enough to also have dust. The periodicity, if driven by orbital phenomena, may be related to turbulence or to azimuthally asymmetric phenomena occurring at this special location. However, the periodic variability we observe is in the optical ( and bands). Here, the disk is expected to be much hotter than the relevant 1750 K. Specifically, the photons dominating the flux at these wavelengths are coming from 7000-7400 K regions in our disk model. It is unclear what in this temperature range could be varying on the observed 43 day time scale.
In the simulations of Zhu et al. (2009), a gravitational instability somewhat further out in the disk causes matter to rush inward, triggering a magneto-rotational instability, which in turn triggers a thermal instability in the innermost disk. The temperature at which the magneto-rotational instability begins to take effect is 1200 K, somewhat lower than the 1750 K estimate above. Lower temperatures are possible for outburst accretion rates that are lower than the fiducial model of .
An alternate to being a special place in the disk, as argued above, is that the periodic variability near maximum brightness for LkH 225 South, is related to an orbiting companion, that affects the disk brightness quasi-periodically, on its orbital timescale. As above, given our estimate of and the inferred period, the purported companion would be located at 0.49-0.62 AU, depending on the mass ratio. The current bright state yields no evidence in photometry or radial velocities for a binary companion. However, if the period is associated with an unseen companion located within the disk instability region, that companion might be acting as a gatekeeper for accretion from the outer disk, causing the quasi-periodic modulation of the accretion by a factor of two (0.7 mag). It is unclear whether the profile of the light curve (Figure 8) is consistent with such a scenario, however.
Another possibility is some sort of slow pulsational behavior. One scenario is pulsational ringing following a planet engulfment. In order to produce a period of 43 days, however, the star would have to have swelled to 230 , which is 1.5 dex larger than the size inferred from our SED modelling, and therefore seems unlikely. Another pulsational scenario is that of acoustic mode trapping in the disk-to-star boundary layer and the inner disk, studied by Belyaev et al. (2012). Both the amplitudes and periods are much smaller (Coleman & Ravikov, in preparation) than in our case, however.
8.2 Interpretation of The Mixed Absorption Spectrum
Summarizing the inferences that can be made from the object’s spectrum, we have found evidence for a mid-A spectral type from the high-resolution optical spectrum, an FGK spectral type from the low resolution optical spectrum, and also absorption from much cooler H2O molecules in the infrared spectrum, as might characterize an M spectral type. At a minimum, we can conclude that the spectral type is mixed, or composite. We further offer the hypothesis that what we may be seeing in this source is a disk spectrum, but with a warm wind that gives rise to the hotter spectral type inferred from the optical metal lines in the high dispersion data.
We developed the disk hypothesis in more detail in §7 by fitting the optical to near-infrared SED. The stellar mass derived from the disk modelling is several and possibly as high as , which would correspond to a spectral type later than B2 on the main sequence, and temperature K. The maximum temperature in the innermost disk annulus is K in the model, which would correspond to a spectral type of A1. Rather than seeing the hottest parts of the disk directly, the spectral type we estimate from the optical high dispersion spectrum seems dominated by a component that is a bit later, A3-A6.
The seemingly disparate pieces of information above are consistent with one another in the scenario where an embedded young star has undergone an outburst, and is now presenting a disk-dominated spectrum. In addition to the evidence for a mixed or composite absorption spectrum, we have reported that the absorption lines in LkH 225 South have the narrow width of V1515 Cyg (supporting a low inclination), but the relatively shallow depth of V1057 Cyg (supporting significant disk broadening). A comparison to FU Ori itself also shows good agreement, with the exception of the lower excitation lines which are in absorption in FU Ori, but in emission in LkH 225 South.
8.3 What is this source?
LkH 225 South has brightened by 7 mag over the past two decades, seemingly without much change in its optical color, but a clear blue-ing of the near-infrared spectral energy distribution. The color changes imply that extinction clearing is not a dominant factor in the brightening. Instead, the behavior is more consistently explained by the effects of enhanced accretion, or a combination of enhanced accretion and extinction clearing.
Connelley & Reipurth (2018) state, based on the archetypal examples of FU Ori, V1057 Cyg, and V1515 Cyg, that FU Ori stars are spectroscopically defined as having (in infrared spectra): “strong CO absorption, weak metal absorption, strong water bands, low gravity, strong blueshifted He I absorption, and few (if any) emission lines”. By this definition, LkH 225 South does not qualify as an FU Ori star. Yet it does have FU Ori-like absorption in the blue optical (Figure 6, 14), though without much indication of a systematic spectral type dependence on wavelength (Figure 15). Instead, the dominant spectral class is fairly consistent across wavelengths at mid-A, though there is also reasonable correlation in some parts of the spectrum with cooler FG and early K temperatures, and in the infrared, with M-type temperatures. The source also has low gravity signatures in the form of Sr II and Ba II lines.
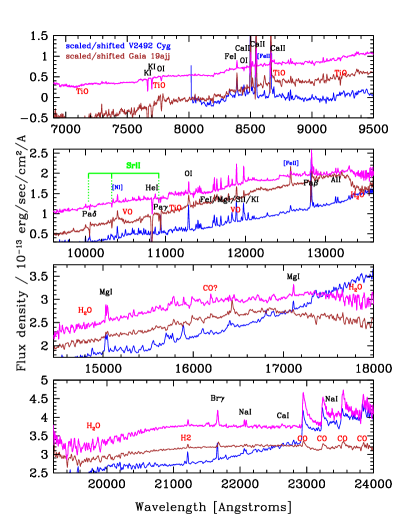
The weak emission line spectrum of LkH 225 South is similar to, but more muted than that of other outbursting young stars such as Gaia 19ajj, V2492 Cyg (PTF 10nvg), and V1647 Ori. Gaia 19ajj has only atomic emission, which is slightly stronger than what is seen in LkH 225 South. V2492 Cyg has similar atomic but also the molecular emission in TiO/VO and CO that is seen in LkH 225 South; it differs from LkH 225 South in having H2O emission, which is in absorption in LkH 225 South (as well as in Gaia 19ajj). Both V2492 Cyg (PTF 10nvg) and V1647 Ori have stronger emission lines and much less of an absorption signature than seen in the mixed-temperature spectrum of LkH 225 South.
We support the conclusion of Magakian et al. (2019) that there is a strong wind in the outburst state of LkH 225 South (Figure 11, 13). The relatively low wind velocity, only about km s-1, suggests a low to modest inclination for the source. A low inclination is also supported by the narrow absorption line widths in the optical. Further, the shape of the CO bandhead lines lacks the morphology expected (Martin, 1997) from a highly inclined source.
Overall, LkH 225 South in outburst seems a lot like Gaia 19ajj, sharing many of the properties described above. Both sources have evidence for large-amplitude optical outbursts, taking years to more than a decade to develop, and previous bright photometric states, with potential repeat timescales of one to a few decades. LkH 225 South has a stronger absorption spectrum that is more similar to that in the FU Ori stars at the bluest wavelengths. It also has TiO emission, which was not seen in Gaia 19ajj, as well as stronger CO emission. LkH 225 South has a weaker emission spectrum than Gaia 19ajj, that is present only at red optical and near-infrared wavelengths.
A further interesting aspect of LkH 225 South is its mass, which is likely in the range of several to . As such, while not massive, it certainly qualifies as an intermediate-mass young star undergoing accretion-driven outburst behavior.
9 Conclusions
We have reported on a detailed study of the spectroscopic and photometric presentation of LkH 225 South during its current bright state. Our study adds to the work of Magakian et al. (2019), who first reported the dramatic brightening of this enigmatic young stellar object. LkH 225 South was visible in the 1950’s (POSS-I plates), but not in the early 1980s (Quick-V plates). It was recorded as moderately bright in the late 1980s (Shevchenko et al., 1993), then faded by the 1990’s (POSS-II plates, Hillenbrand et al. (1995); Herbst & Shevchenko (1999)). It appears to have started brightening again in the late 2000s, reaching something of a plateau in 2015.
Our main new findings regarding LkH 225 South are:
-
•
A non-sinusoidal, colorless, quasi-periodic light curve in the bright state. While the phased light curve has significant dispersion, the oscillations have persisted for over 3 years. The derived period is days and the amplitude mag.
-
•
A currently decreasing emission spectrum and increasing absorption spectrum, based on limited spectral time series data as the outburst continues to develop in its long plateau phase.
-
•
Absorption features at blue optical wavelengths and in the near-infrared which indicate a mixed-temperature photosphere having mid-A to M-type absorption components present. The spectrum can not be characterized with a single spectral type in the traditional sense. Low-gravity is evidenced by the strength of Sr II and Ba II lines
-
•
Strong wind signatures in , He I 10830 Å, and a variety of metal lines including Ca II doublet and triplet, Fe II, Na ID, K I, Mg Ib, O I triplet, and Li I.
-
•
Atomic emission lines that are strongest in the red optical and short-wavelength infrared, dominating the spectrum at these wavelengths, but essentially absent at blue optical wavelengths.
-
•
Molecular emission from TiO and CO both before and after the brightening, with no evidence for line-to-continuum change. Molecular emission from H2 that, relative to the continuum, weakened after the brightening.
-
•
Molecular absorption by H2O that was enhanced after the brightening.
-
•
As the star brightened, a decrease in the steep spectral slope, or blue-ing behavior corresponding to a reduction in extinction by mag. We find a current extinction value of mag.
-
•
Stellar parameters of several to 8 and , and an accretion rate of log to dex result from an accretion disk model fit to flux-calibrated spectrophotometry. The corresponding luminosity in the accretion disk model is .
-
•
Evidence for a relatively low source inclination, based on (disk-broadened) absorption line widths, CO bandhead emission profiles, and P-Cygni profile terminal velocities, consistent with inferences in previous literature.
LkH 225 South deserves further study, but the current best interpretation is that the source has undergone a long-timescale accretion outburst, perhaps related to an orbiting companion at AU. Phenomenologically, the source bears some resemblance to FU Ori stars in the blue wavelengths, with a mixed-temperature pure-absorption absorption spectrum. LkH 225 South is not entirely FU Ori-like though, considering the weak low-excitation metal emission and the lack of strong molecular absorption in the near-infrared. It is like PTF 14jg in this regard, though not as hot.
The large-amplitude, very long-timescale photometric variations of LkH 225 South are like those of sources such as PV Cep, V2492 Cyg (PTF 10nvg), and Gaia 19ajj. However, while these sources share aspects of their emission-line spectra at red optical and near-infrared wavelengths (which are even stronger than in LkH 225 South), they do not have prominent absorption spectra like LkH 225 South does. The quasi-periodicity of LkH 225 South near its current light curve peak is reminiscent of the infrared sources L1634 IRS7 and ESO -99, which are also similar in exhibiting near-infrared CO emission.
IPHaS, PanSTARRS, AAVSO, Gaia, PO:1.2m(PTF), PO:1.2m(ZTF), IRSA, ASAS, PO:Hale(DBSP), Keck:I(HIRES), Keck:II(NIRSPEC), IRTF(SpeX), Gemini(NIRI)
References
- Andrillat & Swings (1976) Andrillat, Y., & Swings, J. P. 1976, ApJ, 204, L123
- Aspin et al. (1994) Aspin, C., Sandell, G., & Weintraub, D. A. 1994, A&A, 282, L25
- Bae et al. (2011) Bae, J.-H., Kim, K.-T., Youn, S.-Y., et al. 2011, ApJS, 196, 21.
- Barentsen et al. (2013) Barentsen, G., Vink, J. S., Drew, J. E., & Sale, S. E. 2013, MNRAS, 429, 1981
- Bautista et al. (2015) Bautista, M. A., Fivet, V., Ballance, C., et al. 2015, ApJ, 808, 174.
- Bellm et al. (2019) Bellm, E. C., Kulkarni, S. R., Graham, M. J., et al. 2019, PASP, 131, 018002
- Belyaev et al. (2012) Belyaev, M. A., Rafikov, R. R., & Stone, J. M. 2012, ApJ, 760, 22.
- Carvalho & Hillenbrand (2021) Carvalho, A. & Hillenbrand, L.A., 2021, AAS Journals, submitted
- Chubak et al. (2012) Chubak, C., Marcy, G., Fischer, D. A., et al. 2012, arXiv e-prints, arXiv:1207.6212
- Connelley & Reipurth (2018) Connelley, M. S., & Reipurth, B. 2018, ApJ, 861, A145
- Covey et al. (2011) Covey, K. R., Hillenbrand, L. A., Miller, A. A., et al. 2011, AJ, 141, 40
- Cutri et al. (2003) Cutri, R. M., Skrutskie, M. F., van Dyk, S., et al. 2003, “The IRSA 2MASS All-Sky Point Source Catalog, NASA/IPAC Infrared Science Archive. http://irsa.ipac.caltech.edu/applications/Gator/
- Cutri et al. (2012) Cutri, R. M., et al. 2012, VizieR Online Data Catalog, 2311 (WISE)
- Cutri et al. (2012) Cutri, R. M., Wright, E. L., Conrow, T., et al. 2012, Explanatory Supplement to the WISE All-Sky Data Release Products
- Cutri & et al. (2014) Cutri, R. M., & et al. 2014, VizieR Online Data Catalog, II/328 (AllWISE)
- Cutri et al. (2013) Cutri, R. M., Wright, E. L., Conrow, T., et al. 2013, Explanatory Supplement to the AllWISE Data Release Products, by R. M. Cutri et al.
- Cutri et al. (2015) Cutri, R. M., Mainzer, A., Conrow, T., et al. 2015, Explanatory Supplement to the NEOWISE Data Release Products, http://wise2.ipac.caltech.edu/docs/release/neowise/expsup
- Dahm & Hillenbrand (2020) Dahm, S.E. & Hillenbrand, L.A. 2020, AJ, 160, 278
- De et al. (2020) De, K., Hankins, M. J., Kasliwal, M. M., et al. 2020, PASP, 132, 025001
- Errico et al. (2003) Errico, L., Vittone, A., & Lamzin, S. A. 2003, Astronomy Letters, 29, 105
- Fitzpatrick (1999) Fitzpatrick, E. L. 1999, PASP, 111, 63.
- Flewelling et al. (2020) Flewelling, H. A., Magnier, E. A., Chambers, K. C., et al. 2020, ApJS, 251, 7.
- Gaia Collaboration et al. (2018) Gaia Collaboration, Brown, A. G. A., Vallenari, A., et al. 2018, A&A, 616, A1
- Graham et al. (2019) Graham, M. J., Kulkarni, S. R., Bellm, E. C., et al. 2019, PASP, 131, 078001
- Green et al. (2013) Green, J. D., Robertson, P., Baek, G., et al. 2013, ApJ, 764, 22
- Gutermuth et al. (2009) Gutermuth, R. A., Megeath, S. T., Myers, P. C., et al. 2009, ApJS, 184, 18
- Hankins et al. (2020) Hankins, M., Hillenbrand, L. A., De, K., et al. 2020, The Astronomer’s Telegram, 13902
- Hauschildt et al. (1999) Hauschildt, P. H., Allard, F., Ferguson, J., et al. 1999, ApJ, 525, 871.
- Heinze et al. (2018) Heinze, A. N., Tonry, J. L., Denneau, L., et al. 2018, AJ, 156, 241.
- Herbig (1960) Herbig, G. H. 1960, ApJS, 4, 337
- Herbig et al. (2003) Herbig, G. H., Petrov, P. P., & Duemmler, R. 2003, ApJ, 595, 384
- Herbst & Shevchenko (1999) Herbst, W., & Shevchenko, V. S. 1999, AJ, 118, 1043
- Herczeg & Hillenbrand (2014) Herczeg, G. J., & Hillenbrand, L. A. 2014, ApJ, 786, 97
- Hillenbrand et al. (2019c) Hillenbrand, L. A., The Astronomer’s Telegram, 13321, 1
- Hillenbrand et al. (1995) Hillenbrand, L. A., Meyer, M. R., Strom, S. E., et al. 1995, AJ, 109, 280
- Hillenbrand et al. (2012) Hillenbrand, L. A., Knapp, G. R., Padgett, D. L., et al. 2012, AJ, 143, 37
- Hillenbrand et al. (2013) Hillenbrand, L. A., Miller, A. A., Covey, K. R., et al. 2013, AJ, 145, 59
- Hillenbrand et al. (2018) Hillenbrand, L. A., Contreras Peña, C., Morrell, S., et al. 2018, ApJ, 869, 146
- Hillenbrand et al. (2019b) Hillenbrand, L. A., Reipurth, B., Connelley, M., et al. 2019, AJ, 158, 240
- Hillenbrand et al. (2019a) Hillenbrand, L. A., Miller, A. A., Carpenter, J. M., et al. 2019, ApJ, 874, 82
- Hodapp et al. (1996) Hodapp, K.W., ApJ, 468, 861.
- Hodapp et al. (2012) Hodapp, K. W., Chini, R., Watermann, R., & Lemke, R. 2012, ApJ, 744, 56
- Hodapp, & Chini (2015) Hodapp, K. W., & Chini, R. 2015, ApJ, 813, 107
- Hodapp et al. (2019) Hodapp, K. W., Reipurth, B., Pettersson, B., et al. 2019, AJ, 158, 241
- Howard et al. (2010) Howard, A. W., Johnson, J. A., Marcy, G. W., et al. 2010, ApJ, 721, 1467
- Ibragimov et al. (1988) Ibragimov, M. A., Mel’Nikov, S. Y., Chernyshov, A. V., et al. 1988, Astrofizika, 29, 633
- Jordi et al. (2006) Jordi, K., Grebel, E. K., & Ammon, K. 2006 A&A, 460, 339
- Kenyon et al. (1988) Kenyon, S. J., Hartmann, L., & Hewett, R. 1988, ApJ, 325, 231
- Kenyon et al. (2000) Kenyon, S. J., Kolotilov, E. A., Ibragimov, M. A., et al. 2000, ApJ, 531, 1028
- Lee et al. (2020) Lee, S., Lee, J.-E., Aikawa, Y., Herczeg, G., & Johnstone, D. 2020, ApJ, 889, 20
- Looney et al. (2006) Looney, L. W., Wang, S., Hamidouche, M., et al. 2006, ApJ, 642, 330
- Magakian & Movsessian (1997) Magakian, T. Y. & Movsessian, T. A. 1997, Astronomy Letters, 23, 666
- Magakian et al. (2019) Magakian, T. Y., Movsessian, T. A., Andreasyan, H. R., et al. 2019, A&A, 625, A13
- Maksimova et al. (2020) Maksimova, L. A., Pavlyuchenkov, Y. N., & Tutukov, A. V. 2020, Astronomy Reports, 64, 815.
- Martin (1997) Martin, S. C. 1997, ApJ, 478, L33.
- Martin et al. (2018) Martin, E. C., Fitzgerald, M. P., McLean, I. S., et al. 2018, Ground-based and Airborne Instrumentation for Astronomy VII, Proc. SPIE, 10702, 107020A
- Marvel (2005) Marvel, K. B. 2005, AJ, 130, 2732
- Masci et al. (2019) Masci, F. J., Laher, R. R., Rusholme, B., et al. 2019, PASP, 131, 018003
- Matthews et al. (2007) Matthews, B. C., Graham, J. R., Perrin, M. D., et al. 2007, ApJ, 671, 483
- McLean et al. (1998) McLean, I.S., Becklin, E.E., Bendiksen, O., et al. 1998, Proc. SPIE, 3354, 566
- Miller et al. (2015) Miller, A. A., Hillenbrand, L. A., Bilgi, P., et al. 2015, The Astronomer’s Telegram, 7428
- Mora et al. (2001) Mora, A., Merín, B., Solano, E., et al. 2001, A&A, 378, 116
- Navarete et al. (2015) Navarete, F., Damineli, A., Barbosa, C. L., et al. 2015, MNRAS, 450, 4364.
- Oke et al. (1995) Oke, J. B., Cohen, J. G., Carr, M., et al. 1995, PASP, 107, 375
- Oke & Gunn (1982) Oke, J. B., & Gunn, J. E. 1982, PASP, 94, 586
- Palla et al. (1995) Palla, F., Testi, L., Hunter, T. R., et al. 1995, A&A, 293, 521
- Pecchioli et al. (2016) Pecchioli, T., Sanna, N., Massi, F., et al. 2016, PASP, 128, 073001.
- Petrov & Herbig (2008) Petrov, P. P., & Herbig, G. H. 2008, AJ, 136, 676
- Powell et al. (2012) Powell, S. L., Irwin, M., Bouvier, J., et al. 2012, MNRAS, 426, 3315
- Prugniel et al. (2007) Prugniel, P., Soubiran, C., Koleva, M., et al. 2007, arXiv e-prints, astro-ph/0703658
- Purser et al. (2021) Purser, S. J. D., Lumsden, S. L., Hoare, M. G., et al. 2021, MNRAS, 504, 338.
- Rayner et al. (2003) Rayner, J. T., Toomey, D. W., Onaka, P. M., et al. 2003, PASP, 115, 362
- Rodriguez & Hillenbrand (2022) Rodriguez, A. C. & Hillenbrand, L. A. 2022, arXiv:2112.01549
- Sandell et al. (2012) Sandell, G., Wiesemeyer, H., Requena-Torres, M. A., et al. 2012, A&A, 542, L14.
- Shappee et al. (2014) Shappee, B., Prieto, J., Stanek, K. Z., et al. 2014, in American Astronomical Society Meeting Abstracts, Vol. 223, American Astronomical Society Meeting Abstracts #223, 236.03
- Sharon et al. (2010) Sharon, C., Hillenbrand, L., Fischer, W., & Edwards, S. 2010, AJ, 139, 646
- Shevchenko et al. (1993) Shevchenko, V. S., Grankin, K. N., Ibragimov, M. A., et al. 1993, Ap&SS, 202, 121
- Sicilia-Aguilar et al. (2017) Sicilia-Aguilar, A., Oprandi, A., Froebrich, D., et al. 2017, A&A, 607, A127
- Siwak et al. (2018) Siwak, M., Winiarski, M., Ogłoza, W., et al. 2018, A&A, 618, A79
- Strom et al. (1972) Strom, K. M., Strom, S. E., Breger, M., et al. 1972, ApJ, 173, L65
- Terranegra et al. (1994) Terranegra, L., Chavarria-K., C., Diaz, S., et al. 1994, A&AS, 104, 557
- van den Ancker et al. (2000) van den Ancker, M. E., Wesselius, P. R., & Tielens, A. G. G. M. 2000, A&A, 355, 194
- VanderPlas (2018) VanderPlas, J. T. 2018, ApJS, 236, 16
- Vats & Knudson (2018) Vats, D., & Knudson, C. 2018, arXiv e-prints, arXiv:1812.09384
- Vogt et al. (1994) Vogt, S. S., Allen, S. L., Bigelow, B. C., et al. 1994, Proc. SPIE, 2198, 362
- Wenzel (1972) Wenzel, W. 1972, Information Bulletin on Variable Stars, 713, 1
- Zhu et al. (2007) Zhu, Z., Hartmann, L., Calvet, N., et al. 2007, ApJ, 669, 483
- Zhu et al. (2009) Zhu, Z., Hartmann, L., Gammie, C., & McKinney, J. C. 2009, ApJ, 701, 620
- Zhu et al. (2020) Zhu, Z., Jiang, Y.-F., & Stone, J. M. 2020, MNRAS, 495, 3494