Onset of criticality in hyper-auxetic polymer networks
Against common sense, auxetic materials expand or contract perpendicularly when stretched or compressed, respectively, by uniaxial strain, being characterized by a negative Poisson’s ratio . The amount of deformation in response to the applied force can be at most equal to the imposed one, so that is the lowest bound for the mechanical stability of solids, a condition here defined as “hyper-auxeticity”. In this work, we numerically show that ultra-low-crosslinked polymer networks under tension display hyper-auxetic behavior at a finite crosslinker concentration. At this point, the nearby mechanical instability triggers the onset of a critical-like transition between two states of different densities. This phenomenon displays similar features as well as important differences with respect to gas-liquid phase separation. Since our model is able to faithfully describe real-world hydrogels, the present results can be readily tested in laboratory experiments, paving the way to explore this unconventional phase behavior.
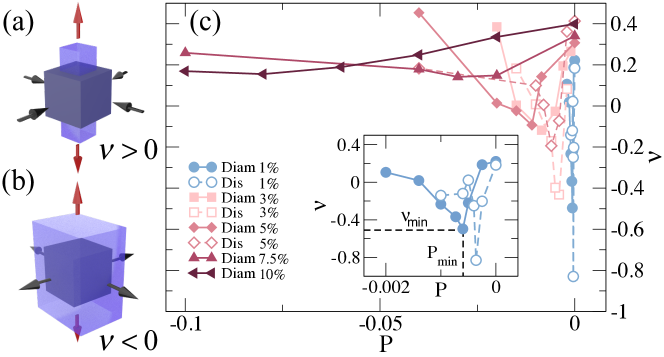
The mechanical response of a material subjected to uniaxial strain in the direction orthogonal to the deformation is quantified via the Poisson’s ratio , defined as the negative ratio between transverse and longitudinal deformation. For the most common three-dimensional materials is positive, so that these expand (contract) in response to a compressive (extensional) strain. This situation is schematically illustrated in Fig. 1(a). On the contrary, auxetic materials are characterized by negative values of , meaning that they become thicker perpendicularly to the deformation axis, as shown in Fig. 1(b). Auxetic behaviour has been so far reported in a large variety of systems, including foams, polymers, fibers, tendons and crystals Lakes1987 ; Evans1989 ; evans1991molecular ; Gatt2015 ; Hu2017 ; Rysaeva2018 ; greaves2011poisson . Recently, a strong research interest has been devoted towards auxetic metamaterials in which the elastic properties can be tailored by geometrical design Larsen1997 ; Theocaris1997 ; Hanifpour2018 or by pruning methods Reid2018 . Besides geometrical reasons, a negative can also be obtained by exploiting critical behavior and phase transitions, as in the case of ferroelastic materials in the vicinity of the Curie point Dong2010 ; Kou2016 .
Within linear elasticity theory landau1970theory , the appearance of a negative can be related to a decrease of the bulk modulus with respect to the shear modulus , namely to an isotropic softening of the material. A vanishing echoes the divergence of the isothermal compressibility occurring at a gas-liquid critical point. However, the presence of a finite shear modulus, as found in polymer networks, such as hydrogels, may induce a negative . Pioneering evidence of a negative Poisson’s ratio has been reported for these systems close to the so-called Volume Phase Transition Hirotsu1991 ; Li1993 ; Hirotsu1994 : in this case, a variation in temperature changes the affinity of the polymer to the solvent, favoring monomer-monomer aggregation, in full analogy with the gas-liquid critical point, but with the additional constraint of network connectivity. Another thermodynamic parameter that influences the network properties without affecting monomeric interactions is pressure, or tension. Indeed, theoretical works have addressed the occurrence of auxeticity in two-dimensional models of networks under tension Wojciechowski1989 ; Boal1993 .
It is important to notice that these studies have flourished about twenty years ago, but the interest in hydrogel and microgel networks has increased again in the last few years, thanks to advances in chemical and in silico synthesis. In particular, it became recently possible to tune the amount of branching points (crosslinkers) to yield ultra-low-crosslinked networks Bachman2015 ; Virtanen2016 ; Scotti2019 ; Scotti2019b . In parallel, numerical efforts have been able to realize fully-connected, disordered networks with arbitrary density and crosslinker concentrations Gnan2017 ; sorichetti2021effect .
In this article, we numerically investigate the elastic properties of polymer networks under tension and demonstrate that auxeticity naturally emerges in the ultra-low-crosslinked limit. Combining stress-strain and equilibrium simulations, we show that low-density polymeric networks exhibit a nonmonotonic behavior of as well as , the latter becoming increasingly negative with reducing crosslinker concentration . This phenomenology is found for both ordered diamond-like and disordered hydrogel realizations, indicating that there is no need of a specific topology to observe auxeticity in polymer networks. Remarkably, we do not find that this behavior continuously evolves down to . Rather, it hits a mechanical critical point, that we name hyper-auxetic point, at a finite where . Owing to the fact that and would become negative, this value denotes the lowest limit of mechanical stability, even though this condition is not yet fully understood Shan07 ; greaves2011poisson ; Nicolaou2012 . At this point, we detect the onset of a coexistence between two different states: a low density and a high density one. These results call for an analogy with the well-known gas-liquid phase transition in attractive fluids, but with two important differences: (i) the lack of attraction between the monomers due to the good solvent conditions of the polymer networks and (ii) the presence of critical-like density fluctuations, which do not seem to obey Ising-like statistics within the present numerical resolution.
Results
Auxetic behavior of ordered and disordered hydrogels. We start by calculating the elastic properties of diamond networks (Diam) for different values of the crosslinker concentration for negative pressures starting from . Although the diamond network is a simplified model rovigatti2019numerical , it can still describe some relevant phenomena in experiments at a qualitative level Keidel2018 ; Alvarez2019 . For each studied state point, we independently evaluate three moduli: the bulk modulus is obtained from equilibrium NPT runs, whereas the Young modulus and the Poisson’s ratio are estimated from strain-stress simulations, as described in the Methods section. We report in Fig. 1(c) for hydrogels with different , while the corresponding and are shown in Fig. S1 of the Supplementary Information. All moduli display a similar behavior: they initially decrease, then reach a minimum at intermediate values of pressures, and finally, increase again for very negative . The minima become more and more pronounced for lower and lower , remaining visible at all for and , while disappearing for when . Remarkably, we find that the different networks display a positive value of both for and for very large negative pressures, while auxetic behavior is observed for in a finite range of tensions, that become smaller and closer to zero pressure as decreases. We denote the minimum value reached by as and its corresponding pressure as (see inset of Fig. 1).
So far we exclusively discussed ordered networks. However, in real-world realizations, hydrogels are intrinsically disordered and frequently made of chains whose length is exponentially distributed higgs1988polydisperse ; grest1990statistical . Being able to prepare hydrogels with these features, as described in Methods, we find that disordered networks (Dis) show the same phenomenology as ordered ones when subjected to tensions, with auxeticity also emerging for (see Fig. 1). Interestingly, we observe lower values of for disordered hydrogels with respect to ordered ones at the same crosslinker concentration, as shown in the inset of Fig. 1. In particular, we find for the Dis- network. We ascribe this effect to the higher structural heterogeneity characterizing disordered systems, independently of the specific network topology. Indeed, the same qualitative phenomenology is observed for all examined independent realizations (see Fig. S2). Since the preparation procedure is based on the self-assembly of patchy particles Gnan2017 ; sorichetti2021effect , we cannot easily obtain disordered networks with smaller values of , due to the nearby occurrence of phase separation. Thus, for lower degree of crosslinking, we focus only on diamond networks, having shown in Fig. 1 that there is no major qualitative effect of the underlying topology on auxeticity, in line with previous results for ordered or partially ordered topologies Larsen1997 ; Theocaris1997 ; Hanifpour2018 ; Reid2018 .
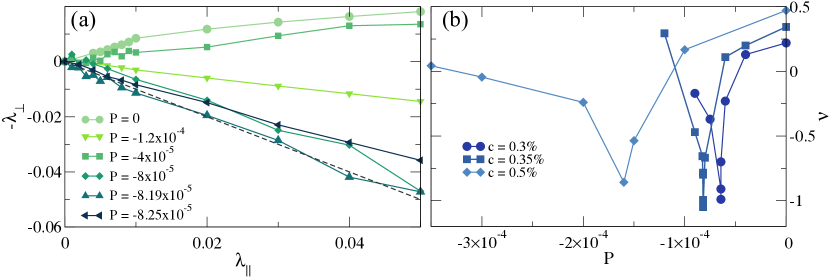
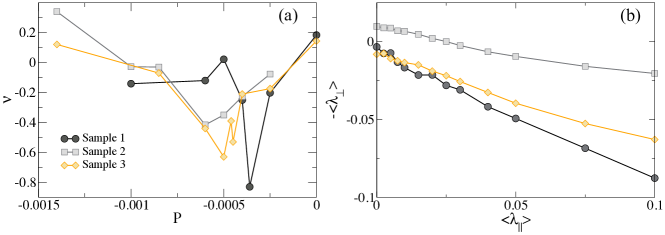
Hyper-auxeticity and mechanical instability. By further decreasing for Diam-N we still observe a progressive decrease of . To have a better understanding of the mechanical behaviour of the system, we report in Fig. 2(a) the negative transverse vs the longitudinal strain (see Methods for definition) for at different values of pressure. We clearly see that, for , the slope, that is precisely our numerical estimate of , is positive. Then, by progressively reducing , becomes negative, down to within numerical uncertainty. At this point, the system has reached the limit of mechanical stability, so that state points with are not allowed. We therefore consider as the critical fraction of crosslinker at which a mechanical critical point is encountered and define state points with as hyper-auxetic. Interestingly, we find that, upon further increasing tension, the slope starts to increase again, as shown in Fig. 2(a). The behavior of vs is reported for three ultra-low values of respectively above, at and below in Fig. 2(b). These findings indicate that the system reaches a hyper-auxetic condition also for . This phenomenology thus occurs for ultra-low-crosslinked networks in general, with the system reaching at a small, finite negative pressure.

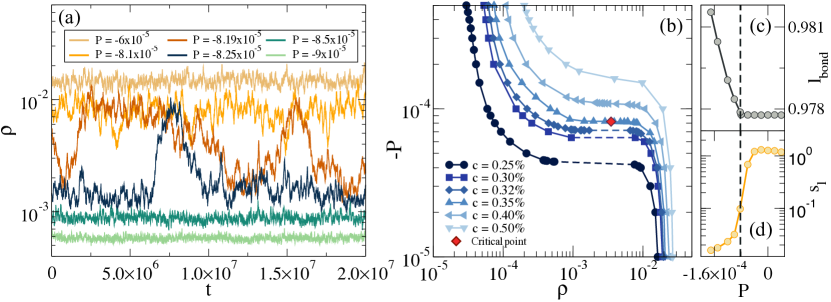
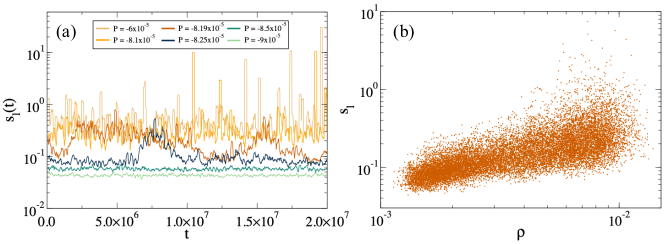
Critical-like nature of the transition. The behaviour discussed so far close to hyper-auxeticity may echo what happens close to a thermodynamic second-order phase transition, such as the gas-liquid one, where a homogeneous system becomes thermodynamically unstable due to the divergence of the isothermal compressibility. To avoid this, the system thus separates into two phases characterized by a different density. It is now interesting to investigate by which mechanism ultra-low-crosslinked hydrogels deal with the presence of the mechanical instability and which similarities or differences with respect to the gas-liquid scenario occur. To this aim, we report the behavior of the density fluctuations with respect to time for the Diam - 0.35% system at in Fig. 3(a), detecting the onset of critical-like fluctuations. It is evident that, close to the mechanical instability, the system fluctuates between two states, an expanded and a compressed one, respectively illustrated in the corresponding snapshots of Fig. 3(b,c). We thus separately calculate the elastic moduli of the two states and find that the bulk modulus is much smaller in the expanded case () as compared to the compressed one (). A similar behavior was also detected for the Young modulus with the compressed state having it significantly larger than the expanded one. However, the Poisson’s ratio does not change so much, being for the expanded state and for the compressed one, as shown in Fig. S3. These data also confirm the absence of relevant anisotropic effect or preferential directions within our system and suggest that a hyper-auxetic behavior is found in both states. Hence, the mechanism of a density jump is the one allowing the system to avoid the mechanical instability in full analogy with gas-liquid phase separation.
Such an analogy is clearly evident when looking at the density fluctuations as a function of time for different pressures around for the Diam - 0.35% network, that are shown in Fig. 4(a). We now examine what happens as a function of and plot the behavior of the (negative) pressure against density in Fig. 4(b) for all studied diamond networks. It is important to note that, in the present model, the crosslinker concentration plays the role of temperature in phase-separating fluids: as becomes smaller, becomes progressively flatter and a critical-like point is observed for these putative equation of states, indicated by a red diamond in the figure, which depend on a geometric rather than a thermodynamic control variable. For , a clear discontinuity in density is observed, signaling a first-order-like transition between the two states. To get better microscopic insights of this behavior, we report the average bond length as a function of in Fig. 4(c). From a geometrical perspective, lowering the pressure towards more negative values has the effect of stretching the chains, as demonstrated by the growth of . However, it is important to note that this behavior arises only when , i.e. when starts to increase again beyond its minimum value. Since it is well-known that entropy plays a fundamental role for phase behaviour of polymer systems rubinstein2003polymer , we also quantify the effect of entropy by calculating the average single-chain entropy within a Langevin-approximation (see Methods and Ref. sorichetti2021effect ). Relying on this controlled approximation, we detect a decrease of by roughly one order of magnitude going from the compressed to the expanded state, as shown in Figs. 4(d). The entropy further shows critical-like fluctuations close to , as shown in Fig. S4.
On the other hand, when we monitor the average total potential energy , we find no remarkable change with pressure and, importantly, no critical fluctuations, as shown in Fig. S5(a). We thus focus on the non-bonded potential energy , pertinent only to non-bonded particles, shown in Fig. S5(b), which instead manifests critical-like fluctuations. This correspondence is confirmed by the scatter plots, reported in Fig. S5(c) and (d), of total energy and non-bonded energy with density, respectively. Clearly, correlation is completely absent between and , while is correlated with density, similarly to the single chain entropy as discussed in the SI.
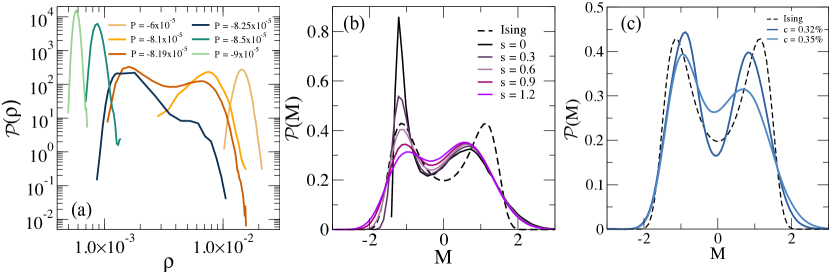
Density distributions and comparison with Ising statistics. We now examine in more detail the nature of the density fluctuations and report the distribution of the density in Fig. 5(a) for different negative pressures close to the onset of the mechanical instability for the Diam - 0.35% network. We notice that, close to the transition, the system displays a bimodal distribution, that is highly asymmetric. This is even more evident from the fact that data are reported on a log-log scale to improve visualization. In particular, we find the presence of a broad high-density peak and a narrow low-density one peak for low ones. Aiming to build a correspondence with thermodynamic phase separation, we next calculate the order parameter , equivalent to the one used to describe the gas-liquid transition, that is composed by density and energy fluctuations Wilding1992 ; Sciortino2020 . Since we found that for the present system the total potential energy is not correlated with density, we define , where we only consider the non-bonded potential energy and is a mixing parameter Wilding1992 . In Fig. 5(b), we plot the distribution of the order parameter with zero average and unit variance for and different values of . We find that the presence of the mixing term is able to reduce the asymmetry of the original , but still not completely. In particular, the heights of the two peaks become comparable for , but the difference in their variance is retained at all studied .
In order to compare with the expected 3D Ising universal distribution, we apply the single histogram reweighting technique, as discussed in the Methods. This is shown in Fig. 5(c) for state points close to the mechanical instability at two different values of . The resulting for ultra-low-crosslinked hydrogels are characterized by a slightly asymmetric shape, not perfectly centered in zero with rather broad peaks. We thus find a qualitative disagreement with the Ising behavior, independently of , that might be due either to an intrinsic difference of the network system with respect to associating molecules or to insufficient sampling. Assuming true the first case, we may speculate that the presence of the network connectivity may bias the way in which the density fluctuates as compared to unbound particles. Alternatively, the deviation may be attributed to the fact that, in the present simulations, cannot be varied in a continuous way, as normally done with temperature close to the gas-liquid critical point, thus hindering a proper exploration of the critical properties of the transition. However, we note that we found deviations from the Ising expectations for all examined values, moving either below or above , finding no systematic improvement. Future work will be needed to properly address this issue.
Discussion
The present results, obtained by means of extensive simulations to calculate the elastic properties of ultra-low crosslinked polymer networks at negative pressures, report the emergence of auxetic behavior for independently of the specific geometry of the network. It is important to note that, when we started our investigations at not-too-small values of and detected the onset of auxeticity, we expected to find a continuous behavior of the system until approaching the limit of stability () at . This was indeed suggested by looking at the -dependence of and , that is reported in Fig. S6: while decreases logarithmically, is found to obey a quadratic power-law behavior for all examined networks which spans a range of more than three decades in . Instead, surprisingly, we found that the limit of the mechanical stability of the system, and the associated hyper-auxetic behavior (), occurs at a finite crosslinker concentration, , even for a regular network such as the diamond one. Hence, for even smaller values of , the network, being unstable, undergoes a transition between two states, a compressed and an expanded one. Such a transition is also accompanied by large density fluctuations reminiscent of critical ones in gas-liquid phase separation, as shown in Fig. 4(a).
We then examined in more detail the nature of this phase transition, that is clearly distinct from the widely investigated Volume Phase Transition (VPT) of thermoresponsive hydrogels. Indeed, the latter occurs due to the change of the underlying polymer-solvent interactions at a characteristic temperatures. Previous studies on the VPT of hydrogels have already focused on the associated critical properties, that were tentatively attributed to the Ising university class Li1989 ; Onuki1993 ; Seiffert2014 . Instead, the present work focuses on networks in good solvent conditions, where the monomer affinity to the solvent does not change and the underlying interactions are always dominated by excluded volume. Thus, the phase transition observed in the present work is the consequence of changing the network connectivity down to very low , which generates a non-trivial interplay with steric interactions under a small tension. To this aim, it is instructive to focus on the values of the pressure at which reaches its minimum for , i.e., , while the system volume fluctuates around . This implies that the product is roughly comparable to the scale of the non-bonded particle energy and about orders of magnitude smaller than the total energy scale of the system (see Fig. S5), where is the total number of monomers in our simulations. These considerations confirm that the present phase transition is dominated by fluctuations of non-bonded energy and of entropy, with a negligible contribution of the total energy. The important role of (infinite) connectivity and the different interactions with respect to a standard attractive system (e.g. a Lennard-Jones fluid) may thus be the reasons why the critical-like fluctuations of the present ultra-low-crosslinked hydrogels are not found to obey Ising universality class. Further numerical and theoretical work on this issue will be needed in the future. While the former should aim, in particular, to probe the critical fluctuations in a more extensive time and length window as well as to vary in a more continuous fashion (e.g. by developing appropriate crosslinker insertion/deletion methods), the latter should be devoted to provide an additional description of the mechanical instability, taking into account the connectivity, similarly to what discussed for the Volume Phase Transition Fernandez2019 .
Finally, it is important to note that these observations are relevant for ultra-low-crosslinked polymer networks, that are nowadays within experimental reach Gao2003 ; Bachman2015 ; scotti2020flow . Indeed, for example, Poly(N-isopropylacrylamide) (PNIPAm) microgels are synthesized even in the absence of crosslinkers, taking advantage of (rare) self-association of NIPAM monomers, which gives rise to an effective in the system that is close to zero Bachman2015 ; virtanen2016persulfate . It should thus not be difficult to realize this also for hydrogels. Given that experimental realizations are necessarily disordered, our numerical predictions suggest that disordered networks should display a slightly larger value of , not too far from 1% (see Fig. 1), with respect to the diamond case, which would actually favour the experimental observation of this mechanical critical point and a through exploration of its vicinity both from above and from below . Notably, our results are based on hydrogel simulations, but it would be interesting to apply our analysis also to ultra-low-crosslinked microgels. In this respect, the microfluidic approach to microgels synthesis appears to be particularly promising, because it allows to prepare microgels of sizes of the order of m Seiffert2012 ; Voudouris2013 . Furthermore, a specific method to calculate their elastic properties, known as capillary micromechanics, was already established, making these ideal model systems to test our numerical predictions. We thus hope that the present results will stimulate novel experimental activity on ultra-low-crosslinked polymeric materials, aiming to verify their peculiar hyper-auxetic behavior and the occurrence of such an unusual phase transition, where mechanical and thermodynamic instabilities appear to be strongly intertwined, opening up a new research direction in statistical and soft matter physics.
Methods
Model. We perform Molecular Dynamics simulations of polymer networks made of monomers interacting via the Kremer-Grest potential. Excluded volume for all particles are given by the Weeks-Chandler-Andersen potential: weeks1971role
| (1) |
where is the monomer diameter, which sets the unit of length, and controls the energy scale. Defining as the mass of the particles, the unit time of our simulations is defined as . Chemical bonds between connected monomers are modeled by a FENE potential kremer1990dynamics :
| (2) |
where is the spring constant and is the maximum extension of the bond. We consider both ordered (diamond-like) and disordered topologies. In the former case, we prepare systems made up of unit cells, each containing crosslinkers, that are placed on the lattice atom positions and are connected through chains of equal length claudio2009comparison ; jha2011study . For each crosslinker concentration , the network is composed of monomers forming chains of equal length , thus by varying we change in a controlled way. To produce disordered networks, we use the method recently developed in Ref. Gnan2017 ; Ninarello2019 , which exploits the self-assembly of binary mixtures of patchy particles with valence (monomers) and (crosslinkers). We let the system equilibrate at low enough temperature () through the oxDNA simulation package oxDNA until 99.9% of the bonds are formed by exploiting a recently devised swap algorithm Sciortino2017 . Then, we select the largest cluster from which we remove dangling ends and replace patchy interactions with the bead-spring ones (Eqs. 1 and 2). We obtain systems with final crosslinker concentrations with deviation from the nominal values smaller than . For we consider three independent network realizations to assess the dependence of results on the specific topology.
For both ordered and disordered networks we perform NPT simulations using LAMMPS simulation package plimpton1995fast with a Nosé - Hoover thermostat and barostat. Temperature is set to 1.0 throughout the manuscript and is measured in units of energy, i.e. fixing also , where is the Boltzmann constant. We thus perform simulations at different (negative) pressures employing a timestep .
Calculation of elastic moduli. We perform two kinds of simulations: (i) via equilibrium simulations in which the box is allowed to fluctuate anisotropically we calculate the bulk modulus from volume fluctuations as ; (ii) via stress-strain simulations we simultaneously calculate and . In particular, we first apply a longitudinal extensional strain , where and are the initial and final box lengths along the deformation axis, respectively. The range of deformation values encompasses , at which the response is in the linear regime, and we use a fixed strain rate . The box is allowed to fluctuate transversally to the deformation in order to guarantee a constant average . Then, once the system acquires the desired strain, the stress along the deformation axis is calculated from the virial stress tensor and averaged over , yielding . The Poisson’s ratio is instead extracted from transversal fluctuations through the relation , where and , are the components of the strain orthogonal to the deformation axis. For each network and each state point, results for and are averaged over 20 independent deformations in which the same configuration is deformed with different initial velocities taken from the Maxwell-Boltzmann distribution. This procedure is repeated for each configuration by deforming the network over all three directions independently, which are then averaged in order to improve the statistics of the results. Results for and are given in units of .
Langevin approximation for single chain entropy. In general, the entropy of a chain with bonds of length can be written as flory1976statistical
| (3) |
where is the end-to-end vector of the chain, is the end-to-end probability density and is a temperature-dependent parameter that can be set to zero. In the limit of systems that are submitted to a very large deformation or in a dilute regime, i.e., for , the end-to-end probability reads as treloar1975physics
| (4) |
where and is the inverse Langevin function, defined as jedynak2015approximation . Thus, the entropy of a single chain can be expressed as:
| (5) |
where, in our case, is the minimum value of the FENE interaction potential. We use this equation to calculate the single chain entropy of each chain in the network and then average over all chains to obtain the average chain entropy that is reported in Fig. 4(d) and in the SI.
Ising Universality class. A universality class groups phenomena arising in different physical systems, that, although being described by diverse microscopic models, exhibit an asymptotic large-scale limit that is characterized by the same invariant critical exponents binney1992theory . In particular, the universality class defined by the three-dimensional Ising model describes the phenomenology of second-order phase transitions as diverse as the ferromagnetic Curie point or the gas-liquid criticality. We thus attempt to compare the critical behavior of ultra-low-crosslinked networks to the expected behavior of a system belonging to the 3D Ising universality class, relying on the asymptotic expression of the probability distribution of the order parameter that can be conveniently approximated as tsypin2000probability :
| (6) |
where , , and is adjusted to provide unit variance to the distribution.
Histogram reweighting technique. We employ histogram reweighting in order to better identify the putative critical point of our phase transition, since this technique provides a powerful tool to reconstruct the probability distribution of a given observable at a state point from equilibrium distributions of close enough state points, as long as thermodynamical control variables vary continuously. This is not the case for our system, for which assumes discrete values in the ordered system and cannot be finely controlled in the disordered system, as a result of the self-assembly procedure of the network. We are thus forced to perform histogram reweighting only in and, to this aim, we perform numerous, long-time simulations at each around . During the simulations, we record the behavior of the density and of the non-bonded particle energy as a function of time. Then, our single histogram reweighting method, reported in Fig. 5(c), relies on the following expression:
| (7) |
Thus, for each , we calculate the histogram reweighting factor . We use this expression to obtain the distribution of the order parameter , as discussed in the main text. This is calculated for all the values of and in by varying the mixing parameter . The set of values is then rescaled to have a zero mean and a unit variance and compiled into the histogram . This last is finally scaled onto the Ising curve for each given by minimizing the mean squared error between the two distribution by varying .
Acknowledgements
We thank F. Goio Castro, L. Rovigatti and F. Sciortino for useful discussions. We acknowledge support from the European Research Council (ERC Consolidator Grant 681597, MIMIC), from the European Union’s Horizon 2020 research and innovation programme (Grant 731019, EUSMI) and from Sapienza University of Rome through the SAPIExcellence program. The authors gratefully acknowledge the computing time granted by EUSMI on the supercomputer JURECA at the Jülich Supercomputing Centre (JSC).
Supplementary materials
SI Elastic moduli at ultra-low crosslinking: Comparison with linear elasticity theory
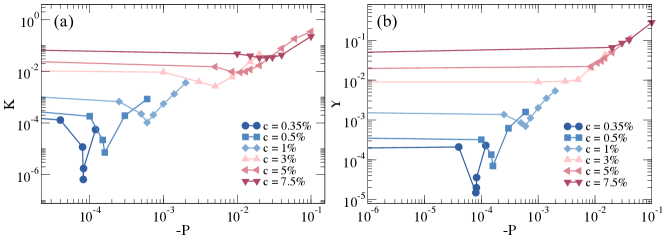
In Fig. S1 we report the bulk and Young moduli as a function of pressure for for a diamond topology, with different crosslinker concentrations . Both moduli at low display a minimum, which becomes more pronounced upon further lowering , at a characteristic (negative) value of . Such values appear to be close but not exactly the same, within the current numerical resolution, as , where the Poisson’s ratio has a minimum, as discussed in the main text.
SII Dependence on network topology for disordered realizations
In Fig. S2 we report results for the Poisson’s ratio for different realizations of the Dis - 1% network, to show that we find consistent behaviour independent of the specific topology. In particular, Fig. S2(a) shows as a function of pressure for the three studied realizations, displaying a minimum in all cases, although taking place at different values of . The transverse versus longitudinal strain for each shows a similar behaviour for the different topologies, as reported in Fig. S2(b).
SIII Elastic properties for compressed and expanded (coexisting) states at the hyper-auxetic point
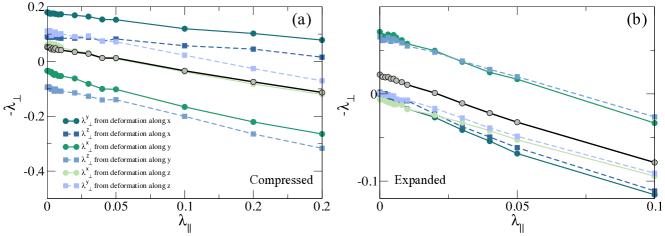
Here we report results for the Poisson’s ratio of the two coexisting compressed and elastic states for the Diam - 0.35% network at , as discussed in Fig. 3 of the main text. The calculated vs for the compressed and expanded states are reported in Figs. S3(a),(b), respectively, for all examined deformation directions. From these data, it is evident that the Poisson’s ratio does not change much between the two states, being for the expanded state and for the compressed one. These data suggest that a hyper-auxetic behaviour is found for both states, although the bulk and the Young moduli are found to be significantly different from each other, as discussed in the main text.
SIV Critical-like behaviour: entropy and energy
As discussed in the main text, entropy plays an important role in the transition. In polymeric systems, the presence of crosslinkers and entanglements induces a constraint on the configurations that can be explored by the polymer chains. Typically, the chain end-to-end distance can be used to describe chains fluctuations, whose probability distribution has theoretically been approximated by a Gaussian distribution mark2007physical ; rubinstein2003polymer . In this way, the entropy of the network is computed as the sum of the contributions from every chain. While this approach was shown to be useful in dense systems, in dilute regimes it fails due to the presence of short chains whose does not behave in a Gaussian way. Furthermore, by stretching the network, deviations from the gaussian behavior will be significant sorichetti2021effect . To avoid these issues, here we calculate single chain entropy assuming that the end-to-end distance follows the Langevin approximation rubinstein2003polymer , which for a single chain is given by Eq. 5 of the main text. This approach has been shown to work relatively well in the case of phantom networks up to end-to-end distances approaching the contour length sorichetti2021effect . Thus, we define the average single chain entropy as the average entropy of all the chains within the network which is reported in Fig. S4(a) for the Diam - 0.35% network at different negative pressures. Interestingly, we observe critical-like jumps between a high entropy regime corresponding to high density and low entropy states corresponding to low density, which happen simultaneously with those occurring for density (see Fig. 4(a) in the main text). This is confirmed by the scatter plot of entropy and density at in Fig. S4(b).
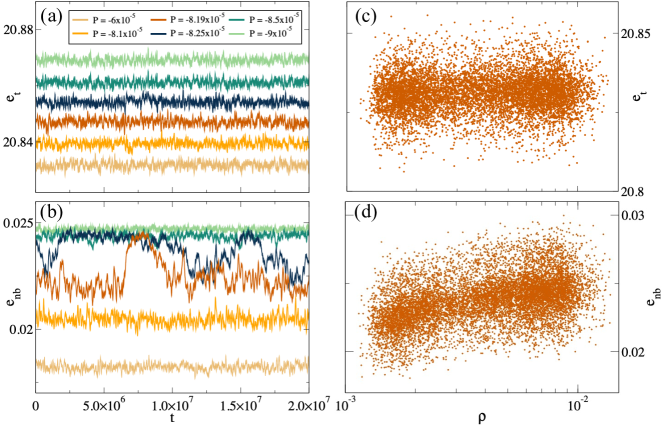
When we monitor the total potential energy as a function of time, as reported in Fig. S5(a), again for the Diam - 0.35% network at the same value of , we find that critical fluctuations are completely absent. We thus focus on the non-bonded potential energy , shown in Fig. S5(b), which instead shows critical-like fluctuations. This correspondence is confirmed by the scatter plots, reported in Figs. S5(c) and (d), of total energy and non-bonded energy with density, respectively. Clearly, while the former appears to be not correlated with , the second is. This analysis allows us to focus on as mixing variable in the order parameter that controls the criticality of the transition, as also discussed in the main text.
SV Scaling properties close to the transition
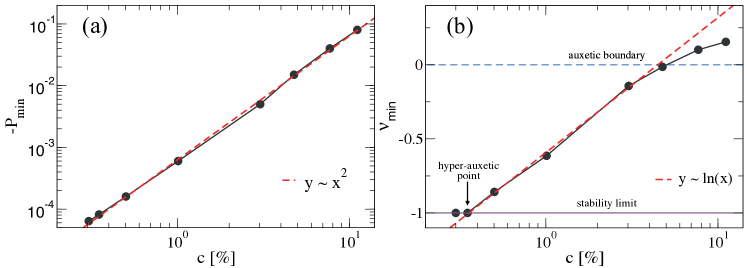
In Fig S6 we report the behavior of and as a function of crosslinker concentration for diamond networks. It is interesting that closely follows a quadratic power-law behavior for , suggesting a critical behavior that would terminate at . Instead, follows a logarithmic behavior in in the auxetic region, which ends at , below which the minimum Poisson’s ratio saturates at -1, the minimum value for a mechanically stable solid. For we indeed still detected , followed by a first-order transition between the two states upon further decreasing pressure.
References
- (1) Lakes, R. Foam structures with a negative poisson's ratio. Science 235, 1038–1040 (1987).
- (2) Evans, K. E. & Caddock, B. D. Microporous materials with negative poisson’s ratios. ii. mechanisms and interpretation. Journal of Physics D: Applied Physics 22, 1883–1887 (1989).
- (3) Evans, K. E., Nkansah, M., Hutchinson, I. & Rogers, S. Molecular network design. Nature 353, 124–124 (1991).
- (4) Gatt, R. et al. Negative poisson’s ratios in tendons: An unexpected mechanical response. Acta Biomaterialia 24, 201–208 (2015).
- (5) Hu, H. Auxetic textile materials - a review. Journal of Textile Engineering & Fashion Technology 1 (2017).
- (6) Rysaeva, L. K., Baimova, J. A., Lisovenko, D. S., Gorodtsov, V. A. & Dmitriev, S. V. Elastic properties of fullerites and diamond-like phases. physica status solidi (b) 256, 1800049 (2018).
- (7) Greaves, G. N., Greer, A., Lakes, R. S. & Rouxel, T. Poisson’s ratio and modern materials. Nature materials 10, 823–837 (2011).
- (8) Larsen, U., Signund, O. & Bouwsta, S. Design and fabrication of compliant micromechanisms and structures with negative poisson's ratio. Journal of Microelectromechanical Systems 6, 99–106 (1997).
- (9) Theocaris, P. S., Stavroulakis, G. E. & Panagiotopoulos, P. D. Negative poisson's ratios in composites with star-shaped inclusions: a numerical homogenization approach. Archive of Applied Mechanics (Ingenieur Archiv) 67, 274–286 (1997).
- (10) Hanifpour, M., Petersen, C. F., Alava, M. J. & Zapperi, S. Mechanics of disordered auxetic metamaterials. The European Physical Journal B 91 (2018).
- (11) Reid, D. R. et al. Auxetic metamaterials from disordered networks. Proceedings of the National Academy of Sciences 115, E1384–E1390 (2018).
- (12) Dong, L., Stone, D. S. & Lakes, R. S. Softening of bulk modulus and negative poisson ratio in barium titanate ceramic near the curie point. Philosophical Magazine Letters 90, 23–33 (2010).
- (13) Kou, L. et al. Auxetic and ferroelastic borophane: A novel 2d material with negative possion’s ratio and switchable dirac transport channels. Nano Letters 16, 7910–7914 (2016).
- (14) Landau, L. & Lifshitz, E. Theory of elasticity (volume 7 of a course of theoretical physics) pergamon press (1970).
- (15) Hirotsu, S. Softening of bulk modulus and negative poisson’s ratio near the volume phase transition of polymer gels. The Journal of Chemical Physics 94, 3949–3957 (1991).
- (16) Li, C., Hu, Z. & Li, Y. Poisson’s ratio in polymer gels near the phase-transition point. Physical Review E 48, 603–606 (1993).
- (17) Hirotsu, S. Static and time-dependent properties of polymer gels around the volume phase transition. Phase Transitions 47, 183–240 (1994).
- (18) Wojciechowski, K. Two-dimensional isotropic system with a negative poisson ratio. Physics Letters A 137, 60–64 (1989).
- (19) Boal, D. H., Seifert, U. & Shillcock, J. C. Negative poisson ratio in two-dimensional networks under tension. Physical Review E 48, 4274–4283 (1993).
- (20) Bachman, H. et al. Ultrasoft, highly deformable microgels. Soft Matter 11, 2018–2028 (2015).
- (21) Virtanen, O. L. J., Mourran, A., Pinard, P. T. & Richtering, W. Persulfate initiated ultra-low cross-linked poly(n-isopropylacrylamide) microgels possess an unusual inverted cross-linking structure. Soft Matter 12, 3919–3928 (2016).
- (22) Scotti, A. et al. Deswelling of microgels in crowded suspensions depends on cross-link density and architecture. Macromolecules 52, 3995–4007 (2019).
- (23) Scotti, A. et al. Exploring the colloid-to-polymer transition for ultra-low crosslinked microgels from three to two dimensions. Nature Communications 10 (2019).
- (24) Gnan, N., Rovigatti, L., Bergman, M. & Zaccarelli, E. In silico synthesis of microgel particles. Macromolecules 50, 8777–8786 (2017).
- (25) Sorichetti, V. et al. Effect of chain polydispersity on the elasticity of disordered polymer networks. Macromolecules 54, 3769–3779 (2021).
- (26) Xinchun, S. & Lakes, R. S. Stability of elastic material with negative stiffness and negative poisson’s ratio. phys. stat. sol. (b) 244, 1008–1026 (2007).
- (27) Nicolaou, Z. G. & Motter, A. E. Mechanical metamaterials with negative compressibility transitions. Nature Materials 11, 608–613 (2012).
- (28) Rovigatti, L., Gnan, N., Tavagnacco, L., Moreno, A. J. & Zaccarelli, E. Numerical modelling of non-ionic microgels: an overview. Soft matter 15, 1108–1119 (2019).
- (29) Keidel, R. et al. Time-resolved structural evolution during the collapse of responsive hydrogels: The microgel-to-particle transition. Science advances 4, eaao7086 (2018).
- (30) Hoppe Alvarez, L. et al. Deformation of microgels at solid–liquid interfaces visualized in three-dimension. Nano letters 19, 8862–8867 (2019).
- (31) Higgs, P. & Ball, R. Polydisperse polymer networks: elasticity, orientational properties, and small angle neutron scattering. Journal de Physique 49, 1785–1811 (1988).
- (32) Grest, G. S. & Kremer, K. Statistical properties of random cross-linked rubbers. Macromolecules 23, 4994–5000 (1990).
- (33) Rubinstein, M. & Colby, R. H. Polymer physics, vol. 23 (Oxford university press New York, 2003).
- (34) Wilding, N. B. & Bruce, A. D. Density fluctuations and field mixing in the critical fluid. Journal of Physics: Condensed Matter 4, 3087–3108 (1992).
- (35) Debenedetti, P., Sciortino, F. & Zerze, G. Second critical point in two realistic models of ewater. Science 369, 289–292 (2020).
- (36) Li, Y. & Tanaka, T. Study of the universality class of the gel network system. The Journal of Chemical Physics 90, 5161–5166 (1989).
- (37) Onuki, A. Theory of phase transition in polymer gels. In Responsive Gels: Volume Transitions I, 63–121 (Springer Berlin Heidelberg, 1993).
- (38) Habicht, A., Schmolke, W., Lange, F., Saalwächter, K. & Seiffert, S. The non-effect of polymer-network inhomogeneities in microgel volume phase transitions: Support for the mean-field perspective. Macromolecular Chemistry and Physics 215, 1116–1133 (2014).
- (39) Dimitriyev, M. S., Chang, Y.-W., Goldbart, P. M. & Fernández-Nieves, A. Swelling thermodynamics and phase transitions of polymer gels. Nano Futures 3, 042001 (2019).
- (40) Gao, J. & Frisken, B. J. Cross-linker-FreeN-isopropylacrylamide gel nanospheres. Langmuir 19, 5212–5216 (2003).
- (41) Scotti, A. et al. Flow properties reveal the particle-to-polymer transition of ultra-low crosslinked microgels. Soft matter 16, 668–678 (2020).
- (42) Virtanen, O., Mourran, A., Pinard, P. & Richtering, W. Persulfate initiated ultra-low cross-linked poly (n-isopropylacrylamide) microgels possess an unusual inverted cross-linking structure. Soft matter 12, 3919–3928 (2016).
- (43) Seiffert, S. Impact of polymer network inhomogeneities on the volume phase transition of thermoresponsive microgels. Macromolecular Rapid Communications 33, 1135–1142 (2012).
- (44) Voudouris, P., Florea, D., van der Schoot, P. & Wyss, H. M. Micromechanics of temperature sensitive microgels: dip in the poisson ratio near the LCST. Soft Matter 9, 7158 (2013).
- (45) Weeks, J. D., Chandler, D. & Andersen, H. C. Role of repulsive forces in determining the equilibrium structure of simple liquids. The Journal of chemical physics 54, 5237–5247 (1971).
- (46) Kremer, K. & Grest, G. S. Dynamics of entangled linear polymer melts: A molecular-dynamics simulation. The Journal of Chemical Physics 92, 5057–5086 (1990).
- (47) Claudio, G. C., Kremer, K. & Holm, C. Comparison of a hydrogel model to the poisson–boltzmann cell model. The Journal of chemical physics 131, 094903 (2009).
- (48) Jha, P. K., Zwanikken, J. W., Detcheverry, F. A., De Pablo, J. J. & De La Cruz, M. O. Study of volume phase transitions in polymeric nanogels by theoretically informed coarse-grained simulations. Soft Matter 7, 5965–5975 (2011).
- (49) Ninarello, A. et al. Modeling microgels with a controlled structure across the volume phase transition. Macromolecules 52, 7584–7592 (2019).
- (50) Poppleton, E., Romero, R., Mallya, A., Rovigatti, L. & Ŝulc, P. Oxdna.org: a public webserver for coarse-grained simulations of dna and rna nanostructures. Nucleic Acids Research (2021).
- (51) Sciortino, F. Three-body potential for simulating bond swaps in molecular dynamics. The European Physical Journal E 40 (2017).
- (52) Plimpton, S. Fast parallel algorithms for short-range molecular dynamics. Journal of computational physics 117, 1–19 (1995).
- (53) Flory, P. J. Statistical thermodynamics of random networks. Proceedings of the Royal Society of London. A. Mathematical and Physical Sciences 351, 351–380 (1976).
- (54) Treloar, L. R. G. The physics of rubber elasticity (Oxford University Press, USA, 1975).
- (55) Jedynak, R. Approximation of the inverse langevin function revisited. Rheologica Acta 54, 29–39 (2015).
- (56) Binney, J. J., Dowrick, N. J., Fisher, A. J. & Newman, M. E. The theory of critical phenomena: an introduction to the renormalization group (Oxford University Press, 1992).
- (57) Tsypin, M. & Blöte, H. Probability distribution of the order parameter for the three-dimensional ising-model universality class: A high-precision monte carlo study. Physical Review E 62, 73 (2000).
- (58) Mark, J. E. et al. Physical properties of polymers handbook, vol. 1076 (Springer, 2007).