Tying the geometrical traits of massive young stellar objects and their discs to a potential evolutionary sequence using infrared observations
Abstract
Young massive stars influence their surroundings from local to galactic scales, but the observational challenges associated with their distance and embedded nature has, until the recent decade, made high-resolution studies of these objects difficult. In particular, comparative analyses of MYSO discs are currently lacking and our understanding of their evolution is limited. Here, we combine the results of two studies with the aim to attribute geometrical features to an evolutionary sequence for a sample of seven MYSOs. The time evolution is based on a near-IR spectral features, while the geometry is determined from a multi size-scale study of MYSOs. We find that MYSO discs with determined geometrical substructure turn out to be also spectroscopically more evolved. This implies that disc evolution and dispersal are occurring within MYSOs similar to low-mass YSO disc evolution, despite their faster formation timescales.
1 Introduction
Massive stars (8M⊙) are some of the most influential objects within the Universe, affecting their own local environments and the galaxy as a whole. Through their winds and outflows, they mould molecular clouds (Krumholz et al., 2014) affect further star formation and shape galactic superwinds (Leitherer, 1994). When they end their lives through supernovae events, they synthesise the heaviest elements in the Universe and distribute these throughout the interstellar medium (ISM), enriching the material of future stellar systems like our own. Additionally, when they end their lives they are the only stars to create black holes and as such are the progenitors of gravitational wave sources (Abbott et al., 2016). Despite their importance, the formation process of massive stars is not well understood as they are distant, deeply embedded and rare (Motte et al., 2018). One phase of evolution which is of particular interest to study is the so-called massive young stellar object (MYSO) - an infrared-bright object whose spectral energy distributions (SEDs) peaks in the far infrared and has a total luminosity around 104L⊙. The nature of MYSOs, in particular at scales of 100s of au which will be involved with important processes such as accretion, has remained elusive. Interferometric observations in general provide higher resolution views of massive forming stars than those obtained through other observing techniques, reaching scales of 0.01”. This allows interferometry to probe the innermost regions of MYSOs involved in the accretion process. In the infrared, such interferometric studies have revealed the presence of discs around MYSOs (e.g. Kraus et al. (2010), 8au spatial resolution) and the presence of close binary systems (e.g. Koumpia et al. 2019 at 30au). In the sub-millimetre, ALMA has provided new insights to the environments of MYSOs at 200au scales (e.g. Maud et al. 2018). Using continuum measurements and molecular studies, structures such as warps (Sanna et al. 2019, Jiménez-Serra et al. 2020), spirals (Johnston et al., 2020) and rings (Maud et al., 2019) have been detected in MYSO discs. The presence of such discs is of great interest to probe the way MYSOs accrete mass, as for low-mass stars, disc-accretion is the main avenue of mass transfer from the wider environment to the star. For low-mass stars, large interferometric surveys of discs have been performed, allowing detailed investigations of their composition and the processes occurring within them (e.g. DSHARP, Andrews et al. 2018). These types of surveys, combined with previous works which defined evolutionary classes of low-mass discs based on their spectral SED emission (Barsony, 1994; Shu, 1977), have allowed different disc features to be attributed to different ages of protostellar disc. Younger discs show evidence of accretion features in their SEDs and their minimum dust radius is often dictated by dust sublimation alone (Beltrán & de Wit, 2016). On the other hand, inner clearing is observed in so-called ‘transition discs’ (Cieza et al., 2010), one elder form of disc. Other structures such as spirals and rings in discs are typically observed in elder sources, save for a few examples (e.g. Sheehan & Eisner 2018). Studying such features is critical in determining the physical processes occurring with the disc, such as those related to planet formation, dust amalgamation or the formation of companions. Such a classification of the evolution of MYSO discs has, thus far, not been feasible.
In Frost et al. (2021), we used a approach which used multiple datasets which trace 10mas scales, 100mas scales and SEDs to characterise the geometry of a sample of eight MYSOs but with no information on their age. Independently, Cooper (2013) and Cooper et al. (2013) studied a sample of nearly 130 MYSOs using their near-infrared colour and near-infrared spectra. In doing so, they noticed different spectral lines in the redder, more embedded and therefore younger sources to the elder bluer sources and from this developed a classification scheme associated with evolutionary phase. In this paper, we combine the results and methods of these two studies to attribute the geometrical characteristics of MYSOs (and specifically their discs) to a potential evolutionary sequence for the first time. In the next subsections, we introduce the methods and results of Frost et al. (2021) and Cooper (2013) for ease of interpretation of the results of this paper. In Section 2, we present the evolutionary classification of the sources from Frost et al. (2021) and use their geometrical features to compare to previous star formation models and estimate numerical ages for the sources. In Section 3, we discuss our results before concluding.
1.1 Work thus far I - Characterising the geometry of MYSOs at multiple scales
The most detailed interferometric studies of MYSOs tend to focus on single MYSOs. Such individual studies are not homogeneous, as they use different methods and types of analysis. Boley et al. (2013) presented a survey of 20 MYSOs with the now-decommissioned VLTI MIDI instrument fitting geometric models to 10.6m data, providing a first glimpse of mid-IR structure at 100au scales around MYSOs and attributing this to disc and outflow emission. Some studies have investigated MYSOs using their spectral energy distributions (SEDs) which provide information on the whole source, but with no direct spatial information. In Liu et al. (2019), the model grid of Zhang & Tan (2018) was used to fit SEDs of a number of MYSOs. However the interpretation of SED data can be difficult in particular given the strong dependencies on parameters such as viewing angle (e.g. Whitney et al. 2003, Robitaille 2017) and the embedded nature of MYSOs means that disc emission is not easily distinguished from stellar/envelope emission as can be done for low-mass stars. de Wit et al. (2009) and Wheelwright et al. (2012) fit Q-band image profiles and SEDs using 2D radiative transfer (RT) models, therefore linking the information of an SED to a high 0.1” resolution dataset but lacking the sensitivity to small spatial scales that interferometry could provide. Frost et al. (2019) and Frost et al. (2021) combined all these observables, using a detailed methodology which combines the N-band (7-13m) interferometric data from Boley et al. (2013) (required to probe the smallest 0.01” spatial scales) with near-diffraction-limited imaging in the Q-band (19.5m - 24.5m) from Frost et al. (2021) and de Wit et al. (2009) and SEDs. The SEDs were compiled using the online database of the Red MSX Source (RMS) survey and the literature, including fluxes from instruments such as 2MASS, WISE, GLIMPSE, Herschel/PACS, ATLASGAL, SCUBA and more (see Frost et al. 2021 for a complete list) covering near-infrared to millimetre wavelengths. These observables were fit with synthetic observations from RT models using the 3D dust RT code HOCHUNK-3D (Whitney et al., 2013). This code simulates the protostellar environment through the combination of different geometrical components; a central source defined by its mass, temperature and radius, two disc components (a ‘large grains’ disc and a ‘small grains’ disc each with their own determinable scale-heights, minimum radii and maximum radii) that contribute to one overall disc mass, a surrounding envelope component and bipolar outflow cavities. The models from the RT code were fit to the three observables simultaneously. Synthetic images at 1m intervals were generated in the N-band and post-processed to produce visibilities at each wavelength to be compared to those observed (Frost et al., 2019). Similarly Q-band synthetic images were generated by the code, convolved to match the observations and radial profiles extracted from them to allow comparison to diffraction-limited 20m images. In doing so the characteristics of a sample of MYSOs were obtained at multiple scales and the combination of high-resolution datasets allowed the distinction between disc emission and other components.
In Frost et al. (2021) we applied this methodology on a sample of eight MYSOs, the largest sample to be analysed in such a way. The sources were selected randomly based on the availability of both archival interferometric N-band data (MIDI, Boley et al. 2013) and the additional presence of Q-band imaging data (Frost et al., 2021; de Wit et al., 2009). When fitting the Q- and N-band datasets simultaneously, the cavity wall geometry was constrained at two scales. With this in place, it was found that one could not satisfy the N-band and Q-band data simultaneously without including discs in the models (see Figure 8, Frost et al. 2019). The simulated N-band emission is affected most by the presence of a disc, with the N-band visibilities higher in a disc and envelope model than an envelope-only model due to the presence of a compact object. The geometry of the disc is also significant, with the simulated visibilities particularly sensitive to disc inner radius and scale-height in particular, with disc outer radius and total mass being less well constrained. For one source (NGC 2264 IRS1) which is close to face-on, the mass was better constrained as the disc data was best fit with a mass-dependent spiral structure. The SED provides additional information on the wider cooler environment out to millimetre wavelengths. With these three observables combined, a multi-scale picture of the MYSOs is obtained and a wide parameter space encompassing the discs, cavities and envelopes of the sources can be investigated.
In Frost et al. (2021) we concluded that, in agreement with previous works, the geometry of these MYSOs consisted of dusty envelopes of natal material which are rotating and infalling (following the solution of Ulrich 1976). Within these envelopes bipolar outflow cavities are present, carved out of the natal material by outflows, which are ubiquitously observed around MYSOs. Importantly, discs are present at scales of 100au, which could therefore be involved in the accretion process. All sources in the sample are all relatively similar at large scales, with envelope radii of the order 105au from the fitted models. Similarly the envelope infall rates of the sample were all 10-4M⊙yr-1 (except for one source (S255 IRS3) which is known to be episodically accreting (Caratti o Garatti et al., 2017) and for which the data used were from an accretion lull for the source). A range of opening angles (measured from the polar axis) and cavity densities were seen across the sample with minima and maxima of 12∘ and 40∘ and 10-19gcm-3 and 10-21gcm-3 respectively. The best-fit models of the discs in each source vary considerably, some are flat (scale-height 0.1) while others are flared (scale-height 0.4). Finally, it was found that adding substructure the discs in the models improved the fits to the observational data. Most commonly this substructure takes the form of cleared inner regions, where the minimum dust radius is greater than the sublimation radius of the central source. The best-fit model for one source (NGC 2264 IRS1) incorporates a spiral/gap structure within its flared disc.
References: (1) Lumsden et al. (2013); (2) Mottram et al. (2011a); (3) (Mottram et al., 2011b); (4) Immer et al. (2013); (5) Grellmann et al. (2011); (6) Kamezaki et al. (2014); (7) (Wang et al., 2011); (8) Burns et al. (2016); (9) Kraus et al. (2017); (10) Boley et al. (2013); (11) Linz et al. (2009); (12) Damiani et al. (2019); (13) Urquhart et al. (2012); (14) Urquhart et al. (2014); (15) Frost et al. (2021).
| Name | RA (J2000) | DEC (J2000) | log() | Distance |
|---|---|---|---|---|
| (h:m:s) | (d:m:s) | (kpc) | ||
| G305.20+0.21 | 13:11:10.45 | -62:34:38.6 | 4.71 | 4.02 |
| W33A | 18:14:39.0 | -17:52:03 | 4.53 | 2.44 |
| NGC 2264 IRS1 | 06:41:10.15 | +09:29:33.6 | 3.65 | 0.76 |
| S255 IRS3 | 06:12:54.02 | +17:59:23.60 | 4.77 | 1.88 |
| IRAS 17216-3801 | 17:25:06.51 | -38:04:00.4 | 4.89 | 3.110 |
| M8EIR | 18:04:53.18 | -24:26:41.4 | 3.811 | 1.312 |
| AFGL 2136 | 18:22:26.38 | -13:30:12.0 | 51 | 2.213,14 |
1.2 Work thus far II - Spectral variance in MYSOs
Cooper (2013) and Cooper et al. (2013) examined the NIR spectra of over one hundred MYSOs from the RMS survey. Various emission signatures were observed throughout the objects, allowing them to be categorised into three main different types. The emission lines which allowed this were H2, Br, Br10 and fluorescent Fe II (hereafter fl-FeII).
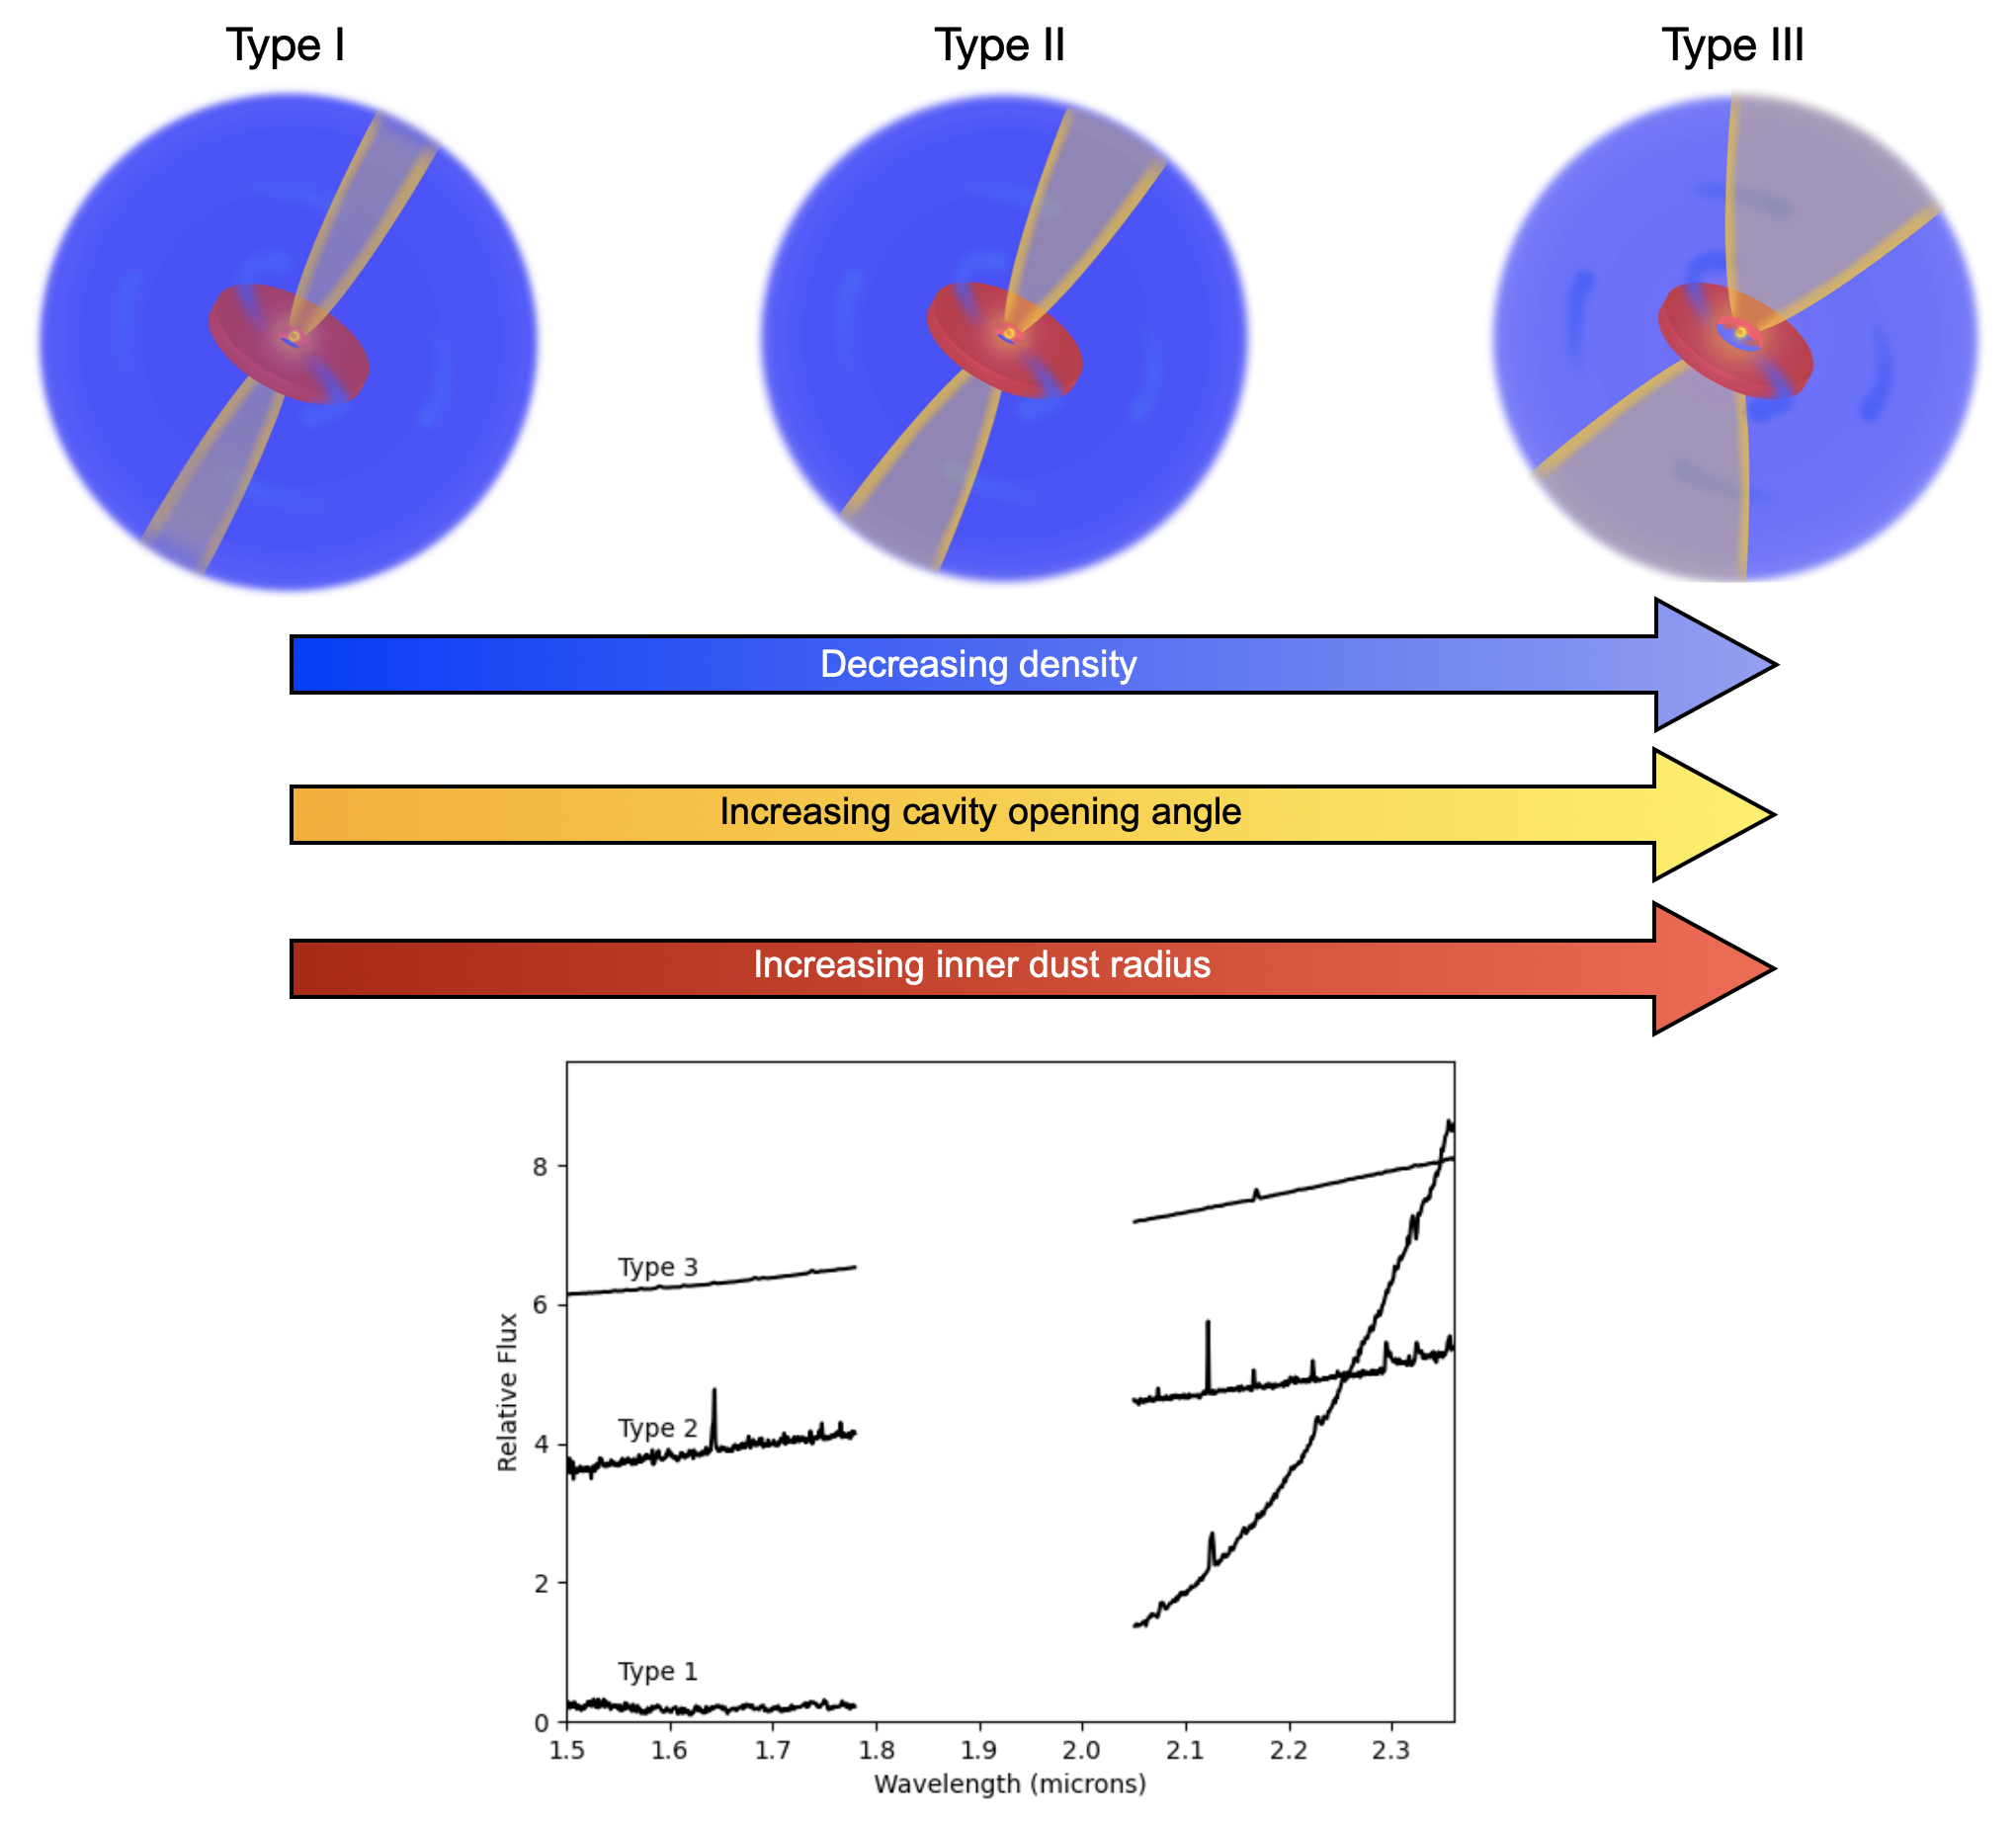
Based on the presence of these lines, the MYSOs were grouped into different evolutionary ”Types”. Each of these types is classed as a different evolutionary phase. Type I MYSOs display strong H2 (2.1218m) emission lines, attributed to shocks from the collision of high-velocity ejections with ambient material (Marston et al., 2004). Type I sources do not display any other lines and are categorised as the youngest sources. Type II sources display H2 and Br emission, with the latter arising due to the increasing central temperature and luminosity of the central protostar (Cooper, 2013). Br10 emission is weak or absent, and there is also a lack of fl-FeII emission as the star is not yet evolved enough to produce the ionising photons that cause its emission (Cooper, 2013). Type III display weak or absent H2 emission, strong Br emission and a presence of Br10 and fl-FeII emission. As the MYSO evolves through the Type II and Type III stages the amount of H2 emission decreases, perhaps because the outflow itself is weakening, the amount of circumstellar material is depleting due to dispersion and/or because the molecules of H2 are being dissociated as the protostar gets hotter. This increase in temperature also induces (Type II) and increases (Type III) the Br emission. By the time an MYSO is at Type III, either the outflow is too weak or there is not enough material to form shocks of H2. Past this point ionisation would be prevalent enough to create a Hii region.
Mid-infrared colour-colour cuts can be used as crude estimators of age and have allowed MYSOs to be distinguished from other evolutionary stages of massive star formation (Lumsden et al., 2013). Within the sample of Cooper (2013), the Type III sources were found to be bluer than the Type I sources, indicating that Type I is the youngest and that the sources may evolve through the Type II stage to the Type III stage. Additionally, He I emission, which is a common signature of main-sequence wind activity, are not found in the Type I sources (Cooper, 2013). Some presence in Type II sources is observed and He I emission is most prevalent in the spectra of the Type III sources, thereby implying that the Type III are closest to the main-sequence and the most evolved.
For the sources of Frost et al. (2021) we compiled a catalogue of all spectra required to categorise them according to the outline above. Spectra for 6 of the 8 sources from Frost et al. (2021) are available from previous works on the RMS survey MYSOs (Pomohaci 2017, Cooper et al. 2013 and Cooper 2013). In addition, a spectra of M8EIR was obtained from Porter et al. (1998) and a 2m spectra for IRAS 17216-3801 obtained from (Kraus et al., 2017) were sufficient to provide a reasonable characterisation according to Cooper (2013). Therefore, in total, the sample analysed in this paper consists of 7 sources. The sources are listed in Table 1.
2 New Results
We present the classifications of the sources in Table 2. Most of the sources were straightforward to classify. We classify S255 IRS3 as a Type I source, in agreement with the previous classification by Cooper (2013). This implies that it is the least evolved source in the sample. G305.20+0.21 and W33A are both classified as Type II sources. NGC 2264 IRS1 and M8EIR are classified as Type III sources. While the available spectra for IRAS 17216-3801 did not cover the Br series, an absence of H2 emission and the strength of the Br- line suggests that this is a Type III source, and we discuss the source as such. One source, AFGL 2136, was more complex to classify. AFGL 2136 could be interpreted as either a Type II or Type III source which presents discussion. Its spectrum displays a lack of H2, implying it is an older Type III object but Br- is only weakly observed, implying instead it is be a younger Type II object. Emission lines like Br- and H2 could appear weak if the source has a high dust column density, which would increase the amount of continuum emission making the lines look fainter and could be the source of this confusion. The continuum emission of AFGL 2136 is high but its column density was not directly measured in our work. AFGL 2136 could be classified as either a Type II or Type III according to the classification as it lacks H2 emission but only shows weak Br- emission. Indriolo et al. (2020) and Barr et al. (2020) studied AFGL 2136 spectroscopically with VLT+CRIRES, SOFIA+EXES, and Gemini North+TEXES spectra. They find that the weak Br- emission has to be limited to a very small emitting region in the inner disc based on the presence of spatially unresolved H30 emission and also note that the close to edge-on inclination of the source could lead to the weak appearance of the Br- line. The presence of the H30 recombination line also implies the presence of ionisation and therefore UV photons, which again implies the central protostar is more evolved and that AFGL 2136 is closer to a Type III than a Type II source.
2.1 Comparison with previous 3D radiation-hydrodynamical simulations
Following the determination of a potential evolutionary phase for each of the MYSOs, we additionally considered the work of Offner et al. (2011). These authors investigate how protostellar outflows change for YSOs with 3D radiation-hydrodynamic simulation.In the simulations, a turbulent steady state was achieved and the gravitational energy is comparable to the turbulent energy in the box at =0 (Offner et al., 2009). Energy is injected into the simulation and after the initial driving phase the turbulence decays on a dynamical timescale, initiating a global collapse. Protostars are added to this initial space which then generate outflows characterised by their ejection efficiency, velocity and momentum distribution. Using these models, Offner et al. (2011) find that the cavity opening angles of the YSOs increase with age. Similar results have been found in works such as Beuther & Shepherd (2005) and Vaidya et al. (2011).
Given that the cavity opening angle was a parameter which could affect both the N- and Q-band simulated high-resolution datasets throughout our previous work in Frost et al. (2021), it was of interest to see what ages Offner et al. (2011) would associate with the final geometries derived in Frost et al. (2021) and to see how these compared to the evolutionary Types derived for the sources in this paper. For this reason, we reiterate some relevant characteristics from Frost et al. (2021) in Table 2. It must be noted that in Frost et al. (2021) and here what we refer to as the ‘cavity opening angle’ is the cavity ‘half angle’ in Offner et al. (2011). Henceforth we continue to use ’cavity opening angle’ in consistency with our previous work. The cavity opening angle of S255 IRS3 is one of the smaller of the sample at 20∘. This corresponds to a protostellar age of 103yrs according to the modelling of Offner et al. (2011). W33A also has a 20 degree cavity putting it at the younger end of the evolutionary track of Offner et al. (2011). The cavity opening angle for G305 is the smallest of the sample, but this value may be affected by a secondary dusty object detected in the cavity by Liu et al. (2019) (see Paper I for further discussion). As a result we do not calculate an age for this source. AFGL 2136 can, as previously discussed, be considered either a Type II or Type III source and its cavity opening angle lies between those determined for W33A (Type II) and the Type III sources. The cavity opening angles for the Type III sources are also the larger of the sample, and according to Offner et al. (2011) they range in age between 104-105 years old. Therefore, this comparison provides independent support of the classification using the Types based on the near-infrared spectra, with the elder Types having the largest ages, though given our low-number statistics further investigation is required.
width=1 Name R Cavity density Type H2 flux Br flux Br 10 flux fl-FeII flux Age (au) (∘) (gcm-3) (log yr) S255 IRS3 12 (=Rsub) 20 610-19 I (1.200.06)10-17 1.210-17 2.510-18 2.110-18 3.1 W33A 18 (=Rsub) 20 110-19 II (8.70.1)10 (2.10.2)10-17 - - 3.1 G305.20+0.21 60 (3.5Rsub) 12* 110-19 II (4.20.003)10-17 (1.10.002)10-17 - - - AFGL 2136 125 (4Rsub) 22.5 310-19 II/III - (2.90.1)10-17 - - 3.5 NGC 2264 IRS1 4 (=Rsub) 25 810-21 III 7.010-16 (9.90.3)10-16 (4.00.3)10-16 (1.80.3)10-16 3.8 IRAS 17216-3801 100 (3Rsub) 40 910-21 III - - - - 5.0 M8EIR 30 (1.5Rsub) 25 810-21 III - 1 0.37 0.06 3.8
3 Notable trends & Discussion
The majority of the Type III sources have lower densities in their cavities (10-21gcm-3, Frost et al. 2021). They show the widest cavity opening angles of the sample with a maximum angle of 30∘. The modelled discs providing the best fit to the Type III sources are all required to have some form of substructure, generally an inner clearing. NGC 2264 IRS1 is the only source whose model shows a substructure other than an inner hole in the form of a gap-like structure (Frost et al., 2021). For low-intermediate mass stars such a feature is thought to form slowly through dust growth (e.g. Zhang et al. 2015) or binary interactions (e.g. Price et al. 2018) and are expected for more evolved sources. Typical timescales of disc evolution in low-mass star formation are on the order of mega-years. The later timescales of disc evolution are characterised by the presence of substructures like rings and gaps. One suspected origin of such structures is dust trapping, where grains collect in pressure minima or maxima throughout the disc. Such trapping gathers grains in close proximity where they can amalgamate and grow (Williams & Cieza, 2011a). However, recent observational studies are providing evidence for dust trapping occurring much earlier. For example, Segura-Cox et al. (2020) find evidence of four annular gap-like structures in the source IRS 63 which is less than half a million years old. These authors state posit that such structures are an area of likely grain growth. The case of IRS 63 is particularly relevant to comparison with the MYSO case, as it is a so-called Class I source (Shu & Adams, 1987) which, like an MYSO, is expected to have not only a disc but also surrounding envelope material. Additionally, the age of IRS 63 is within predicted massive star formation timescales (Tan et al., 2014). Thus, if grain growth is potentially occurring in a low-mass source, whose dust reservoirs and gravitational potentials are significantly smaller than those that would be expected for a massive protostellar system, it is not unreasonable to postulate that similar annular structures could form within the discs of MYSOs.
The other cause of gaps and rings in low-mass discs is the presence of companions. Recent modelling of massive protostellar discs specifically by Oliva & Kuiper (2020) shows that such spiral substructures can be expected to form for MYSOs too. The disc fragments as the MYSO evolves and eventually forms a binary system. The most complex spiral structure found in their work appears between 4000-15000yrs before a quiescent phase where the spiral structure is more muted. While the source which was best fit with a spiral structure (NGC 2264 IRS1) has not been confirmed to be a binary, the expected high binary fraction for massive stars at both the MYSO (e.g. Pomohaci et al. 2019, Koumpia et al. 2019, Meyer et al. 2018a) and evolved stages (e.g. Sana et al. (2012)), combined with the fact that we see structures known to be induced by companions through modelling (e.g. Oliva & Kuiper 2020, Price et al. 2018) in what we classify as an evolved disc is encouraging.
Another notable trend amongst the Type III discs specifically is that they are all highly flared. Varying disc flaring was required to improve the fit to the near-infrared shoulder of the SEDs and to improve the fit to the MIDI visibilities. A decrease in disc flaring has been presented as a diagnostic for evolution with the low-mass disc community, but the topic remains controversial. For example Meeus et al. (2001), through the study of infrared excess in the SEDs of Herbig discs, concluded that the earlier discs (dubbed Group I discs) were more likely to be flared and the second group (Group II) were more likely to be flat, attributing the change to dust growth. However, recent high-resolution imaging by Garufi et al. (2017) found that within a sample of 17 Herbig discs (half of all known at the time) that over half the flared discs are older than 10Myr, stating that the idea of evolution from flared to flat discs may need to be revised. The flaring of the disc could then be due to some other characteristic of the protostellar environment. The presence of flared discs in our more evolved MYSO sources is consistent with these findings that flared discs can be found even at later evolutionary stages in low-mass sources.
The Type II sources within this sample display very different geometries. G305 has a large inner hole and a low density environment similar to the more evolved Type III sources. The nature of W33A is less clear. Modelling work by Izquierdo et al. (2018) find that the region is very active, supporting the idea that this source may be young amongst the wider population of MYSOs. The fact that the final model of W33A has a disc with no substructure also supports that this may be a younger source, if it is assumed that substructure appears with evolution as it does for low-mass stars. Alternatively, van der Tak & Menten (2005) note the presence of multiple millimetre sources in their work at 3000-5000au separations. Given the shorter wavelength range of our high-resolution datasets we do not probe the outer, cooler regions of the disc in detail. These multiple sources may explain the complexity of the region seen with ALMA (Maud et al., 2017) but do not assist with the interpretation of our single-source models of the observed data.
S255 IRS3 has been shown to be actively accreting (Caratti o Garatti et al., 2017) and this corroborates the young classification made from its spectra. The evolution of discs around low-mass stars is marked by inside-out dispersal. This can be initiated by photoevaporation or the presence of a secondary body, which causes the inner regions of protoplanetary discs shift from a continuous structure to a more radially concentrated one (Williams & Cieza, 2011a). The inner geometry of the disc of S255 IRS3 supports the postulation that this is a young source, as it is not one of the sources which displays inner clearing - the minimum dust radius is the sublimation radius. The envelope infall rate of S255 IRS3 may imply an older source, but the data used to determine the source’s geometry are from an accretion lull. Thus, this is likely just a result of the confirmed variable accretion associated with the source. The cavity density (10-19gcm-3, Frost et al. 2021) for the source is one of the higher amongst the sample and again supports the younger age found for the source, as less envelope dispersal would have occurred.The differences observed between the MYSOs with Type is illustrated in Figure 1. To summarise, cavity opening angle appears to increase with evolutionary stage whilst the overall density of the dust environment decreases and substructure in discs appears over time, being most prevalent in the eldest classified discs.
3.1 What is causing the inner clearing in these MYSOs?
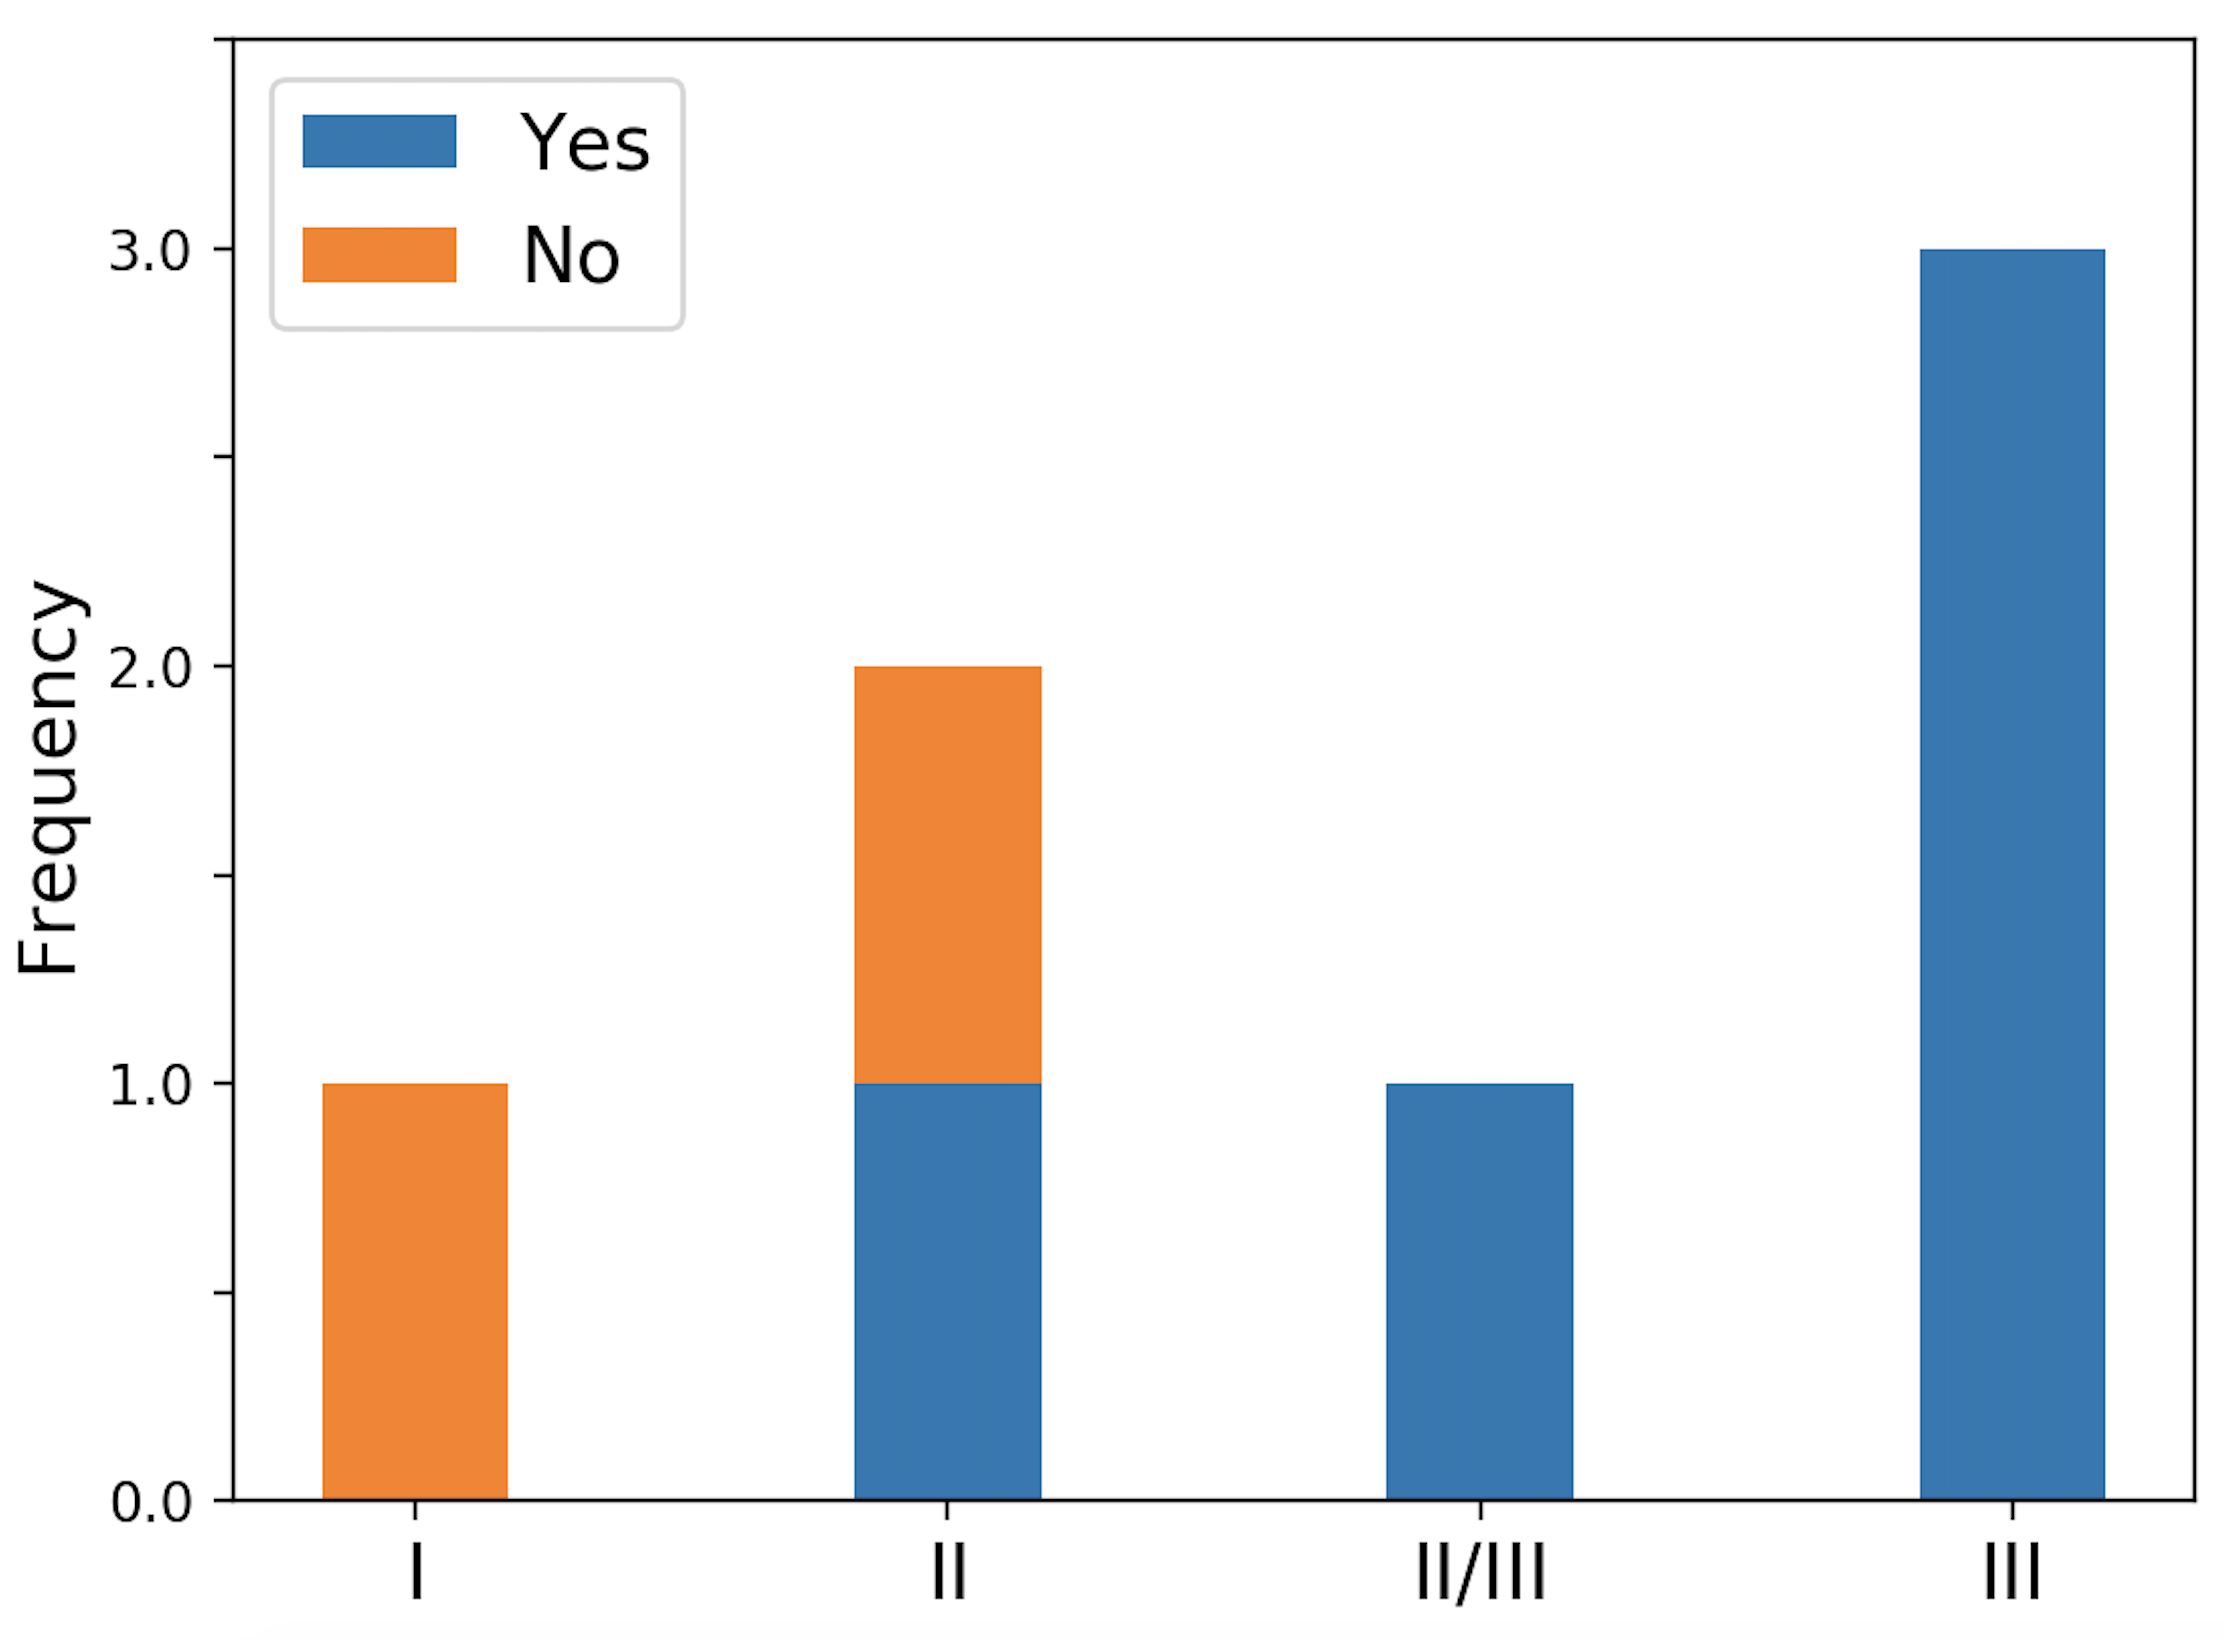
Within our sample, the presence or absence of substructure seems to be associated with evolutionary Type. The histogram in Figure 2 displays how the presence of substructure varies with type. Two kinds of substructure are inferred from the fitting; inner holes and one case of spiral/gap structure. In order for the inner holes to be present, something must be disrupting the dust beyond the sublimation radius. A number of theories exist as to what causes inner clearing in low-mass protostellar discs; photoevaporation (Alexander & Armitage, 2007), viscous evolution (Espaillat et al., 2014), the presence of binary/multiple companions (Price et al., 2018) and the presence of planets (Muley et al., 2019). For massive stars, modelling works such as Meyer et al. (2018b) show that gaps can evolve around massive sources. Photoevaporation and the presence of a binary companion appear to be the best candidates for these MYSOs, given their large luminosities and the high multiplicity fraction expected for massive stars. A calculated Pearson correlation coefficient of 0.93 (a measure of linear correlation calculated as the covariance of two variables divided by the product of their standard deviations) between the luminosity and the model minimum dust radius indicates a strong correlation. Since the minimum dust radius is often larger than sublimation radius, this could suggest that photoevaporation is the mechanism that is disrupting the dust. The classified types of the MYSOs also appear to support that photoevaporation is the cause of this clearing. Photoevaporation occurs due to the presence of UV photons. When an MYSO starts producing UV photons it passes into its next stage of evolution, the ultra-compact Hii region. One of the defining features of the Type III sources is that they display emission lines associated with photoevaporation. As a result it is consistent that more evolved MYSOs are starting to generate a surplus of these disrupting photons and therefore that this is the cause of the clearing. As the Type III discs are also all flared, also lends support to photoevaporation being present and a mechanism of dispersal as it is thought that photoevaporation inflates discs around low-mass protostars (Williams & Cieza, 2011b). These effects would only be enhanced for discs subject to more ionising photons which is more likely from MYSOs. Flaring could be indicative of relatively higher disc temperatures caused by lower opacity (lower disc densities) and increased irradiation of the disc. This implies that the disc density is lower and that more energetic stellar irradiation is present and that photoevaporation could be occurring (Williams & Cieza, 2011b).
The presence of multiplicity cannot be ruled out, however. Recent work has shown that a large proportion of MYSOs are expected to exist in multiple systems (Pomohaci et al., 2019). IRAS 17216-3801 is the only confirmed binary in the present sample (Kraus et al., 2017), and is classified as a Type III source. Further spectrointerferometric measurements at or -band wavelengths which could directly probe the inner rims of the discs and the photospheres of the protostars in this sample could allow the direct detection of binary systems, as has been used in works such as Gravity Collaboration et al. (2018). Work by Oliva & Kuiper (2020) has shown that spiral structures (such as those included in the final model of NGC 2264 IRS1) can appear due to disk fragmentation/binary formation. These are most prominent after timescales up to 15,000 years and past 15,000 years the spiral density perturbations become less pronounced, however we note that their simulations do not include outflows nor consider that the disc could be being continually fed by the surrounding envelope which could sustain such structure. Additionally, we note that theoretical work has shown through hydrodynamical modelling that the inner disc is removed for low-mass/Herbig binary systems over timescales of 0.5Myrs (Price et al., 2018) but such clearing is not apparent in current fragmentation models such as those done by Oliva & Kuiper (2020). Follow-up observations, such as image reconstruction at 0.01” scales using the VLTI, would allow these cleared inner regions to be investigated in more detail. In particular, observations with GRAVITY or MATISSE which operate at shorter wavelengths and could directly probe these inner regions.
The processes associated with asymmetric substructures in low-mass discs, like the spiral/gap structure inferred around NGC 2264 IRS1, are the presence of binary/multiple systems, dust trapping/growth (Zhang et al., 2015) and the presence of planets (Pinte et al., 2019). Given the high multiplicity fraction for MYSOs at wide separations (Pomohaci et al., 2019), we conclude that dust growth and the presence of a binary/multiple system are the most likely candidates for any substructure in this disc. Both the effects of binaries and dust growth take tens of thousands of years to occur, implying that NGC 2264 IRS1 may be a more evolved source which is in agreements with its classification as a Type III source.
4 Conclusions
Through the unique combination of a multi-scale study of the physical nature of MYSOs and near-infrared spectroscopic work, we have attributed the physical characteristics of a sample of MYSOs to a potential evolutionary sequence based on IR-line emission. The sample constitutes the largest modelled with infrared-derived constraints on physical properties spanning several orders of magnitude in physical size through the simultaneous fitting of interferometric, imaging and SED data. The MYSOs themselves cover a range in suspected masses and luminosities of 8-38 solar masses and 4000-151000L⊙. The disappearance of lines associated with outflow shocks colliding with dense envelope material in the near-infrared spectra and emergence of lines associated with the production of UV photons indicates evolution. In tandem, the sources which display lines the suggest the presence of UV photons are fit with models with low densities through the radiative transfer modelling. This suggests that the envelopes and outflows of the environments are dissipating. Additionally we find that the models of sources who are spectrally classified as more evolved are the only ones to show evidence of substructure. This implies that envelopes and discs are co-evolving for MYSOs, similar to low-mass stars and despite the rapid timescale of massive star formation. Future studies continuing to exploit milli-arcsecond resolution observations on an expanded sample, particularly on younger MYSOs who are in the minority in our sample, will be important aides in confirming these and ultimately probing the physics and chemistry of the disc evolution MYSOs. Amongst the sample, the sources modelled with the largest outflow cavities also fall in the category associated with the latest evolutionary phase. We compare the geometrical characteristics of the sample (Frost et al., 2021) with the results of 3D radiation-hydrodynamical simulations of YSOs to put quantitative values to the ages of the MYSOs based on their cavity opening angles and find an age range across the types from 103-5yrs. The presence of substructures within the elder massive young stellar object discs with suspected ages of 104-105yrs implies that disc evolution can occur around massive protostars, despite these fast formation timescales. Follow-up work to investigate the nature of the observed inner holes and structures of these discs can shed light on the mechanisms that form these structures and further improve our understanding on the role of discs in massive star formation.
References
- Abbott et al. (2016) Abbott, B. P., Abbott, R., Abbott, T. D., et al. 2016, Phys. Rev. Lett., 116, 061102, doi: 10.1103/PhysRevLett.116.061102
- Alexander & Armitage (2007) Alexander, R. D., & Armitage, P. J. 2007, MNRAS, 375, 500, doi: 10.1111/j.1365-2966.2006.11341.x
- Andrews et al. (2018) Andrews, S. M., Huang, J., Pérez, L. M., et al. 2018, ApJ, 869, L41, doi: 10.3847/2041-8213/aaf741
- Barr et al. (2020) Barr, A. G., Boogert, A., DeWitt, C. N., et al. 2020, ApJ, 900, 104, doi: 10.3847/1538-4357/abab05
- Barsony (1994) Barsony, M. 1994, Astronomical Society of the Pacific Conference Series, Vol. 65, Class 0 Protostars, ed. D. P. Clemens & R. Barvainis, 197
- Beltrán & de Wit (2016) Beltrán, M. T., & de Wit, W. J. 2016, A&A Rev., 24, 6, doi: 10.1007/s00159-015-0089-z
- Beuther & Shepherd (2005) Beuther, H., & Shepherd, D. 2005, Astrophysics and Space Science Library, 324, 105, doi: 10.1007/0-387-26357-8_8
- Boley et al. (2013) Boley, P. A., Linz, H., van Boekel, R., et al. 2013, A&A, 558, A24, doi: 10.1051/0004-6361/201321539
- Burns et al. (2016) Burns, R. A., Handa, T., Nagayama, T., Sunada, K., & Omodaka, T. 2016, MNRAS, 460, 283, doi: 10.1093/mnras/stw958
- Caratti o Garatti et al. (2017) Caratti o Garatti, A., Stecklum, B., Garcia Lopez, R., et al. 2017, Nature Physics, 13, 276, doi: 10.1038/nphys3942
- Cieza et al. (2010) Cieza, L. A., Schreiber, M. R., Romero, G. A., et al. 2010, ApJ, 712, 925, doi: 10.1088/0004-637X/712/2/925
- Cooper (2013) Cooper, H. D. B. 2013, PhD thesis, University of Leeds
- Cooper et al. (2013) Cooper, H. D. B., Lumsden, S. L., Oudmaijer, R. D., et al. 2013, MNRAS, 430, 1125, doi: 10.1093/mnras/sts681
- Damiani et al. (2019) Damiani, F., Prisinzano, L., Micela, G., & Sciortino, S. 2019, A&A, 623, A25, doi: 10.1051/0004-6361/201833877
- de Wit et al. (2009) de Wit, W. J., Hoare, M. G., Fujiyoshi, T., et al. 2009, A&A, 494, 157, doi: 10.1051/0004-6361:200810771
- Espaillat et al. (2014) Espaillat, C., Muzerolle, J., Najita, J., et al. 2014, Protostars and Planets VI, 497, doi: 10.2458/azu_uapress_9780816531240-ch022
- Frost et al. (2019) Frost, A. J., Oudmaijer, R. D., de Wit, W. J., & Lumsden, S. L. 2019, A&A, 625, A44, doi: 10.1051/0004-6361/201834583
- Frost et al. (2021) —. 2021, A&A, 648, A62, doi: 10.1051/0004-6361/202039748
- Garufi et al. (2017) Garufi, A., Meeus, G., Benisty, M., et al. 2017, A&A, 603, A21, doi: 10.1051/0004-6361/201630320
- Gravity Collaboration et al. (2018) Gravity Collaboration, Karl, M., Pfuhl, O., et al. 2018, A&A, 620, A116, doi: 10.1051/0004-6361/201833575
- Grellmann et al. (2011) Grellmann, R., Ratzka, T., Kraus, S., et al. 2011, A&A, 532, A109, doi: 10.1051/0004-6361/201116699
- Immer et al. (2013) Immer, K., Reid, M. J., Menten, K. M., Brunthaler, A., & Dame, T. M. 2013, A&A, 553, A117, doi: 10.1051/0004-6361/201220793
- Indriolo et al. (2020) Indriolo, N., Neufeld, D. A., Barr, A. G., et al. 2020, ApJ, 894, 107, doi: 10.3847/1538-4357/ab88a1
- Izquierdo et al. (2018) Izquierdo, A. F., Galván-Madrid, R., Maud, L. T., et al. 2018, MNRAS, 478, 2505, doi: 10.1093/mnras/sty1096
- Jiménez-Serra et al. (2020) Jiménez-Serra, I., Báez-Rubio, A., Martín-Pintado, J., Zhang, Q., & Rivilla, V. M. 2020, ApJ, 897, L33, doi: 10.3847/2041-8213/aba050
- Johnston et al. (2020) Johnston, K. G., Hoare, M. G., Beuther, H., et al. 2020, A&A, 634, L11, doi: 10.1051/0004-6361/201937154
- Kamezaki et al. (2014) Kamezaki, T., Imura, K., Omodaka, T., et al. 2014, ApJS, 211, 18, doi: 10.1088/0067-0049/211/2/18
- Koumpia et al. (2019) Koumpia, E., Ababakr, K. M., de Wit, W. J., et al. 2019, Astronomy and Astrophysics, 623, L5, doi: 10.1051/0004-6361/201834624
- Kraus et al. (2010) Kraus, S., Hofmann, K.-H., Menten, K. M., et al. 2010, Nature, 466, 339, doi: 10.1038/nature09174
- Kraus et al. (2017) Kraus, S., Kluska, J., Kreplin, A., et al. 2017, ApJ, 835, L5, doi: 10.3847/2041-8213/835/1/L5
- Krumholz et al. (2014) Krumholz, M. R., Bate, M. R., Arce, H. G., et al. 2014, Protostars and Planets VI, 243, doi: 10.2458/azu_uapress_9780816531240-ch011
- Leitherer (1994) Leitherer, C. 1994, in Reviews in Modern Astronomy, Vol. 7, Reviews in Modern Astronomy, ed. G. Klare, 73–102
- Linz et al. (2009) Linz, H., Henning, T., Feldt, M., et al. 2009, A&A, 505, 655, doi: 10.1051/0004-6361/20079172
- Liu et al. (2019) Liu, M., Tan, J. C., De Buizer, J. M., et al. 2019, arXiv e-prints, 901.01958, ApJ, submitted. https://arxiv.org/abs/1901.01958
- Lumsden et al. (2013) Lumsden, S. L., Hoare, M. G., Urquhart, J. S., et al. 2013, ApJS, 208, 11, doi: 10.1088/0067-0049/208/1/11
- Marston et al. (2004) Marston, A. P., Reach, W. T., Noriega-Crespo, A., et al. 2004, ApJS, 154, 333, doi: 10.1086/422817
- Maud et al. (2017) Maud, L. T., Hoare, M. G., Galván-Madrid, R., et al. 2017, MNRAS, 467, L120, doi: 10.1093/mnrasl/slx010
- Maud et al. (2018) Maud, L. T., Cesaroni, R., Kumar, M. S. N., et al. 2018, A&A, 620, A31, doi: 10.1051/0004-6361/201833908
- Maud et al. (2019) —. 2019, A&A, 627, L6, doi: 10.1051/0004-6361/201935633
- Meeus et al. (2001) Meeus, G., Waters, L. B. F. M., Bouwman, J., et al. 2001, A&A, 365, 476, doi: 10.1051/0004-6361:20000144
- Meyer et al. (2018a) Meyer, D. M. A., Kuiper, R., Kley, W., Johnston, K. G., & Vorobyov, E. 2018a, MNRAS, 473, 3615, doi: 10.1093/mnras/stx2551
- Meyer et al. (2018b) Meyer, D. M.-A., Kuiper, R., Kley, W., Johnston, K. G., & Vorobyov, E. 2018b, MNRAS, 473, 3615, doi: 10.1093/mnras/stx2551
- Motte et al. (2018) Motte, F., Bontemps, S., & Louvet, F. 2018, ARA&A, 56, 41, doi: 10.1146/annurev-astro-091916-055235
- Mottram et al. (2011a) Mottram, J. C., Hoare, M. G., Urquhart, J. S., et al. 2011a, A&A, 525, A149, doi: 10.1051/0004-6361/201014479
- Mottram et al. (2011b) —. 2011b, A&A, 525, A149, doi: 10.1051/0004-6361/201014479
- Muley et al. (2019) Muley, D., Fung, J., & van der Marel, N. 2019, ApJ, 879, L2, doi: 10.3847/2041-8213/ab24d0
- Offner et al. (2009) Offner, S. S. R., Hansen, C. E., & Krumholz, M. R. 2009, ApJ, 704, L124, doi: 10.1088/0004-637X/704/2/L124
- Offner et al. (2011) Offner, S. S. R., Lee, E. J., Goodman, A. A., & Arce, H. 2011, ApJ, 743, 91, doi: 10.1088/0004-637X/743/1/91
- Oliva & Kuiper (2020) Oliva, G. A., & Kuiper, R. 2020, A&A, 644, A41, doi: 10.1051/0004-6361/202038103
- Pinte et al. (2019) Pinte, C., van der Plas, G., Menard, F., et al. 2019, arXiv e-prints, arXiv:1907.02538. https://arxiv.org/abs/1907.02538
- Pomohaci (2017) Pomohaci, R. 2017, PhD thesis, University of Leeds
- Pomohaci et al. (2019) Pomohaci, R., Oudmaijer, R. D., & Goodwin, S. P. 2019, MNRAS, 484, 226, doi: 10.1093/mnras/stz014
- Porter et al. (1998) Porter, J. M., Drew, J. E., & Lumsden, S. L. 1998, A&A, 332, 999
- Price et al. (2018) Price, D. J., Cuello, N., Pinte, C., et al. 2018, MNRAS, 477, 1270, doi: 10.1093/mnras/sty647
- Robitaille (2017) Robitaille, T. P. 2017, A&A, 600, A11, doi: 10.1051/0004-6361/201425486
- Sana et al. (2012) Sana, H., de Mink, S. E., de Koter, A., et al. 2012, Science, 337, 444, doi: 10.1126/science.1223344
- Sanna et al. (2019) Sanna, A., Kölligan, A., Moscadelli, L., et al. 2019, A&A, 623, A77, doi: 10.1051/0004-6361/201833411
- Segura-Cox et al. (2020) Segura-Cox, D. M., Schmiedeke, A., Pineda, J. E., et al. 2020, Nature, 586, 228, doi: 10.1038/s41586-020-2779-6
- Sheehan & Eisner (2018) Sheehan, P. D., & Eisner, J. A. 2018, ApJ, 857, 18, doi: 10.3847/1538-4357/aaae65
- Shu (1977) Shu, F. H. 1977, ApJ, 214, 488, doi: 10.1086/155274
- Shu & Adams (1987) Shu, F. H., & Adams, F. C. 1987, in IAU Symposium, Vol. 122, Circumstellar Matter, ed. I. Appenzeller & C. Jordan, 7–22
- Tan et al. (2014) Tan, J. C., Beltrán, M. T., Caselli, P., et al. 2014, in Protostars and Planets VI, ed. H. Beuther, R. S. Klessen, C. P. Dullemond, & T. Henning, 149, doi: 10.2458/azu_uapress_9780816531240-ch007
- Ulrich (1976) Ulrich, R. K. 1976, ApJ, 210, 377, doi: 10.1086/154840
- Urquhart et al. (2012) Urquhart, J. S., Hoare, M. G., Lumsden, S. L., et al. 2012, MNRAS, 420, 1656, doi: 10.1111/j.1365-2966.2011.20157.x
- Urquhart et al. (2014) Urquhart, J. S., Moore, T. J. T., Csengeri, T., et al. 2014, MNRAS, 443, 1555, doi: 10.1093/mnras/stu1207
- Vaidya et al. (2011) Vaidya, B., Fendt, C., Beuther, H., & Porth, O. 2011, ApJ, 742, 56, doi: 10.1088/0004-637X/742/1/56
- van der Tak & Menten (2005) van der Tak, F. F. S., & Menten, K. M. 2005, A&A, 437, 947, doi: 10.1051/0004-6361:20052872
- Wang et al. (2011) Wang, Y., Beuther, H., Bik, A., et al. 2011, A&A, 527, A32, doi: 10.1051/0004-6361/201015543
- Wheelwright et al. (2012) Wheelwright, H. E., de Wit, W. J., Oudmaijer, R. D., et al. 2012, A&A, 540, A89, doi: 10.1051/0004-6361/201118689
- Whitney et al. (2013) Whitney, B. A., Robitaille, T. P., Bjorkman, J. E., et al. 2013, ApJS, 207, 30, doi: 10.1088/0067-0049/207/2/30
- Whitney et al. (2003) Whitney, B. A., Wood, K., Bjorkman, J. E., & Wolff, M. J. 2003, ApJ, 591, 1049, doi: 10.1086/375415
- Williams & Cieza (2011a) Williams, J. P., & Cieza, L. A. 2011a, ARA&A, 49, 67, doi: 10.1146/annurev-astro-081710-102548
- Williams & Cieza (2011b) —. 2011b, ARA&A, 49, 67, doi: 10.1146/annurev-astro-081710-102548
- Zhang et al. (2015) Zhang, K., Blake, G. A., & Bergin, E. A. 2015, ApJ, 806, L7, doi: 10.1088/2041-8205/806/1/L7
- Zhang & Tan (2018) Zhang, Y., & Tan, J. C. 2018, ApJ, 853, 18, doi: 10.3847/1538-4357/aaa24a