The impact of contact inhibition on collective cell migration and proliferation
Abstract
Contact inhibition limits migration and proliferation of cells in cell colonies. We consider a multiphase field model to investigate the growth dynamics of a cell colony, composed of proliferating cells. The model takes into account the mechanisms of contact inhibition of locomotion and proliferation by local mechanical interactions. We compare non-migrating and migrating cells, in order to provide a quantitative characterization of the dynamics and analyse the velocity of the colony boundary for both cases. Additionally, we measure single cell velocities, number of neighbour distributions, as well as the influence of stress and age on positions of the cells and with respect to each other. We further compare the findings with experimental data for Madin-Darby canine kidney cells.
pacs:
?Collective cell migration and proliferation play fundamental roles in embryonic development, tissue regeneration, wound healing and many disease processes. Identifying the principles behind these processes requires a multiscale approach, linking the properties of individual cells and cell-cell interactions to the emerging collective behaviour. Various modeling approaches have been considered to address this task, see Hakim and Silberzan (2017); Alert and Trepat (2020); Moure and Gomez (2021) for reviews. We here use a multiphase field model, see Nonomura (2012); Camley et al. (2014); Palmieri et al. (2015); Mueller et al. (2019); Wenzel et al. (2019); Loewe et al. (2020); Wenzel and Voigt (2021), which allows for cell deformations and detailed cell-cell interactions, as well as subcellular details to resolve the mechanochemical interactions underlying cell migration. Also topological changes, such as T1 transitions, follow naturally in this framework. Multiphase field models, together with efficient numerics and appropriate computing power, allow to analyse the connection of single cell behaviour with collective migration and growth of cell colonies, at least for moderate numbers of cells. They already led to quantitative predictions of many generic features in multicellular systems Peyret et al. (2019); Balasubramaniam et al. (2021); Wenzel and Voigt (2021).
Here, we especially focus on the complex interaction of migration and proliferation, which are regulated by contact inhibition processes. We distinguish between two different inhibitory mechanisms. On the one hand, we consider contact inhibition by locomotion (CIL), which describes the tendency of cells to stop migration, deform and change direction when coming in contact with other cells, see Stramer and Mayor (2017) for a review. On the other hand, we also investigate contact inhibition of proliferation (CIP), which refers to the suppression of cell growth and divisions in dense regions of tissues Fisher and Yeh (1967); Stoker and Rubin (1967). CIL naturally results from mechanical interactions of the multiphase field model and its impact on collective migration is well explored, within this framework Marth and Voigt (2016); Mueller et al. (2019); Wenzel et al. (2019); Peyret et al. (2019); Wenzel and Voigt (2021). In contrast to CIL, proliferation cannot easily be incorporated in the energetic description of a multiphase field model. Even if such attempts on a single cell level exist Zwicker et al. (2017); Li and Cates (2020), we here follow an adhoc procedure, which simply divides a cell if it has reached a certain size Drasdo et al. (1995); Nonomura (2012); Basan et al. (2013); Aland et al. (2015). CIP is included by a growth factor for each cell, which is affected by cell-cell interactions. We study the interplay of CIL and CIP for the dynamics of small groups of cells, proliferating in a circular confinement, similar to the experiments on monolayers of epithelia cells in Puliafito et al. (2012); Doxzen et al. (2013). In particular, we analyse emerging features, such as the speed of colony growth, the velocity of individual cells, topological measures, such as number of neighbor distributions, as well as relations between stress and age on position of the cells in the colony. For other computational studies on CIL and CIP, but with much stronger restrictions on the deformation of cells, we refer to Puliafito et al. (2012); Aland et al. (2015); George et al. (2017); Schnyder et al. (2020). Fig. 1 shows the dynamics of a growing colony for non-migrating and migrating cells, already indicating the differences of the models with respect to morphology and velocity of the colony boundary.
We consider two-dimensional phase field variables , one for each cell. Values of and denote the interior and the exterior of a cell, respectively. The cell boundary is defined implicitly by the region . The dynamics for each is considered as
| (1) |
for , where denotes the number of active cells. is a free energy and a vector field used to incorporate active components, with a self-propulsion strength . For non-migrating cells we set . All quantities are non-dimensional quantities. We consider conserved dynamics and add an exponential growth term with a growth rate . The free energy contains passive contributions, where
| (2) | |||||
| (3) | |||||
| (4) |
with non-dimensional capillary, interaction and confinement number, , and , respectively. The first is a Cahn-Hilliard energy, with a double-well potential and a small parameter determining the width of the diffuse interface. This energy stabilizes the cell interface. For simplicity, we here neglect other properties of the cell boundary, e.g., bending forces. In Marth et al. (2015) they are shown to be negligible in the context of cell migration. The second is an interaction energy with , a simple shift of to values in and a cell-cell interaction potential
| (5) |
approximating a short range potential, which is only active within the interior of the cell and its diffuse boundary. The approach offers the possibility to consider repulsive as well as attractive interactions which can be tuned by parameter , see SI. The last energy models the interaction with the confinement, which is given by the phase field function , with the centre of the computational domain and the radius of the circular confinement. The interaction potential is the same as in eq. (5), but we only consider repulsive interactions, see SI. Both and provide the mechanical source for CIL.
For the definition of in eq. (1), we follow the simplest possible approach, which can be considered as a generalization of active Browning particles Fily and Marchetti (2012); Redner et al. (2013); Wysocki et al. (2014) to deformable objects Loewe et al. (2020). In this approach the propulsion speed is the same for each cell, but the direction of motion, determined by the angle is controlled by rotational noise , with diffusivity and a Wiener process , which results in . The growth rate is sampled from a Gaussian distribution with mean and variance determined by the product of a constant growth factor and CIP factors for cell-cell interaction and cell-confinement interaction . As a measure for contact, we consider the variational derivatives and and define the total interactions, and , which enter in
| (6) |
and defined in the same way, with replaced by . The parameter is a limiting factor, see SI.
Cell division is manually introduced if the cell size reaches a threshold. Following experimental evidence for epithelia tissue Wyatt et al. (2015), we divide the cell perpendicular to its elongation axis. The number of active cells is increased by one and the age of the two daughter cells start from zero. The overall size of the two daughter cells is slightly below that of the mother cell due to the necessity to introduce a diffuse interface between the two daughter cells. For further details, we refer to SI.
We employ a parallel and adaptive finite element method to solve the coupled systems of partial differential equations for . The algorithm is implemented in AMDiS Vey and Voigt (2007); Witkowski et al. (2015) and the algorithmic concepts to achieve parallel scaling with the number of cells are described in Praetorius and Voigt (2018). Briefly, they consider one core for the evolution of each cell and parallel concepts from particle methods to reduce the communication overhead due to cell-cell interaction. The coupled fourth order equations in eq. (1) are split into coupled systems of second order equations for the phase field variables and the corresponding chemical potentials . The discretization in time is semi-implicit with a Taylor expansion of the double-well potential and an explicit treatment of the other non-linear terms. For the Cahn-Hilliard part we use an additional stabilisation Rätz et al. (2006); Backofen et al. (2019); Salvalaglio et al. (2021) to ensure and to increase accuracy.
We start with one circular cell, , in the centre of a circular confinement within the computational domain, . The size of the cell is below the dividing threshold. Numerical parameters, such as grid resolution and time step are considered as large as possible to ensure stable behaviour and resolution of the essential physics. The grid spacing within the diffuse boundary is , in the interior of each cell and in the exterior with increasing values for regions far away from the interior. The time step is chosen as . Other parameters, if not specified differently, are set as , , , , , and . We compare non-migrating and migrating cells () and consider and . Fig. 2 shows the growth, expressed through the radius of a circle with the same area as the cell colony. The radius grows linearly, and slightly faster for the migrating cells. This linear growth regime corresponds to a constant boundary velocity of the cell colony and is consistent with experimental results for confluent MDCK cells Puliafito et al. (2012) and theoretical approaches, in which, due to CIP, only the cells at the boundary are able to grow and divide Schnyder et al. (2020). In order to further analyse the effect of CIL and CIP on colony growth, we consider the age and the stress of each cell, see Fig. 3. Stress is measured in terms of the total interaction , normalized by the limiting factor . While for the non-migrating case the age of the cells is more or less decreasing with increasing radius of the cell colony and the inner cells develop a homogeneous stress distribution, both age and stress are more heterogeneously distributed in the migrating case, which is quantified in the age/stress diagrams. For cells with age below five, both diagrams are similar, indicating an increase of stress with age. But for cells with age above five, the diagrams differ. The homogeneous stress distribution for non-migrating cells results in a horizontal line at . For migrating cells, this is less pronounced with larger stresses emerging, corresponding to a heterogeneous distribution. Due to migration cells can generate space, which allow them to grow further if the threshold for cell division is not reached. This increases the cell density and leads to stresses with .
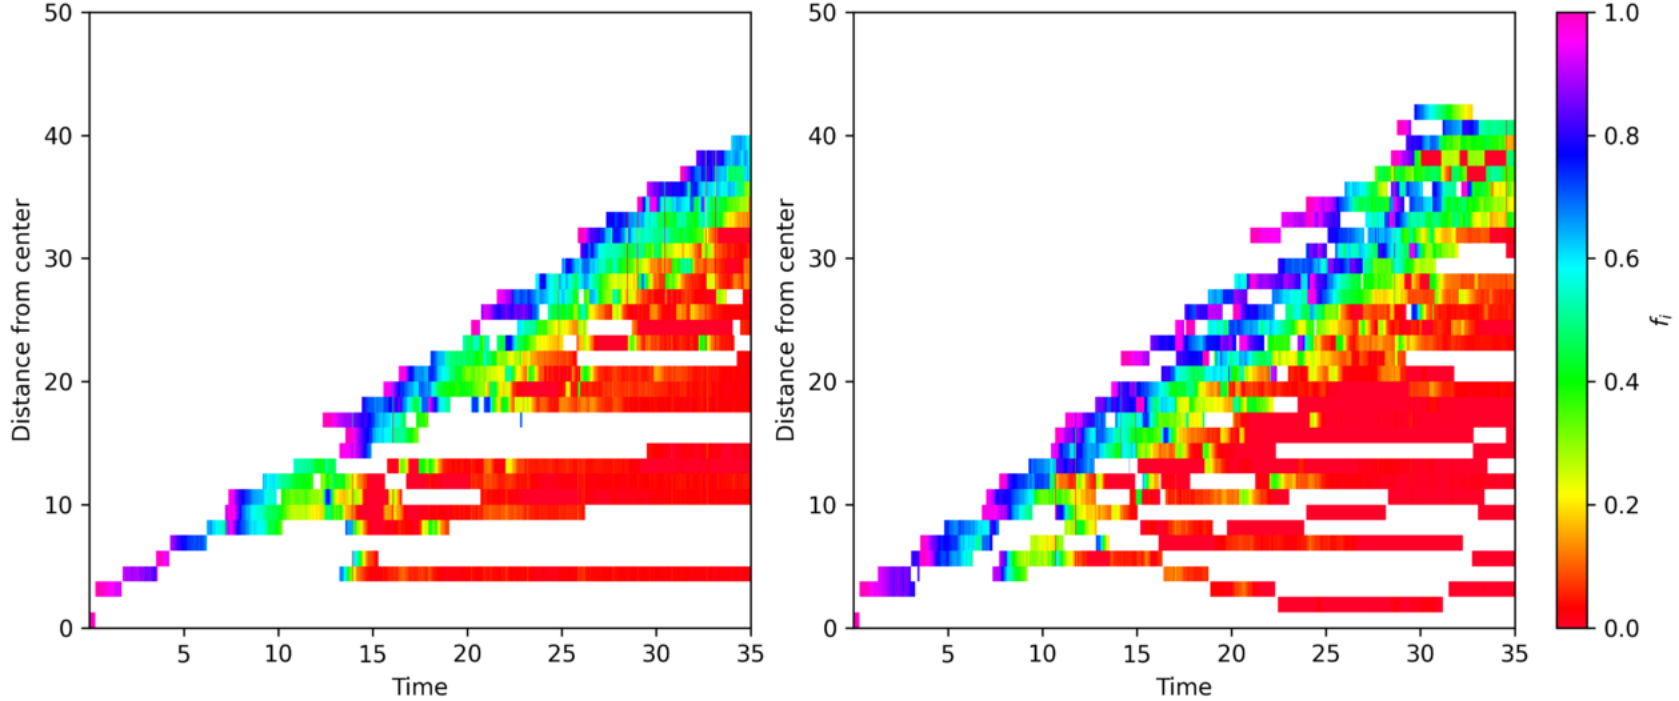
The increased heterogeneity for the migrating case also becomes evident if the cell properties are averaged according to their position in the colony with respect to the center. Fig. 4 shows the magnitude of the cell velocity and the measure for cell-cell interaction . While spatial-temporal distribution of the cell-cell interaction is similar for the non-migrating and migrating cases, the cell velocities strongly differ. Not only within the centre of the colony, where the non-migrating cells are more or less stationary and significant movement is present for the migrating cells, but also on the colony boundary, which shows significantly larger velocities for the migrating cells.
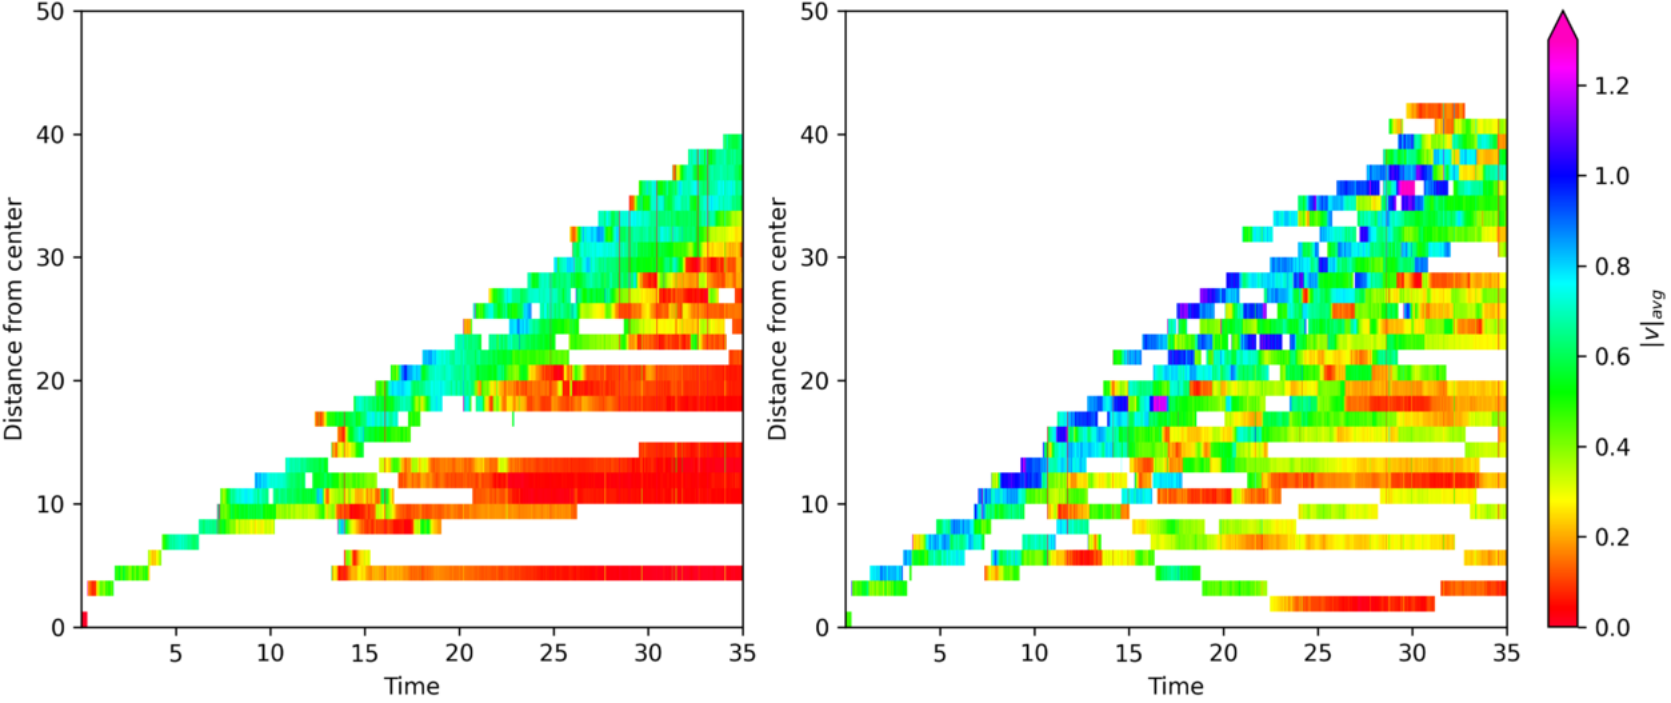
According to Schnyder et al. (2020) this larger velocity at the colony boundary is the main reason for the increased growth rate in the migrating case. It is argued that at long times the colony expands as fast as the cells on the boundary are able to migrate away from the colony centre.
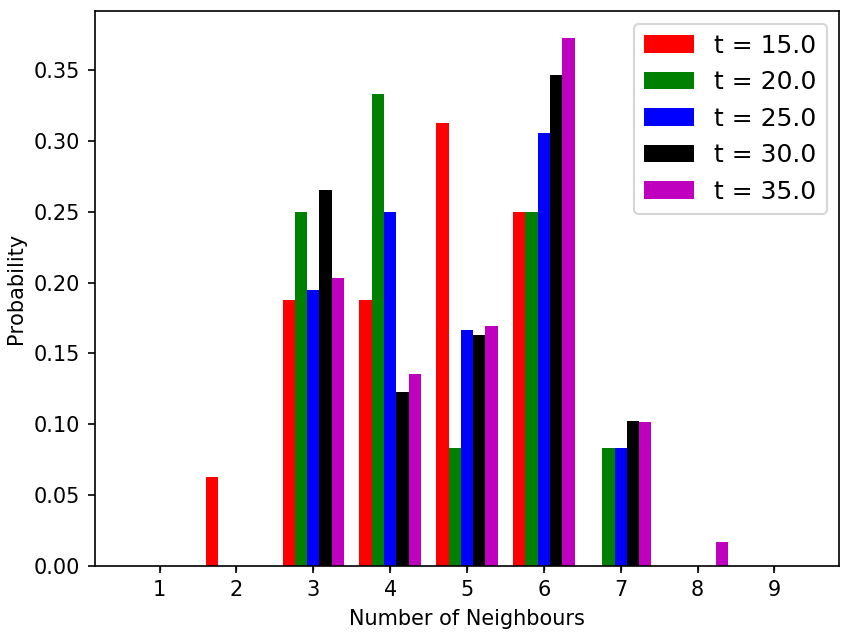
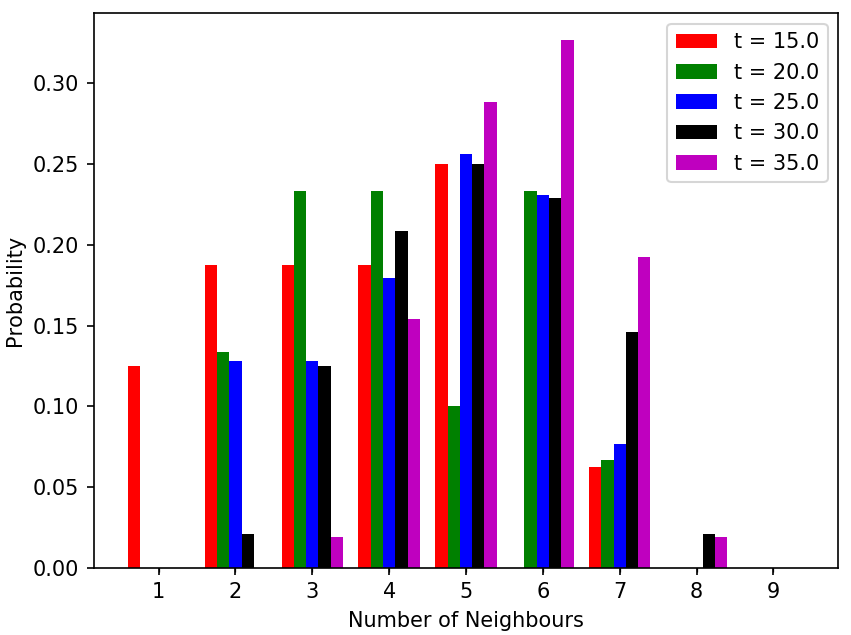
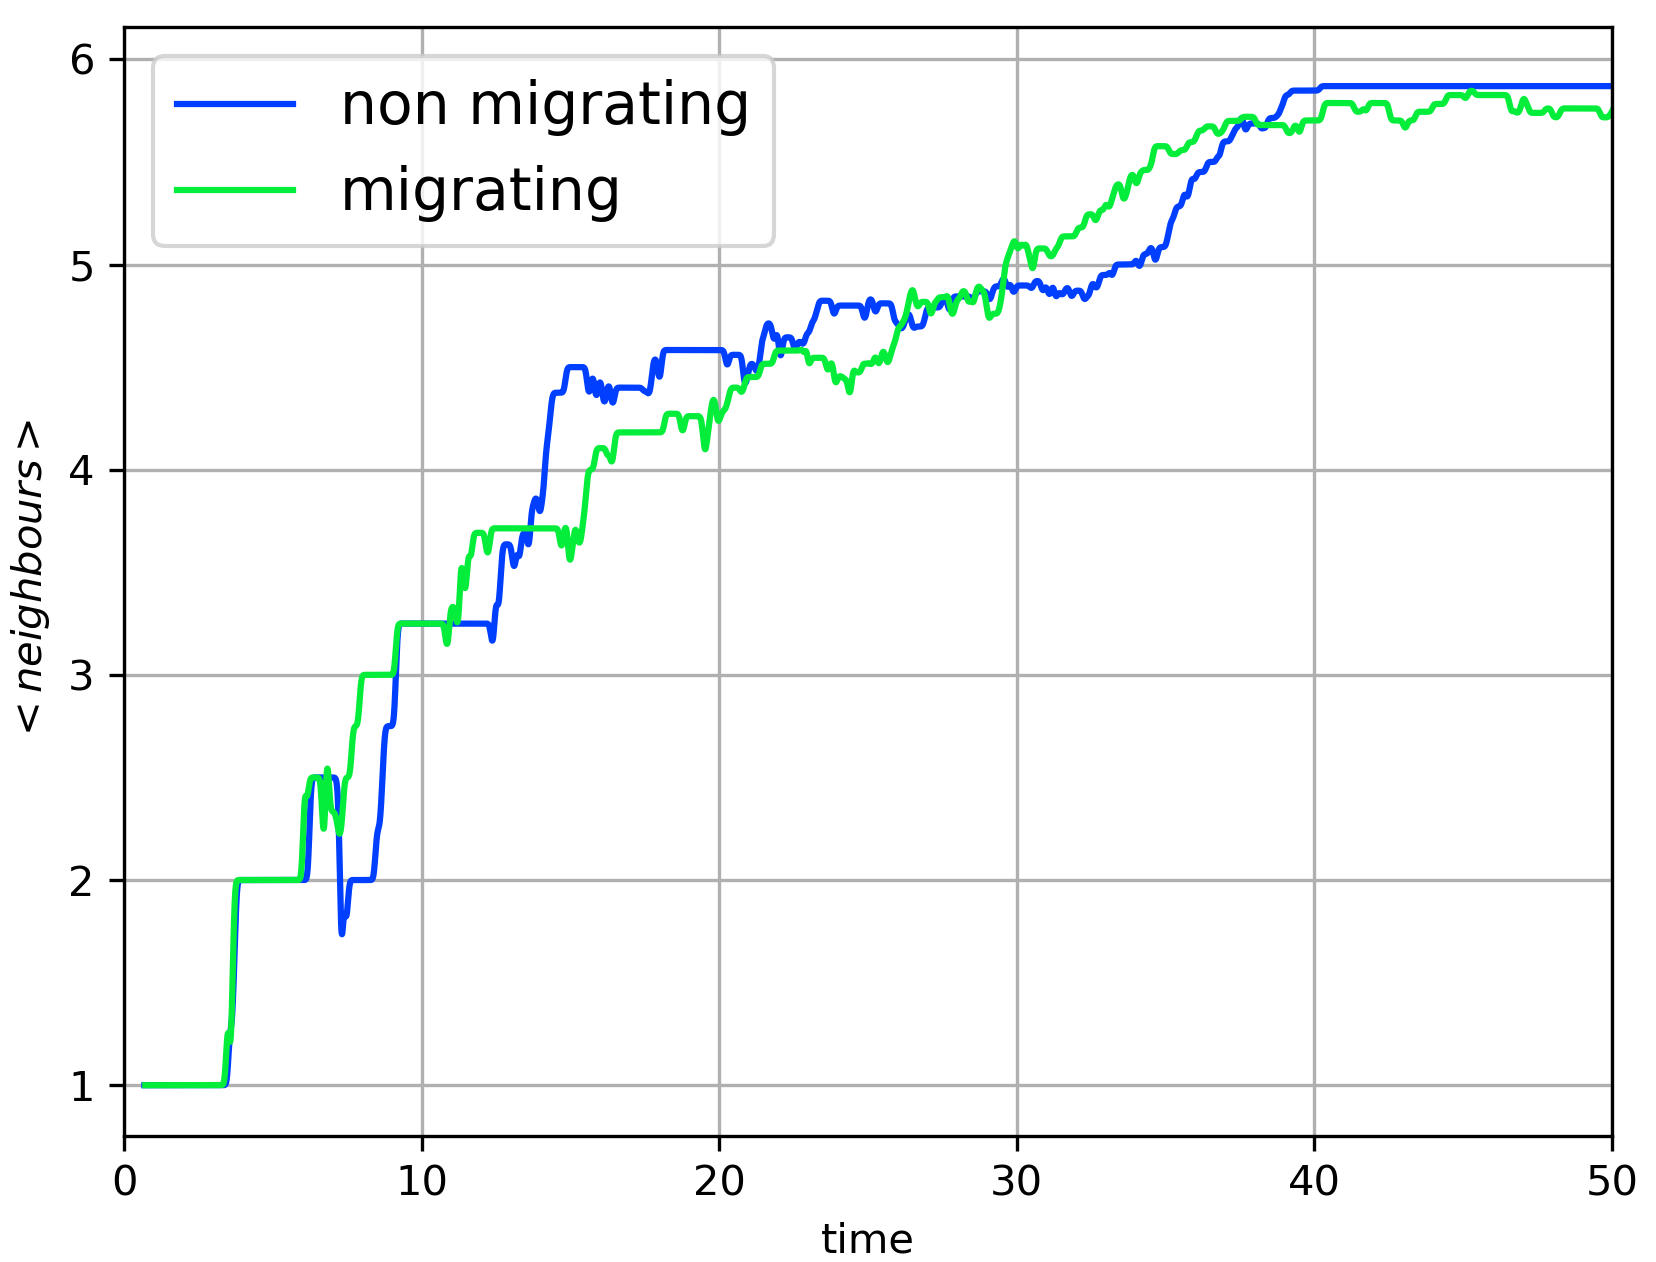
Another measure concerns the topology of the cells in the colony. We consider the coordination number, the number of nearest neighbours, for each cell and calculate the histogram, see Fig. 5. The data is shown for different time instances. As time progresses, cells with six neighbours become the most prevalent. However, also the histogram shows the difference between the non-migrating and migrating cases. While for non-migrating cells an equilibrium-like homogeneous configuration with cells with mainly six neighbors emerges, the structure of the migrating cells is more heterogeneous with significantly more cells with five and seven neighbors. This again is in agreement with measurements for MDCK cells Puliafito et al. (2012). In contrast to the simplified models in Schnyder et al. (2020), which overestimate configurations with six neighbours at long times, our simulations lead to more realistic distributions. This might be due to the larger flexibility in cell deformation. The reached distribution for migrating cells is also in good agreement with the mathematically predicted equilibrium distribution of cellular polygons, which is empirically confirmed in tissue samples from vertebrate, arthropod and cnidarian organisms Gibson et al. (2006). Detailed validations on neighbor distributions in related multiphase field models without growth and division have already been shown in Wenzel et al. (2019). On average, the number of neighbors evolves similarly for the non-migrating and the migrating cells, see Fig. 5(right), and reaches six, which is consistent with Euler’s polyhedral formula. This shows that independent of migration, a predominantly hexagonal topology emerges as a consequence of cell division, a phenomena also observed in plant tissue Lewis (1926).
In summary, we have used a multiphase field model to explore the effect of CIL and CIP in growing colonies of non-migrating and migrating cells. The extension of the multiphase field model, as a minimal cell-based model, which accounts for cell deformability and force transmission at cell-cell contacts, to growth and cell division, allows to analyse the impact of contact inhibition. While CIL is naturally considered in the multiphase field model, CIP is included by linking cellular growth to the short-range interaction with neighboring cells, which is realised by considering the chemical potential associated with the interaction energies. The stochastic behaviour of migration and growth on a single cell level manifests in global patterns in a multicellular context. The emerging neighbor distribution in the growing colony is a result of cell division and in good agreement with experimental measurements for various organisms. The proposed model leads to the typical linear boundary growth of the colony radius and allows for various investigations concerning cell velocity, age and stress distributions. They all significantly differ between non-migrating and migrating cells and ask for experimental validations.
A.V. acknowledges support by the German Research Foundation (DFG) under Grant FOR3013. We further acknowledge computing resources provided at Jülich Supercomputing Center under Grant No. PFAMDIS.
References
- Hakim and Silberzan (2017) V. Hakim and P. Silberzan, “Collective cell migration: a physics perspective,” Rep. Prog. Phys. 80, 076601 (2017).
- Alert and Trepat (2020) R. Alert and X. Trepat, “Physical models of collective cell migration,” Ann. Rev. Cond. Matt. Phys. 11, 77–101 (2020).
- Moure and Gomez (2021) A. Moure and H. Gomez, “Phase-field modeling of individual and collective cell migration,” Arch. Comput. Meth. Eng. 28, 311–344 (2021).
- Nonomura (2012) M. Nonomura, “Study on multicellular systems using a phase field model,” PLoS ONE 7, e33501 (2012).
- Camley et al. (2014) B.A. Camley, Y. Zhang, Y. Zhao, B. Li, E. Ben-Jacob, H. Levine, and W.-J. Rappel, “Polarity mechanisms such as contact inhibition of locomotion regulate persistent rotational motion of mammalian cells on micropatterns,” Proc. Nat. Acad. Sci. (USA) 111, 14770–14775 (2014).
- Palmieri et al. (2015) B. Palmieri, Y. Bresler, D. Wirtz, and M. Grant, “Multiple scale model for cell migration in monolayers: Elastic mismatch between cells enhances motility,” Sci. Rep. 5, 11745 (2015).
- Mueller et al. (2019) R. Mueller, J.M. Yeomans, and A. Doostmohammadi, “Emergence of active nematic behavior in monolayers of isotropic cells,” Phys. Rev. Lett. 122, 048004 (2019).
- Wenzel et al. (2019) D. Wenzel, S. Praetorius, and A. Voigt, “Topological and geometrical quantities in active cellular structures,” J. Chem. Phys. 150, 164108 (2019).
- Loewe et al. (2020) B. Loewe, M. Chiang, D. Marenduzzo, and M.C. Marchetti, “Solid-liquid transition of deformable and overlapping active particles,” Phys. Rev. Lett. 125, 038003 (2020).
- Wenzel and Voigt (2021) D. Wenzel and A Voigt, “Multiphase field models for collective cell migration,” arXiv , 2106.10552 (2021).
- Peyret et al. (2019) G. Peyret, R. Mueller, J. d’Alessandro, S. Begnaud, P. Marcq, R.-M. Mege, J.M. Yeomans, A. Doostmohammadi, and B. Ladoux, “Sustained oscillations of epithelial cell sheets,” Biophys. J. 117, 464–478 (2019).
- Balasubramaniam et al. (2021) L. Balasubramaniam, A. Doostmohammadi, T.B. Saw, G.H.N.S. Narayana, R. Mueller, T. Dang, M. Thomas, S. Gupta, S. Sonam, A.S. Yap, Y. Toyama, R.-M. Mége, J.M. Yeomans, and B. Ladoux, “Investigating the nature of active forces in tissues reveals how contractile cells can form extensile monolayers,” Nature Materials (2021), 10.1038/s41563-021-00919-2.
- Stramer and Mayor (2017) B. Stramer and R. Mayor, “Mechanisms and in vivo functions of contact inhibition of locomotion,” Nature Rev. Mol. Cell Bio. 18, 43–55 (2017).
- Fisher and Yeh (1967) H.W. Fisher and J. Yeh, “Contact inhibition in colony formation,” Science 155, 581–& (1967).
- Stoker and Rubin (1967) M.G.P. Stoker and H. Rubin, “Density dependent inhibition of cell growth in culture,” Nature 215, 171–172 (1967).
- Marth and Voigt (2016) W. Marth and A. Voigt, “Collective migration under hydrodynamic interactions: a computational approach,” Interf. Focus 6, 20160037 (2016).
- Zwicker et al. (2017) D. Zwicker, R. Seyboldt, C.A. Weber, A.A. Hyman, and F. Juelicher, “Growth and division of active droplets provides a model for protocells,” Nature Physics 13, 408–413 (2017).
- Li and Cates (2020) I.Y. Li and M.E. Cates, “Non-equilibrium phase separation with reactions: a canonical model and its behaviour,” J. Stat. Mech. 2020, 053206 (2020).
- Drasdo et al. (1995) D. Drasdo, R. Kree, and J.S. McCaskill, “Monte-Carlo approach to tissue-cell populations,” Phys. Rev. E 53, 6635–6657 (1995).
- Basan et al. (2013) M. Basan, J. Elgeti, E. Hannezo, W.-J. Rappel, and H. levine, “Alignment of cellular motility forces with tissue flow as a mechanism for efficient wound healing,” Proc. Nat. Acd. Sci. (USA) 110, 2452–2459 (2013).
- Aland et al. (2015) S. Aland, H. Hatzikirou, J. Lowengrub, and A. Voigt, “A mechanistic collective cell model for epithelial colony growth and contact inhibition,” Biophys. J. 109, 1347–1357 (2015).
- Puliafito et al. (2012) A. Puliafito, L. Hufnagel, P. Neveu, S. Streichan, A. Sigal, D.K. Fygenson, and B.I. Shraiman, “Collective and single cell behavior in epithelial contact inhibition,” Proc. Nat. Acd. Sci. (USA) 109, 739–744 (2012).
- Doxzen et al. (2013) K. Doxzen, S.R.K. Vedula, M.C. Leong, H. Hirata, N.S. Gov, A.J. Kabla, Be. Ladoux, and C.T. Lim, “Guidance of collective cell migration by substrate geometry,” Integ. Bio. 5, 1026–1035 (2013).
- George et al. (2017) M. George, F. Bullo, and O. Campas, “Connecting individual to collective cell migration,” Sci. Rep. 7, 9720 (2017).
- Schnyder et al. (2020) S.K. Schnyder, J.J. Molina, and R. Yamamoto, “Control of cell colony growth by contact inhibition,” Sci. Rep. 10, 6713 (2020).
- Marth et al. (2015) W. Marth, S. Praetorius, and A. Voigt, “A mechanism for cell motility by active polar gels,” J. Roy. Soc. Interf. 12, 20150161 (2015).
- Fily and Marchetti (2012) Y. Fily and M.C. Marchetti, “Athermal phase separation of self-propelled particles with no alignment,” Phys. Rev. Lett. 108, 235702 (2012).
- Redner et al. (2013) G.S. Redner, A. Baskaran, and M.F. Hagan, “Reentrant phase behavior in active colloids with attraction,” Phys. Rev. E 88, 012305 (2013).
- Wysocki et al. (2014) A. Wysocki, R.G. Winkler, and G. Gompper, “Cooperative motion of active Brownian spheres in three-dimensional dense suspensions,” EPL 105, 48004 (2014).
- Wyatt et al. (2015) T.P.J. Wyatt, A.R. Harris, M. Lam, Q. Cheng, J. Bellis, A. Dimitracopoulos, A.J. Kabla, G.T. Charras, and B. Baum, “Emergence of homeostatic epithelial packing and stress dissipation through divisions oriented along the long cell axis,” Proc. Nat. Acad. Sci. (USA) 112, 5726–5731 (2015).
- Vey and Voigt (2007) S. Vey and A. Voigt, “AMDiS: Adaptive multidimensional simulations,” Comput. Vis. Sci. 10, 57–67 (2007).
- Witkowski et al. (2015) T. Witkowski, S. Ling, S. Praetorius, and A. Voigt, “Software concepts and numerical algorithms for a scalable adaptive parallel finite element method,” Adv. Comput. Math. 41, 1145–1177 (2015).
- Praetorius and Voigt (2018) S. Praetorius and A. Voigt, “Collective cell behavior - a cell-based parallelization approach for a phase field active polar gel model,” in NIC Symposium 2018, edited by K. Binder, M. Müller, and A. Trautmann (2018) pp. 369–376.
- Rätz et al. (2006) A. Rätz, A. Ribalta, and A. Voigt, “Surface evolution of elastically stressed films under deposition by a diffuse interface model,” J. Comput. Phys. 214, 187–208 (2006).
- Backofen et al. (2019) R. Backofen, S. M. Wise, M. Salvalaglio, and A. Voigt, “Convexity splitting in a phase field model for surface diffusion,” Int. J. Math. Anal. Mod. 16, 192–209 (2019).
- Salvalaglio et al. (2021) M. Salvalaglio, A. Voigt, and S. M. Wise, “Doubly degenerate diffuse interface models of surface diffusion,” Math. Meth. Appl. Sci. 44, 5385–5405 (2021).
- Gibson et al. (2006) M.C. Gibson, A.B. Patel, R. Nagpal, and N. Perrimon, “The emergence of geometric order in proliferating metazoan epithelia,” Nature 442, 1038–1041 (2006).
- Lewis (1926) F.T.. Lewis, “The effect of cell division on the shape and size of hexagonal cells,” Anat. Rec. 33, 331–355 (1926).