Chemo-Mechanical Model of SEI Growth on Silicon Electrode Particles
Abstract
Silicon anodes promise high energy densities of next-generation lithium-ion batteries, but suffer from shorter cycle life.
The accelerated capacity fade stems from the repeated fracture and healing of the solid-electrolyte interphase (SEI) on the silicon surface.
This interplay of chemical and mechanical effects in SEI on silicon electrodes causes a complex aging behavior.
However, so far, no model mechanistically captures the interrelation between mechanical SEI deterioration and accelerated SEI growth.
In this article, we present a thermodynamically consistent continuum model of an electrode particle surrounded by an SEI layer.
The silicon particle model consistently couples chemical reactions, physical transport, and elastic deformation.
The SEI model comprises elastic and plastic deformation, fracture, and growth.
Capacity fade measurements on graphite anodesand in-situ mechanical SEI measurements on lithium thin films provide parametrization for our model.
For the first time, we model the influence of cycling rate on the long-term mechanical SEI deterioration and regrowth.
Our model predicts the experimentally observed transition in time dependence from square-root-of-time growth during battery storage to linear-in-time growth during continued cycling.
Thereby our model unravels the mechanistic dependence of battery aging on operating conditions and supports the efforts to prolong the battery life of next-generation lithium-ion batteries.
1 Introduction
Lithium-ion batteries progressed to the benchmark battery technology for mobile applications owing to their superior energy density as well as longevity. The use of silicon anodes would further increase the energy density, because silicon has nearly the tenfold theoretical capacity of the currently used graphite 1, 2. However, this capacity gain comes at the cost of volume expansions up to 300% 3. These large expansions lead to high mechanical stresses, which deteriorate the anode and lead to faster aging and shorter battery lifetime 3, 4.
The main aging mechanism in lithium-ion batteries with graphite or silicon anodes is the formation and growth of the solid-electrolyte interphase (SEI) 5, 6, 7, 8, 9, 10, 11, 12, 13, 14, 15. The SEI forms during the first battery cycle, when the anode potential is drawn below the electrolyte reduction potential 16, 17, 18. This initiates reactions of electrolyte molecules with lithium ions, which form organic compounds like lithium ethylene dicarbonate and inorganic compounds like , and 19, 7, 20, 21, 22, 23, 24, 25, 26, 18, 27, 28, 29, 30, 31, 32. These products precipitate on the anode in a dual layer structure with a compact, inorganic inner layer and a porous, organic outer layer 33, 34 and thus form a nanometer thick and stable SEI at around vs. lithium metal 32. In subsequent cycles, this SEI shields the electrolyte from the low anode potentials and thereby enables a stable battery operation. However, the shielding effect is not perfect, so that the SEI continues to grow over time effectively lowering the usable capacity 6, 7.
Battery storage experiments revealed that long-term SEI growth follows a -time dependence pointing to a self-passivating process 35. As a possible long-term growth mechanism electrolyte diffusion 36, 37, 38, 39, 40, 41, 42, 43, 44, 45, 46, 30, electron conduction 36, 47, 48, 38, 40, 43, 49, 50, 51, 52, electron tunneling 36, 47, 53 and the diffusion of neutral lithium interstitial atoms 36, 47, 54, 55 were proposed. However, only the diffusion of electrons, e.g., via neutral lithium interstitial atoms, yields the experimentally observed voltage dependence of capacity fade 56, 36.
Besides the open circuit voltage of the anode, also the operating conditions during battery cycling strongly affect SEI growth. In a recent experiment, Attia et al. 57 showed the dependence of SEI growth on the magnitude and direction of applied current. Two mechanistic models describe this experimentally observed trend with good accuracy 47, 52. Implementing mechanistic SEI models to three-dimensional (3D) cell simulations gives further insights on the effect of battery operation on SEI growth. Using a purely reaction limited model for SEI growth Franco and coworkers 58 evaluated SEI heterogeneity in a 3D model, and discussed its dependence on electrode mesostructure. By leaving out the coupling to transport limitations this approach is only valid for the first few cycles contrary to the fully coupled models of Bazant, Horstmann, and Latz 52, 59, 60, 47.
Moreover, cycling experiments regularly reveal accelerated SEI growth on high capacity anodes like silicon due to large particle expansion and contraction (breathing) 34, 61. This geometrical change strains the SEI until it eventually fractures, which leads to formation of new SEI upon direct contact between electrolyte and electrode 31, 62, 63, 64. Several groups developed mechanistic models to describe the mechanical response of the SEI on battery cycling 65, 66, 67, 68, 69, 64, 14, 70, 71, 72, 73, 74, 75, 76, 77, 78, 79. However, these models focus on SEI mechanics and incorporate at most simple SEI growth models 65, 66, 67, 68, 14, 75, 79.
In this paper, we develop a detailed electrochemo-mechanical model to describe SEI mechanics and growth on a deforming electrode particle. We describe the chemomechanics of the electrode particle with a thermodynamically consistent model 80. The electrochemical part of the SEI model relies on our previous works on SEI growth 39, 38, 36, 47. The mechanical part of the SEI model describes the SEI as porous dual-layer structure 33, 34, which deforms elastic-perfectly plastic 81.
In the next section, we develop the model based on irreversible thermodynamics and show the details of its implementation in the subsequent section. Afterwards, we parametrize the model chemistry and mechanics with recent experiments 56, 81. Based on this parametrization we analyze the electrochemical and mechanical predictions of the model in the short- and long-term. Finally, we summarize our results and show possible extensions of our model.
2 Theory
This section briefly presents our model for coupling chemistry and mechanics in electrode particles covered by SEI. The reader is referred to section SI-1 in the supporting information for further details. We summarize the system of differential-algebraic equation, which we implement, in Equation SI-45 to Equation SI-51.
The deformations of the silicon electrode particle and the SEI during lithium intercalation and deintercalation is schematically depicted in Figure 1.
These are captured with deformation gradient , which relates the Lagrangian domain to the Eulerian domain . The volume expansion is given by its determinant . We divide the deformation into a reversible and an irreversible part 82.
We derive our model from non-equilibrium thermodynamics in Section SI-1 and find the following inequality for the dissipation in the Lagrangian frame, 83, 84, 85, 80, 86
| (1) | ||||
Equation 1 restricts the choice of constitutive equations for lithium flux and plastic flow . They depend on the corresponding forces, namely the chemical potential and the Mandel stress with the Cauchy stress 87, 88. In the following, we present our electrode particle and SEI growth models.
2.1 Electrode Particle Model
We use the chemo-mechanical electrode particle model discussed in our previous work 80. The particle deformation is completely reversible and consists of an elastic part due to mechanical stress and a chemical part resulting from changes in lithium concentration ,
| (2) |
The continuity equation 3,
| (3) |
defines the change of lithium concentration with the diffusion constant . The elastic deformation is determined by the momentum balance
| (4) |
with the first Piola–Kirchhoff stress tensor .
2.2 SEI Model
Now, we derive a model for coupled SEI growth and mechanics. We model the SEI as porous medium consisting of an incompressible SEI matrix and electrolyte inside its pores, as introduced by Single et al. 39, 38. The volume fraction of solid SEI, , characterizes the morphology at each point.
The deformation tensor describes the overall volume deformation and consists of three parts,
| (5) |
The first part is a reference deformation , which we introduce to set the stress free SEI configuration. Most importantly, the SEI deforms plastically and elastically .
SEI Growth
The SEI grows when electrons , lithium ions , and electrolyte molecules react. We simplify the multitude of possible SEI growth reactions to the formation of the most prominent SEI component from ,
| (6) |
with neutral lithium interstitials , the solvent EC, and gaseous byproducts .
We model the transport of electrons through the SEI as diffusion of localized electrons according to our previous works 36, 47. A prominent example are the aforementioned lithium interstitials 54, 55. The \ceLi^0 concentration in the SEI evolves according to
| (7) |
Here, the diffusion of \ceLi^0 through the SEI is described by the flux density , see subsection SI-1.3. The diffusing \ceLi^0 can react with the solvent inside the SEI pores and at the SEI-electrolyte interface. We model the available reaction surfaces with the specific surface area adapted from Single et al. 39, 38 and shown detailedly in section SI-4. In Equation 7, is the surface site density and is the rate of the SEI formation reaction in Equation 6,
| (8) |
Here, is the \ceLi^0 concentration inside the SEI and is a rate constant.
We capture formation of new SEI by tracking the SEI volume fraction in the Lagrangian frame ,
| (9) |
with the average molar volume of SEI components . In summary, our SEI growth model takes into account the coupling of transport and reaction processes.
SEI Mechanics
The SEI deforms elastoplastically until it eventually fractures as the electrode particle beneath expands and contracts. We determine the elastic deformation with the momentum balance inside the SEI
| (10) |
and determine from the micromechanical model for porous solids of Danielsson et al. 89, see Equation SI-37.
Based on the stress , we proceed to develop a model for plastic deformation and fracture of the SEI. For the plastic deformation we introduce the yield function , which tends to zero if the SEI reaches its yield criterion. The fracture depends on the damage variable , which describes the degree of deterioration and reaches from (intact) to (broken). We couple the damage variable to the yield function with the Gurson-Tvergaard-Needleman approach 90, 91, 92, 93
| (11) |
Here is the deviatoric part of the adapted Mandel stress inside the SEI and is the yield stress 87, 88, 94. The damage variable depends on the SEI porosity by Equation 12 93.
| (12) |
The critical SEI porosity accounts for pore coalescence, which accelerates mechanical degradation, if the SEI porosity is above the critical porosity . The fracture SEI porosity describes the porosity at which the SEI ultimately breaks with .
In Figure 2, we show the yield surface , at which the SEI flows plastically.
We observe the classical von-Mises yield surface for , which withstands arbitrary large hydrostatic stress and only depends on the deviatoric stress. Damage causes the yield surface to shrink until it converges to the stress state for .
To describe the plastic flow upon reaching this yield surface, we rely on the maximum plastic dissipation postulate 95, 96, 97, 98, 87, 88 as additional restriction to the principle of non-negative dissipation, Equation 1. This postulate from plasticity theory constraints plastic flow to the normal direction of the yield surface and thus leads to the following constitutive equation 87, 88,
| (13) |
where the plastic multiplier is non-negative, , guaranteeing non-negativity of the dissipation rate in Equation 1. The plastic multiplier and the yield function additionally obey the Karush-Kuhn-Tucker condition 88. Thus, plastic flow is suppressed during elastic deformation, . For plastic deformation, , results from the consistency condition 88. Note that the plastic flow is not trace-free and thus not volume preserving, because the yield criterion, Equation 11 depends on the hydrostatic stress .
3 Parameterization
We assume a homogeneous electrode particle and a dual layer SEI consisting of a dense, inorganic inner layer with a thickness and a porous, organic outer layer 33, 34, 39, 38. We introduce a thickness dependent minimum porosity to enforce this morphology and stop the SEI reaction once this porosity is reached locally . To reduce the set of SEI parameters, we further assume that this minimum porosity corresponds to the critical porosity for pore coalescence , see Equation 12. Besides the minimum porosity , also Young’s modulus and the yield strength vary between both layers. To continuously transition these SEI properties , we use Equation 14,
| (14) | ||||
with the transition thickness . In Table SI-1 we list the parameters of our simulation 39, 38, 1, 99, 100, 36, 101, 102, 56, 81, 103. The further parametrization of the SEI on silicon is challenging due to the strong interrelation of electrochemical and mechanical effects. To reduce this complexity, we adopt two experiments, one for each submodel. First, we use the experiments of Keil et al. 56 to parametrize the electrochemical part of the SEI model. These experiments were conducted on full cells with a graphite anode during storage so that the influence of mechanics is negligible. Second, the experiments of Yoon et al. 81 parametrize the mechanical part of our model. In their experiments, they grow SEI on a thin lithium film and then mechanically strain it. Thus, the experiment is almost independent from electrochemical effects. The parametrization with other substrates than silicon introduces additional uncertainties to our model. The choice of substrate determines the nucleation properties, but the growth mechanism should be independent from the substrate. However, the evolving SEI composition and structure can, of course, be affected by the innermost nucleation sites of the SEI.
Electrochemical SEI Growth
We rely on the experiments of Keil et al. 56 obtained with graphite anodes to parametrize the chemical SEI growth model. In their experiments, Keil et al. 56 stored batteries at different states of charge and measured the capacity fade after 9.5 months. In line with the approach of Single et al. 36, we subdivide the measured irreversible capacity fade into two parts. The first part is not SEI related and linear in time, the second part stems from the SEI and is predicted by our model.
In Figure 3 we compare the results of our simulation with the experimental storage data of Keil et al. 56.
We conclude that our model results in square-root-of-time growth during storage and describes the experimentally observed SoC-dependence well. Based on these growth parameters we now proceed to validate our mechanical SEI model.
SEI Mechanics
We rely on recent membrane bulge measurements to validate our mechanical SEI model 81. Yoon et al. 81 grow an SEI from a thin lithium film located on a polymeric support. By applying pressure, the resulting SEI/polymer film bulges. The pressure/bulge characteristics are then translated to stress-strain curves for the SEI in the circumferential direction. Moreover, atomic force microscopy visualizes cracks inside the SEI depending on its expansion. To mimic these experiments, we expand the SEI continuously with a constant velocity at the innermost SEI element and calculate the mean circumferential SEI stress and expansion .
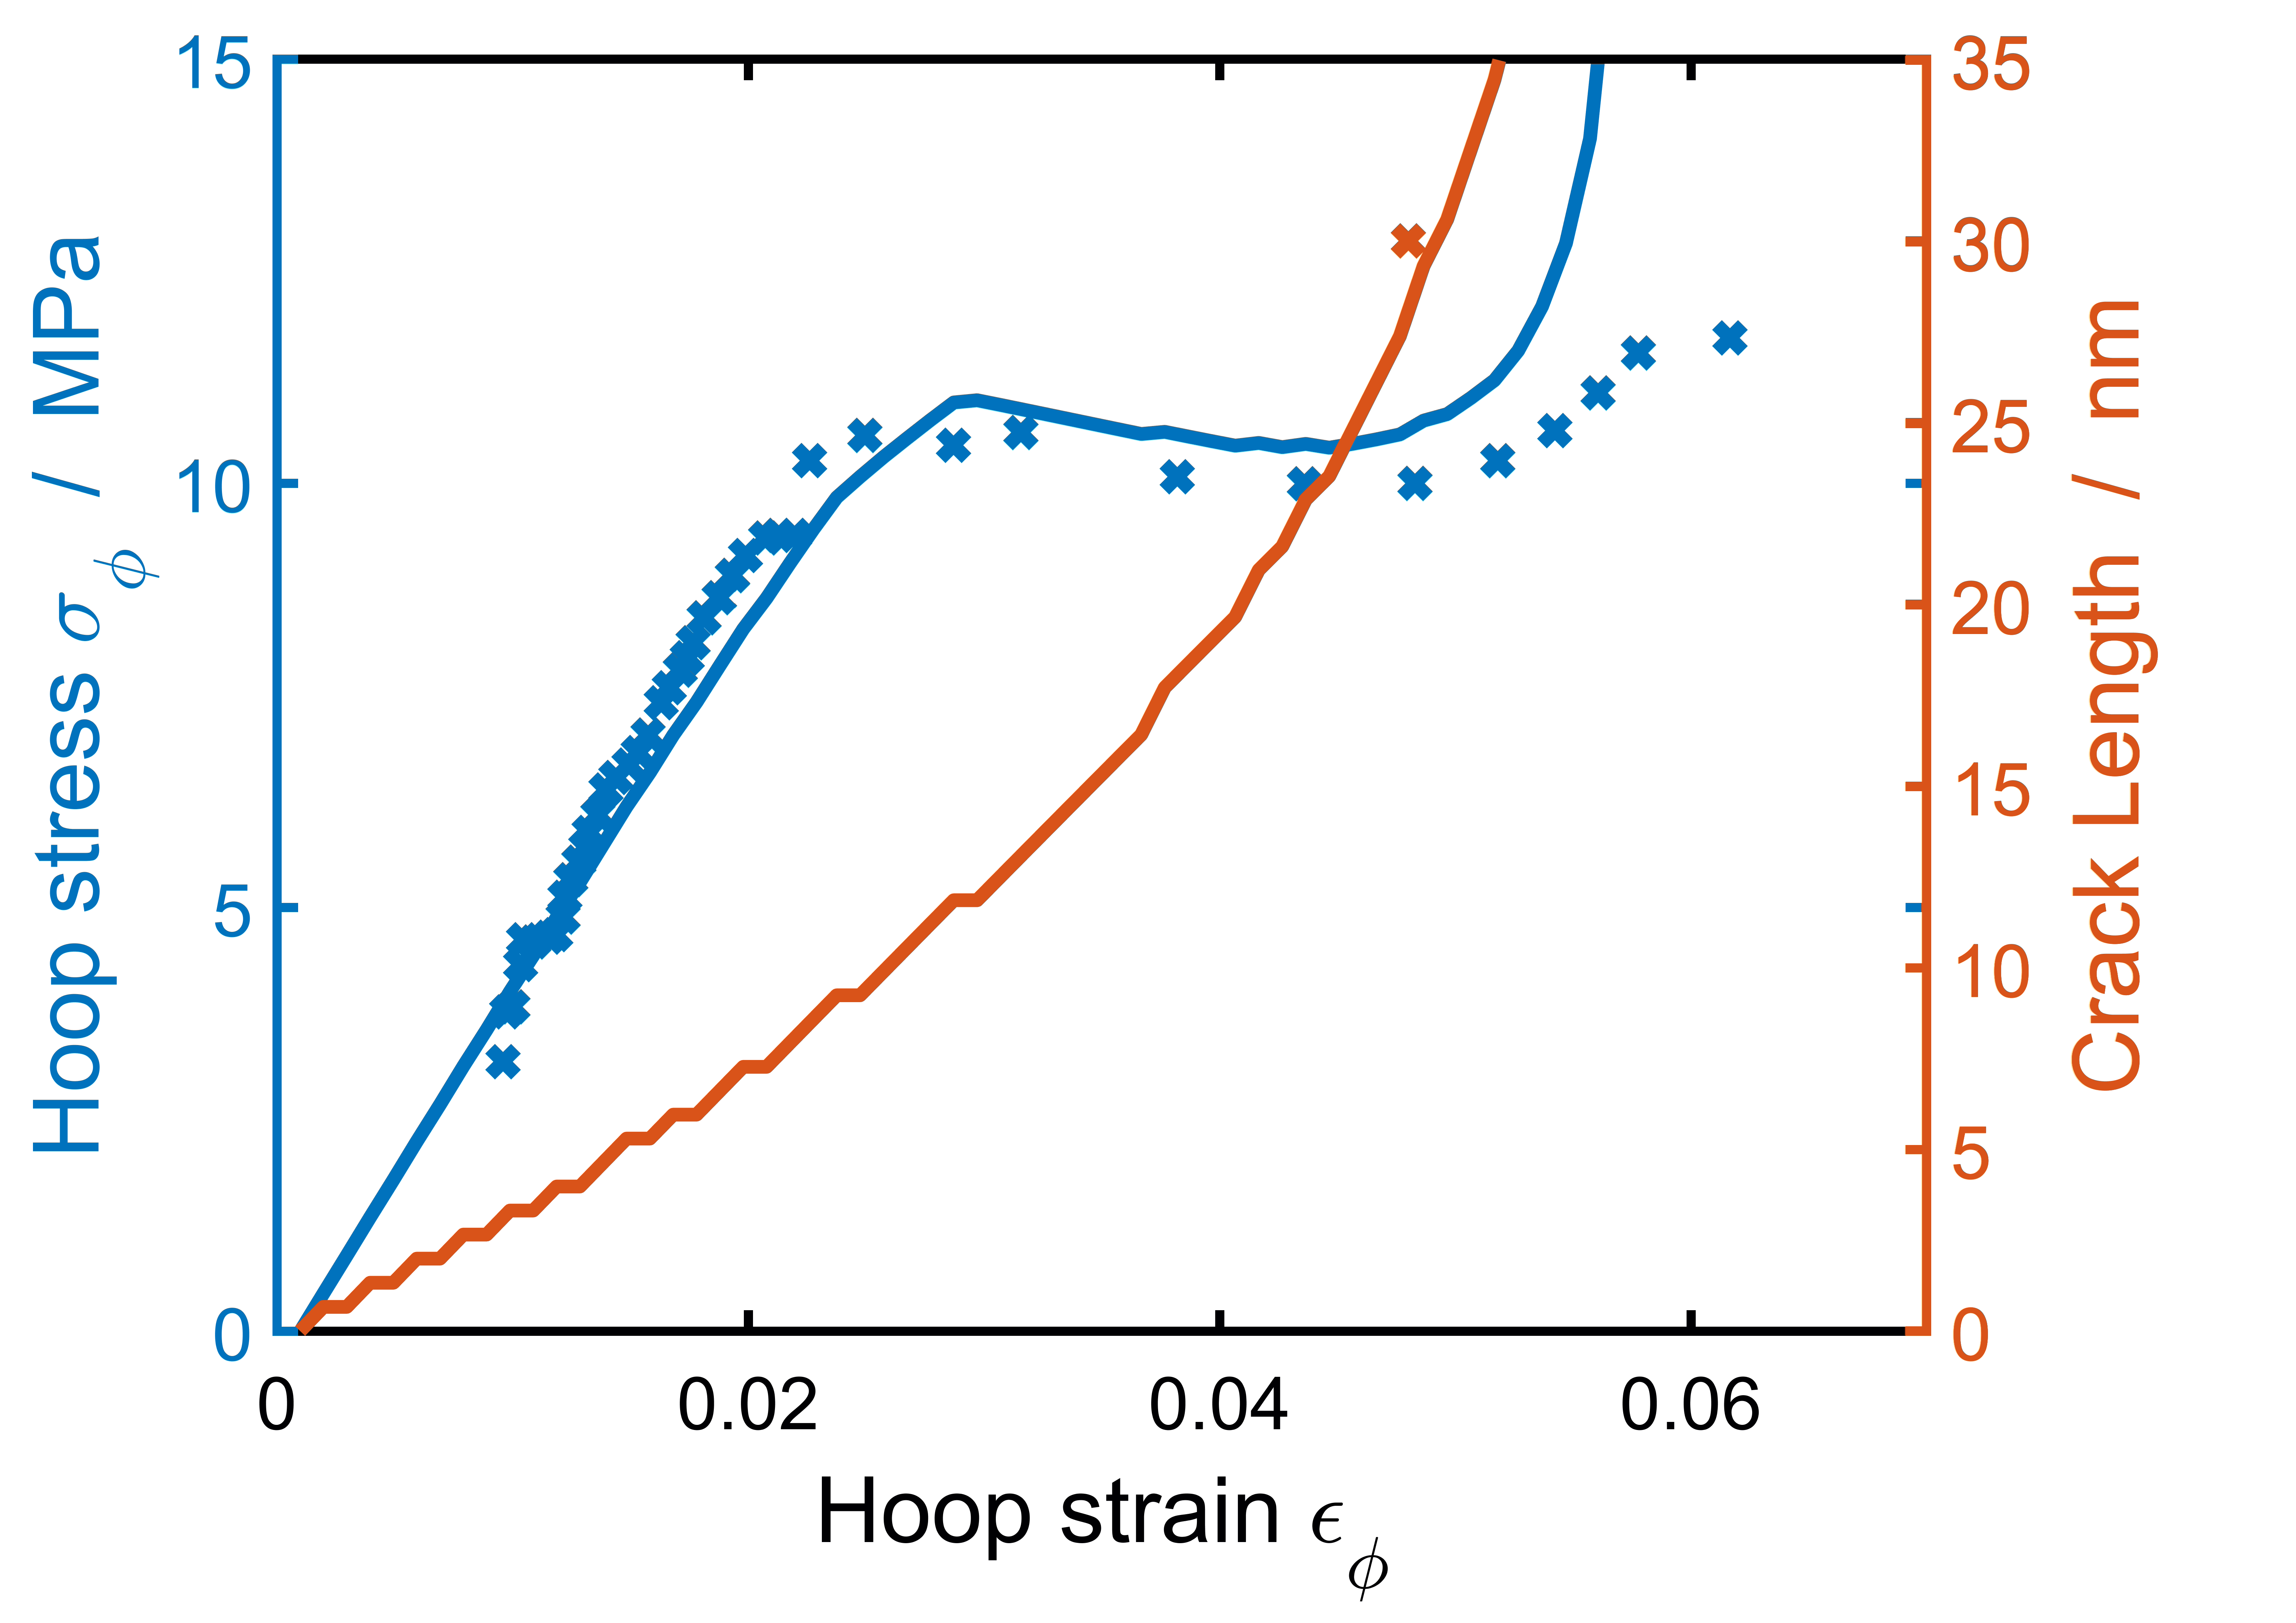
We see that our model agrees well with the experimental stress-strain curve. Furthermore, our SEI fracture model matches the experimentally observed crack evolution.
4 Results and Validation
In this section, we analyze the model outlined above. We start by studying the particle-SEI geometry during one cycle in section 4.1. Next, we take a closer look at the mechanical response of silicon particle and SEI in section 4.2. Subsequently, we analyze the SEI growth during one cycle in section 4.3 and finally look at the long-term SEI growth 4.4. Unless otherwise specified, the particles were cycled at 1C between and .
4.1 Geometry
Lithiation and delithiation strongly affect particle and SEI geometry. In Figure 5, we show six distinct configurations of our spherical symmetric simulation domain during a battery cycle.
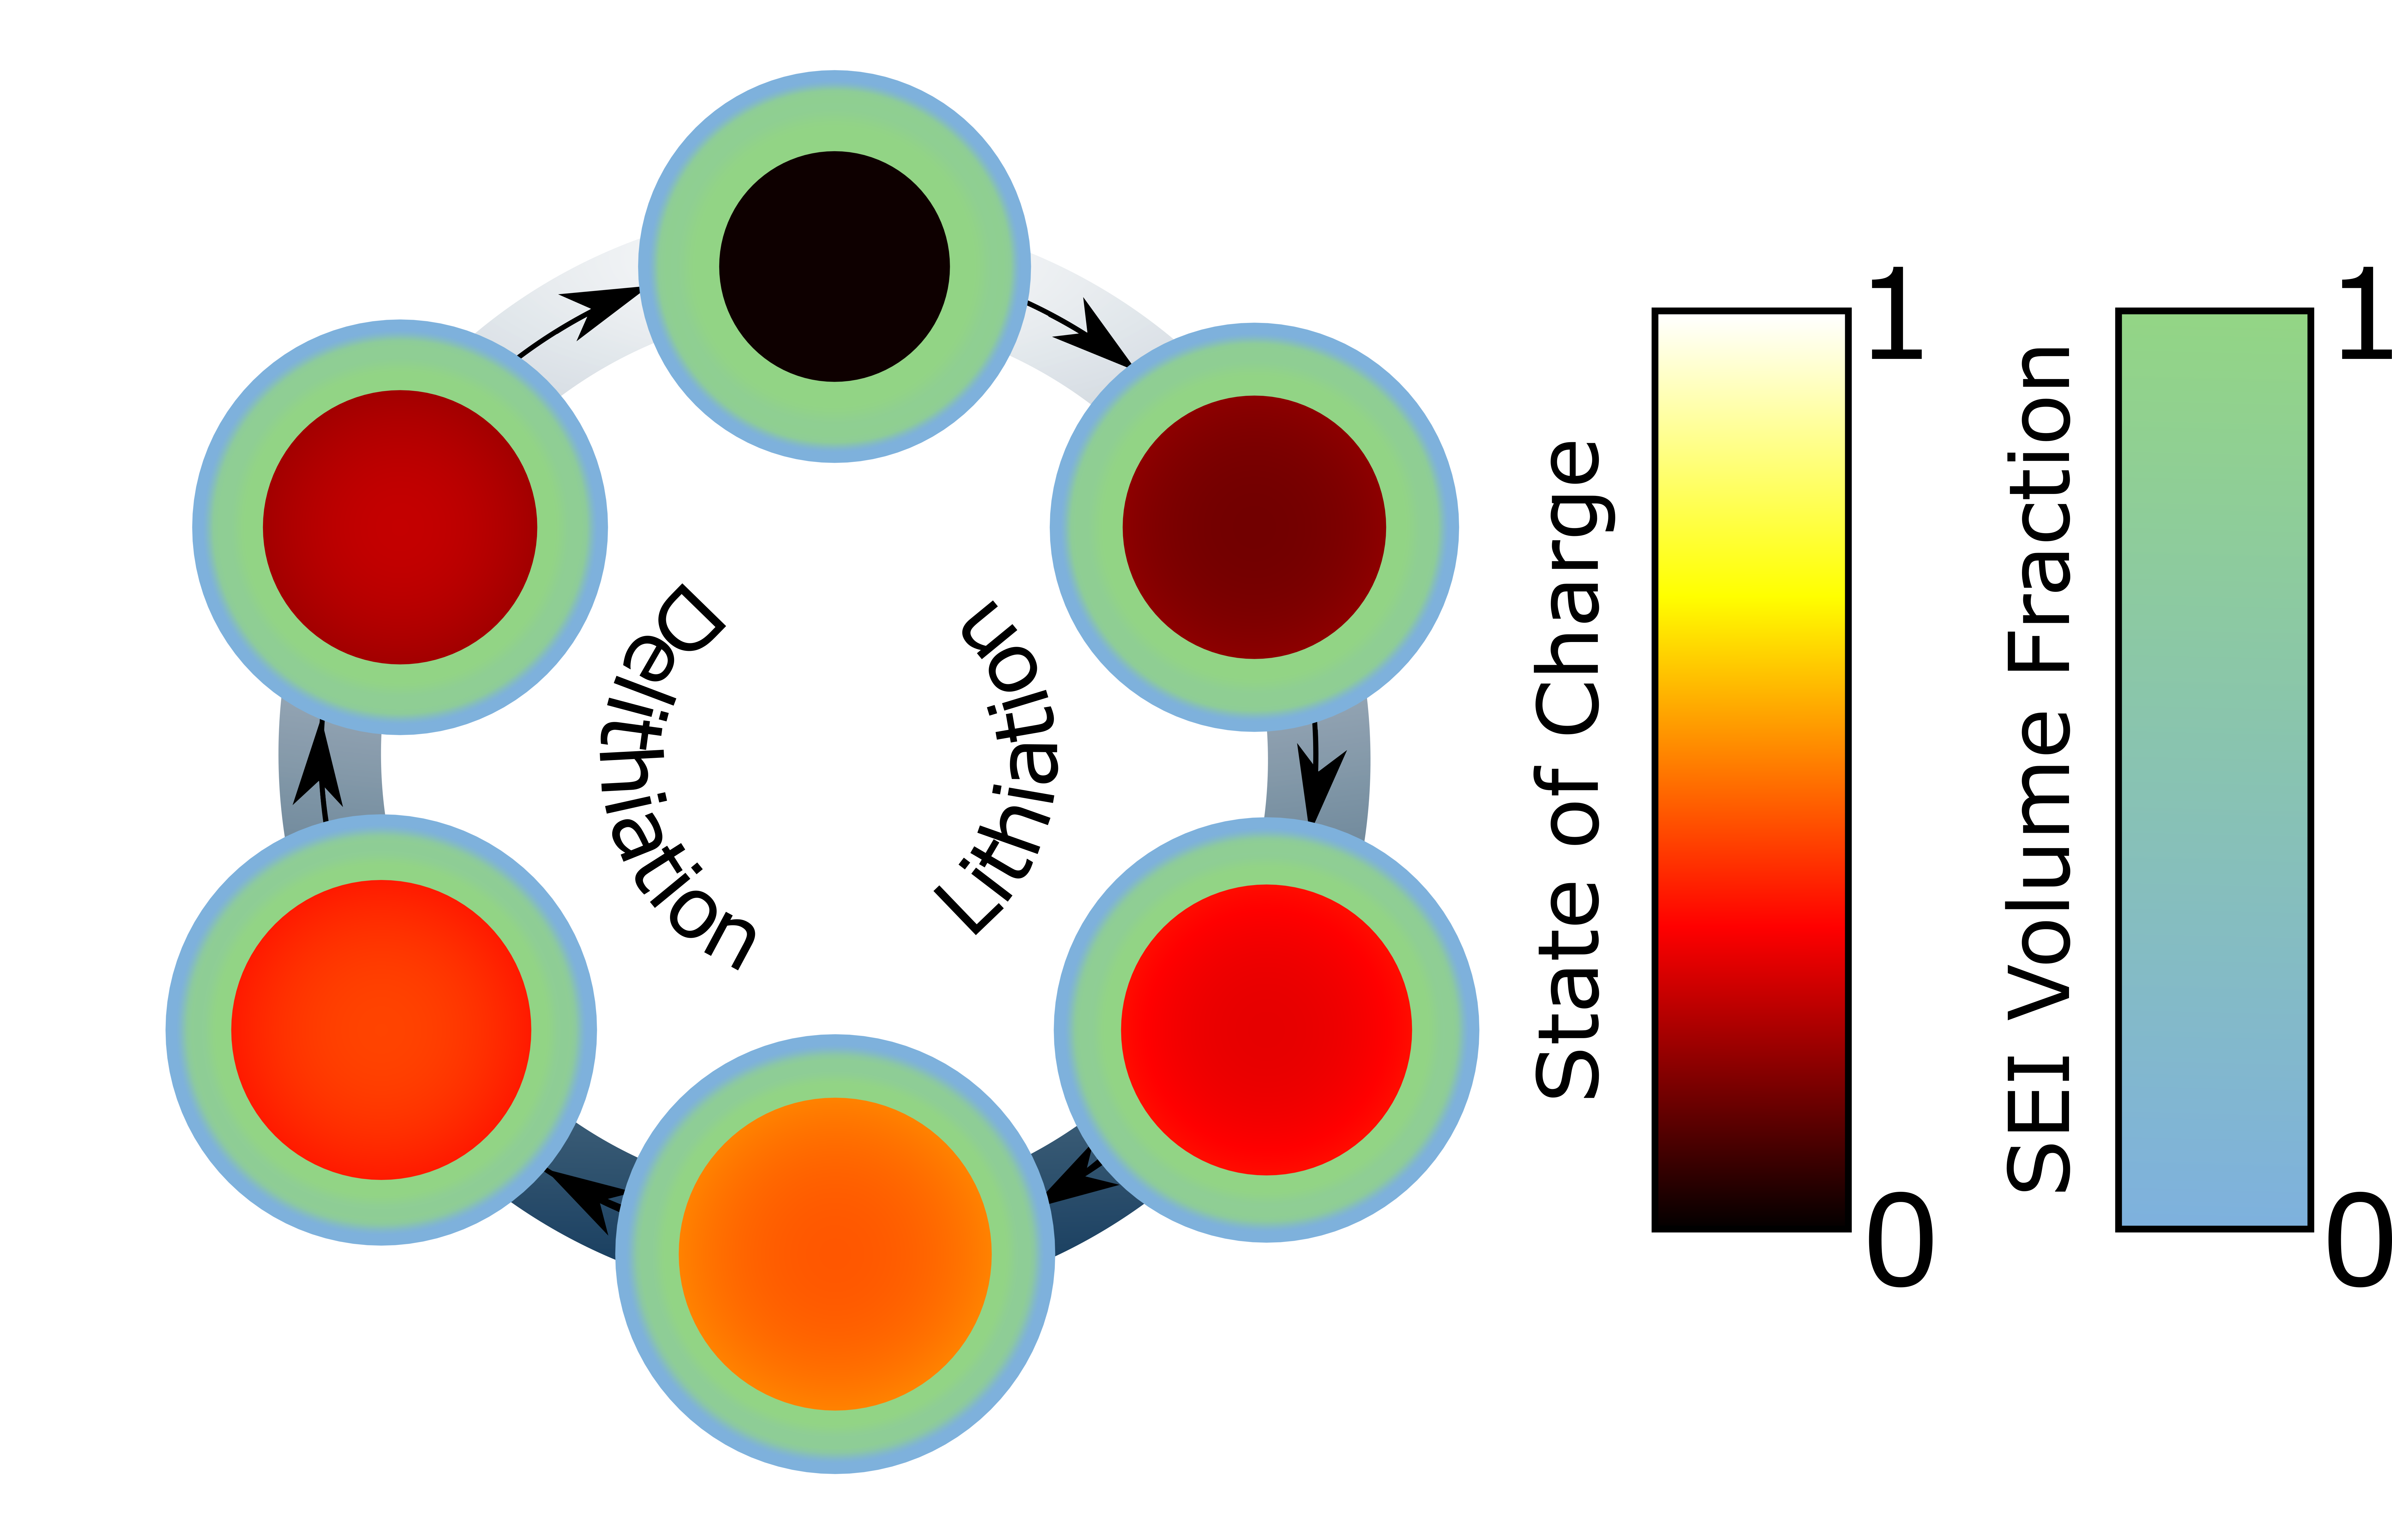
We see that the varying state of charge induces volume changes inside the electrode particle according to the chemical expansion . The surrounding SEI responds to this volume change by thinning for high SoC and thickening for low SoC.
We further resolve the geometrical response of the SEI in Figure 6.
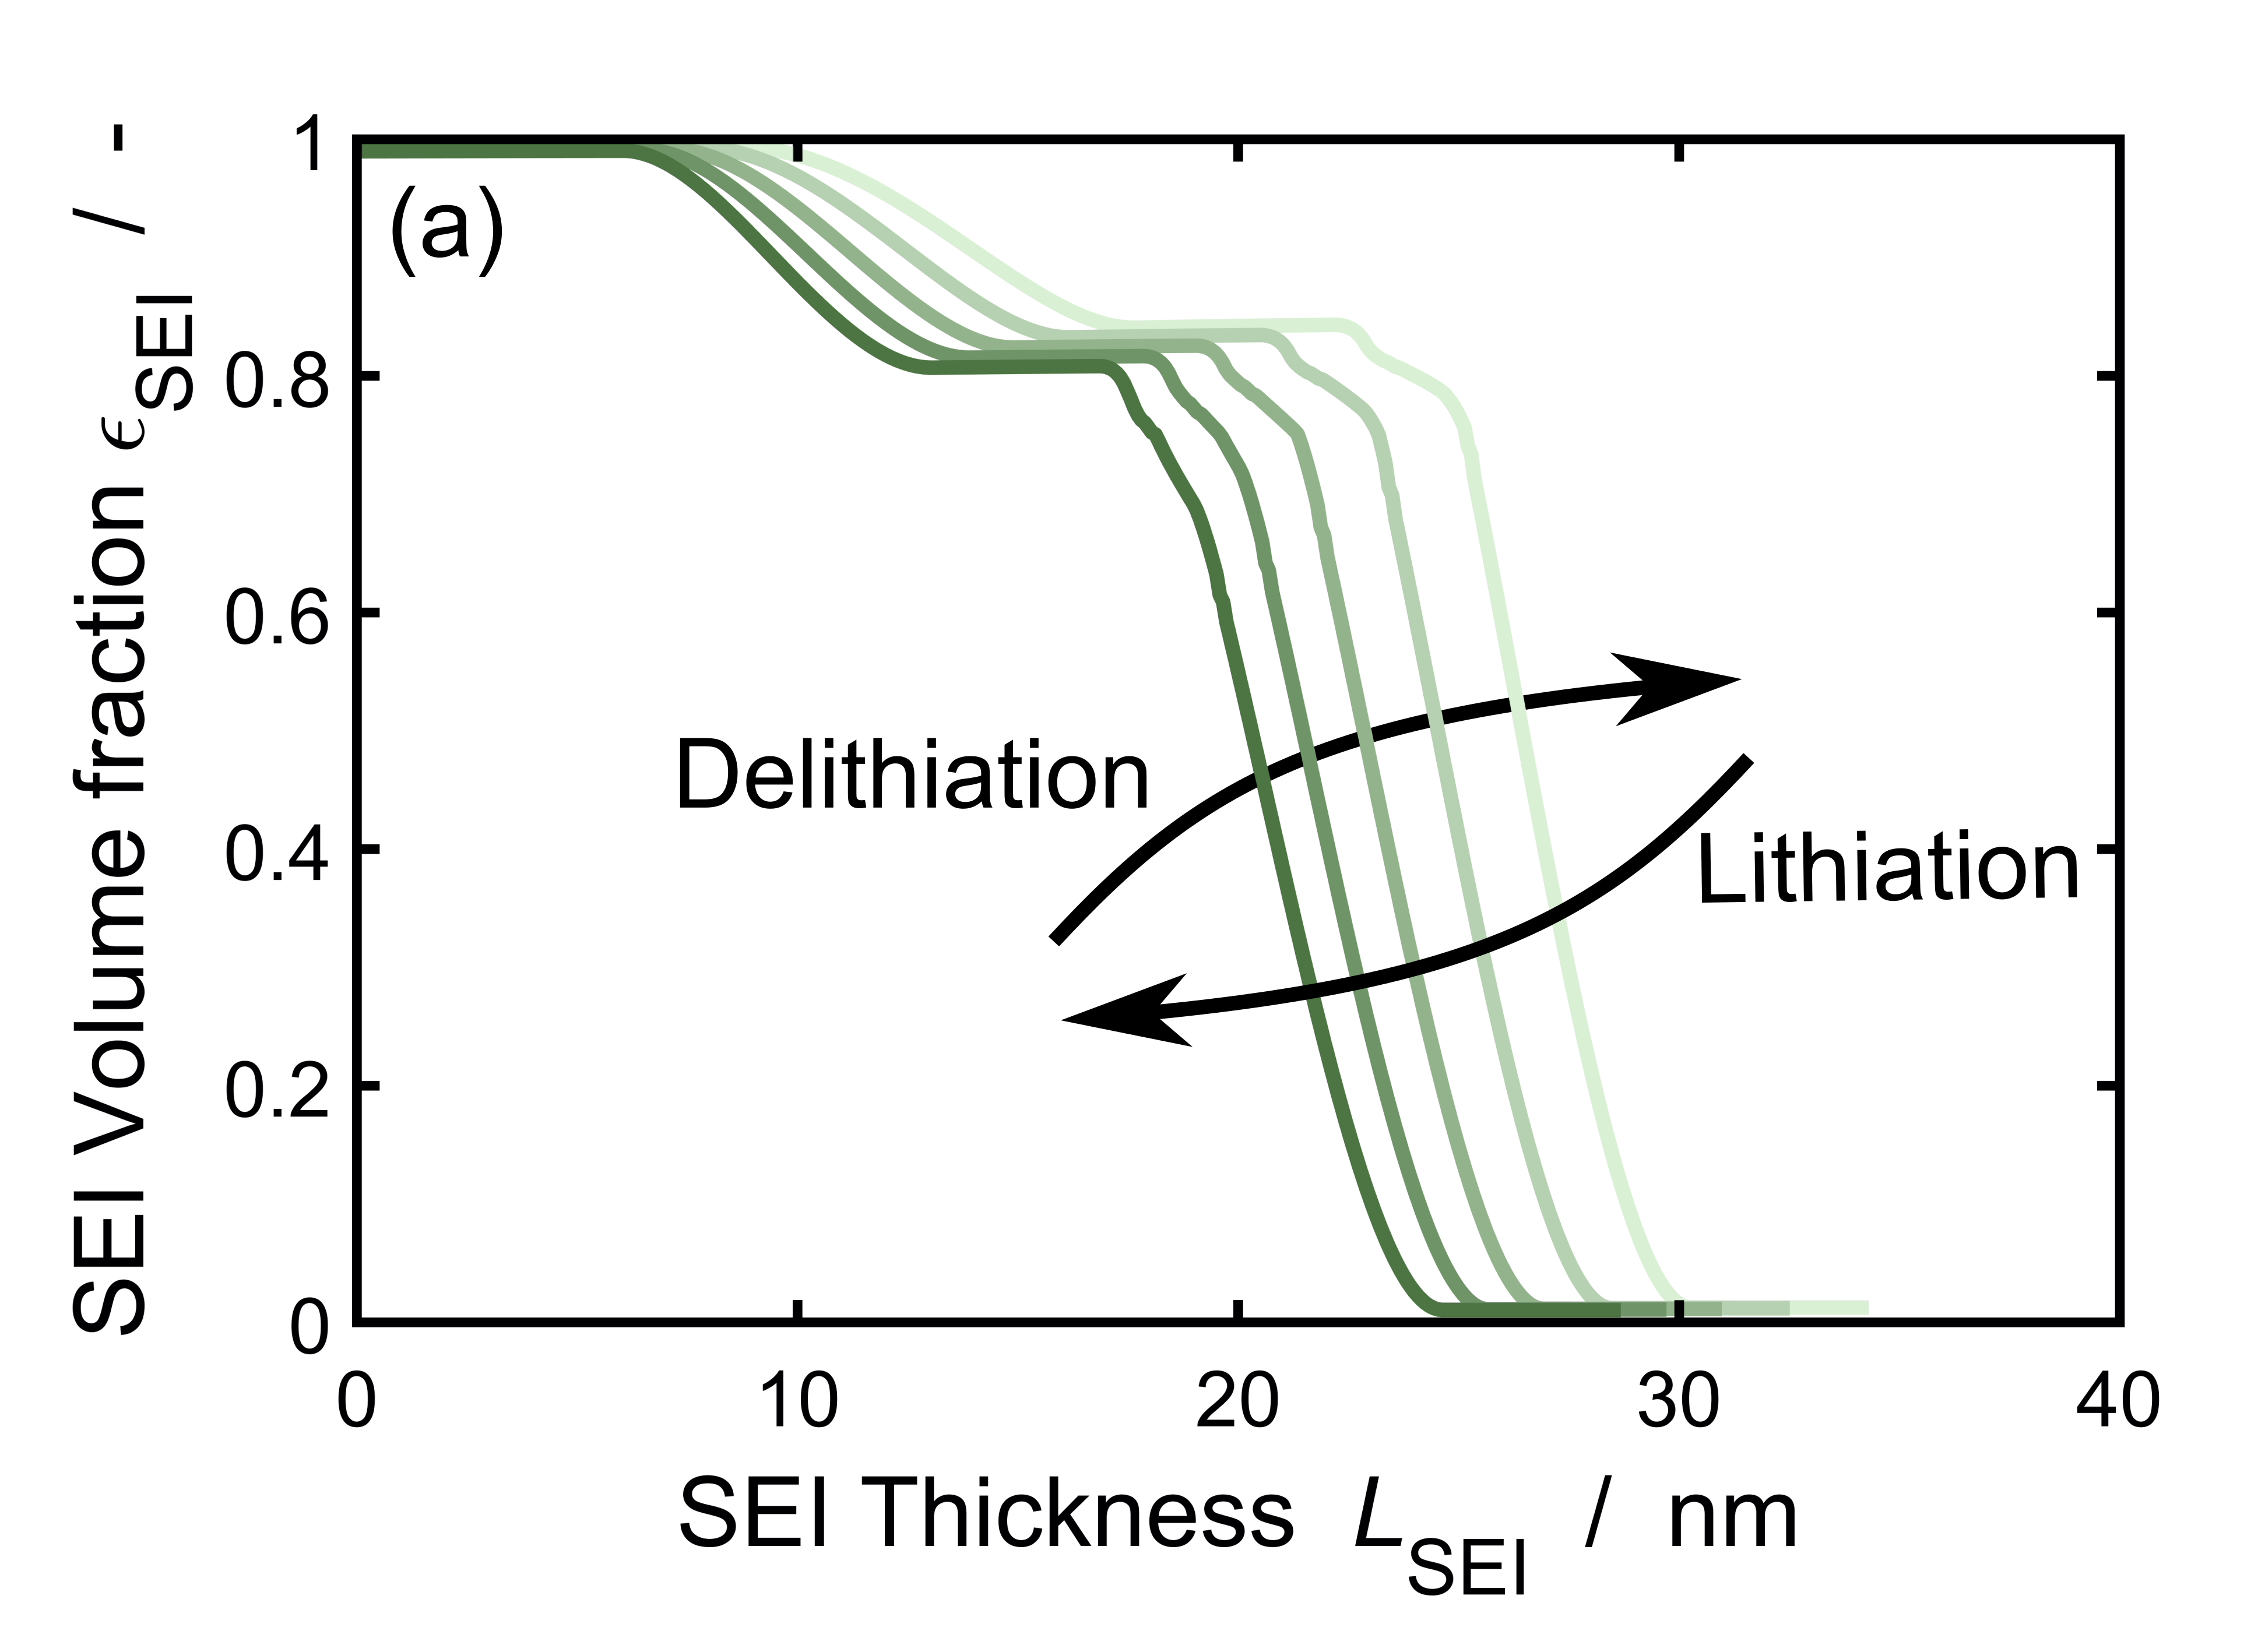
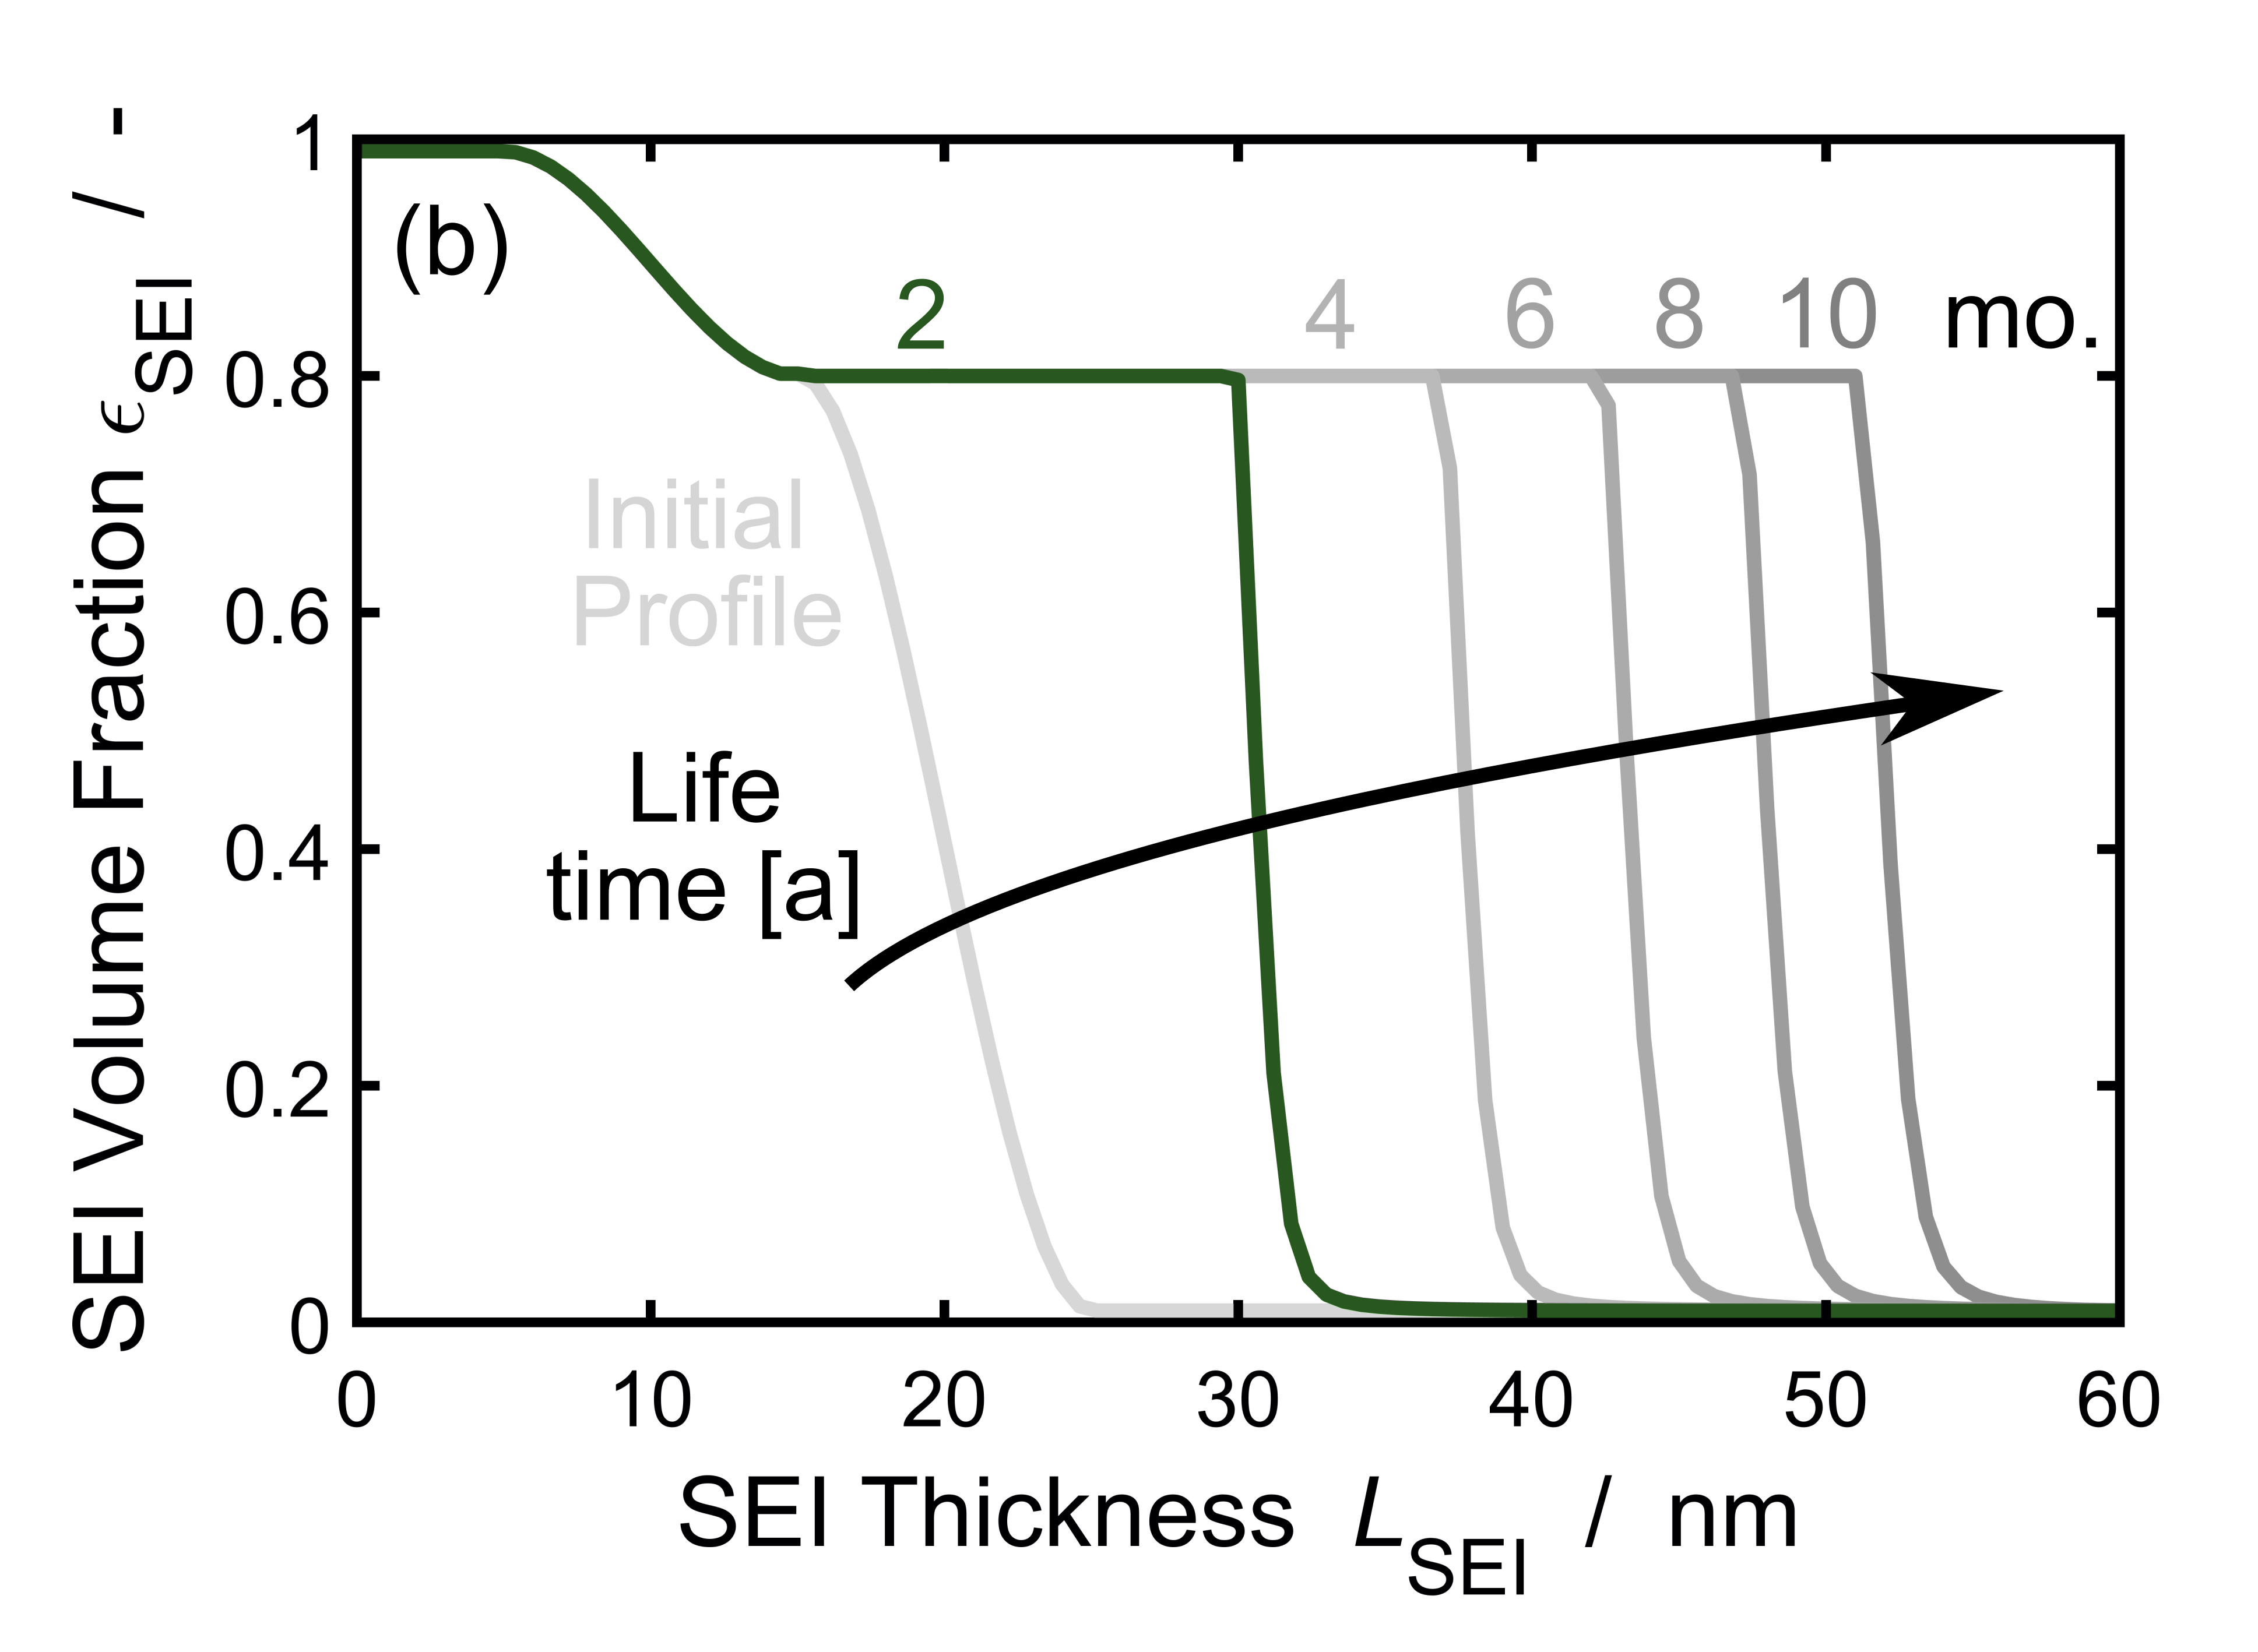
In Figure 6 a), we see the SEI breathing in each cycle. During delithiation, the SEI expands from to . Moreover, the SEI densifies during delithiation leading to a higher SEI volume fraction. The SEI expansion and densification result from the volume conservation of the SEI matrix. As the electrode particle shrinks, so does the inner radius of the SEI shell. The SEI compensates this loss in volume by increasing its volume fraction and thickness. This reversible short-term expansion of the SEI overshadows the long-term SEI growth taking place in a time scale of months. In Figure 6, we thus isolate this long-term change in geometry by plotting the SEI thickness during storage over several months. We observe, that the initial profile grows into a dual layer SEI structure with a sharp front to the electrolyte. The dual layer structure agrees with the predictions of Single et al. 39, 38 and is enforced here via the limiting porosity . Our choice of a fast reaction rate, verified by the experiments in Figure 3 yields the sharp reaction front.
4.2 Mechanics
Next, we investigate the mechanical response of particle and SEI to the previously discussed geometrical changes. Figure 7 shows the stress state in the six different configurations of Figure 5.
Initially, in Figure 7 a), the electrode particle is stress free. The lithiation half-cycle, Figure 7 b)-d), induces tensile stress in the inner part of the particle and compressive stress in the outer part. During delithiation, Figure 7 e)-f), this behavior is inverted with tensile stress in the inner part and compressive stress in the outer part. The stress inside the SEI in contrast is fully compressive during lithiation and fully tensile during delithiation. We observe two interesting phenomena in the stress response of the SEI. First, the SEI is initially not stress free. Second, the stress magnitude inside the SEI remains largely constant over the cycle and differs largely between inner and outer SEI.
The stress profile inside the particle stems from concentration gradients. Initially, the concentration is homogeneous so that the stress vanishes. Upon lithiation, the concentration in the particle center is lower than at its surface leading to volume mismatches. To compensate this mismatch, the particle center stretches elastically while the outer particle compresses elastically. This causes the observed tensile stress in the particle center and the compressive stress in the outer particle. During charging, the concentration gradient is inverted leading to the opposite behavior 80.
The SEI stress response in contrast is solely caused by the particle breathing, because the lithium ion concentration inside the SEI is constant 86. The initial SEI stress in Figure 5 a) results from the SEI deformation from its reference configuration at 29, 30, 31, 32 to . Subsequently, the stress magnitude inside the SEI remains largely constant due to plastic deformation. The observed stress is thus the yield causing stress with , see Equation 11 and Figure 2. Along the SEI, we observe a stress profile due to the prescribed dual layer structure, see Equation 14. The lower limiting porosity and the higher Young’s modulus and yield strength of the dense, inorganic inner layer lead to a higher stress magnitude compared to the porous, organic outer layer.
We further analyze the mechanical response of the SEI by plotting the stress-strain curve inside the inner and the outer SEI in Figure 8.
We observe a hysteresis in the stress response of the SEI with tensile stress during lithiation and compressive stress during delithiation. During lithiation, the SEI expands linear elastically in hoop direction until it reaches an expansion of . Then the plastic deformation sets in and expands the inner SEI as much as and the outer SEI around . The stress magnitude in the outer SEI is approximately constant at , because we assume perfect plasticity 81. In contrast, the stress magnitude in the inner SEI is not as constant, but varies around a value of . This difference between inner and outer SEI results from the radial stress component, see Figure 7. While the radial stress in the inner SEI varies during the cycle due to the mechanical particle-SEI boundary condition the radial stress in the outer SEI is negligible. During delithiation, the tensile stress releases elastically until a compression of is reached. Then the plastic flow compresses the SEI in hoop direction with a similar stress and strain magnitude as in the lithiation half-cycle.
So far, we analyzed elastic and plastic SEI deformation and observed no SEI fracture. This is because our model SEI was formed at a largely expanded particle with . Thereby, the SEI exhibits large compressive, but only small tensile strains in hoop direction, which effectively prevents SEI fracture. Nevertheless, large compressions might lead to other mechanical failure modes like buckling or delamination, which we do not consider in our reductionist model 62, 64. To further analyze SEI fracture, we thus subject our SEI to larger tensile strains. We therefore set the stress-free SEI configuration to a smaller particle size with and cycle with C/100 to increase the SoC swing.
With , we can now study SEI fraction within a single cycle. Figure 9 shows the proceeding SEI fracture for this simulation setup during lithiation.
The crack starts from the SEI surface and expands through the outer SEI stopping as it approaches the inner SEI. We observe that the SEI deteriorates much stronger once it is broken leading to larger pore expansion compared to our standard cycle shown in Figure 6. However, similar to the fully intact case in Figure 6, we see that this deformation is reversible and the crack closes again as the particle delithiates and the SEI compresses. This accords well to the experimental findings of Kumar et al. 31, who observed SEI cracks only in the outer SEI, which close again upon delithiation. However, our homogenized 1D model cannot capture the precise shape of the cracks and whether the same cracks would open again in the next cycle 31. Overall, this mechanism accelerates SEI growth by lowering the SEI thickness and increasing the pore volume. These results show that low potentials in the initial SEI formation cycle increase the battery lifetime by enhancing the mechanical stability of the SEI. In the next two sections, we analyze the SEI growth during short-term and long-term cycling.
4.3 Short-Term SEI Growth
Significant SEI growth typically occurs in a time span of months to years. Nevertheless, our model allows us to visualize the small SEI growth during one cycle. We start by analyzing the SEI thickness and the SEI capacity consumption during our standard cycle in Figure 10.
We observe a reversible thinning and thickening of the SEI during the cycle, corresponding to our findings from Figure 6. The irreversible SEI growth only plays a minor role, so that the initial thickness approximately corresponds to the final thickness. We thus resolve the irreversibly consumed SEI capacity during the cycle on the second y-axis and observe asymmetric capacity consumption during one cycle: Irreversible SEI growth is accelerated by lithiation and decelerated by delithiation. Moreover, the SEI growth is fastest at the end of lithiation, i.e., for high SoC.
The asymmetric SEI growth results from the exponential dependence of the lithium interstitial concentration on the anode OCV and intercalation overpotential 47. The influence of anode OCV on SEI growth was first theoretically described by Single et al. 36 in line with the storage experiments of Keil et al. 56, see Figure 3. The influence of intercalation overpotential stems from our recent electrochemical SEI model 47. This model agrees well to the experiments of Attia et al. 57, which revealed dependence of SEI growth on the current magnitude and direction.
4.4 Long-Term SEI Growth
Because the SEI hardly grows during a single cycle, we analyze the long-term SEI growth after several battery cycles in this subsection. In Figure 11 a), we illustrate the capacity bound in the SEI of a silicon particle cycled for one year at C/10 with the standard potential of initial SEI formation . Additionally, we plot the mean SEI volume fraction in Figure 11 b). This quantity enriches our analysis of morphological SEI changes, because it also captures the influence of reversible SEI densification/porosification during each cycle, which we observed in Figure 6 and 9. Moreover, our SEI growth model, Equation 9, rather depends on the porosity profile than the macroscopic SEI thickness .
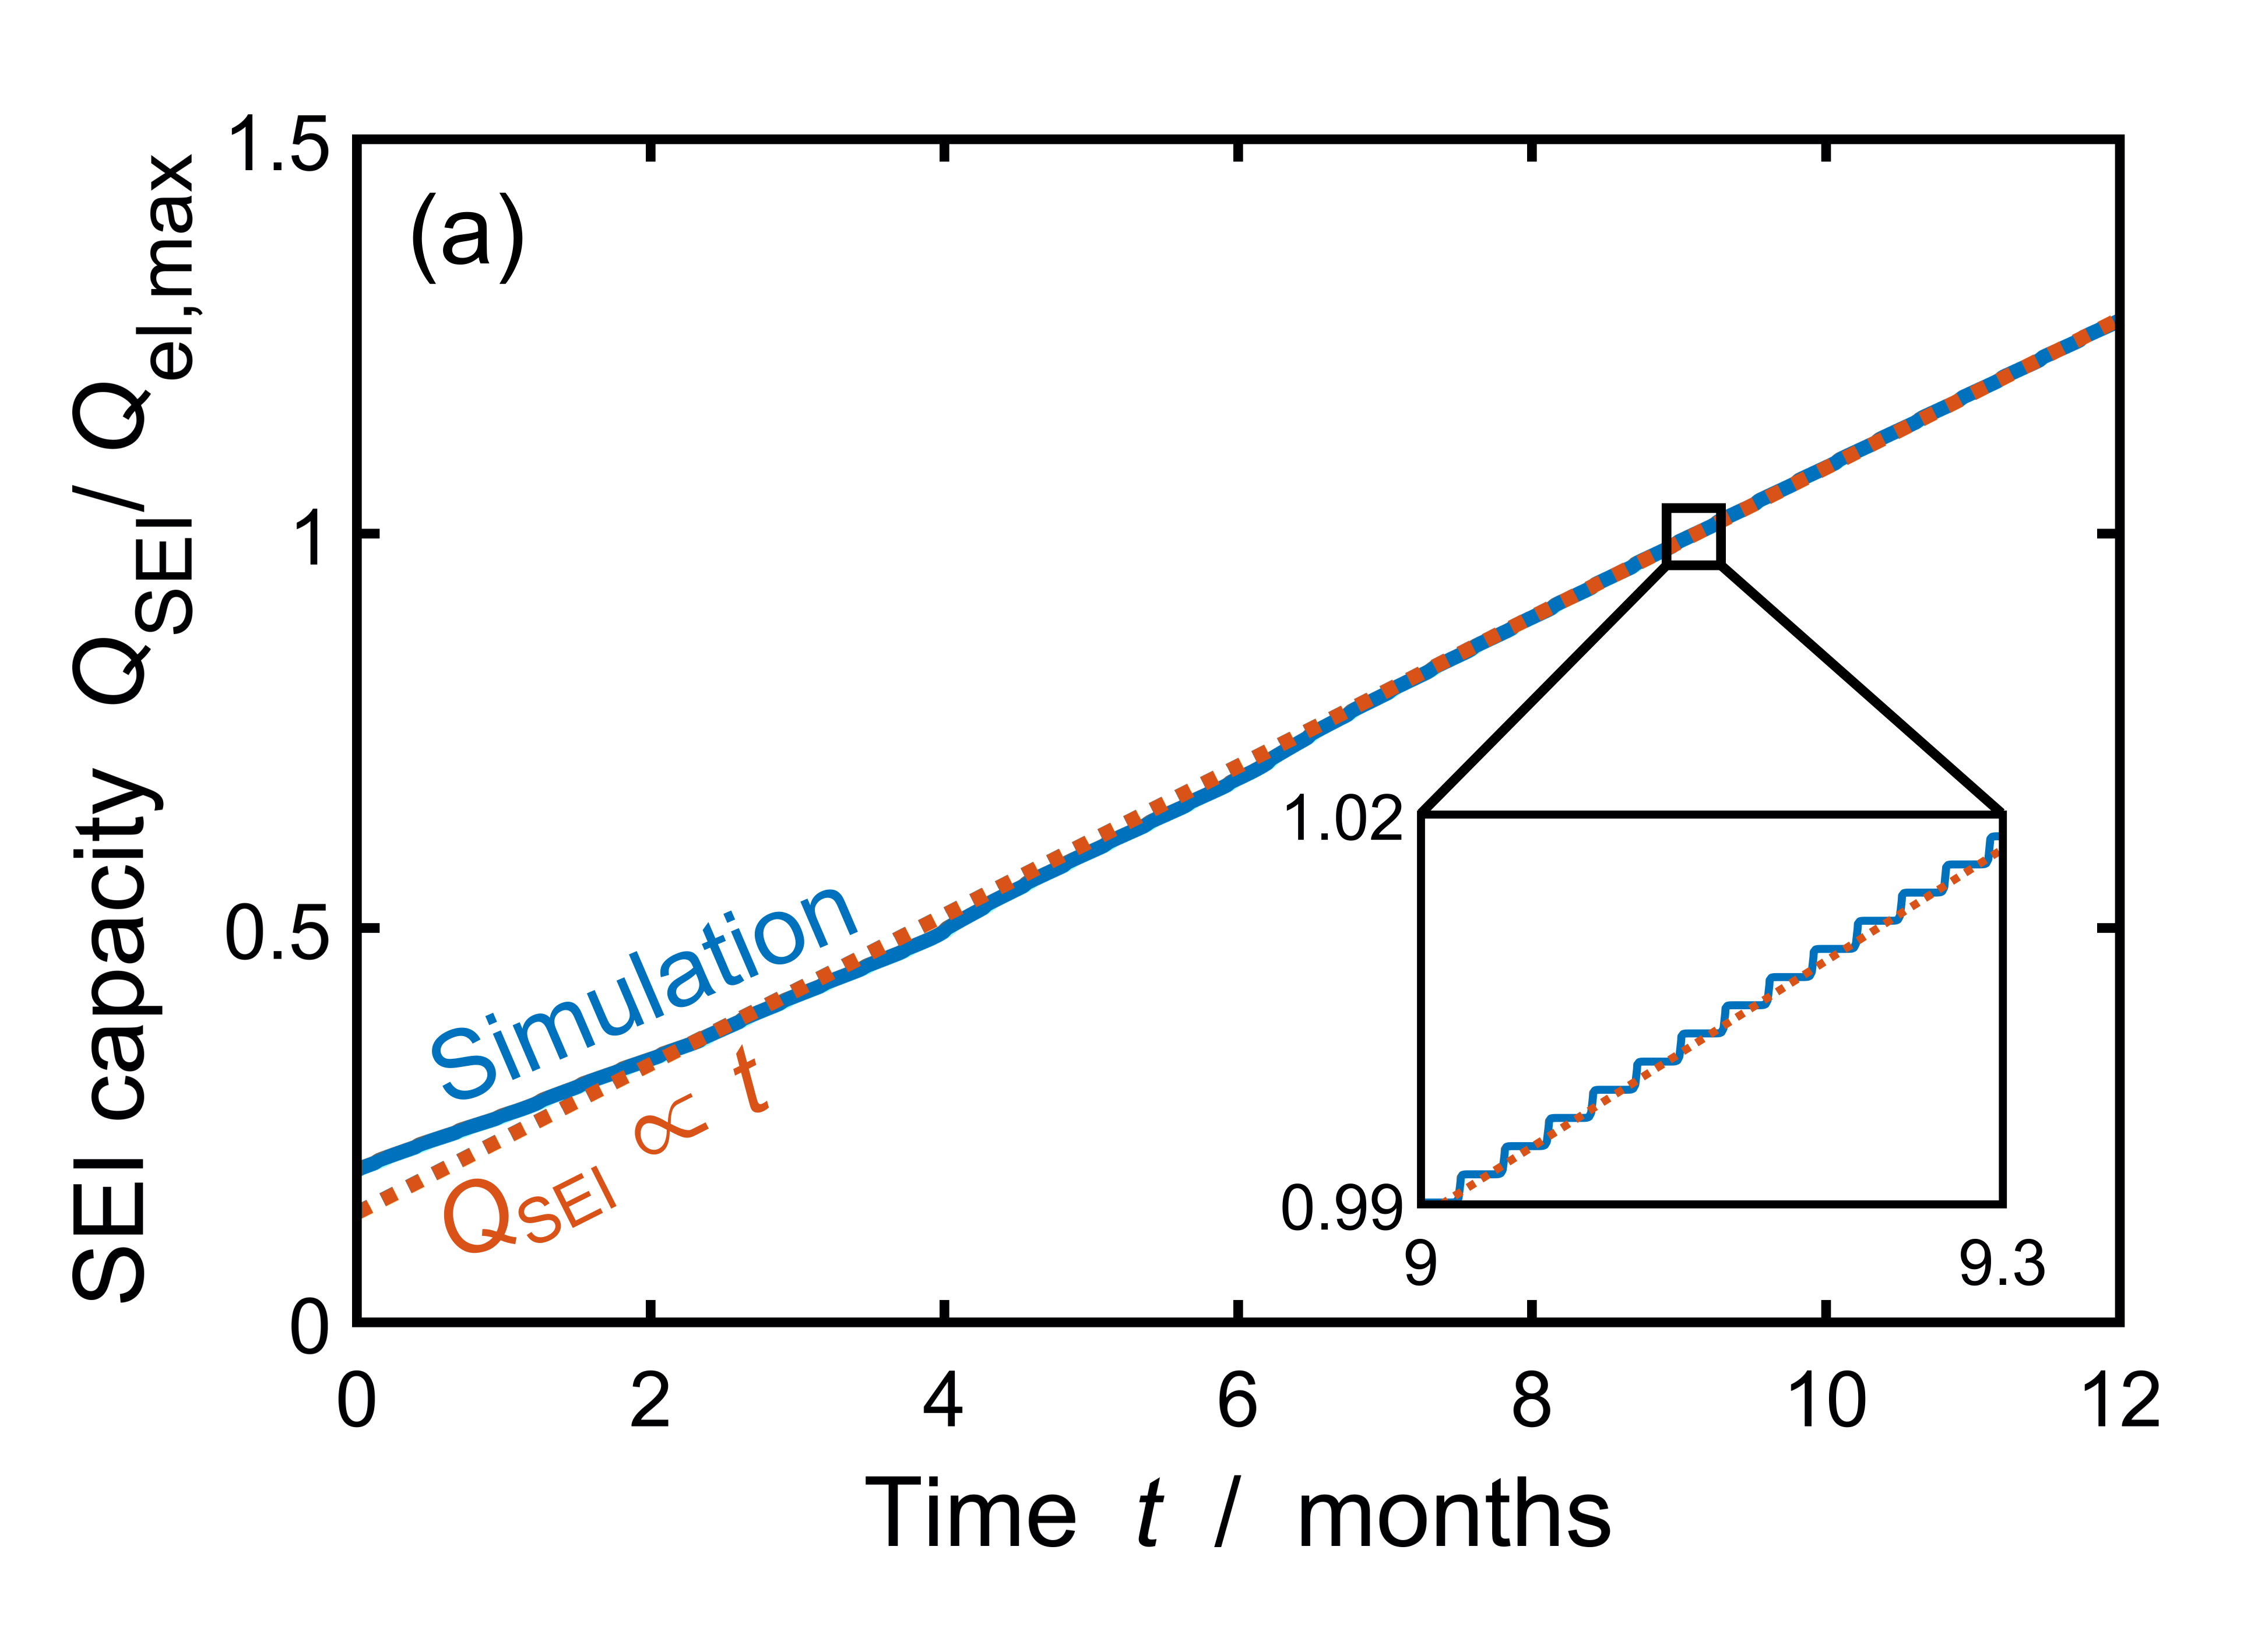
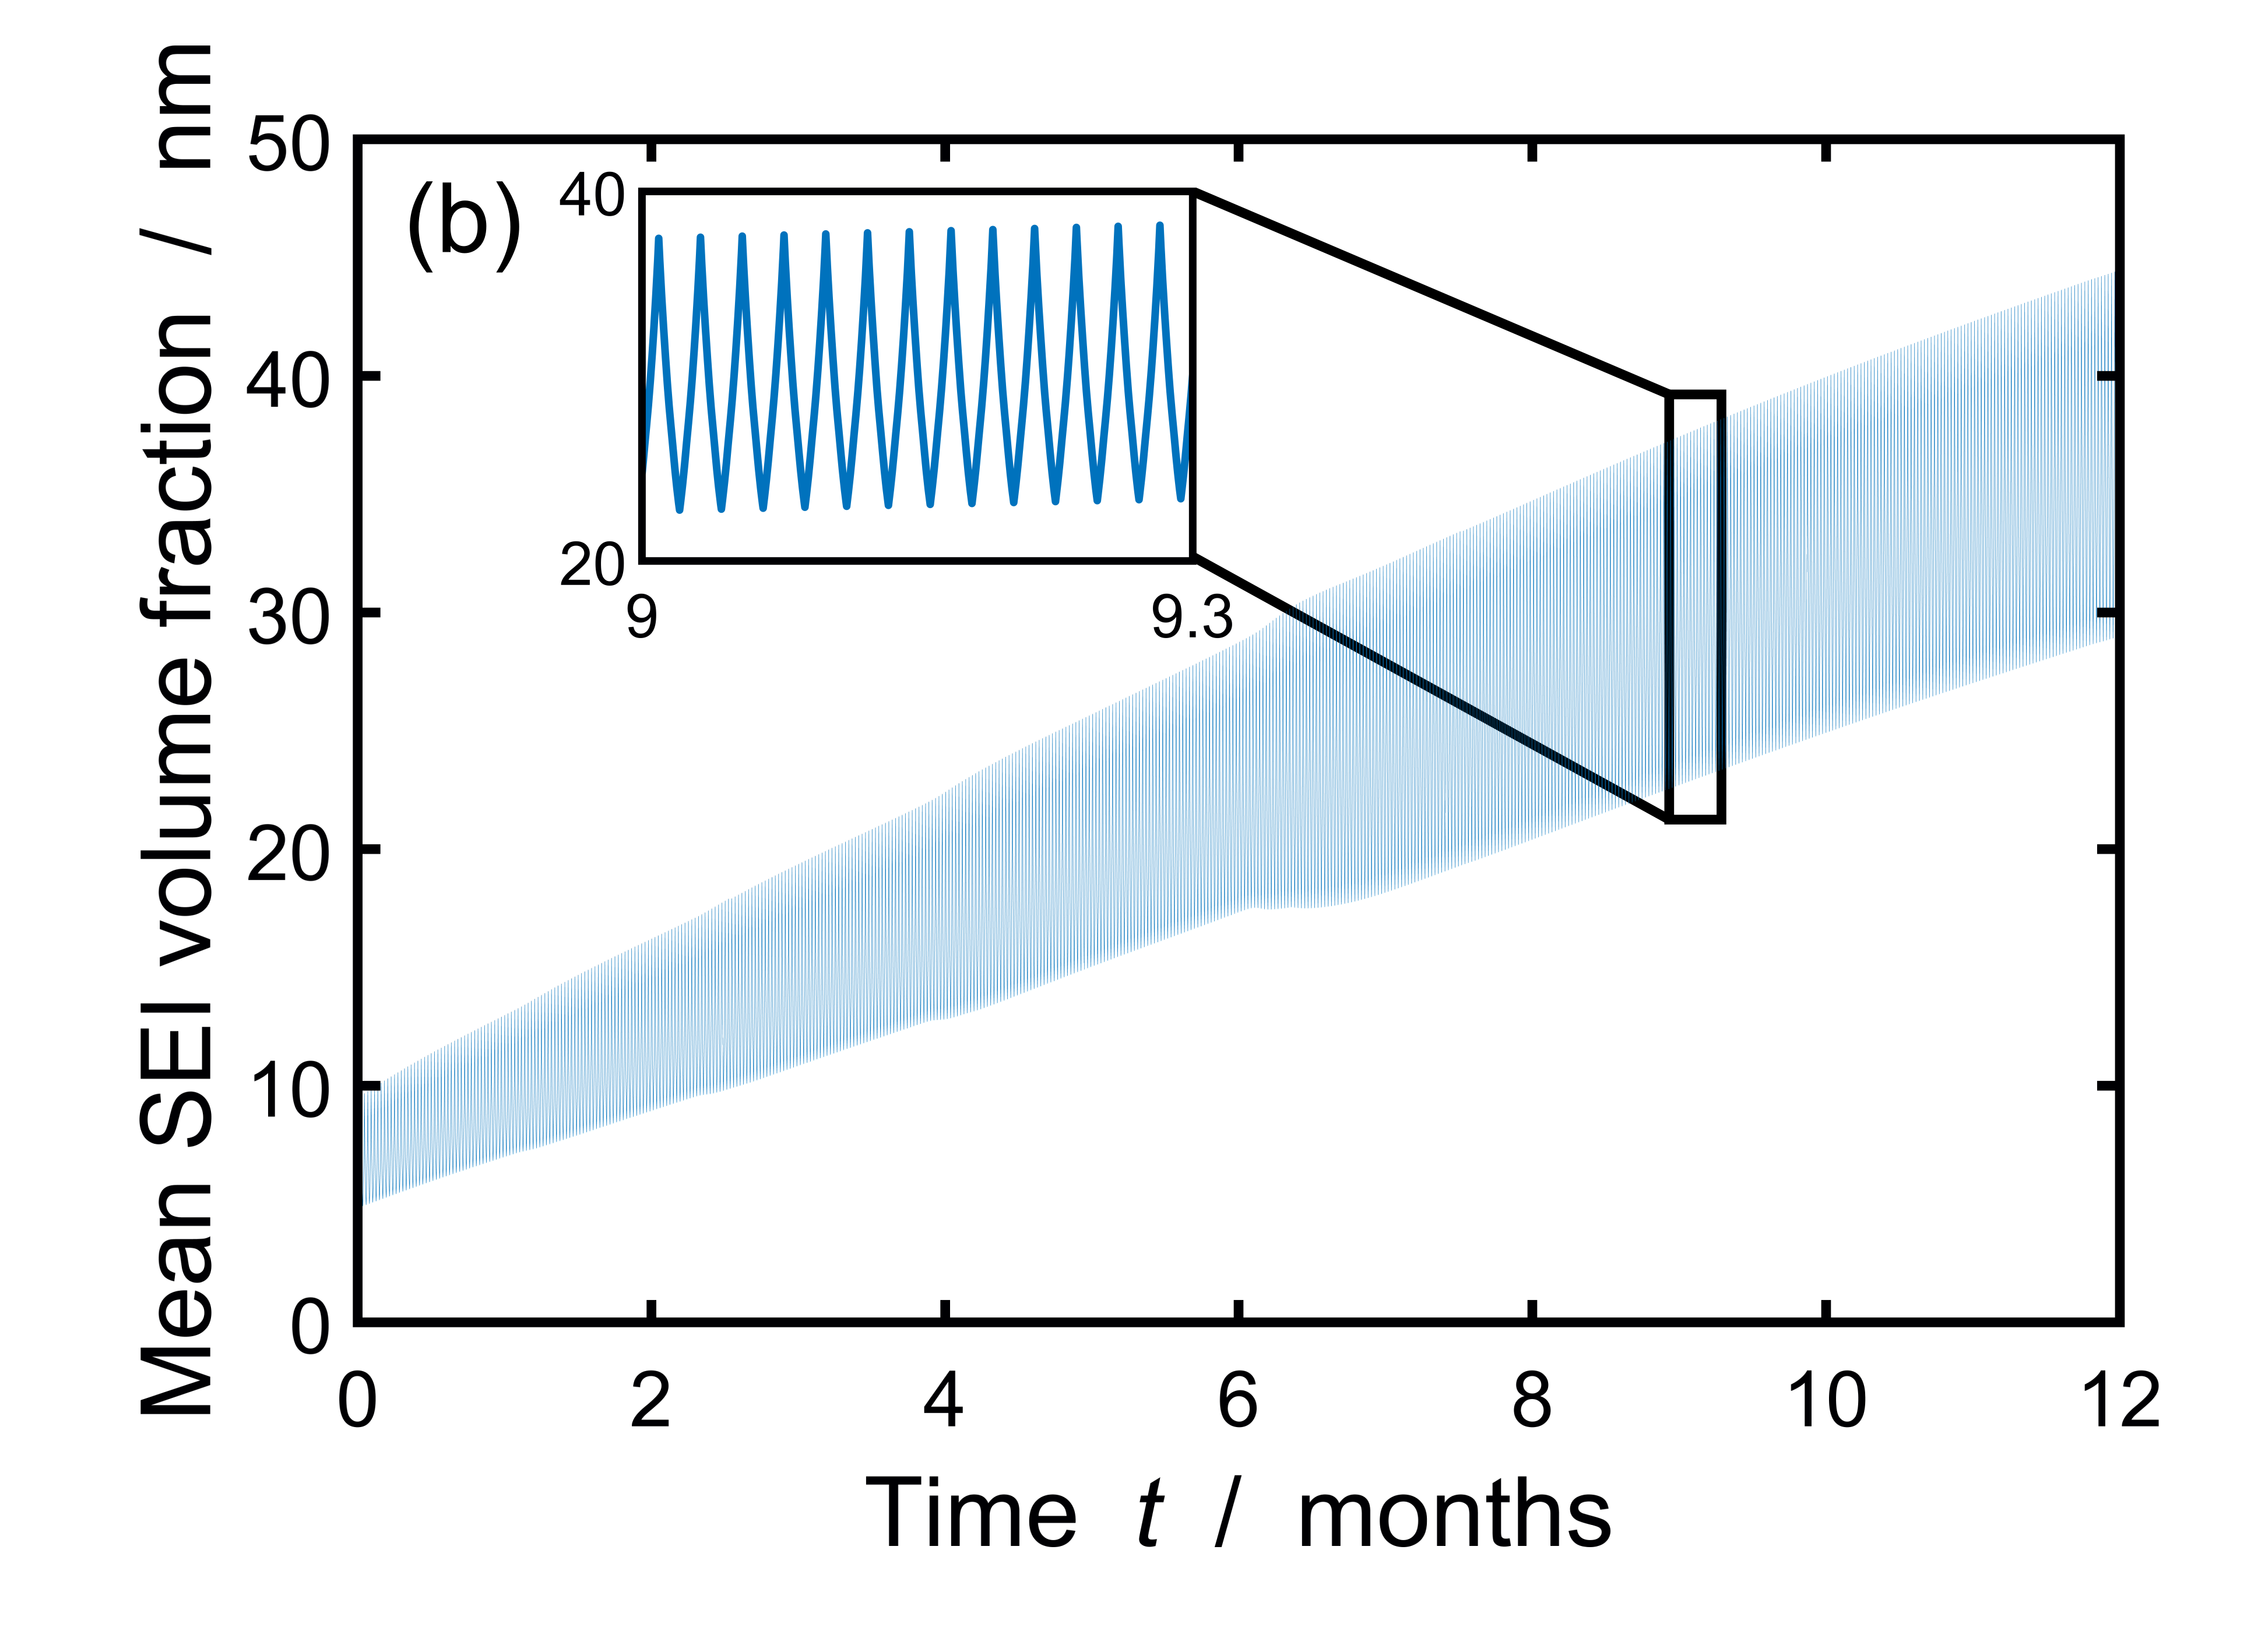
In Figure 11 a), we observe the same trend as in Figure 10 during each cycle (see zoom inlet); the SEI thickness oscillates and the SEI capacity grows asymmetrically. Similarly, the mean SEI volume fraction oscillates, shown in the zoom inlet of Figure 11 b). Over the long-term, the amplitude of oscillations of mean SEI volume increases from to as SEI fracture progresses, see Figure 9. The fracture in turn decreases the SEI passivation so that we observe a linear capacity fade in Figure 11 a). In contrast, during storage, we observe a self-limiting SEI growth , see Figure 3 b). This accelerated growth results from the interplay of battery cycling and SEI growth, i.e., from mechanical SEI deterioration.
In Figure 12, we thus illustrate how the SEI capacity increases over time for different charging currents as compared to battery storage.
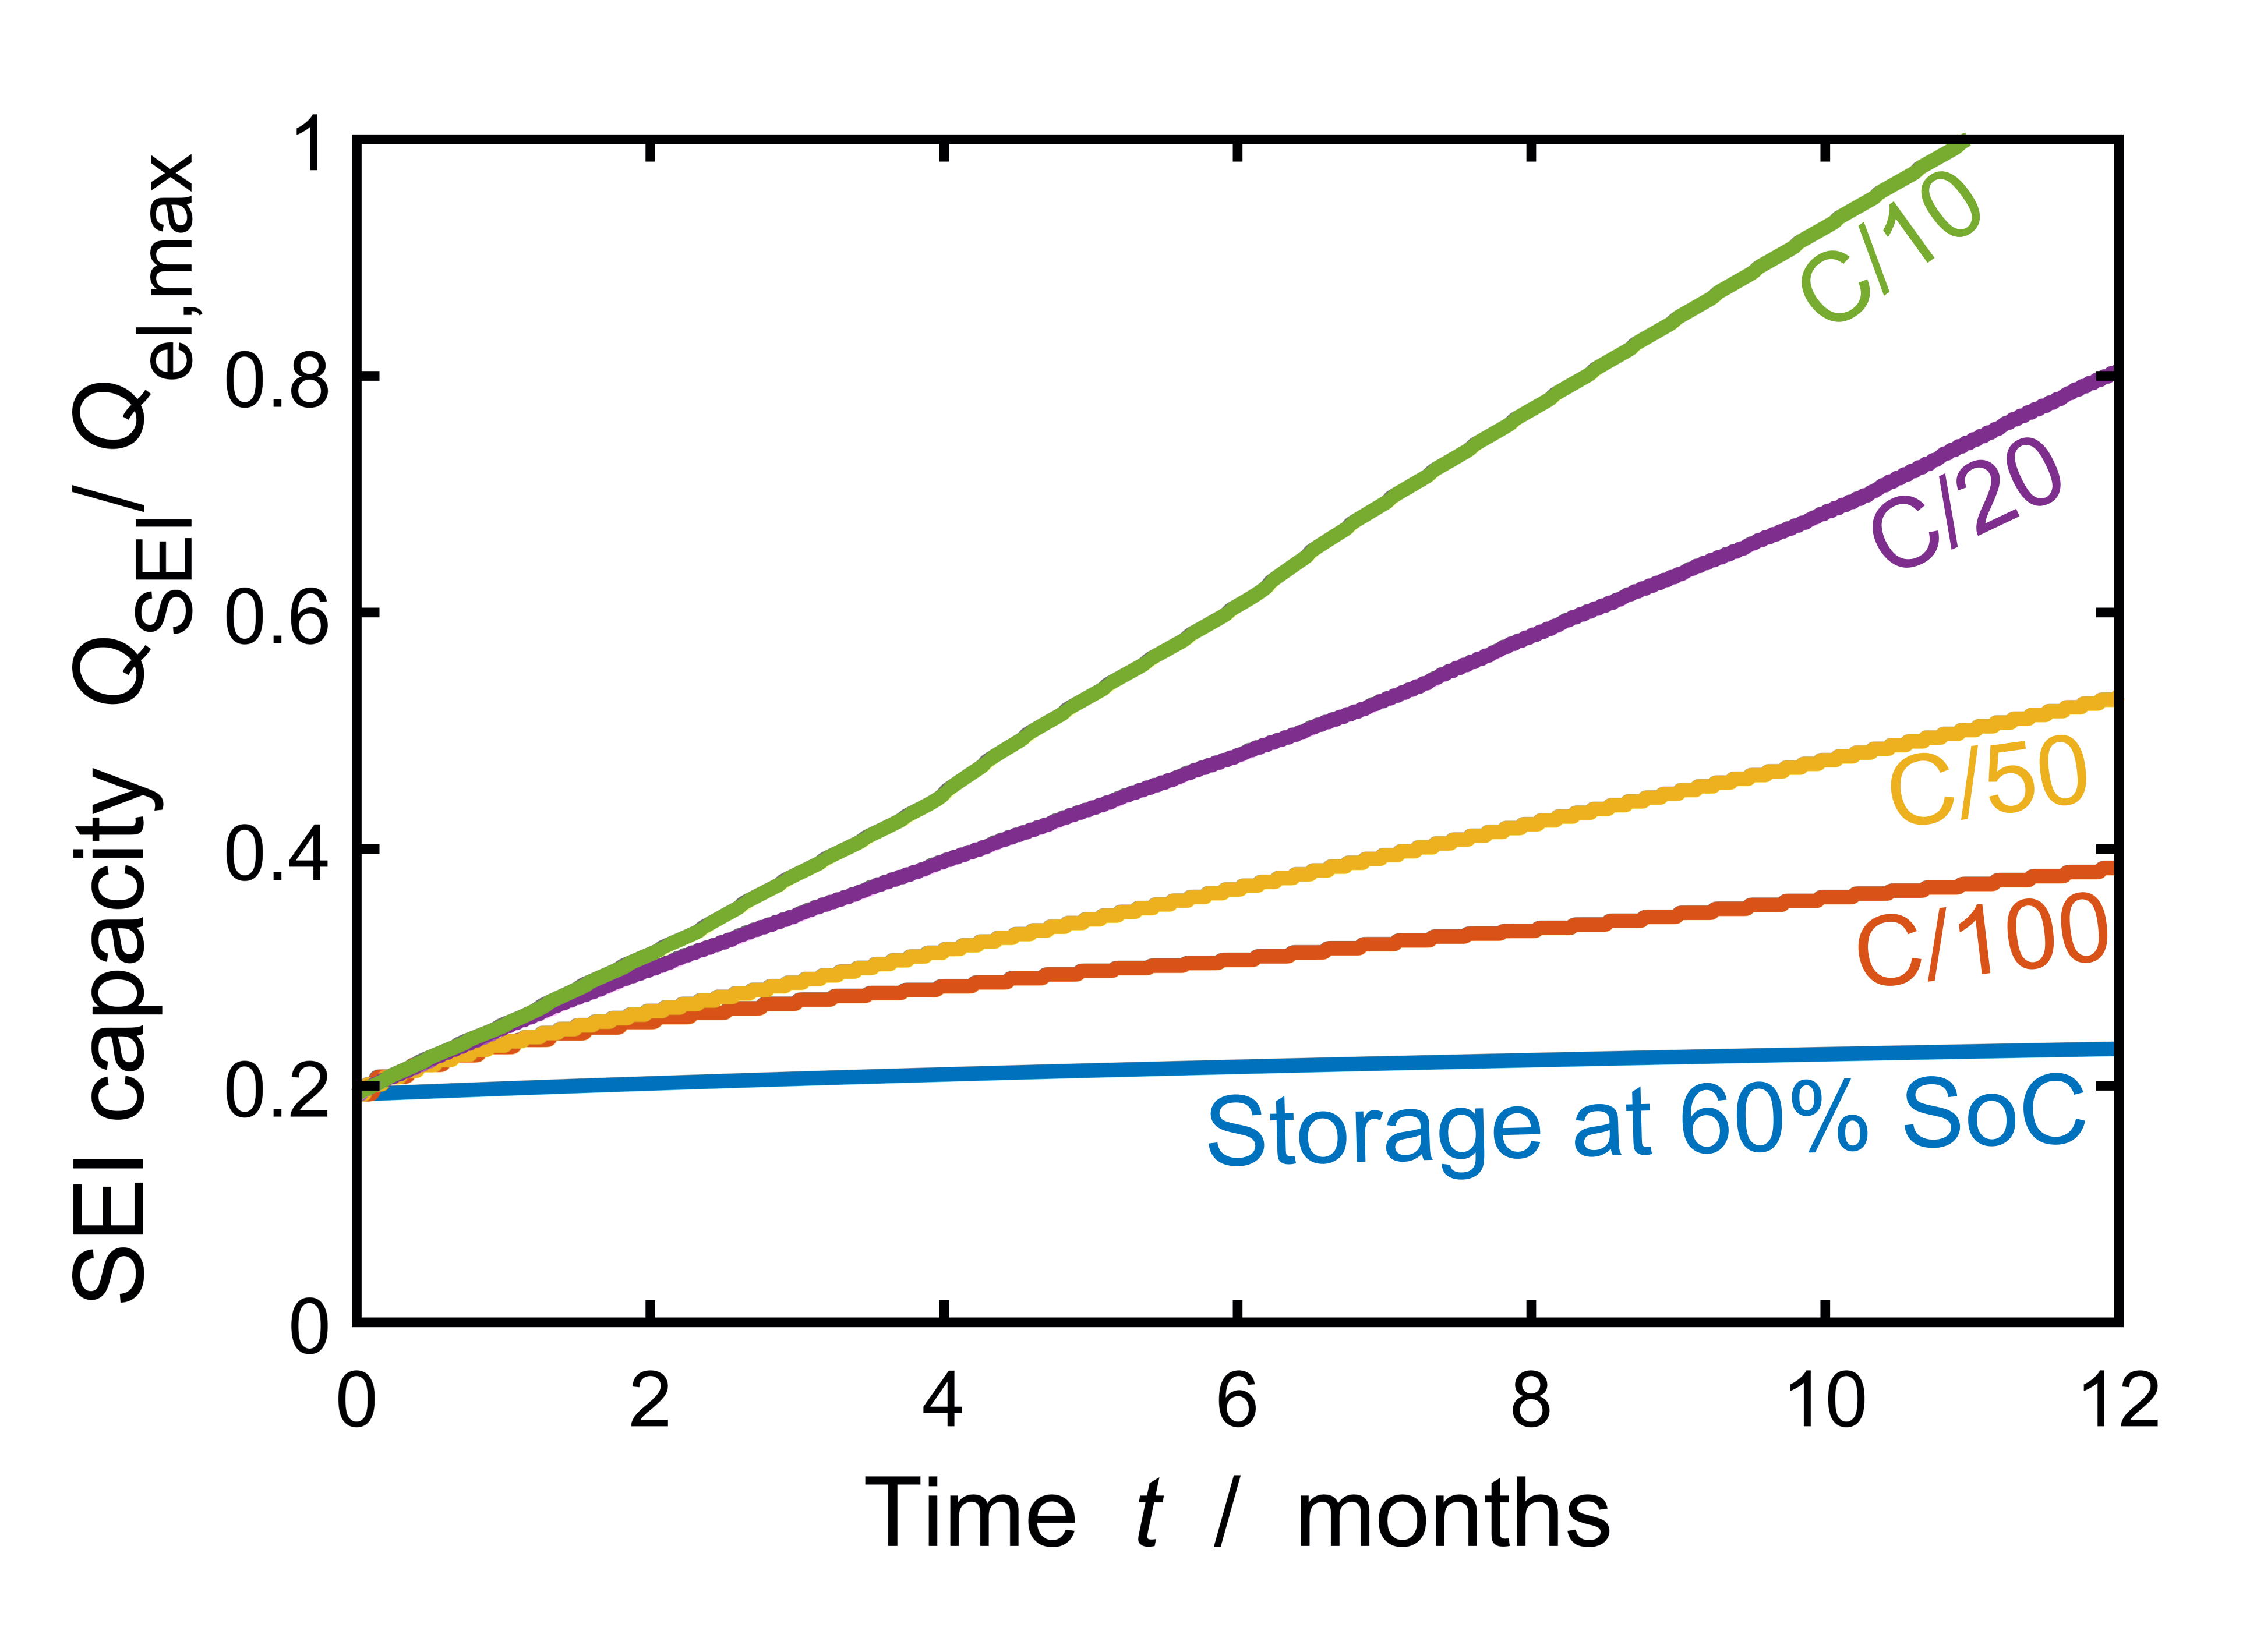
We observe that higher charging currents lead to faster SEI growth. But the relationship between charging current and SEI growth seems to be more complex, as we observe only a small difference between C/100 and C/50 opposed to the large difference between C/50 and C/20.
In Figure 13, we therefore plot the dynamic SEI profile for a particle charged with C/100 (green) and C/10 (red).
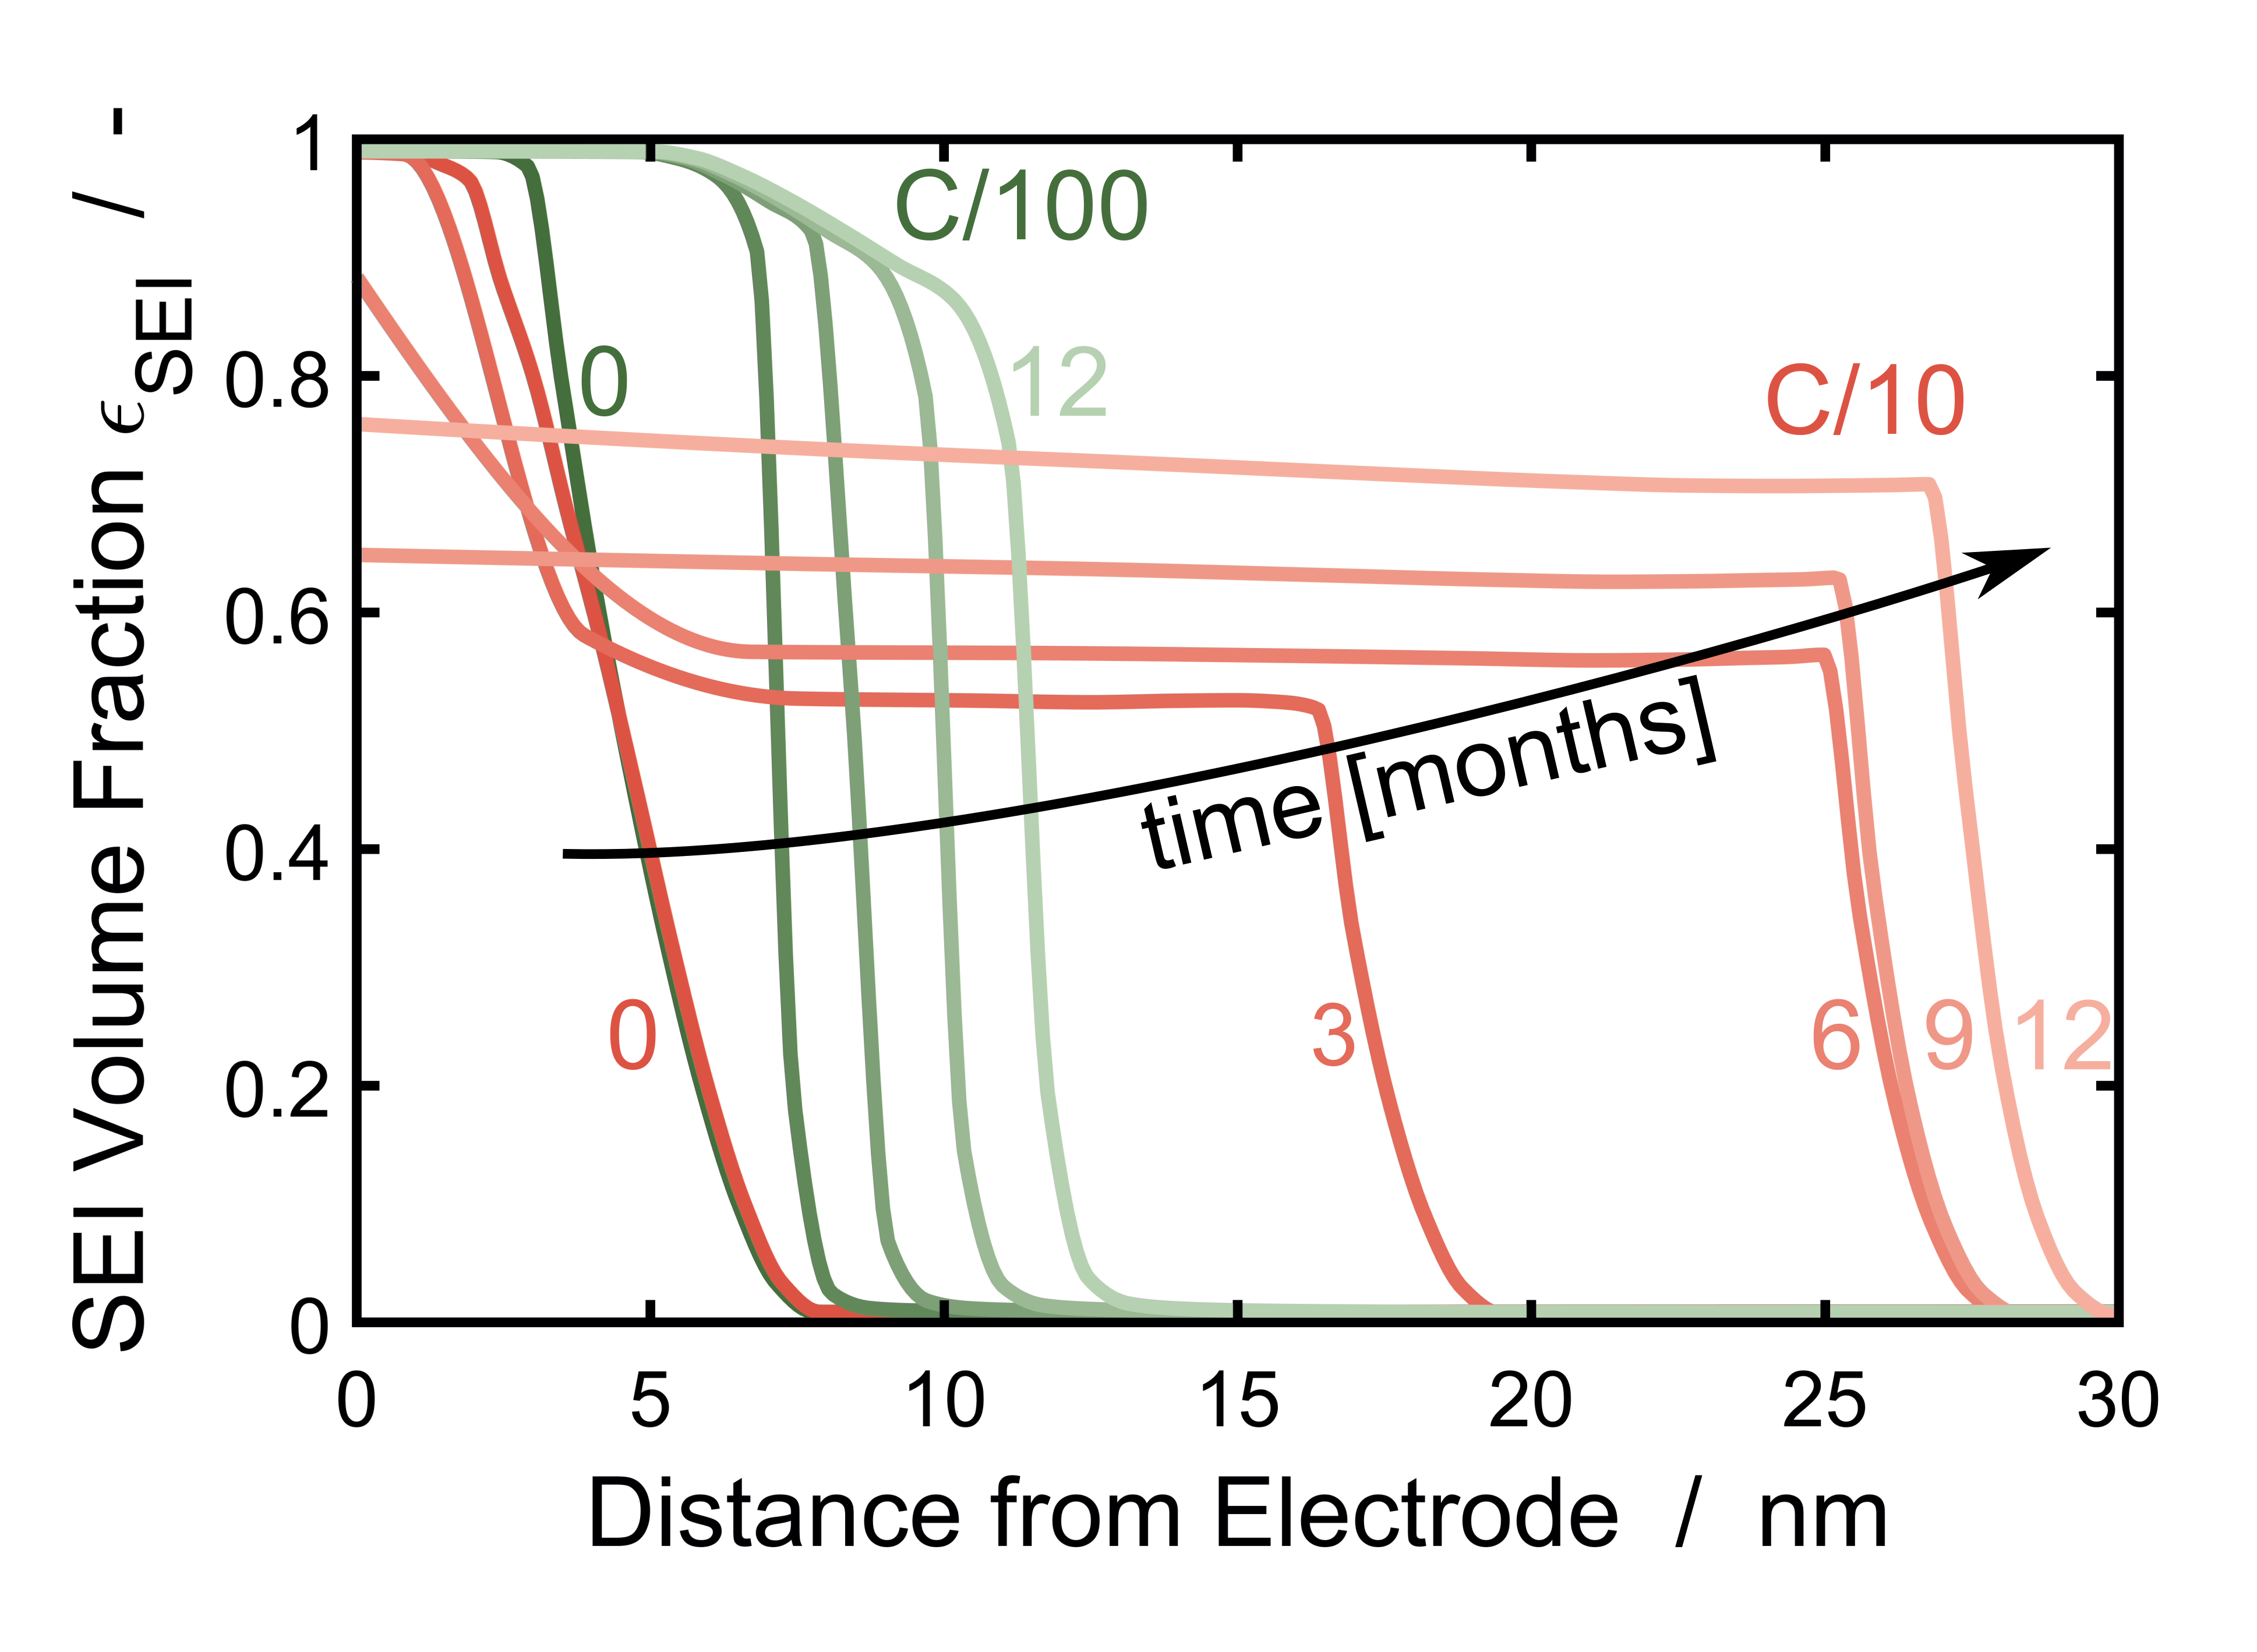
We observe a fundamentally different SEI growth between these two charging currents. The particle charged with C/100 closely follows the prescribed limiting profile similar to the storage case, Figure 6 b). In contrast, charging with C/10 leads to a spread out profile in which the shielding inner layer vanishes over time.
The reason for this difference lies in the different time-scales imposed by the different charging rates. In each cycle, the inner SEI undergoes large deformations as shown in Figure 6 a). These large deformations are not completely reversible and the inner SEI layer flows plastically to a thicker and more porous geometry. If the battery cycles with C/100, the cycle time is sufficient for the inner SEI to reform in the newly created pores and thereby reattain its self-passivating character. However, in batteries charged with C/10, the cycle time is too short for the SEI to reform. As a result, the inner SEI fully deteriorates and leaves the anode unshielded from the electrolyte. This causes unlimited SEI growth leading to the observed linear growth in the long-term.
To sum up our long-term results for SEI growth shown in Figure 11, 12, and 13, we observe a fundamental transition in time-dependence. Starting from the well-known -SEI-growth during storage, cycling with increasing current accelerates growth and at C/10 the SEI grows linear with time. This growth acceleration stems from the continuous pore expansion inside the inner SEI caused by large deformations during cycling. The faster the cycling rate, the less time the SEI has to repair these pores. As a result, the porosity profile in Figure 13 at C/100 corresponds to the prescribed SEI profile, which we also observe during battery storage, see Figure 3 and 9. In contrast, faster cycling with C/10 deteriorates the inner SEI over time, so that the particle is no longer passivated and the SEI grows rapidly. This finding rationalizes empirically motivated SEI growth models, which obtain a linear SEI growth from prescribing a constant SEI fracture and regrowth term for every cycle 40, 53, 104.
Despite the qualitatively good predictions, our model is only a first step towards better understanding SEI growth on silicon electrode particles. First, our parametrization with SEI experiments on graphite 56 and lithium thin film 81 neglects structural differences of the SEI on the different substrates and thereby leads to uncertainties. Novel capacity fade experiments on silicon particles will be helpful to obtain better estimates for the model parameters. Second, we rely on a 1D-spherical symmetrical single particle model instead of resolving the whole electrode. As such, our model is agnostic of the circumferentially heterogeneous SEI structure and anisotropy within the electrode particles. Third, we only consider a single particle instead of analyzing the electrode microstructure as a whole. Thereby, our model neglects structural heterogeneity resulting from particle size distribution, as well as graphite, carbon and binder phases. This heterogeneity leads to complex electrochemo-mechanical interactions, especially in graphite/silicon blend electrodes as recently shown by Liu et al. 105.
However, these limitations offer promising possibilities to extend and apply our model. With efficient numerical schemes, e.g., as presented in ref. 80, our model can be analyzed in 3D to reveal heterogeneity of SEI growth on individual particles. Moreover, incorporating a simplified 0D-version of our model in 3D-resolved electrode models 83, 84, 105 is a promising approach to reveal interparticular SEI heterogeneity as well as the complex electrochemo-mechanical interactions of the different constituents. In this context, our SEI model can direcly be adapted to describe the mechanics of binder shell covered electrode particles.
5 Conclusion
We have developed a thermodynamically consistent chemo-mechanical model of an electrode particle coated with a solid-electrolyte interphase (SEI). The electrode model is derived from a free energy functional and accounts for chemical deformation and elastic stress 80. The SEI model accounts for elastic and plastic deformation, fracture, and lithium atom mediated SEI growth 36, 47 based on the SEI volume fraction as order parameter.
Our model agrees qualitatively well with the experimentally observed SEI cracking during lithiation and healing during delithiation on silicon particles 31, 64. We obtain the parametrization for our electrochemo-mechanical SEI model from experiments on different substrates. The storage experiments of Keil et al. 56 conducted on graphite particles parametrize the electrochemical part of the SEI model. The mechanical measurements of Yoon et al. 81 conducted on SEI from lithium thin film parametrizes the mechanical part of the SEI model.
For the first time, our so-validated model showed the complex relationship between SEI mechanics and electrochemical growth on silicon electrodes. Namely, mechanical SEI pore expansion further accelerates SEI growth at high states of charge. Moreover, continuous pore creation during SEI expansion deteriorates the inner SEI in the long-term. For cycling currents , the cycle time is too short to repair the inner SEI. As a result, we observe a transition from self-passivating (-) to non-passivating (-time-dependent) SEI growth with increasing cycling currents. These new insights extend our understanding of the influence of battery operation on battery life. This will aid in designing battery operation protocols for next-generation lithium-ion batteries.
Future works can extend our model for additional mechanical SEI deterioration, SEI heterogeneity, and lithium plating. Implementing our model in two or three dimensions allows for an in-depth analysis of further mechanical SEI damaging like crack formation, spallation, or delamination. Moreover, this approach paves the way to better account for the heterogeneity and polycristallinity of the SEI. As our model relies on lithium atoms as mediators for SEI growth, lithium plating, i.e., the accumulation of lithium on the anode, could be implemented in our model as additional degradation mode. Furthermore, integrating our model in 3D full cell simulations, would capture the influence of heterogeneous electrodes on battery degradation. Especially graphite/silicon blend electrodes, which suffer from large mechanical differences, would profit from our degradation model. A solution to the accompanying computational challenges would be to simplify our SEI model to a 0D-version and implement it into a fully integrated electrochemo-mechanical FEM cell model 106, 107, 80.
Acknowledgements
We gratefully acknowledge funding and support by the German Research Foundation (DFG) within the research training group SiMET under the project number 281041241/GRK2218. The support of the bwHPC initiative through the use of the JUSTUS HPC facility at Ulm University is acknowledged. This work contributes to the research performed at CELEST (Center for Electrochemical Energy Storage Ulm-Karlsruhe).
Conflict of interest
The authors declare no conflict of interest.
References
- [1] C. K. Chan, H. Peng, G. Liu, K. McIlwrath, X. F. Zhang, R. A. Huggins, and Y. Cui. High-performance lithium battery anodes using silicon nanowires. Nat. Nanotechnol., 3(1):31–35, 2008.
- [2] Y. Sun, N. Liu, and Y. Cui. Promises and challenges of nanomaterials for lithium-based rechargeable batteries. Nat. Energy, 1(7):1–12, 2016.
- [3] W. J. Zhang. A review of the electrochemical performance of alloy anodes for lithium-ion batteries. J. Power Sources, 196(1):13–24, 2011.
- [4] H. Wu, G. Chan, J. W. Choi, I. Ryu, Y. Yao, M. T. Mcdowell, S. W. Lee, A. Jackson, Y. Yang, L. Hu, and Y. Cui. Stable cycling of double-walled silicon nanotube battery anodes through solid-electrolyte interphase control. Nat. Nanotechnol., 7(5):310–315, 2012.
- [5] E. Peled. The Electrochemical Behavior of Alkali and Alkaline Earth Metals in Nonaqueous Battery Systems—The Solid Electrolyte Interphase Model. J. Electrochem. Soc., 126(12):2047, 1979.
- [6] E. Peled, D. Golodnitsky, G. Ardel, and V. Eshkenazy. The Sei Model - Application to Lithium Polymer Electrolyte Batteries. Electrochim. Acta, 40(13-14):2197–2204, 1995.
- [7] E. Peled. Advanced Model for Solid Electrolyte Interphase Electrodes in Liquid and Polymer Electrolytes. J. Electrochem. Soc., 144(8):L208–L210, 1997.
- [8] Y. Horowitz, H. G. Steinrück, H. L. Han, C. Cao, I. I. Abate, Y. Tsao, M. F. Toney, and G. A. Somorjai. Fluoroethylene Carbonate Induces Ordered Electrolyte Interface on Silicon and Sapphire Surfaces as Revealed by Sum Frequency Generation Vibrational Spectroscopy and X-ray Reflectivity. Nano Lett., 18(3):2105–2111, 2018.
- [9] Y. Li, W. Huang, Y. Li, A. Pei, D. T. Boyle, and Y. Cui. Correlating Structure and Function of Battery Interphases at Atomic Resolution Using Cryoelectron Microscopy. Joule, 2(10):2167–2177, 2018.
- [10] N. Delpuech, N. Dupré, D. Mazouzi, J. Gaubicher, P. Moreau, J. S. Bridel, D. Guyomard, and B. Lestriez. Correlation between irreversible capacity and electrolyte solvents degradation probed by NMR in Si-based negative electrode of Li-ion cell. Electrochem. commun., 33:72–75, 2013.
- [11] B. Jerliu, E. Hüger, L. Dörrer, B. K. Seidlhofer, R. Steitz, M. Horisberger, and H. Schmidt. Lithium insertion into silicon electrodes studied by cyclic voltammetry and operando neutron reflectometry. Phys. Chem. Chem. Phys., 20(36):23480–23491, 2018.
- [12] D. Mazouzi, N. Delpuech, Y. Oumellal, M. Gauthier, M. Cerbelaud, J. Gaubicher, N. Dupré, P. Moreau, D. Guyomard, L. Roué, and B. Lestriez. New insights into the silicon-based electrode’s irreversibility along cycle life through simple gravimetric method. J. Power Sources, 220:180–184, 2012.
- [13] H. G. Steinrück, C. Cao, G. M. Veith, and M. F. Toney. Toward quantifying capacity losses due to solid electrolyte interphase evolution in silicon thin film batteries. J. Chem. Phys., 152(8), 2020.
- [14] J. Li, K. Adewuyi, N. Lotfi, R.G. Landers, and J. Park. A single particle model with chemical/mechanical degradation physics for lithium ion battery state of health (soh) estimation. Appl. Energy, 212:1178–1190, 2018.
- [15] K. Kalaga, M. T. F. Rodrigues, S. E. Trask, I. A. Shkrob, and D. P. Abraham. Calendar-life versus cycle-life aging of lithium-ion cells with silicon-graphite composite electrodes. Electrochim. Acta, 280:221–228, 2018.
- [16] J. B. Goodenough and Y. Kim. Challenges for rechargeable Li batteries. Chem. Mat., 22(3):587–603, 2010.
- [17] B. Horstmann, F. Single, and A. Latz. Review on multi-scale models of solid-electrolyte interphase formation. Curr. Opin. Electrochem., 13:61–69, 2019.
- [18] A. Wang, S. Kadam, H. Li, S. Shi, and Y. Qi. Review on modeling of the anode solid electrolyte interphase (SEI) for lithium-ion batteries. Npj Comput. Mater., 4(1):1–26, 2018.
- [19] P. Lu, C. Li, E. W. Schneider, and S. J. Harris. Chemistry, impedance, and morphology evolution in solid electrolyte interphase films during formation in lithium ion batteries. J. Phys. Chem. C, 118(2):896–903, 2014.
- [20] D. Aurbach, B. Markovsky, M. D. Levi, E. Levi, A. Schechter, M. Moshkovich, and Y. Cohen. New insights into the interactions between electrode materials and electrolyte solutions for advanced nonaqueous batteries. J. Power Sources, 81-82:95–111, 1999.
- [21] M. Winter. The solid electrolyte interphase - The most important and the least understood solid electrolyte in rechargeable Li batteries. Z. Phys. Chem., 223(10-11):1395–1406, 2009.
- [22] K. Xu. Nonaqueous liquid electrolytes for lithium-based rechargeable batteries. Chem. Rev., 104(10):4303–4417, 2004.
- [23] V. A. Agubra and J. W. Fergus. The formation and stability of the solid electrolyte interface on the graphite anode. J. Power Sources, 268:153–162, 2014.
- [24] S. J. An, J. Li, C. Daniel, D. Mohanty, S. Nagpure, and D. L. Wood. The state of understanding of the lithium-ion-battery graphite solid electrolyte interphase (SEI) and its relationship to formation cycling. Carbon, 105:52–76, 2016.
- [25] P. Lu and S. J. Harris. Lithium transport within the solid electrolyte interphase. Electrochem. commun., 13(10):1035–1037, 2011.
- [26] K. Xu. Electrolytes and interphases in Li-ion batteries and beyond. Chem. Rev., 114(23):11503–11618, 2014.
- [27] W. Huang, J. Wang, M. R. Braun, Z. Zhang, Y. Li, D. T. Boyle, P. C. McIntyre, and Y. Cui. Dynamic Structure and Chemistry of the Silicon Solid-Electrolyte Interphase Visualized by Cryogenic Electron Microscopy. Matter, 1(5):1232–1245, 2019.
- [28] M. Boniface, L. Quazuguel, J. Danet, D. Guyomard, P. Moreau, and P. Bayle-Guillemaud. Nanoscale Chemical Evolution of Silicon Negative Electrodes Characterized by Low-Loss STEM-EELS. Nano Lett., 16(12):7381–7388, 2016.
- [29] A. Tokranov, B. W. Sheldon, C. Li, S. Minne, and X. Xiao. In situ atomic force microscopy study of initial solid electrolyte interphase formation on silicon electrodes for Li-ion batteries. ACS Appl. Mater. Interfaces, 6(9):6672–6686, 2014.
- [30] A. Tokranov, R. Kumar, C. Li, S. Minne, X. Xiao, and B. W. Sheldon. Control and Optimization of the Electrochemical and Mechanical Properties of the Solid Electrolyte Interphase on Silicon Electrodes in Lithium Ion Batteries. Adv. Energy Mater., 6(8):1–12, 2016.
- [31] R. Kumar, A. Tokranov, B. W. Sheldon, X. Xiao, Z. Huang, C. Li, and T. Mueller. In Situ and Operando Investigations of Failure Mechanisms of the Solid Electrolyte Interphase on Silicon Electrodes. ACS Energy Lett., 1(4):689–697, 2016.
- [32] G. M. Veith, M. Doucet, R. L. Sacci, B. Vacaliuc, J. K. Baldwin, and J. F. Browning. Determination of the Solid Electrolyte Interphase Structure Grown on a Silicon Electrode Using a Fluoroethylene Carbonate Additive. Sci. Rep., 7(1):1–15, 2017.
- [33] K. Edström, M. Herstedt, and D. P. Abraham. A new look at the solid electrolyte interphase on graphite anodes in Li-ion batteries. J. Power Sources, 153(2):380–384, 2006.
- [34] E. Peled and S. Menkin. Review—SEI: Past, Present and Future. J. Electrochem. Soc., 164(7):A1703–A1719, 2017.
- [35] M. Broussely, S. Herreyre, P. Biensan, P. Kasztejna, K. Nechev, and R. J. Staniewicz. Aging mechanism in Li ion cells and calendar life predictions. J. Power Sources, 97-98:13–21, 2001.
- [36] F. Single, A. Latz, and B. Horstmann. Identifying the Mechanism of Continued Growth of the Solid–Electrolyte Interphase. ChemSusChem, 11(12):1950–1955, 2018.
- [37] H. J. Ploehn, P. Ramadass, and R. E. White. Solvent Diffusion Model for Aging of Lithium-Ion Battery Cells. J. Electrochem. Soc., 151(3):A456–A462, 2004.
- [38] F. Single, B. Horstmann, and A. Latz. Revealing SEI Morphology: In-Depth Analysis of a Modeling Approach. J. Electrochem. Soc., 164(11):E3132–E3145, 2017.
- [39] F. Single, B. Horstmann, and A. Latz. Dynamics and morphology of solid electrolyte interphase (SEI). Phys. Chem. Chem. Phys., 18(27):17810–17814, 2016.
- [40] M. B. Pinson and M. Z. Bazant. Theory of SEI Formation in Rechargeable Batteries: Capacity Fade, Accelerated Aging and Lifetime Prediction. J. Electrochem. Soc., 160(2):A243–A250, 2012.
- [41] M. Tang and J. Newman. Electrochemical Characterization of SEI-Type Passivating Films Using Redox Shuttles. J. Electrochem. Soc., 158(5):A530–A536, 2011.
- [42] M. Tang and J. Newman. Transient Characterization of Solid-Electrolyte-Interphase Using Ferrocene. J. Electrochem. Soc., 159(3):A281–A289, 2012.
- [43] M. Tang, S. Lu, and J. Newman. Experimental and Theoretical Investigation of Solid-Electrolyte-Interphase Formation Mechanisms on Glassy Carbon. J. Electrochem. Soc., 159(11):A1775–A1785, 2012.
- [44] A. A. Tahmasbi, T. Kadyk, and M. H. Eikerling. Statistical Physics-Based Model of Solid Electrolyte Interphase Growth in Lithium Ion Batteries. J. Electrochem. Soc., 164(6):A1307–A1313, 2017.
- [45] F. Hao, Z. Liu, P. B. Balbuena, and P. P. Mukherjee. Mesoscale Elucidation of Solid Electrolyte Interphase Layer Formation in Li-Ion Battery Anode. J. Phys. Chem. C, 121(47):26233–26240, 2017.
- [46] F. Röder, R. D. Braatz, and U. Krewer. Multi-Scale Modeling of Solid Electrolyte Interface Formation in Lithium-Ion Batteries. Comput. Aided Chem. Eng., 38:157–162, 2016.
- [47] L. von Kolzenberg, A. Latz, and B. Horstmann. Solid–Electrolyte Interphase During Battery Cycling: Theory of Growth Regimes. ChemSusChem, 13(15):3901–3910, 2020.
- [48] M. Broussely, P. Biensan, F. Bonhomme, P. Blanchard, S. Herreyre, K. Nechev, and R. J. Staniewicz. Main aging mechanisms in Li ion batteries. J. Power Sources, 146(1-2):90–96, 2005.
- [49] J. Christensen and J. Newman. A Mathematical Model for the Lithium-Ion Negative Electrode Solid Electrolyte Interphase. J. Electrochem. Soc., 151(11):A1977–A1988, 2004.
- [50] A. M. Colclasure, K. A. Smith, and R. J. Kee. Modeling detailed chemistry and transport for solid-electrolyte-interface (SEI) films in Li-ion batteries. Electrochim. Acta, 58(1):33–43, 2011.
- [51] F. Röder, R. D. Braatz, and U. Krewer. Multi-Scale Simulation of Heterogeneous Surface Film Growth Mechanisms in Lithium-Ion Batteries. J. Electrochem. Soc., 164(11):E3335–E3344, 2017.
- [52] S. Das, P. M. Attia, W. C. Chueh, and M. Z. Bazant. Electrochemical kinetics of SEI growth on carbon black II: Modeling. J. Electrochem. Soc., 166(4):E107–E118, 2019.
- [53] D. Li, D. Danilov, Z. Zhang, H. Chen, Y. Yang, and P. H. L. Notten. Modeling the SEI-Formation on Graphite Electrodes in LiFePO4 Batteries. J. Electrochem. Soc., 162(6):A858–A869, 2015.
- [54] S. Shi, Y. Qi, H. Li, and L. G. Hector. Defect Thermodynamics and Diffusion Mechanisms in and Implications for the Solid Electrolyte Interphase in Li-Ion Batteries. J. Phys. Chem. C, 117(17):8579–8593, 2013.
- [55] F. A. Soto, Y. Ma, J. M. Martinez De La Hoz, J. M. Seminario, and P. B. Balbuena. Formation and Growth Mechanisms of Solid-Electrolyte Interphase Layers in Rechargeable Batteries. Chem. Mat., 27(23):7990–8000, 2015.
- [56] P. Keil, S. F. Schuster, J. Wilhelm, J. Travi, A. Hauser, R. C. Karl, and A. Jossen. Calendar Aging of Lithium-Ion Batteries. J. Electrochem. Soc., 163(9):A1872–A1880, 2016.
- [57] P. M. Attia, S. Das, S. J. Harris, M. Z. Bazant, and W. C. Chueh. Electrochemical kinetics of sei growth on Carbon Black: Part I. experiments. J. Electrochem. Soc., 166(4):E97–E106, 2019.
- [58] M. Chouchane, O. Arcelus, and A. A. Franco. Heterogeneous Solid‐Electrolyte Interphase in Graphite Electrodes Assessed by 4D‐Resolved Computational Simulations. Batter. Supercaps, pages 1–8, 2021.
- [59] T. Schmitt. Degradation Models and Simulation Tools for Lithium and Zinc Batteries. PhD thesis, Ulm University, 2019.
- [60] L. J. Bolay, T. Schmitt, O. S. Mendoza-Hernandez, Y. Sone, A. Latz, and B. Horstmann. Degradation of lithium-ion batteries in aerospace. In 2019 European Space Power Conference (ESPC), pages 1–3, 2019.
- [61] J. D. McBrayer, M. F. Rodrigues, M. C. Schulze, D. P. Abraham, C. A. Apblett, I. Bloom, G. M. Carroll, A. M. Colclasure, C. Fang, K. L. Harrison, G. Liu, S. D. Minteer, N. R. Neale, G. M. Veith, C. S. Johnson, J. T. Vaughey, A. K. Burrell, and B. Cunningham. Calendar aging of silicon-containing batteries. Nat. Energy, 6(9):866–872, 2021.
- [62] R. Kumar, P. Lu, X. Xiao, Z. Huang, and B. W. Sheldon. Strain-Induced Lithium Losses in the Solid Electrolyte Interphase on Silicon Electrodes. ACS Appl. Mater. Interfaces, 9(34):28406–28417, 2017.
- [63] M. K. Jangid, F. J. Sonia, R. Kali, B. Ananthoju, and A. Mukhopadhyay. Insights into the effects of multi-layered graphene as buffer/interlayer for a-Si during lithiation/delithiation. Carbon, 111:602–616, 2017.
- [64] K. Guo, R. Kumar, X. Xiao, B. W. Sheldon, and H. Gao. Failure progression in the solid electrolyte interphase (SEI) on silicon electrodes. Nano Energy, 68:104257, 2020.
- [65] R. Deshpande, M. Verbrugge, Y. Cheng, J. Wang, and P. Liu. Battery cycle life prediction with coupled chemical degradation and fatigue mechanics. J. Electrochem. Soc., 159(10):1730–1738, 2012.
- [66] J. Xu, R. D. Deshpande, J. Pan, Y. Cheng, and V. Battaglia. Electrode side reactions, capacity loss and mechanical degradation in lithium-ion batteries. J. Electrochem. Soc., 162(10):A2026–A2035, 2015.
- [67] R. D. Deshpande and D. M. Bernardi. Modeling Solid-Electrolyte Interphase (SEI) Fracture: Coupled Mechanical/Chemical Degradation of the Lithium Ion Battery. J. Electrochem. Soc., 164(2):A461–A474, 2017.
- [68] E. Rejovitzky, C. V. Di Leo, and L. Anand. A theory and a simulation capability for the growth of a solid electrolyte interphase layer at an anode particle in a Li-ion battery. J. Mech. Phys. Solids, 78:210–230, 2015.
- [69] Y. Kamikawa, K. Amezawa, and K. Terada. Chemomechanical simulation of lif-rich solid–electrolyte interphase formed from fluoroethylene carbonate on a silicon anode. ACS Appl. Energy Mater., 4(4):3231–3239, 2021.
- [70] A. Verma and P. P. Mukherjee. Mechanistic Analysis of Mechano-Electrochemical Interaction in Silicon Electrodes with Surface Film. J. Electrochem. Soc., 164(14):A3570–A3581, 2017.
- [71] D. E. Galvez-Aranda, A. Verma, K. Hankins, J. M. Seminario, P. P. Mukherjee, and P. B. Balbuena. Chemical and mechanical degradation and mitigation strategies for Si anodes. J. Power Sources, 419(February):208–218, 2019.
- [72] M. W. Verbrugge, Y. Qi, D. R. Baker, and Y. T. Cheng. Diffusion-Induced Stress within Core-Shell Structures and Implications for Robust Electrode Design and Materials Selection. Adv. Electrochem. Sci. Eng., 15:193–225, 2015.
- [73] Y. He and H. Hu. Analysis of lithium ion concentration and stress in the solid electrolyte interphase on the graphite anode. Phys. Chem. Chem. Phys., 17(36):23565–23572, 2015.
- [74] Y. He, H. Hu, K. Zhang, S. Li, and J. Chen. Mechanical insights into the stability of heterogeneous solid electrolyte interphase on an electrode particle. J. Mater. Sci., 52(5):2836–2848, 2017.
- [75] I. Laresgoiti, S. Käbitz, M. Ecker, and D. U. Sauer. Modeling mechanical degradation in lithium ion batteries during cycling: Solid electrolyte interphase fracture. J. Power Sources, 300:112–122, 2015.
- [76] Q. Deng, R. Hu, C. Xu, B. Chen, and J. Zhou. Modeling fracture of solid electrolyte interphase in lithium-ion batteries during cycling. J. Solid State Electrochem., 23(11):2999–3008, 2019.
- [77] K. Zhao, M. Pharr, L. Hartle, J. J. Vlassak, and Z. Suo. Fracture and debonding in lithium-ion batteries with electrodes of hollow core-shell nanostructures. J. Power Sources, 218:6–14, 2012.
- [78] M. Tanaka, J. B. Hooper, and D. Bedrov. Role of Plasticity in Mechanical Failure of Solid Electrolyte Interphases on Nanostructured Silicon Electrode: Insight from Continuum Level Modeling. ACS Appl. Energy Mater., 1(5):1858–1863, 2018.
- [79] N. Kotak, P. Barai, A. Verma, A. Mistry, and P. P. Mukherjee. Electrochemistry-Mechanics Coupling in Intercalation Electrodes. J. Electrochem. Soc., 165(5):A1064–A1083, 2018.
- [80] G. F. Castelli, L. von Kolzenberg, B. Horstmann, A. Latz, and W. Dörfler. Efficient simulation of chemical-mechanical coupling in battery active particles. Energy Technol., 2021.
- [81] I. Yoon, S. Jurng, D. P. Abraham, B. L. Lucht, and P. R. Guduru. Measurement of mechanical and fracture properties of solid electrolyte interphase on lithium metal anodes in lithium ion batteries. Energy Storage Mater., 25:296–304, 2020.
- [82] G. A. Holzapfel. Nonlinear Solid Mechanics. John Wiley & Sons, Ltd., Chichester, 2000.
- [83] A. Latz and J. Zausch. Thermodynamic consistent transport theory of Li-ion batteries. J. Power Sources, 196(6):3296–3302, 2011.
- [84] A. Latz and J. Zausch. Multiscale modeling of lithium ion batteries: Thermal aspects. Beilstein J. Nanotechnol., 6(1):987–1007, apr 2015.
- [85] M. Schammer, B. Horstmann, and A. Latz. Theory of Transport in Highly Concentrated Electrolytes. J. Electrochem. Soc., 2021.
- [86] F. Single, B. Horstmann, and A. Latz. Theory of Impedance Spectroscopy for Lithium Batteries. J. Phys. Chem. C, 2019.
- [87] J. Mandel. Plasticite classique et viscoplasticite:. CISM International Centre for Mechanical Sciences. Springer, 1972.
- [88] J. Lubliner. Plasticity Revised Edition. J. Appl. Mech., 59(1):540, 2006.
- [89] M. Danielsson, D. M. Parks, and M. C. Boyce. Constitutive modeling of porous hyperelastic materials. Mech. Mater., 36(4):347–358, 2004.
- [90] A. L. Gurson. Continuum theory of ductile rupture by void nucleation and growth: Part I—Yield criteria and flow rules for porous ductile media. J. Eng. Mater. Technol. Trans. ASME, 99:2–15, 1977.
- [91] V. Tvergaard. Influence of voids on shear band instabilities under plane strain conditions. Int. J. Fract., 17(4):389–407, 1981.
- [92] V. Tvergaard. Influence of void nucleation on ductile shear fracture at a free surface. J. Mech. Phys. Solids, 30(6):399–425, 1982.
- [93] V. Tvergaard and A. Needleman. Analysis of the cup-cone fracture in a round tensile bar. Acta Metall., 32(1):157–169, 1984.
- [94] F. Reusch, B. Svendsen, and D. Klingbeil. Local and non-local Gurson-based ductile damage and failure modelling at large deformation. Eur. J. Mech. A Solids, 22(6):779–792, 2003.
- [95] R. von Mises. Mechanik der plastischen Formänderung von Kristallen. J. Appl. Math. Mech., 8(3):161–185, 1928.
- [96] R. Hill. A variational principle of maximum plastic work in classical plasticity. Q. J. Mech. Appl. Math., 1(October):18–28, 1947.
- [97] R. Hill. On the state of stress in a plastic-rigid body at the yield point. Philos. Mag., 42(331):868–875, 1951.
- [98] G. Taylor. A connexion between the criterion of yield and the strain ratio. Proc. R. Soc. Lond. A Math. Phys. Sci., 191(1027):441–446, 1947.
- [99] A. Verma, A. A. Franco, and P. P. Mukherjee. Mechanistic Elucidation of Si Particle Morphology on Electrode Performance. J. Electrochem. Soc., 166(15):A3852–A3860, 2019.
- [100] V. B. Shenoy, P. Johari, and Y. Qi. Elastic softening of amorphous and crystalline Li-Si Phases with increasing Li concentration: A first-principles study. J. Power Sources, 195(19):6825–6830, 2010.
- [101] O. Borodin, G. D. Smith, and P. Fan. Molecular dynamics simulations of lithium alkyl carbonates. J. Phys. Chem. B, 110(45):22773–22779, 2006.
- [102] R. Naejus, D. Lemordant, R. Coudert, and P. Willmann. Excess thermodynamic properties of binary mixtures containing linear or cyclic carbonates as solvents at the temperatures 298.15 K and 315.15 K. J. Chem. Thermodyn., 29(12):1503–1515, 1997.
- [103] M. N. Obrovac and L. J. Krause. Reversible Cycling of Crystalline Silicon Powder. J. Electrochem. Soc., 154(2):A103, 2007.
- [104] E. M. Perassi and E. P. Leiva. Capacity fading model for a solid electrolyte interface with surface growth. Electrochim. Acta, 308:418–425, 2019.
- [105] C. Liu, O. Arcelus, T. Lombardo, H. Oularbi, and Alejandro A Franco. Towards a 3d-resolved model of si/graphite composite electrodes from manufacturing simulations. J. Power Sources, 512:230486, 2021.
- [106] R. Fang, M. Kronbichler, M. Wurzer, and W. A. Wall. Parallel, physics-oriented, monolithic solvers for three-dimensional, coupled finite element models of lithium-ion cells. Comput. Methods Appl. Mech. Eng., 350:803–835, 2019.
- [107] G. F. Castelli and W. Dörfler. The numerical study of a microscale model for lithium-ion batteries. Comput. Math. with Appl., 77(6):1527–1540, 2019.