Reproducible Performance Optimization of Complex Applications on the Edge-to-Cloud Continuum
Abstract
In more and more application areas, we are witnessing the emergence of complex workflows that combine computing, analytics and learning. They often require a hybrid execution infrastructure with IoT devices interconnected to cloud/HPC systems (aka Computing Continuum). Such workflows are subject to complex constraints and requirements in terms of performance, resource usage, energy consumption and financial costs. This makes it challenging to optimize their configuration and deployment.
We propose a methodology to support the optimization of real-life applications on the Edge-to-Cloud Continuum. We implement it as an extension of E2Clab, a previously proposed framework supporting the complete experimental cycle across the Edge-to-Cloud Continuum. Our approach relies on a rigorous analysis of possible configurations in a controlled testbed environment to understand their behaviour and related performance trade-offs. We illustrate our methodology by optimizing Pl@ntNet, a world-wide plant identification application. Our methodology can be generalized to other applications in the Edge-to-Cloud Continuum.
Index Terms:
Reproducibility, Methodology, Computing Continuum, Optimization.I Introduction
The continuous increase of IoT devices and captured data requires rethinking where to process data. Instead of the traditional data center compute model, one main approach used in big data is to leverage compute resources distributed at multiple processing points in the system – from endpoint devices at the edge of the network to data centers or HPC systems at its core. This distributed infrastructure, referred to as the Computing Continuum [1] (or Digital Continuum), combines heterogeneous computing resources that generate and process data across geographically distributed Edge, Fog, and Cloud/HPC infrastructures.
Real-world applications deployed on such hybrid infrastructure (e.g., smart factory [2], autonomous vehicles [3], among others) typically need to comply with many constraints related to resource consumption (e.g., GPU, CPU, memory, storage and bandwidth capacities), software components composing the application and requirements such as QoS, security, and privacy [4]. Furthermore, optimizing application workflows on distributed and heterogeneous resources (i.e., minimizing processing latency, energy consumption, financial costs, etc.) is challenging. The parameter settings of the applications and the underlying infrastructure result in a complex multi-infrastructure configuration search space [5].
The intricacies of these configurations require, prior to production-level deployment, analysis in a controlled testbed environment in order to understand their performance trade-offs (i.e., latency and energy consumption, throughput and resource usage, cost and service availability, etc.) [6, 7].
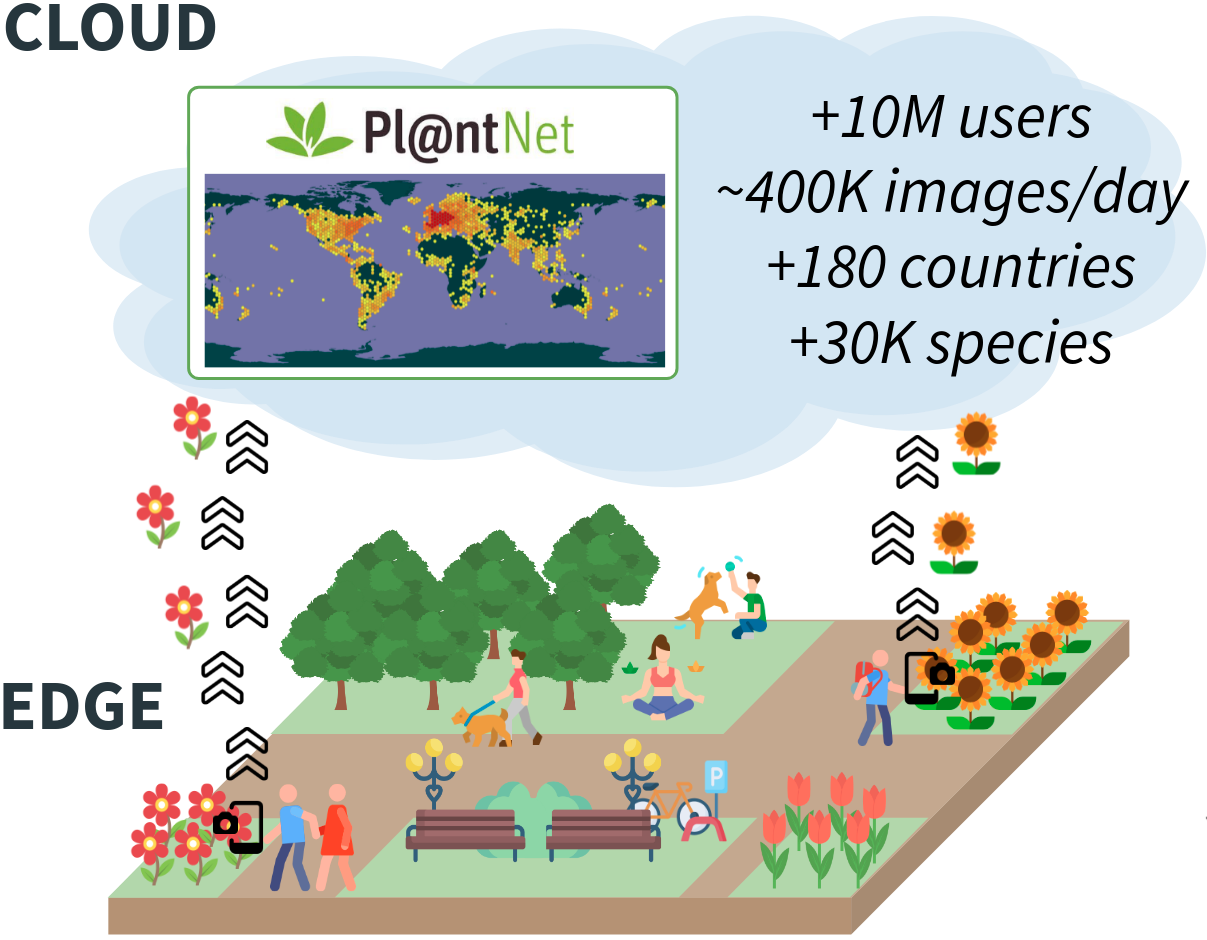
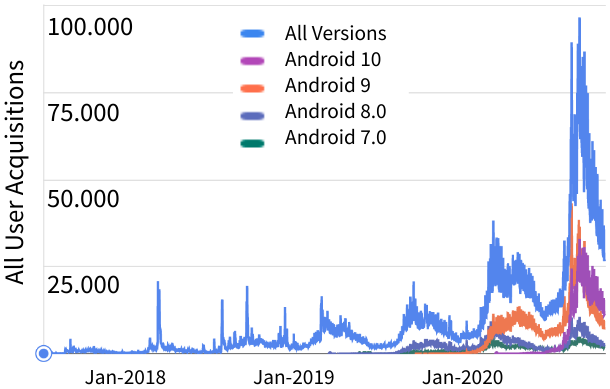
Let us illustrate this problem with Pl@ntNet [8], a large-scale participatory application for botanical data and AI-based plant identification. Pl@ntNet’s main feature is a mobile app that allows smartphone users to identify plants from photos and share their observations (Figure 1). It has more than 10 million users all around the world and processes about 400K plant images per day. One main challenge faced by Pl@ntNet engineers is to anticipate the necessary evolution of the infrastructure to pass the upcoming spring peak (Figure 2) and adapt the system configuration to some expected evolution of application usage (e.g., an increase of its number of users).
There are simulation and emulation tools for the Cloud, Fog, Edge, Fog-to-Cloud, Edge-to-Fog [9, 10, 11, 12]. However, there is no solution for large-scale deployment and evaluation of real-life applications on testbeds that cover the entire Computing Continuum as a whole and guide application optimization (i.e., minimizing costs, latency, resource consumption, among others) of the entire application workflow.
In this paper, we propose a methodology to support the optimization of real-life applications on the Edge-to-Cloud Continuum. This methodology is useful to help decide on application configurations to optimize relevant metrics (e.g., performance, resource usage, energy consumption, etc.) by means of computationally tractable optimization techniques [13]. It eases the configuration of the system components distributed on Edge, Fog, and Cloud infrastructures as well as the decision where to execute the application workflow components to minimize communication costs and end-to-end latency.
We implemented this methodology as an extension of the E2Clab [14] framework for automatic application deployment and reproducible experimentation. This paper has the following main contributions:
-
1.
A methodology to optimize the performance of real-life applications on the Computing Continuum, leveraging computationally tractable optimization techniques (Section III).
-
2.
An implementation of this optimization methodology as an extension of the E2Clab framework for reproducible analysis of applications on the Edge-to-Cloud continuum. For this purpose, we enhanced E2Clab with an optimization layer. To the best of our knowledge, this enhanced version of E2Clab is the first framework to support the complete deployment and analysis cycle of a complex workflow executed on the Computing Continuum (Section III-D).
- 3.
II Background
Application workflows that need to be deployed across Edge-to-Cloud infrastructures usually have to configure their software components while considering various infrastructure constraints. For instance, in the Cloud, configurations can include compute and storage configurations, the number of topics in a data ingestion system, reserved memory in data processing frameworks, the inter-cloud network latency, etc. In the Fog, they can include the streaming window size on gateways, the network latency and bandwidth between Fog devices, among others. In the Edge we can refer to device capabilities, the frequency of data emission, the power consumption, among others. These environment settings and configuration parameters are extremely vast and their combination of possibilities virtually unlimited. Hence, the process of searching the ideal deployment and configuration of those real-life applications is challenging given the search space complexity: bad choices may result in increased financial expenses during deployment and production phases, decreased processing efficiency and poor user experience.
II-A A real-life application: Pl@ntNet
Pl@ntNet is a participatory application and platform dedicated to the production of botanical data and plant identification. Currently, the data consists of +35K plant species collected from more than 200 countries. As illustrated in Figure 1, using the Pl@ntNet mobile application, users (located in the Edge) may identify plants from pictures taken by their phones. Before sending these pictures, some preprocessing is done to reduce the image size.
Then, the Pl@ntNet Identification Engine (located in the Cloud), subject to analysis in this work, is responsible for the automatic identification of species through Deep Learning. In a nutshell, the Identification Engine performs two main activities: (1) Species prediction: refers to the feature extraction and classification of user images; and (2) Similarity Search: searches for the images of the botanical databases that are the most similar to the user images. At the end of the processing, the Identification Engine returns the ranked list of most probable species with their respective, most similar plant pictures, allowing interactive validation by the users.
The processing performance of the Identification Engine strongly depends on the thread pool size configured to process the various tasks involved during the identification of users images. Table II presents the execution order of all tasks, the thread pool they belong to, and in which hardware they take place. Table II describes the role of each thread pool and an example of configuration currently used in the Pl@ntNet production servers. This configuration was defined by Pl@ntNet engineers based on their best practical experience with the Pl@ntNet system considering mainly the following: (a) for thread pools using CPU: a machine with 40 CPU cores available; and (b) for the GPU thread pool: the maximum number of threads which fit in GPU memory.
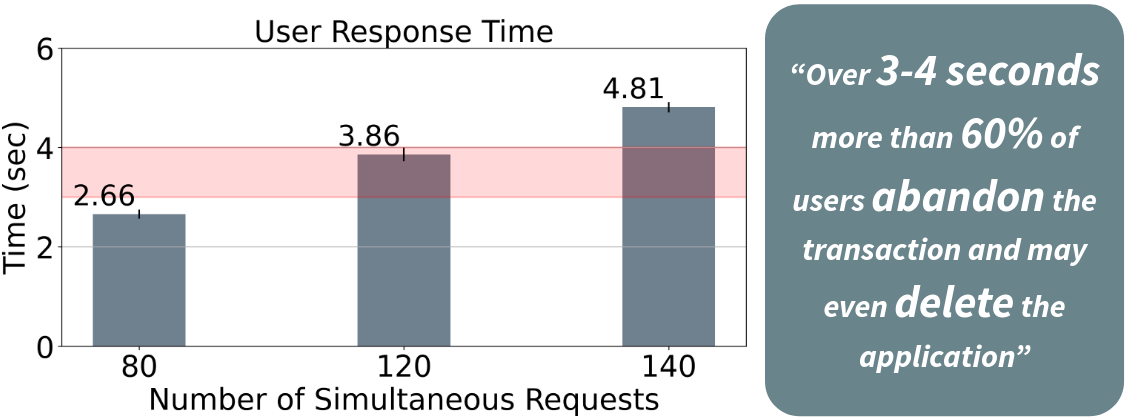
The main performance metric for this application is the user response time. A preliminary analysis [16] showed that to achieve a 4 seconds response time (the maximum tolerated by users) the thread pool and hardware configurations can not serve more than 120 simultaneous requests (3.86), as shown in Figure 3. In this context, meaningful questions that arise are: Is there a better thread pool allocation that minimizes the user response time? How many more users can the system serve if we find a better thread pool configuration? The answers to those questions and more analytical insights will be presented in Section IV through the use of our proposed methodology and its implementation in the E2Clab framework.
| Task | Description | Thread pool | Hardware |
|---|---|---|---|
| pre-process | Decoding the query parameters. | HTTP | CPU |
| wait-download | Wait for an available download thread. | HTTP, Download | CPU |
| download | Download images. | Download | CPU |
| wait-extract | Wait for an available extractor thread. | HTTP, Extract | CPU, GPU |
| extract | DNN inference of the image. | Extract | GPU |
| process | Process classification and similarity search output at query level. | HTTP | CPU |
| wait-simsearch | Wait for an available similarity search thread. | HTTP, Simsearch | CPU |
| simsearch | Search the most similar images in our database. | Simsearch | CPU |
| post-process | Check processed query results and format the response. | HTTP | CPU |
| Thread pool | Size (# threads) | Description | Hardware |
|---|---|---|---|
| HTTP | 40 | # simultaneous requests being processed. | CPU |
| Download | 40 | # simultaneous images being downloaded. | CPU |
| Extract | 7 | # simultaneous inferences in a single GPU. | GPU |
| Simsearch | 40 | # simultaneous similarity search. | CPU |
Let us highlight that Pl@ntNet is representative of other applications in the context of the Computing Continuum. As illustrated in Figure 1, it consists of many geographically distributed devices (over 10 million users) that collect and send data (about 400K plant images per day), and perform preprocessing at the Edge, followed by extensive processing (e.g., species prediction, similarity search, etc.) in centralized Cloud/HPC infrastructures.
II-B Formalizing deployment optimization on the Edge-to-Cloud Continuum
We describe our optimization problem by defining: the optimization variables, the objective function, and the constraints (Equation 1).
| (1) | ||||||
| subject to | ||||||
Typically, Edge-to-Cloud deployment optimization problems aim at optimizing metrics [6, 17] related to: performance (e.g., execution time, latency, and throughput), resource usage (e.g., GPU, CPU, memory, storage, and network), energy consumption, financial costs, and quality attributes (e.g., reliability, security, and privacy). Therefore, regarding the formulation of an optimization problem and its mathematical representation in Equation 1, the optimization variables refer to the variables associated with the optimization problem (e.g., storage capacity of Edge devices, or number of cores on Fog nodes).
The objective function refers to the optimization objective, such as minimizing or maximizing a given metric or set of metrics (e.g., performance, energy consumption). The objective function maps the values of the optimization variables onto real numbers and may be classified as single-objective (such as minimizing Edge-to-Cloud processing latency) or multi-objective (e.g., minimizing energy consumption of Fog nodes and maximize throughput).
Finally, the constraints refer to requirements that a given solution must satisfy. Constraints may refer to a specific optimization variable (e.g., number of cores on Fog nodes between 10 and 20) and the metrics to be optimized by the objective function (e.g., the maximum response time must be less than 3 seconds).
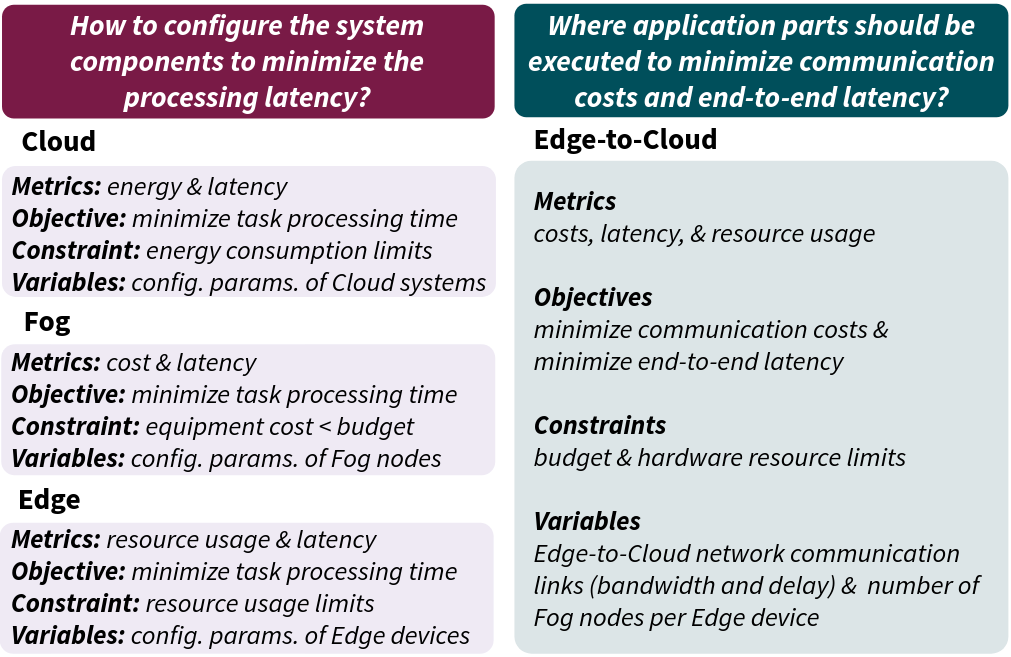
Figure 4 depicts some examples of optimization problems. Left, one would like to answer the question: how to configure the system components to minimize processing latency? To reduce complexity, the optimization problem is divided into three sub-problems each one with the objective of minimizing the task processing time on the Edge, Fog, and Cloud infrastructures, under specific constraints. The right-hand example aims at answering the question: where should the workflow components be executed to minimize communication costs and end-to-end latency? This translates into a single multi-objective optimization problem (minimizing communication costs and end-to-end latency), as opposed to the previous example (several single-objective optimization problems).
In order to model and solve such optimization problems, one may find multiple methods and packages in the literature. For instance, packages and libraries such as Scikit-Optimize [18], Scikit-Learn [19], Surrogate Modeling Toolbox (SMT) [20], DeepHyper [21], etc., may be used to build surrogate models and then use those model to explore the search space of the optimization problem.
II-C E2Clab: reproducible Edge-to-Cloud experiments
E2Clab [14] is a framework that implements a rigorous methodology for designing experiments with real-world workloads on the Edge-to-Cloud Computing Continuum. This methodology, illustrated in Figure 6, provides guidelines to move from real-world use cases to the design of relevant testbed setups for experiments enabling researchers to understand performance and to support the reproducibility of the experiments.
E2Clab architecture is described in Figure 7. The idea is that experiments can accurately reproduce relevant behaviors of a given application workflow on representative settings of the physical infrastructure underlying this application.
The key features provided by E2Clab are: (1) reproducible experiments; (2) the mapping of applications parts executed across the computing continuum with the physical testbed; (3) the support for experiment variation and transparent scaling of the scenario; (4) network emulation to define Edge-to-Cloud communication constraints; and (5) experiment deployment, monitoring and backup of results. E2Clab is open source and is available at [22].
III A Methodology for Optimizing the Performance of Applications on the Edge-to-Cloud Continuum
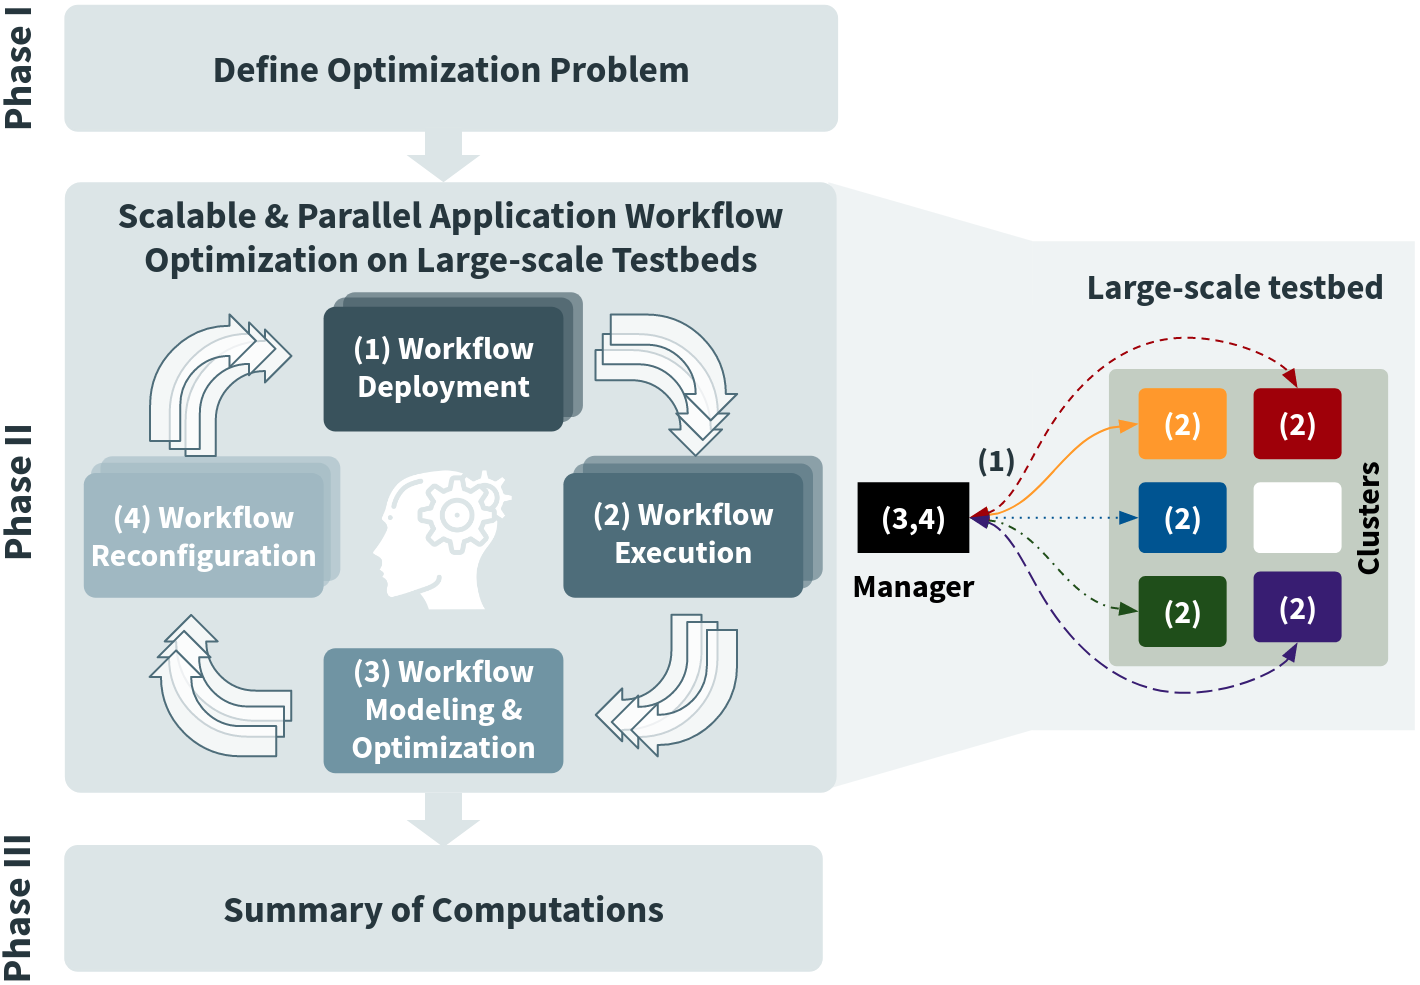
Our optimization methodology supports reproducible parallel optimization of application workflows on large-scale testbeds. It consists of three main phases illustrated in Figure 5.
III-A Phase I: Initialization
This phase, depicted at the top of Figure 5, consists in defining the optimization problem. The user must specify: the optimization variables that compose the search space to be explored (e.g., GPUs used for processing, Fog nodes in the scenario, network bandwidth, etc.); the objective (e.g., minimize end-to-end latency, maximize Fog gateway throughput, etc.); and constraints (e.g. the upper and lower bounds of optimization variables, budget, response time latency, etc.).
One may focus the optimization on: (1) specific parts of the infrastructure (e.g., only on geographically distributed Edge sites, or only on Fog-to-Cloud resources) by defining multiple, per infrastructure, optimization problems, as presented in the left side of Figure 4. This approach reduces the search space complexity (in case of use cases with large search spaces) and hence the computing time; (2) or the whole Edge-to-Cloud infrastructure as a single optimization problem, as presented in the right side of Figure 4.
III-B Phase II: Evaluation
This phase aims at defining the mathematical methods and optimization techniques used in the optimization cycle (presented in the middle of Figure 5) to explore the search space. Such optimization cycle consists in: (1) parallel deployment of the application workflow in a large-scale testbed; (2) their simultaneous execution; (3) asynchronous model optimization; and (4) reconfiguration of the application workflow for a new evaluation.
This cycle continues until model convergence. Depending on the run time characteristics of the application workflows, their evaluations may be performed differently.
III-B1 Long-time Running Applications
refer to experiments or simulations for which the evaluation of a single point in the search space requires a lot of time to complete (e.g., hours, or even days). Furthermore, since application workflows in the context of the Computing Continuum typically consist of cross-infrastructure parameter configurations resulting in a myriad of configuration possibilities, their optimization problem presents a complex and large search space.
For those long-time running applications, a variety of Bayesian Optimization [23] methods (e.g., surrogate models as: Gaussian process (Kriging) [24], Decision Trees [25], Random Forest [26], Gradient Boosting Regression Trees [27], Support Vector Machine [28], Polynomial Regression [29], among others) may be applied as candidates to explore the search space. Their generation is described below.
Surrogate Model Building: this consists of three steps: (a) a few sample points are generated, respecting the upper and lower limits of each optimization variable that composes the search space. Sampling methods such as Latin Hypercube Sample [30] or Low Discrepancy Sample [31] may be applied; (b) then, from the generated sample, parallel experiments (deployment of application workflows) are run for each parameter set; (c) lastly, the surrogate model is trained on the dataset generated in the previous step.
Model Retraining & Application Optimization: once the surrogate model is trained on the sample points previously generated, it is used to explore the optimization search space by deciding the subsequent application configurations to be evaluated in parallel. As soon as the evaluations finish, the model is retrained and optimized asynchronously, then new points are suggested to be evaluated.
III-B2 Short-time Running Applications
refer to the case when a few minutes are enough to evaluate a single point in the search space. Such applications also follow the optimization cycle previously presented. Besides, they may also use surrogate models to explore the search space. However, differently from Long-time Running Use Cases, they can use other optimization techniques such as evolutionary algorithms and swarm intelligence based algorithms (e.g., Genetic Algorithm [32], Differential Evolution [33], Simulated Annealing [34], Particle Swarm Optimization [35], etc.).
III-C Phase III: Finalization
For reproducibility purposes, this last phase illustrated at the bottom of Figure 5 provides a summary of computations. Therefore, it provides: the definition of the optimization problem (optimization variables, objective, and constraints); the sample selection method; the surrogate models or search algorithms with their hyperparameters used to explore the search space of the optimization problem; and finally the best application configuration found. Providing all this information at the end of computations allows other researches to reproduce the research results.
III-D Implementation as an extension of the E2Clab framework
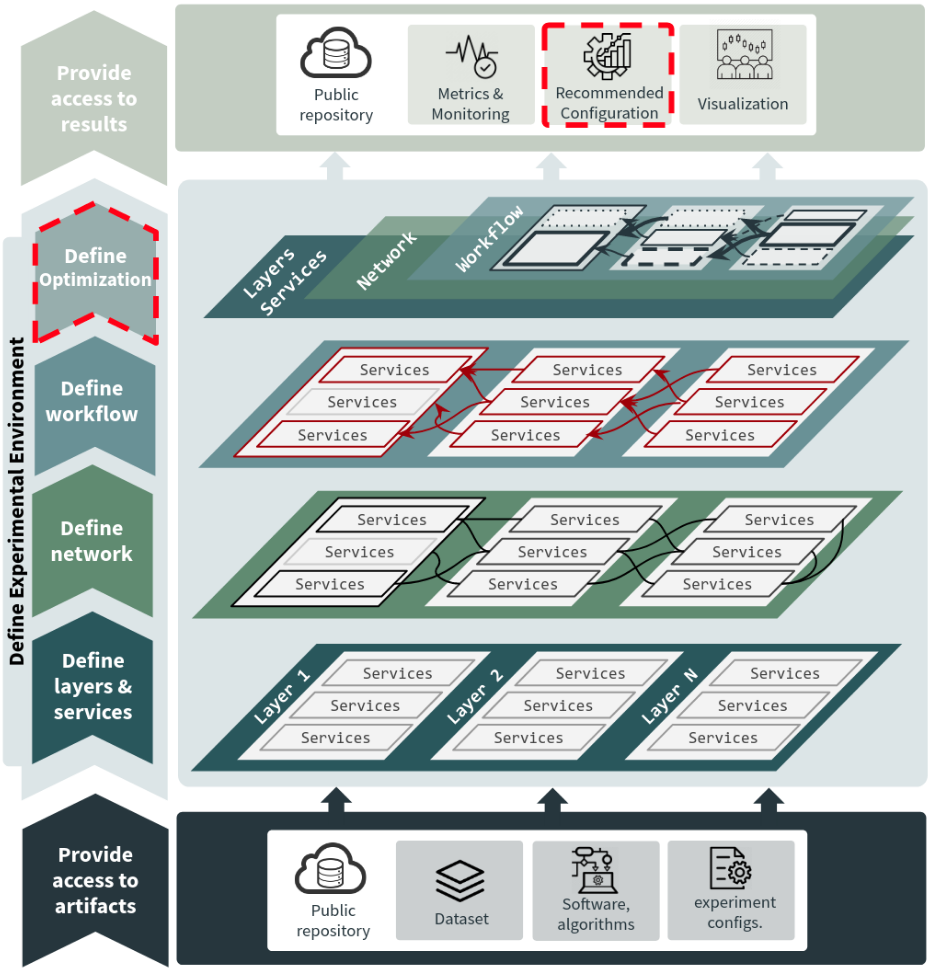
To validate our optimization approach, we enhanced the E2Clab framework for reproducible experimentation across the Edge-to-Cloud Continuum. We extended [22] the E2Clab framework [36] with support for the performance optimization of application workflows. Figure 6 shows a holistic view of our enhanced methodology containing the extensions highlighted in dashed lines colored in red. As one may note, we have added a new sub-process named Define Optimization (detailed in Figure 5) inside the Define the Experimental Environment process.
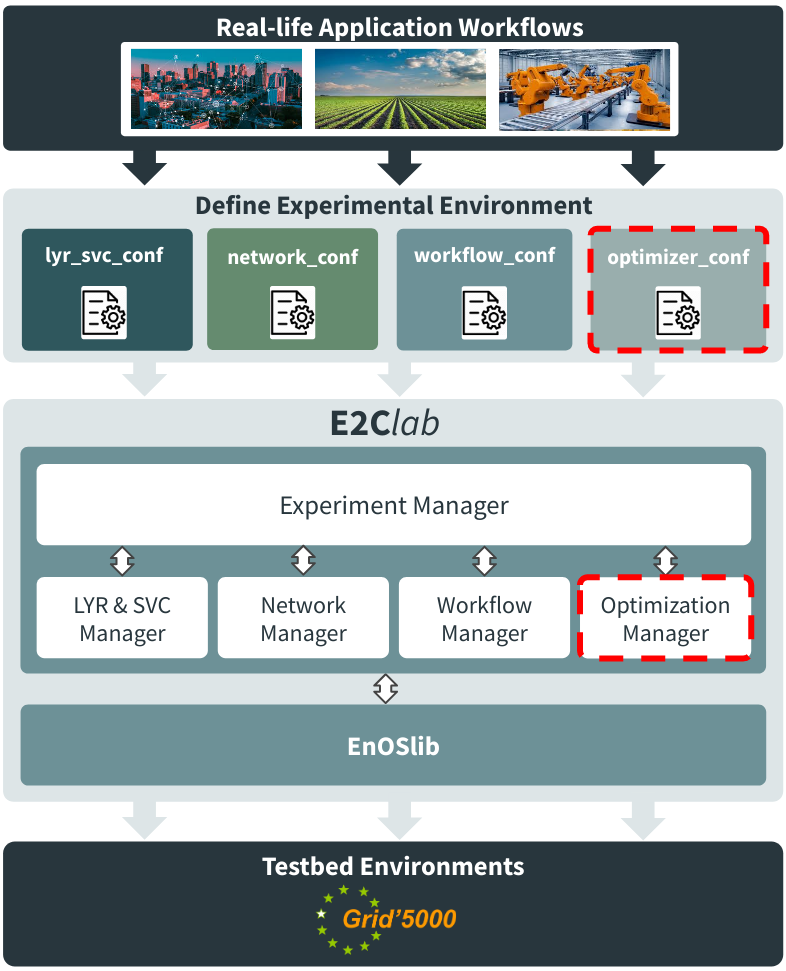
Figure 7 illustrates the E2Clab architecture. We designed a new manager named Optimization Manager (which implements the optimization approach in Figure 5). Its role is to: interpret the user-defined optimization setup defined in the optimizer_conf configuration file and then automate the optimization cycle (1. parallel deployment of the application workflow in a large-scale testbed; 2. simultaneous application workflow execution; 3. asynchronous model optimization; and 4. reconfiguration of the application workflow for a new evaluation) in order to optimize the application workflow. Laslty, the Optimization Manager provides a summary of computations for reproducibility purposes.
The Optimization Manager takes advantage of Ray [37] to run parallel application workflows on the Grid’5000 large-scale testbed. Ray Tune [38] provides state of the art search algorithms; manages model checkpoints and logging; and methods for analyzing training.
User-defined optimization (i.e., how to setup an optimization?): the Optimization Manager offers a class-based API that allows researchers to setup and control the model training. Users have to inherit the Optimization class and define in the run() function (Listing 1 line 5) the optimization configuration through several state of the art single-objective and multi-objective Bayesian Optimization search algorithms (e.g., from libraries such as Scikit-Optimize [18], Dragonfly [39], Ax [40], HEBO [41], among others). Next, users define in the run_objective() function (Listing 1 line 28) their optimization logic, which runs in parallel to train the model. To do so, the Optimization class provides the following three methods:
- 1.
- 2.
- 3.
Listing 1 shows how one may define an optimization problem (e.g., Pl@ntNet problem in Eq. 2). A detailed example may be found on the E2Clab documentation Web page [36].
IV Experimental Validation
In this section we illustrate our proposed optimization methodology by showing how it can be used to analyze the performance of the Pl@ntNet botanical application and to find its thread pool configurations. The goal of our experiments is to answer the following research questions:
-
1.
What is the software configuration, for a given hardware configuration, that minimizes the user response time?
-
2.
How does the number of simultaneous users accessing the system impact on the user response time?
-
3.
How do the Extraction and Similarity Search thread pool configurations impact the processing time and user response time?
The experimental setup is defined as follows:
a) Scenario Configuration: the experiments are carried out on 42 nodes of the Grid’5000 [15] testbed (clusters chifflot, chiclet, chetemi, chifflet, and gros). Since the Pl@ntNet Identification Engine requires GPU, it is deployed on the chifflot machines (model Dell PowerEdge R740), which are equipped with Nvidia Tesla V100-PCIE-32GB GPUs, Intel Xeon Gold 6126 (Skylake, 2.60GHz, 2 CPUs/node, 12 cores/CPU), 192GB of memory, 480GB SSD, and 25Gbps Ethernet interface. The clients submitting requests to the Pl@ntNet Identification Engine are deployed on the chiclet, chetemi, chifflet, and gros clusters. The network connection is configured with 10Gb.
b) Workloads: we defined three categories of workloads, according to the number of simultaneous requests (i.e., 80, 120, and 140) submitted to the Pl@ntNet Identification Engine during the whole experiment execution.
c) Configuration Parameters: Table II presents the parameters used to configure the thread pool size of the Pl@ntNet Engine. As presented in Equation 2, these parameters refer to the optimization variables of the optimization problem.
d) Performance Metrics: the metric of interest is the user response time. In Equation 2, this metric is to be minimized as the optimization objective. The user response time refers to the average time that a user waits for the response to a request. Besides this metric, we also analyze the identification processing time, which refers to the average time to process a user request. The identification processing is divided into multiple tasks running in parallel, as described in Table II.
We compare and analyze the user response time and identification processing time with respect to two thread pool configurations: baseline and preliminary optimum. The baseline refers to the current Pl@ntNet configuration used in the production servers. This configuration was defined by Pl@ntNet engineers based on their best practical experience with the Pl@ntNet system, as explained in Subsection II-A and presented in Table II.
The preliminary optimum configuration is the one found using our methodology. We named it preliminary since the optimization problem may have multiple minima and one may find other application configurations if a different technique is used (e.g., Gaussian Process (Kriging) [24], Gradient Boosting Regression Trees [27], among others). Besides, changes in the hardware configuration (e.g., size of GPU memory, number of CPU cores, among others) running the Pl@ntNet application will require a new search for the thread pool sizes since their configuration strongly depends on the hardware. In this case, our optimization methodology should be applied again. In a subsequent step, we further refine the preliminary optimum using sensitivity analysis, to obtain what we call refined optimum (see Section IV-C).
In order to obtain accurate measurements we run each experiment (each thread pool configuration) 7 times and each experiment has a duration of 23 minutes (1380 seconds). Besides, during the execution of each experiment we collect the metric values every 10 seconds. Therefore, the user response time is presented with the mean and standard deviation regarding 966 measurements ().
We highlight that, since through experiments we identified variations between measurements, we decided to repeat each configuration 6 times (7 experiments) to reduce the standard deviation of measurements. Besides, we run each experiment for 23 minutes with an interval of metric collection of 10 seconds to also minimize the standard deviation of the metrics collected. Furthermore, thanks to the repeatability feature provided in E2Clab, one may repeat those experiments easily by issuing the following command: e2clab optimize –repeat 6 –duration 1380 path/to/backup/experiments/ path/to/artifacts/.
IV-A What is the software configuration that minimizes the user response time?
The optimization problem to be solved can be stated as follows:
| Find | (2) | |||||
| Minimize | ||||||
| Subject to | ||||||
The function UserResponseTime is given by the parallel execution of the Pl@ntNet workflow on the Grid’5000 testbed, as described in Phase II of our methodology.
In order to define the search space dimensions we run experiments to identify the maximum upper bounds of variables that do not increase the user response time compared to the baseline Pl@ntNet configuration. Therefore, the lower and upper bounds of variables (see Equation 2) are of the baseline configuration (recall Table II), respectively.
The workload uses 80 simultaneous requests to the Pl@ntNet Identification engine. We highlight that this number has to be bigger than the upper bound of the HTTP thread pool size since the HTTP pool refers to the simultaneous requests being processed.
We leverage Bayesian Optimization since it is typically used for global optimization of black-box functions that are expensive to evaluate [42]. Extra Trees regressor is used as surrogate model [18] to model our expensive function. This surrogate model is improved by evaluating the UserResponseTime function at the next points. The goal is to find the minimum of UserResponseTime function with as few evaluations as possible. Listing 1 lines 6 to 11 detail the search algorithm parameters. The minimization has converged after 9 evaluations and the results are presented in Table III (considering a workload of 80 simultaneous requests). As one may note, the preliminary optimum configuration reduces the user response time by 7% and can serve 35% more simultaneous users (54 against 40, see the HTTP thread pool).
From the results, we highlight that thanks to our optimization methodology implemented in E2Clab, one may easily find an optimized application configuration. E2Clab abstracts all the complexities to: define the whole optimization problem (recall to Listing 1); deploy the application; run parallel evaluations of the optimization in a large-scale testbed; and collect all the experiments results. In the next subsections we enhance our analysis in order to: (a) understand the performance of both configurations for different workloads; and (b) better understand the performance results and their correlation with the resource usage.
| Thread pool | baseline |
|
||
|---|---|---|---|---|
| HTTP | 40 | 54 | ||
| Download | 40 | 54 | ||
| Extract | 7 | 7 | ||
| Simsearch | 40 | 53 | ||
| User response time | 2.657 () | 2.484 () |
IV-B How does the number of simultaneous users accessing the system impact on the user response time?
In order to understand the impact of different workloads on the user response time, we defined three workloads that represent simultaneous requests submitted to the Pl@ntNet system. The goal of these experiments is to compare the performance gains of the preliminary optimum thread pool configuration (found using our methodology) against the baseline (current Pl@ntNet configuration). Lastly, we exploit the maximum number of simultaneous requests that each configuration can handle considering the 3-4 seconds user response time constraint.


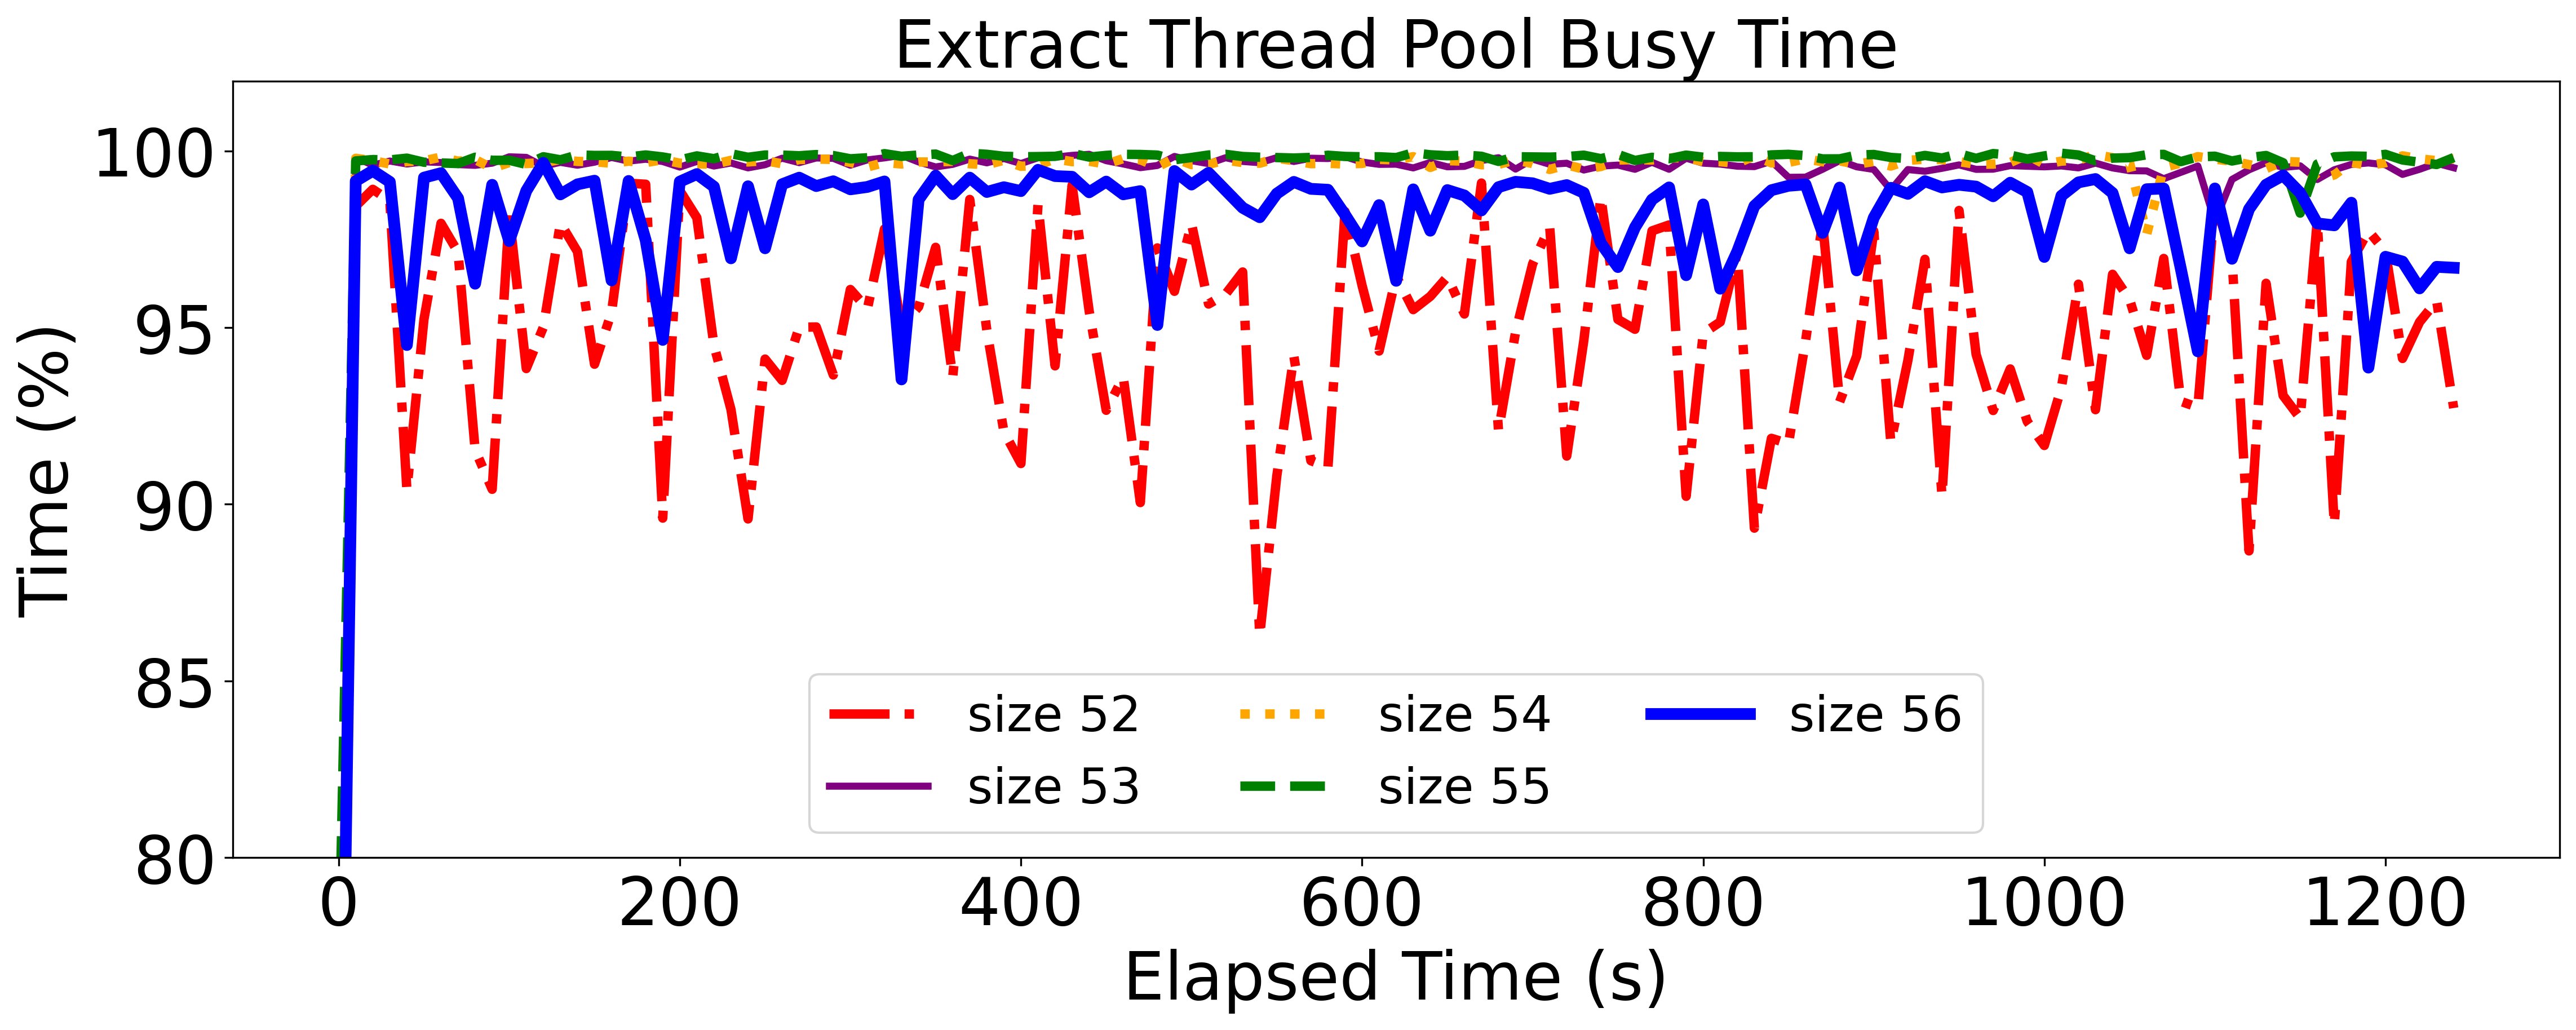
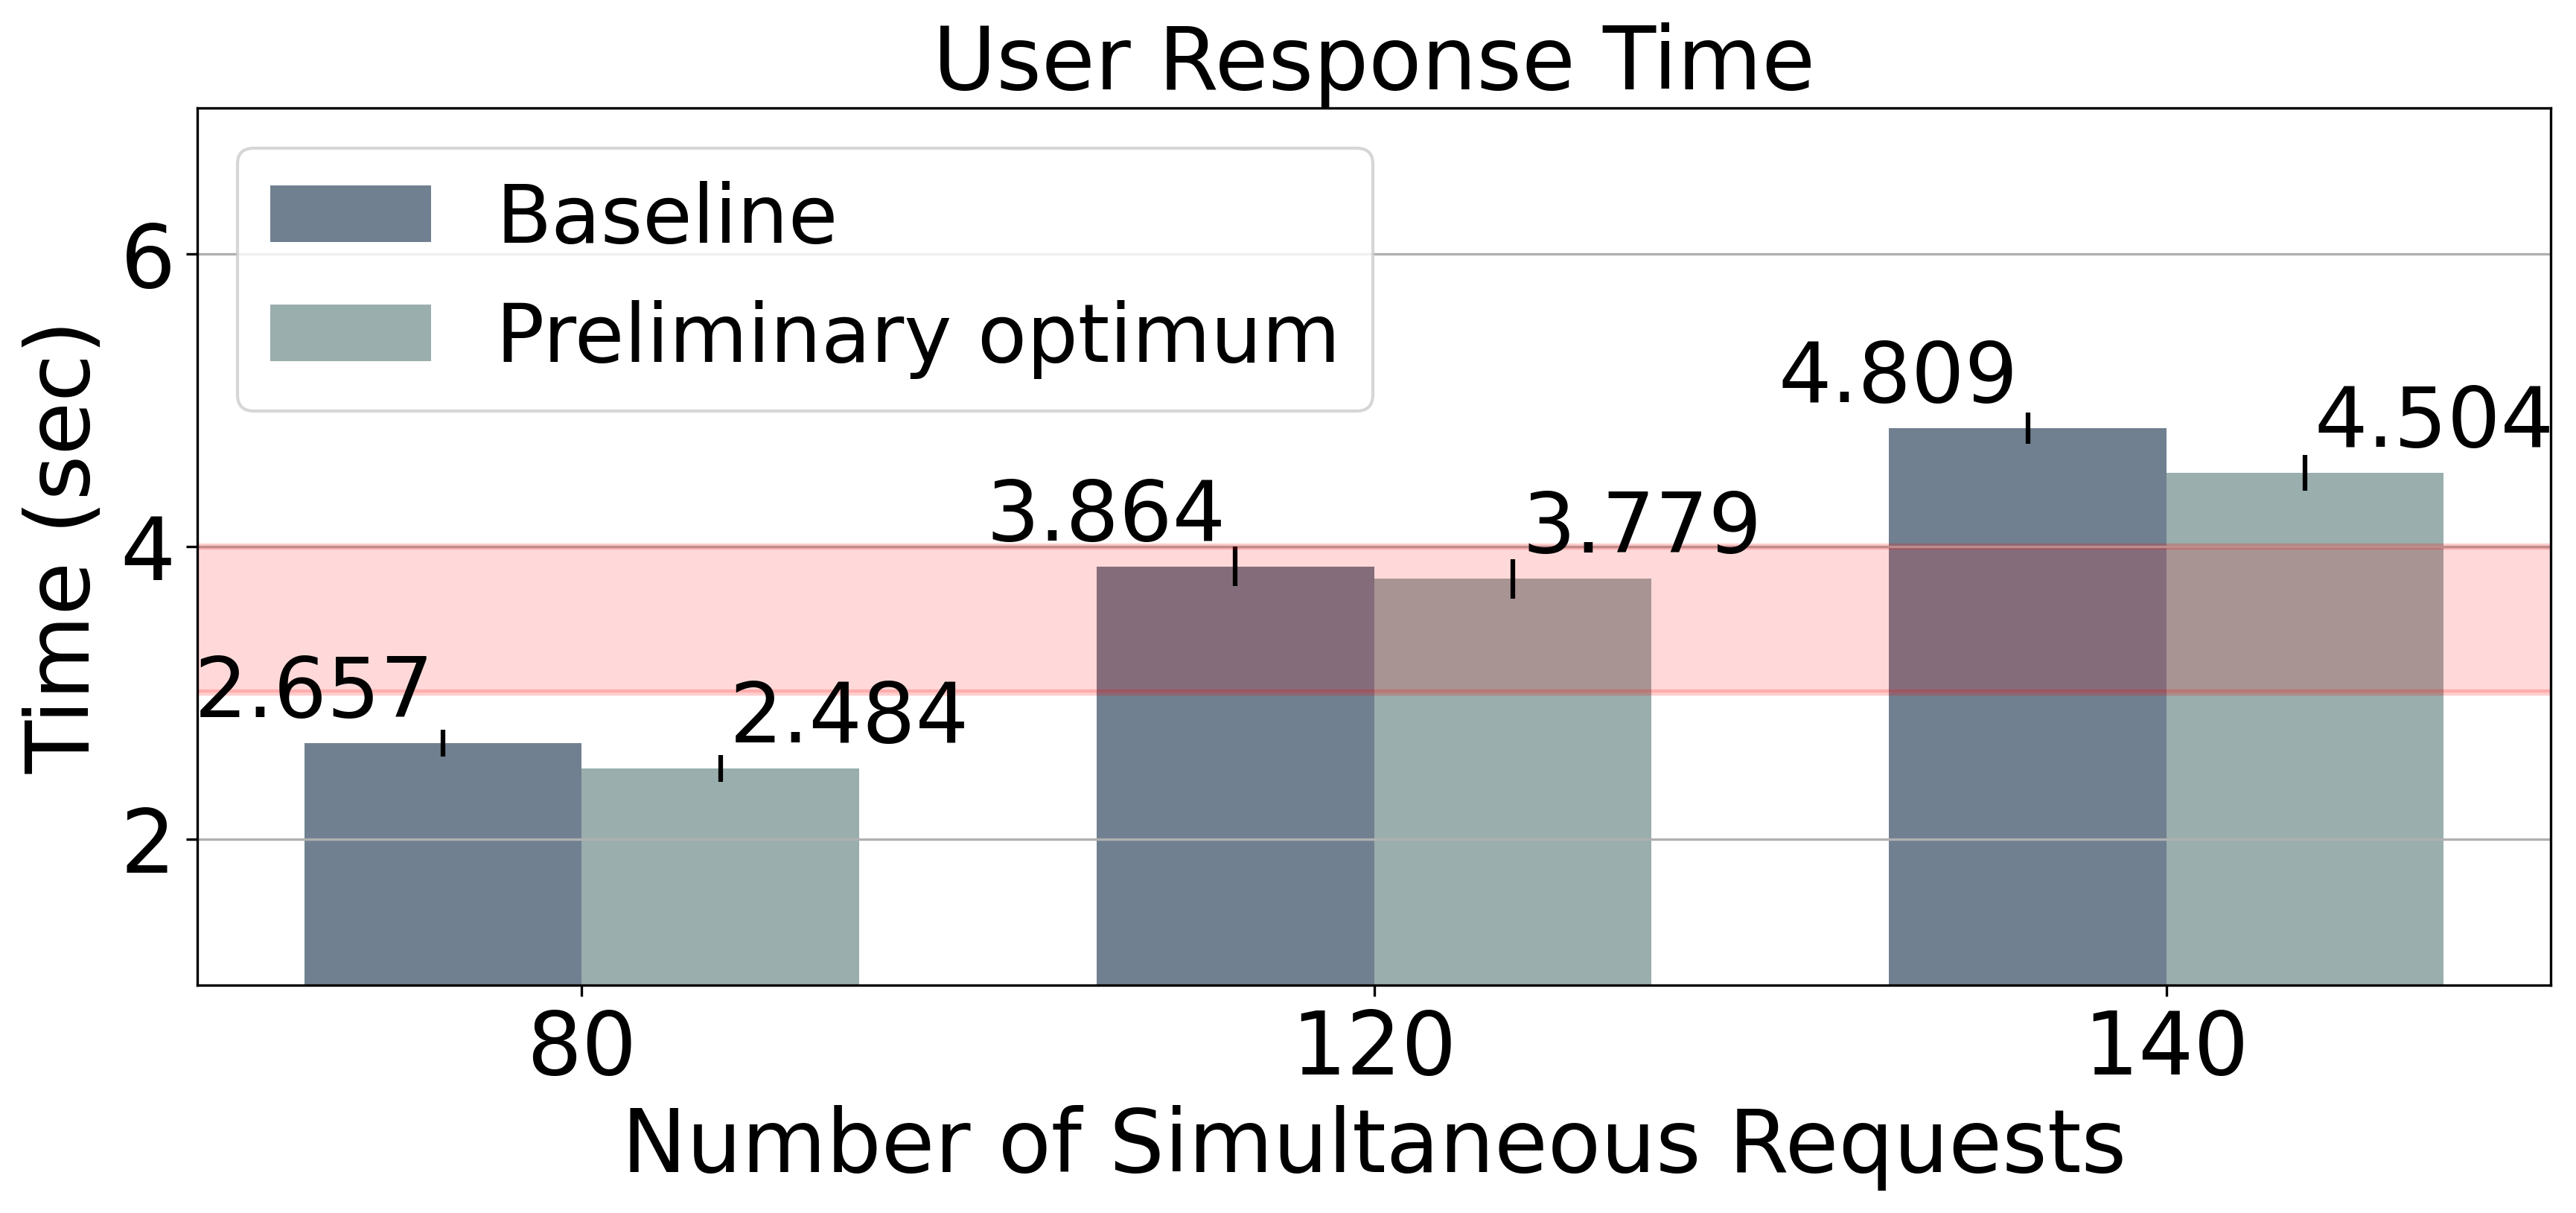
As presented in Figure 8, we scale up the workloads as follows: 80, 120, and 140 simultaneous requests. As one may note, in Figure 8 the preliminary optimum configuration outperforms the baseline for all workloads. We highlight that, the difference between them varied as follows: 6.9%, 2.2%, and 6.7% for 80, 120, and 140 simultaneous requests, respectively.
The main observation is that the preliminary optimum configuration (found using our methodology) outperforms the baseline thanks to a better thread pool allocation that allows the Pl@ntNet system to serve simultaneously 35% more requests (54 against 40) with a smaller user response time when compared to the baseline. We also highlight that, thanks to the transparent scaling feature provided by E2Clab, one may easily scale up the workloads to analyze their impact on the application performance.
IV-C How do the Extraction and Similarity Search thread pool configurations impact the processing and user response times?
Since the extraction and similarity search tasks are the most time consuming compared to the remaining ones, we zoom our analysis on them in an attempt to improve even more the thread pool configuration and also to identify possible bottlenecks on the Pl@ntNet identification engine. The experiment aims to understand how variations in the preliminary optimum thread pool configuration of the extraction and similarity search tasks impact the user response time and the processing time of the identification tasks.
We apply Sensitivity Analysis techniques to explore the impact of such variations. From the existing Sensitivity Analysis methods we decided to use One-at-a-time (OAT) [43]. OAT is a simple and common approach that consists in varying a single parameter at a time to identify the effect on the output.
In our case, the parameters are extract and simsearch thread pool sizes. We vary the extract pool size in from the current size (7 threads), while the simsearch in (current size is 53 and for simplification, we do not present in Figure 10(a) the times for 50 and 51 since they are bigger than 52). These variations result in 10 new thread pool configurations to be evaluated. Therefore, we take advantage of E2Clab to automatically run them in a reproducible way, following E2Clab’s methodology.
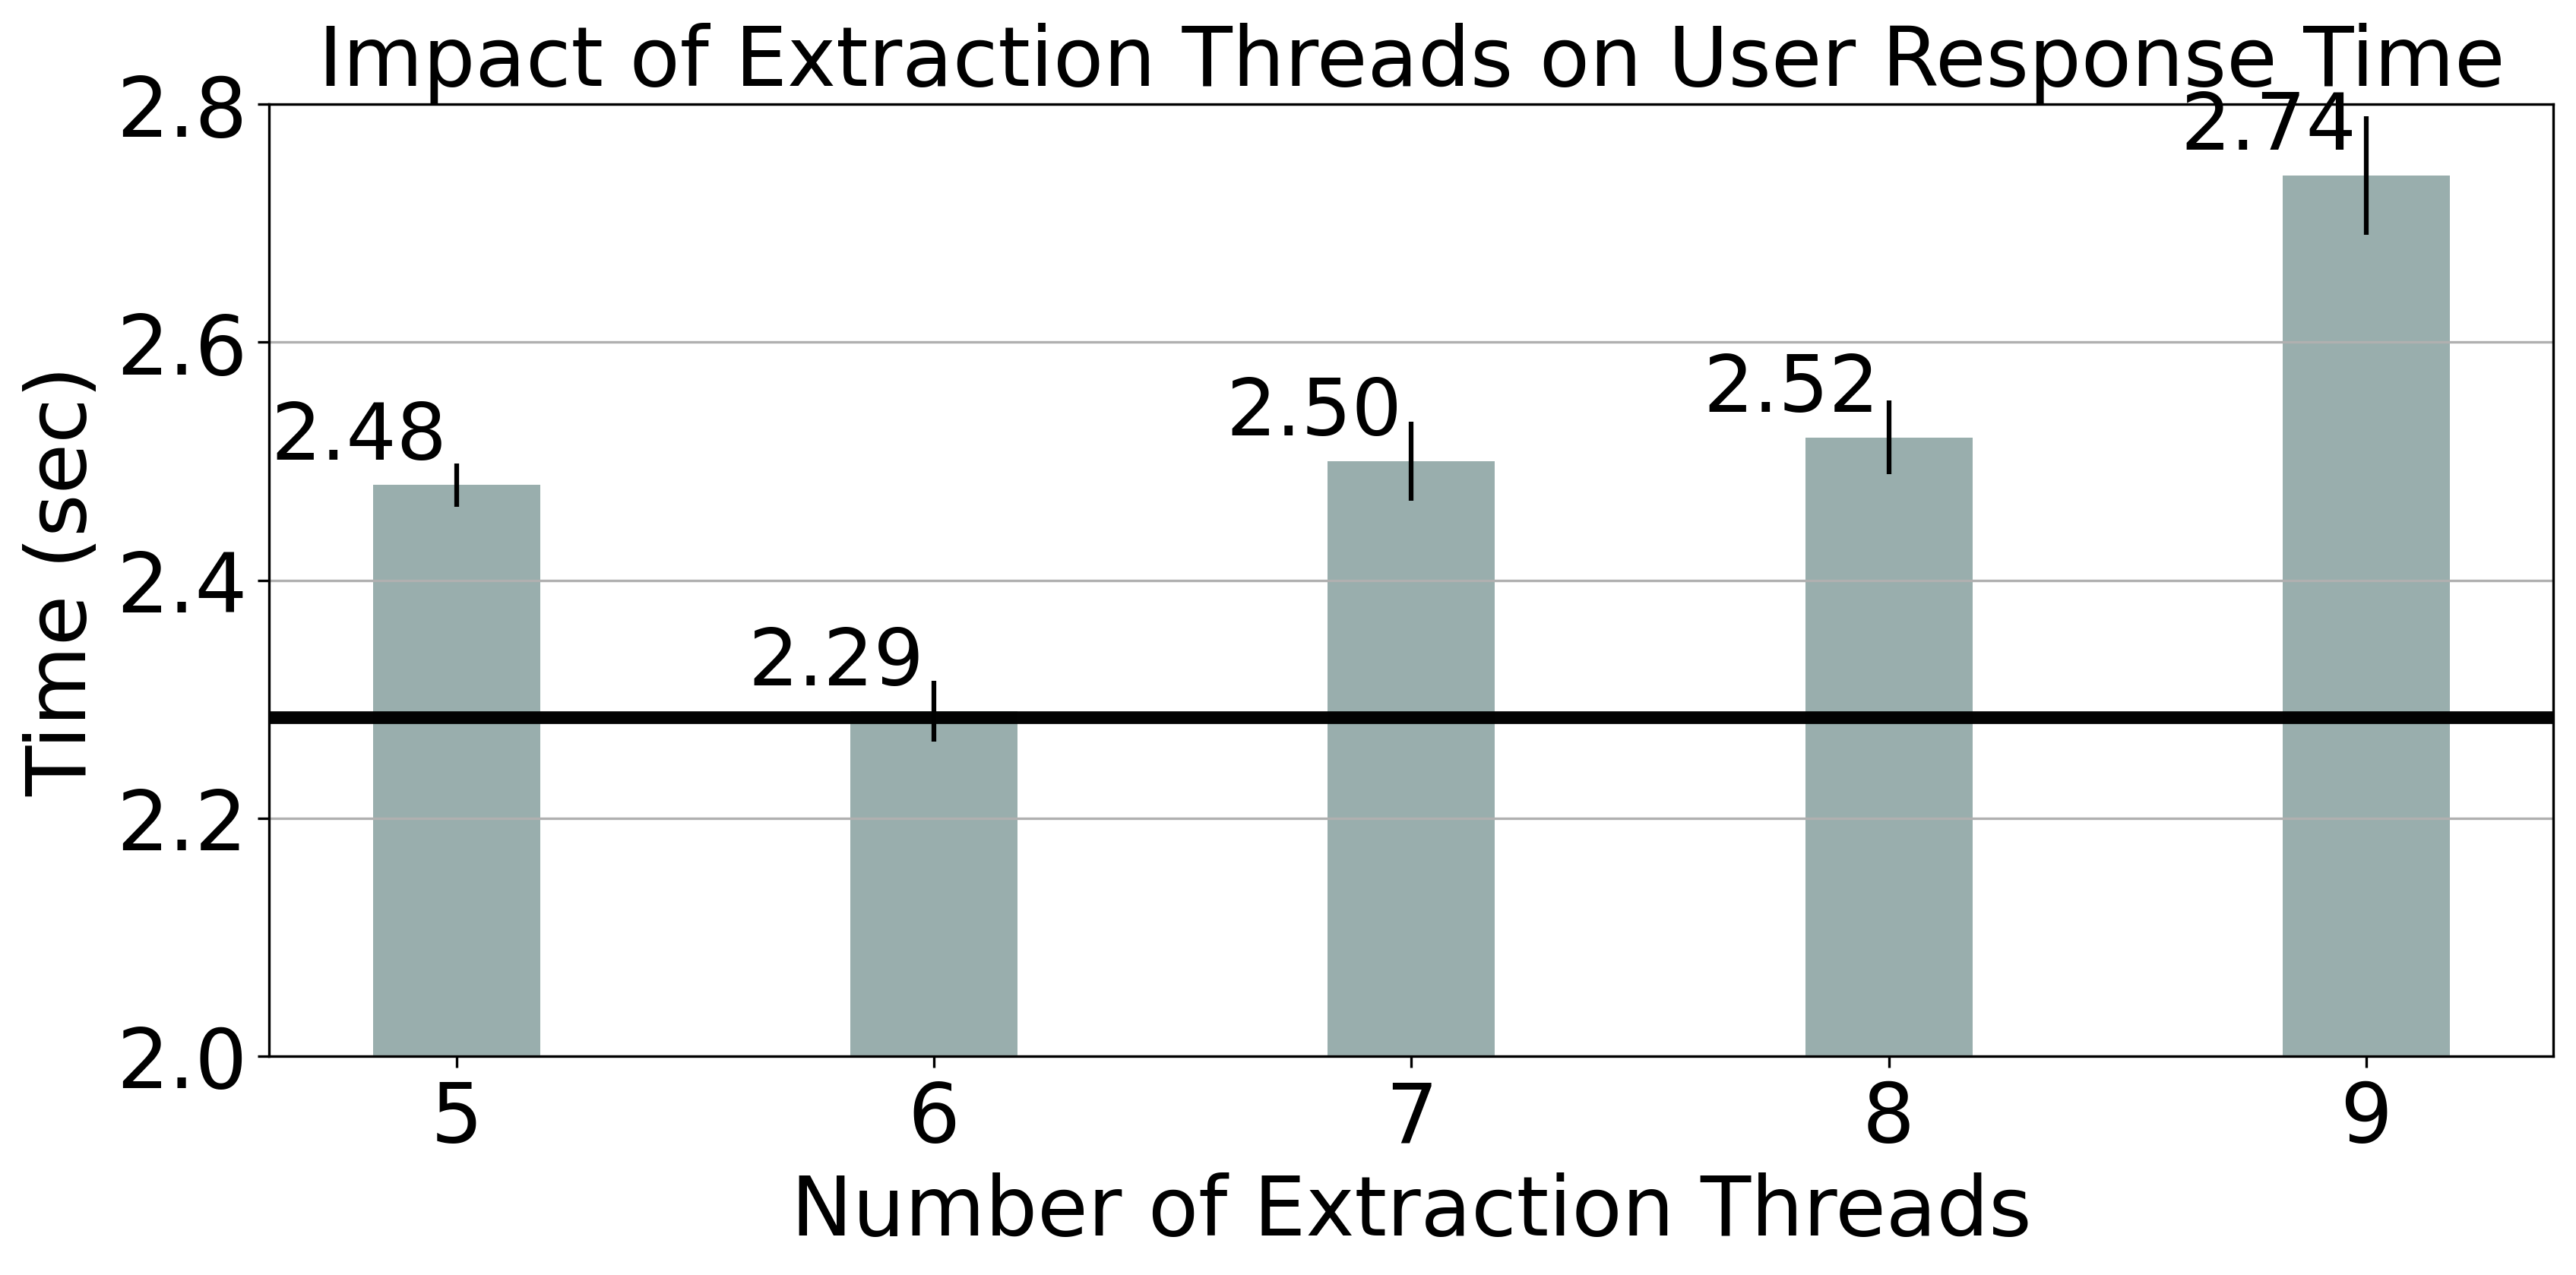
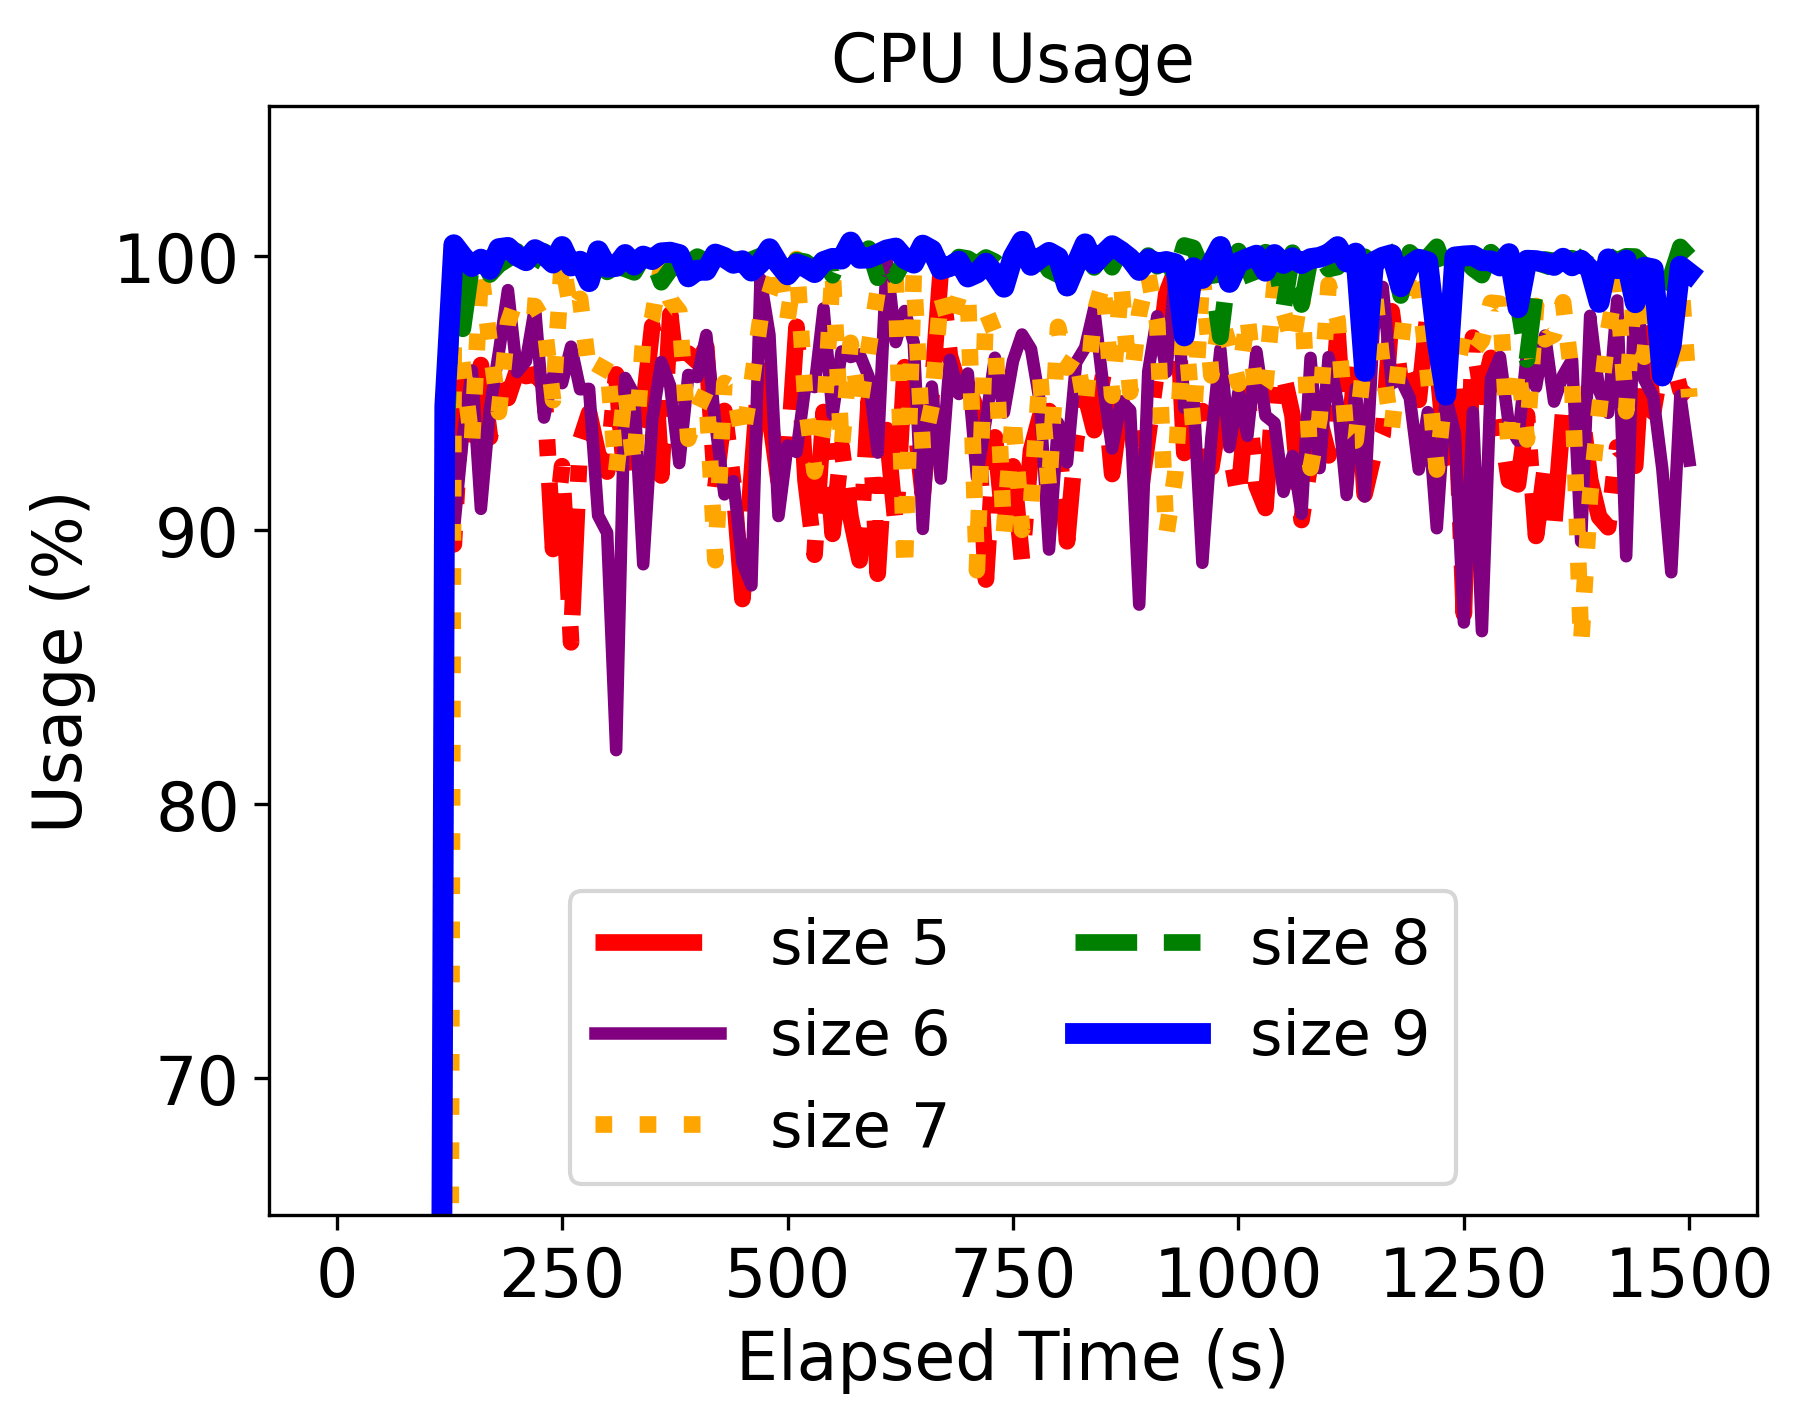
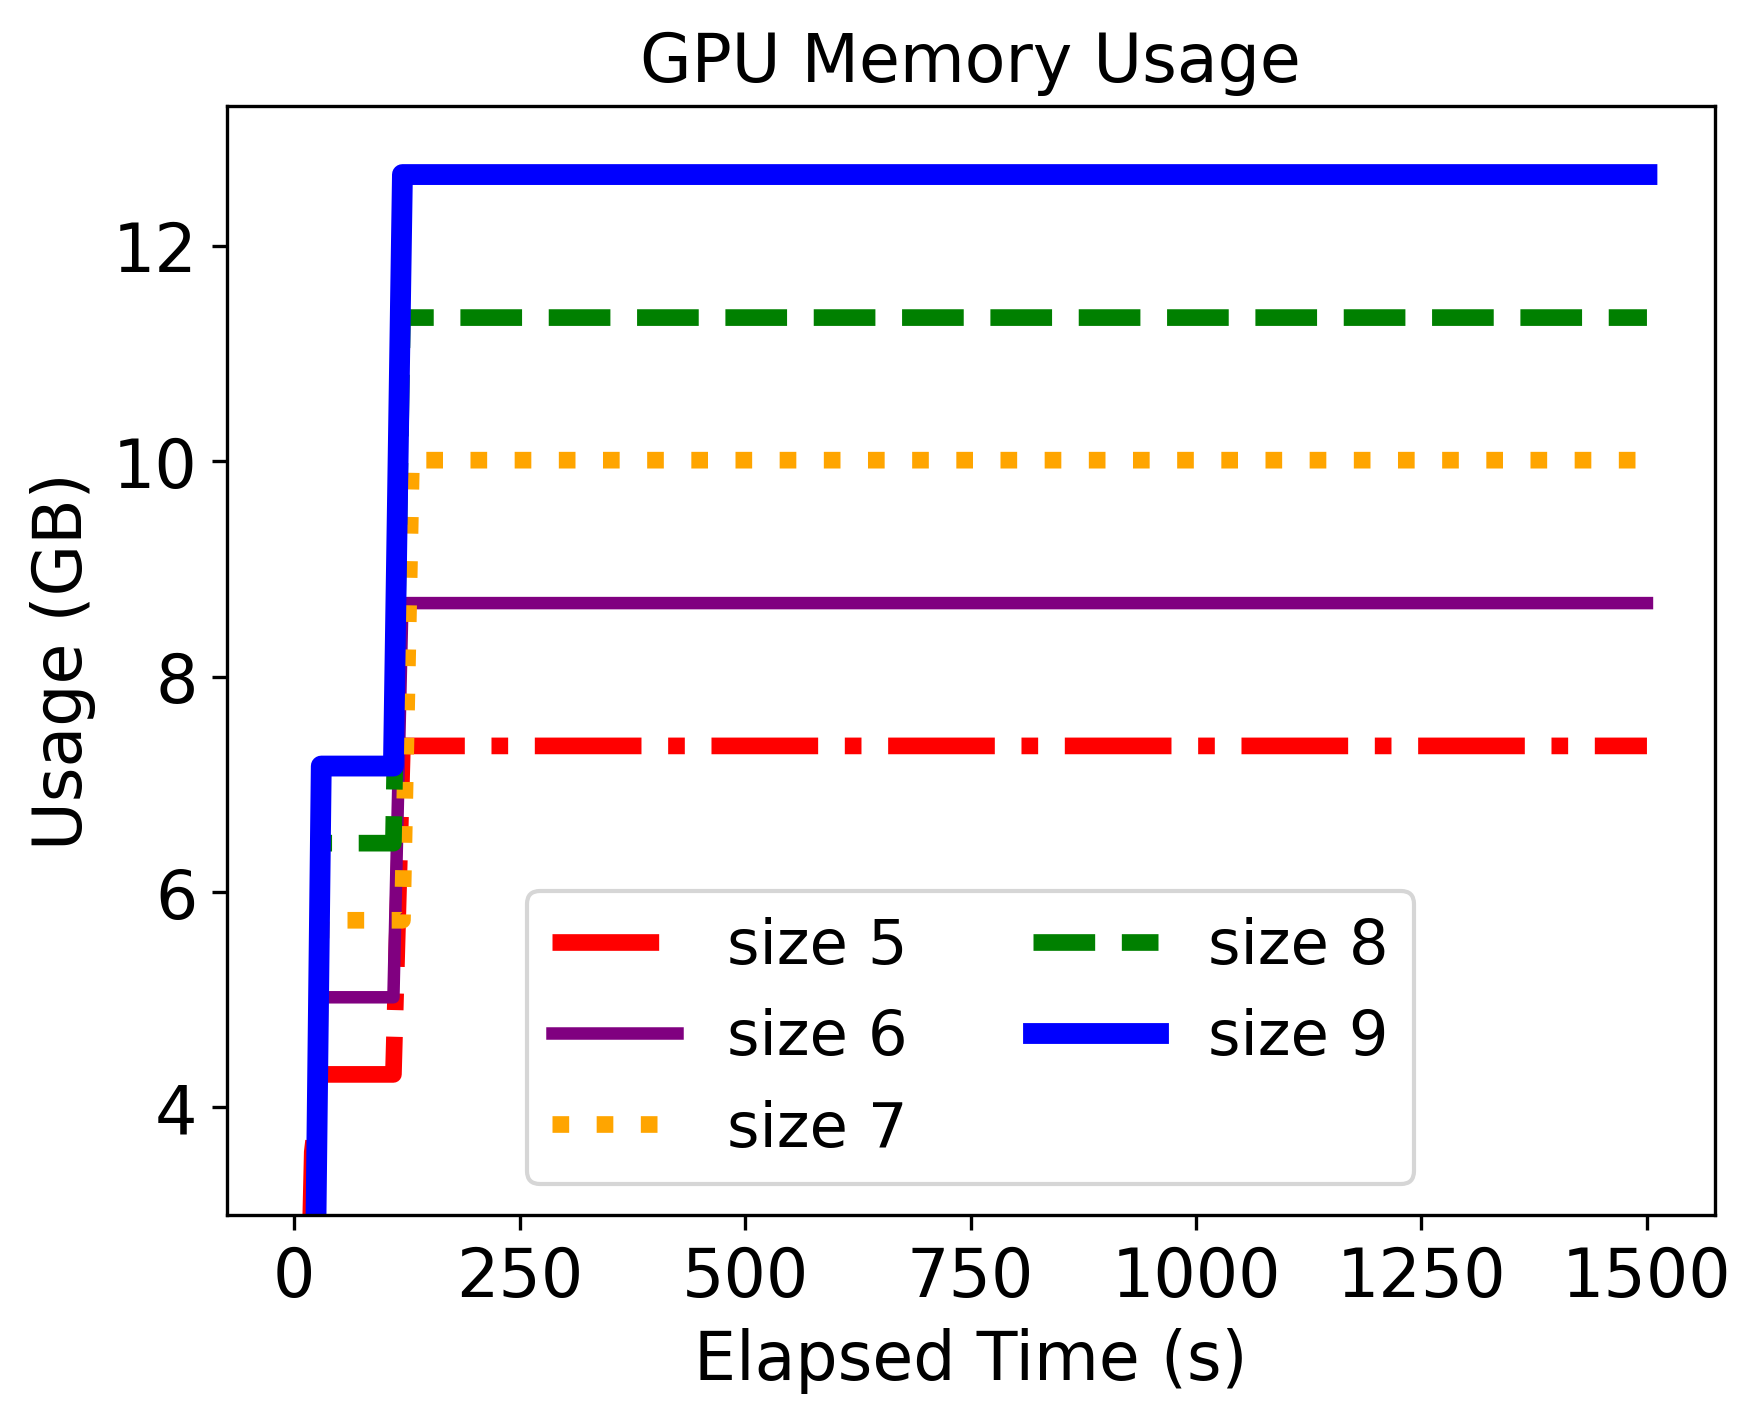
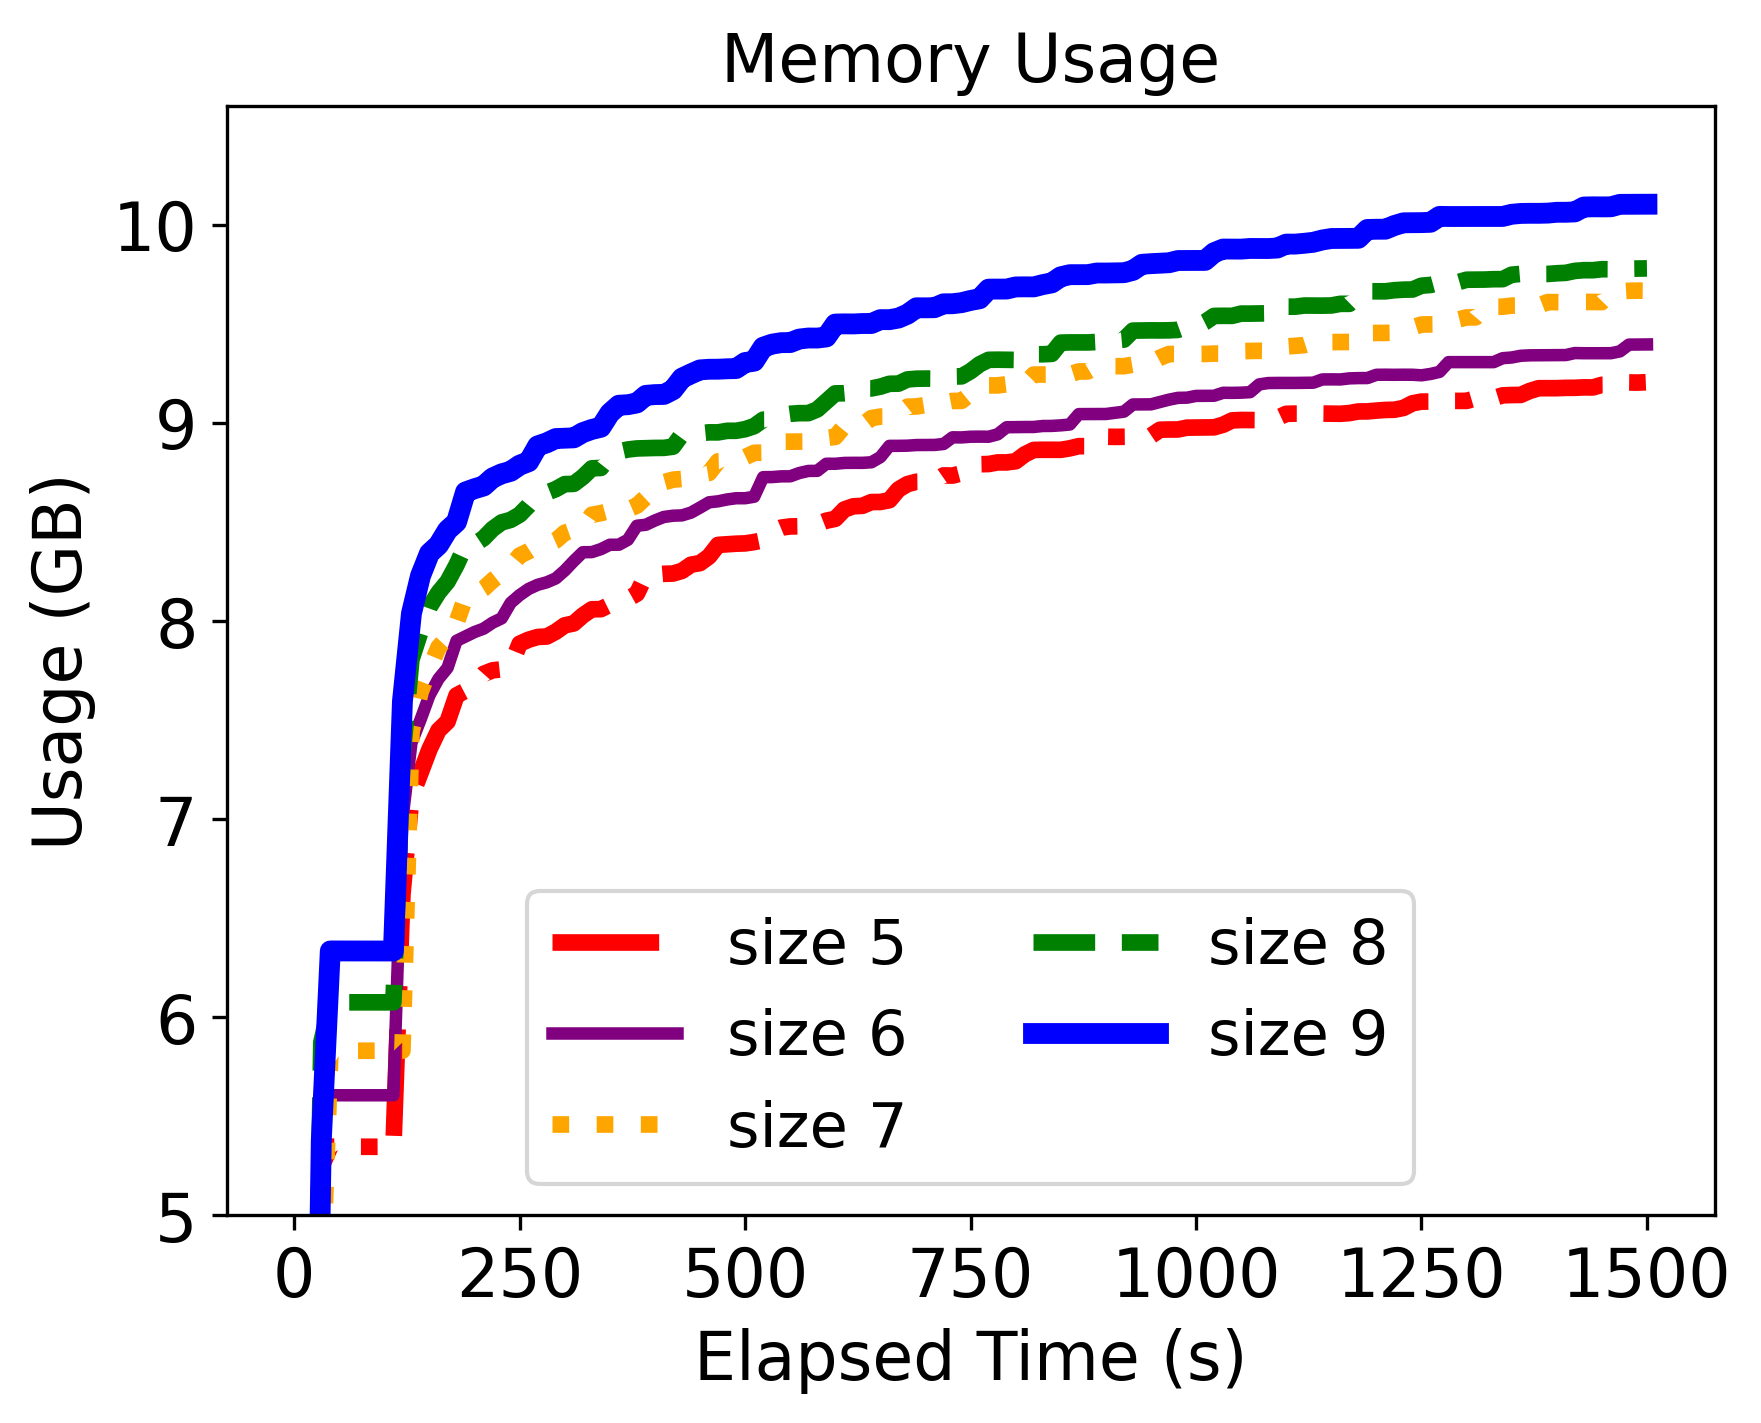
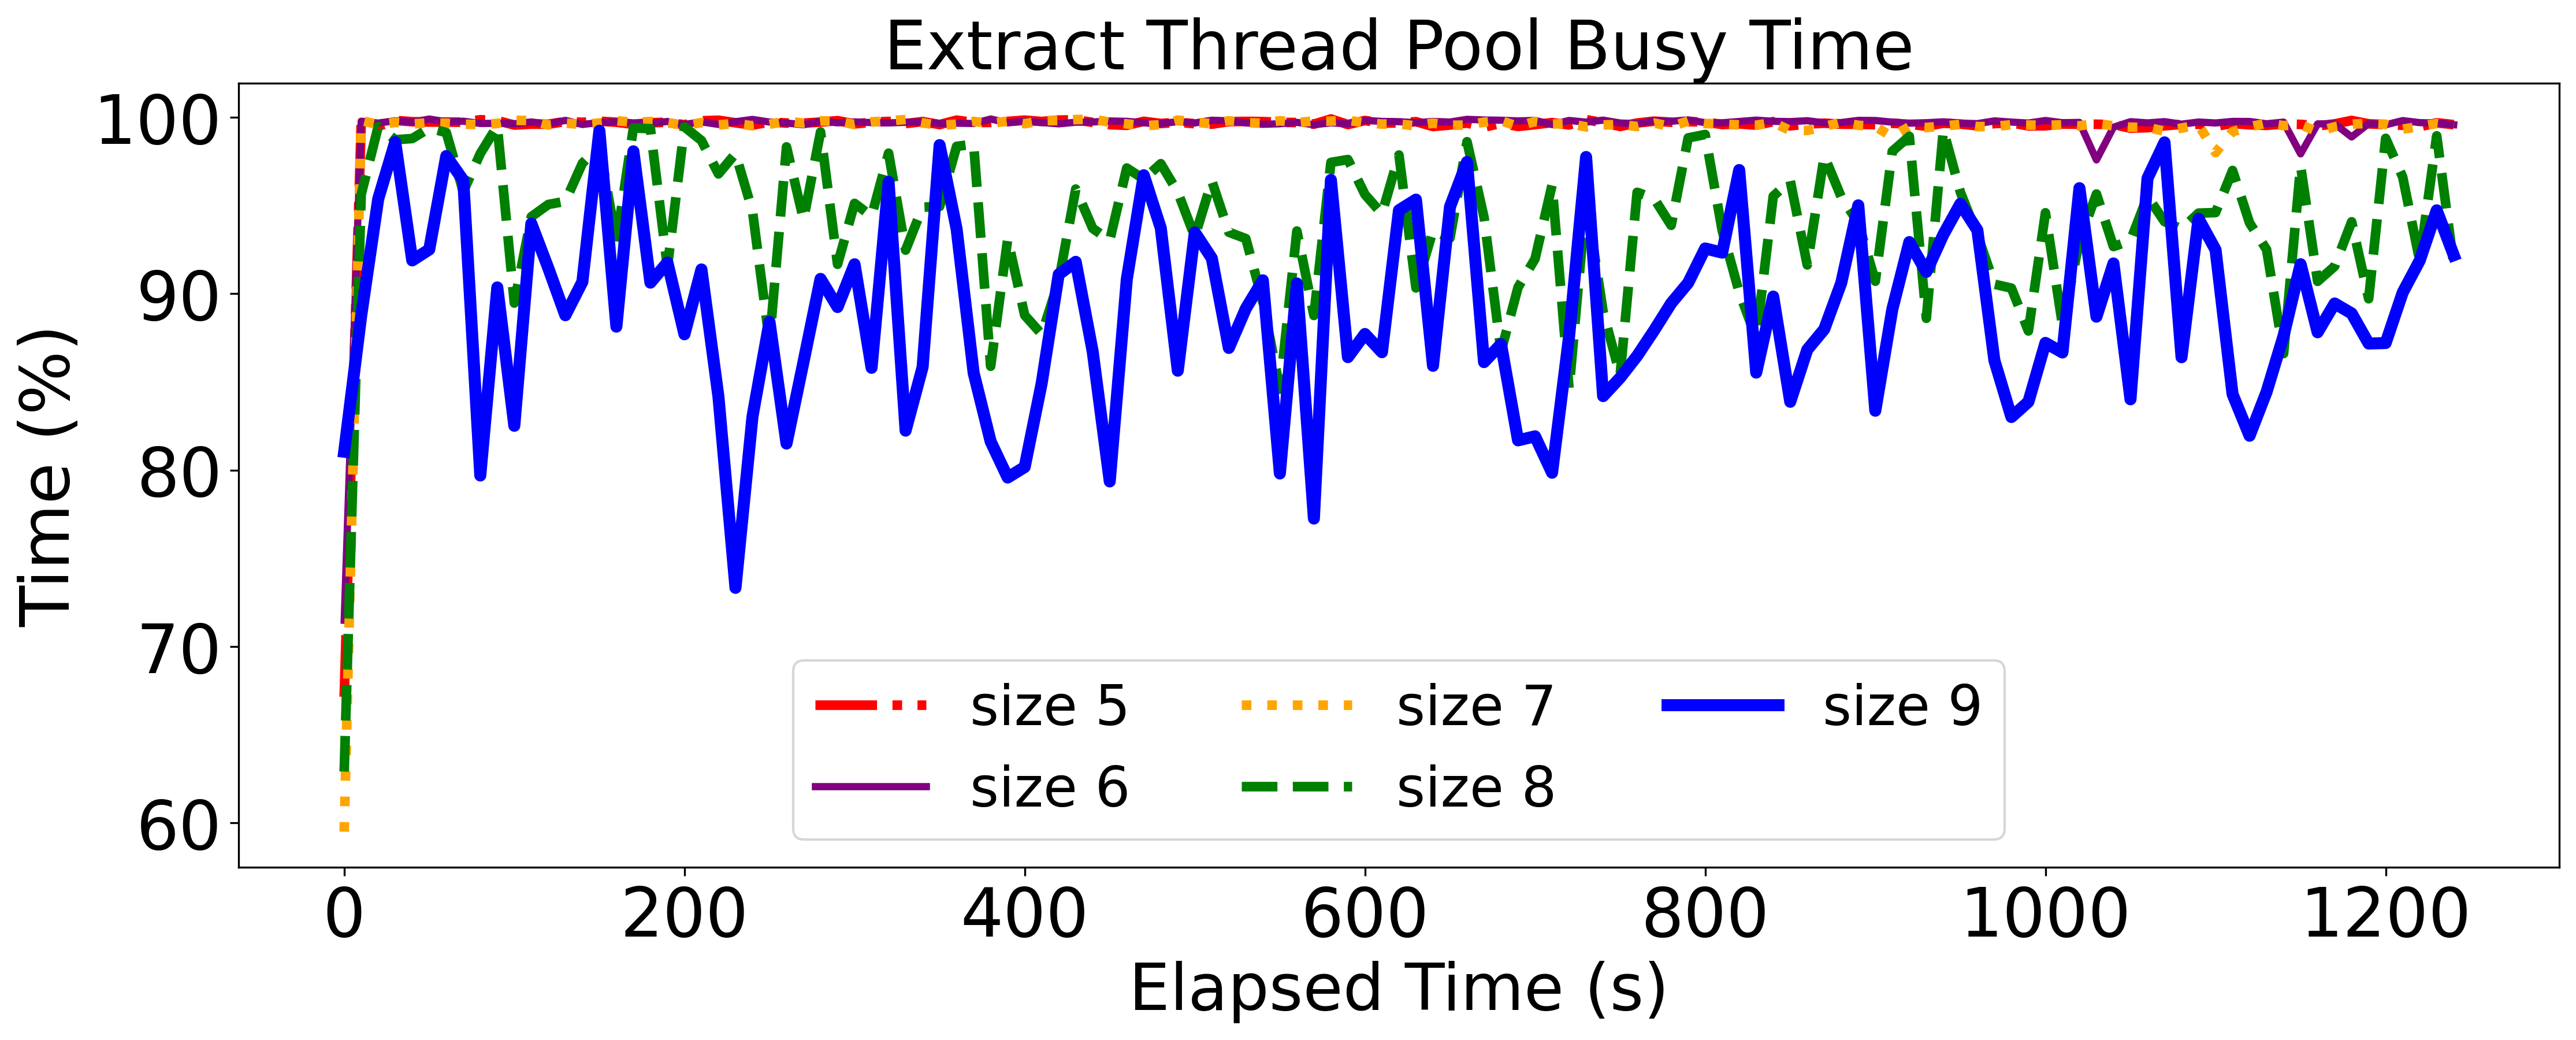
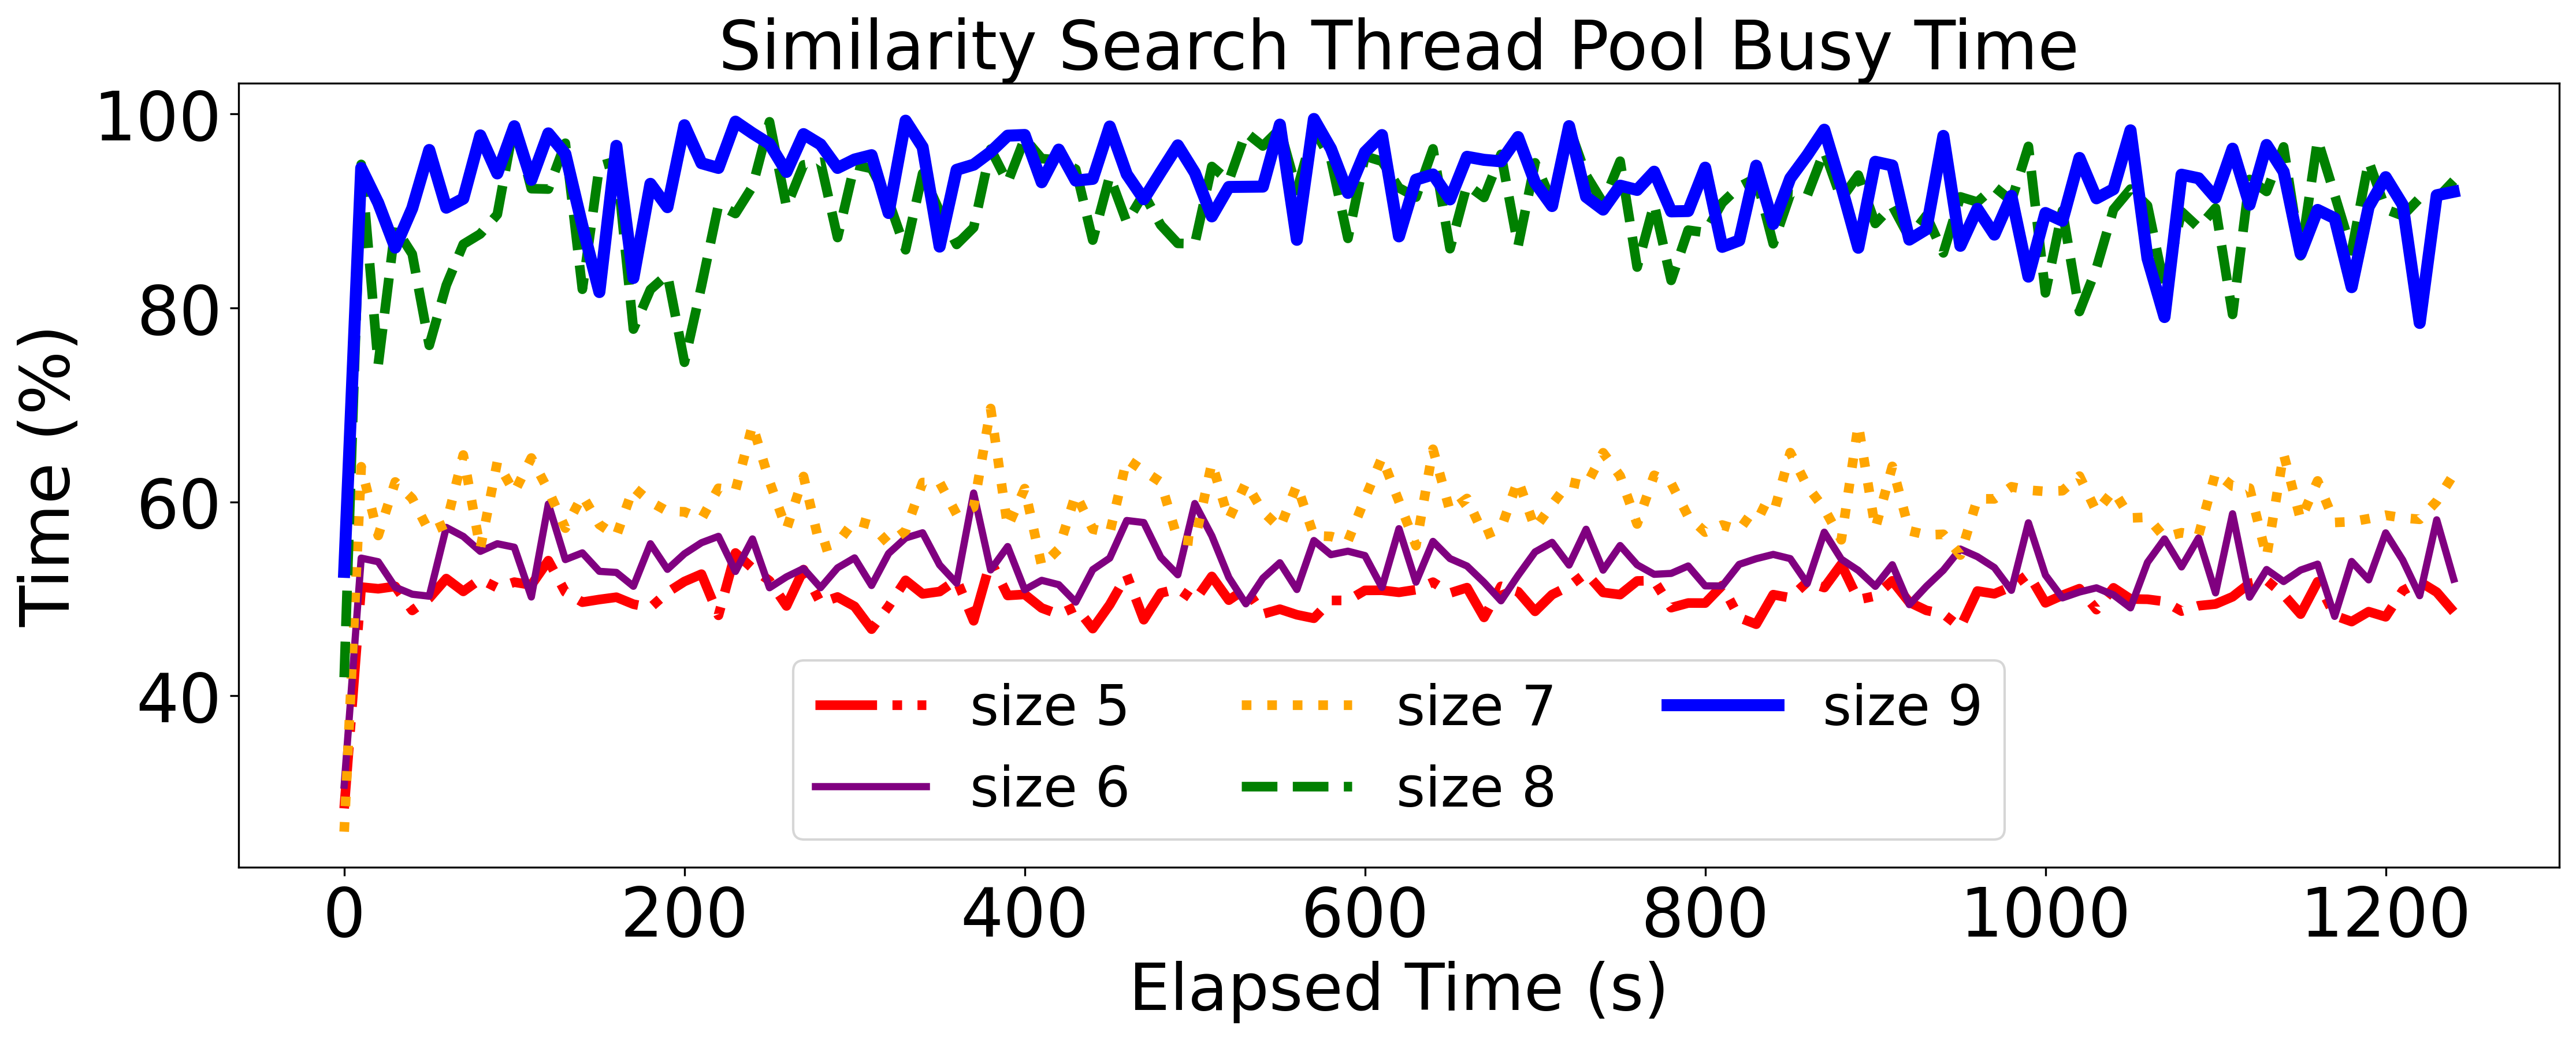
Figure 9 shows the impact of extraction threads on: (a) the user response time and (b) the time to process each task. Furthermore, we also analyze their impact on resource usage, such as: (c) CPU usage (d) GPU memory, (e) system memory, (f) extract pool busy time, and (g) simsearch pool busy time.
In Figure 9(a), we observe that the preliminary optimum configuration with 7 extract threads does not produce the minimum user response time, since using 6 extract threads reduces it by 8.5%. Decreasing to 5 threads or increasing it to 8 or 9 threads impacts negatively when compared to 6 threads. The explanation for this behaviour is given next.
Regarding the processing time (Figure 9(b)), as expected, the wait-extract time reduces as we increase the number of extract threads, while the simsearch task time increases. This time increase in the simsearch task can be explained by Figure 9(c), since using 8 and 9 extract tasks results in a CPU usage of 100% during the whole application execution, so as those tasks compete for processing resources, allocating more extract threads impacts negatively on the simsearch task time. As for the remaining sizes, they varied between 85% and 100%. This behaviour explains the results observed for the user response time presented in Figure 9(a). Furthermore, differently from the wait-extract time, the extract task time was not reduced when increasing the extract thread pool size.
| Thread pool | baseline |
|
|
||||||||
|---|---|---|---|---|---|---|---|---|---|---|---|
| HTTP | 40 | 54 | 54 | ||||||||
| Download | 40 | 54 | 54 | ||||||||
| Extract | 7 | 7 | 6 | ||||||||
| Simsearch | 40 | 53 | 53 | ||||||||
|
|
|
|
By analyzing the impact on the GPU memory usage (Figure 9(d)), we observe that it increases as we allocate more threads to the extract thread pool and it remains constant during the application execution. The GPU utilization for all thread pool sizes is between 35% and 60% most of the time, while the GPU power draw is between 50 Watts and 80 Watts. As the GPU memory usage, the system memory usage (Figure 9(e)) of the Docker container running the Pl@ntNet Engine also increases with the extract thread pool size.
Lastly, the extract thread pool busy time (Figure 9(f)) is 100% during the whole application execution for thread pool sizes of 5, 6, and 7, and between 80% and 100% for sizes of 8 and 9. This explains the higher and lower values, respectively, of the wait-extract times observed in Figure 9(b). For the similarity search (Figure 9(g)), the thread pool busy time is between 80% and 100% for a size of 8 and 9. For the 5, 6, and 7 thread pool sizes it is 50%, 55%, and 60% busy in average, respectively. This also explains the higher values of wait-simsearch for sizes 8 and 9 compared to 5, 6, and 7 in Figure 9(b).
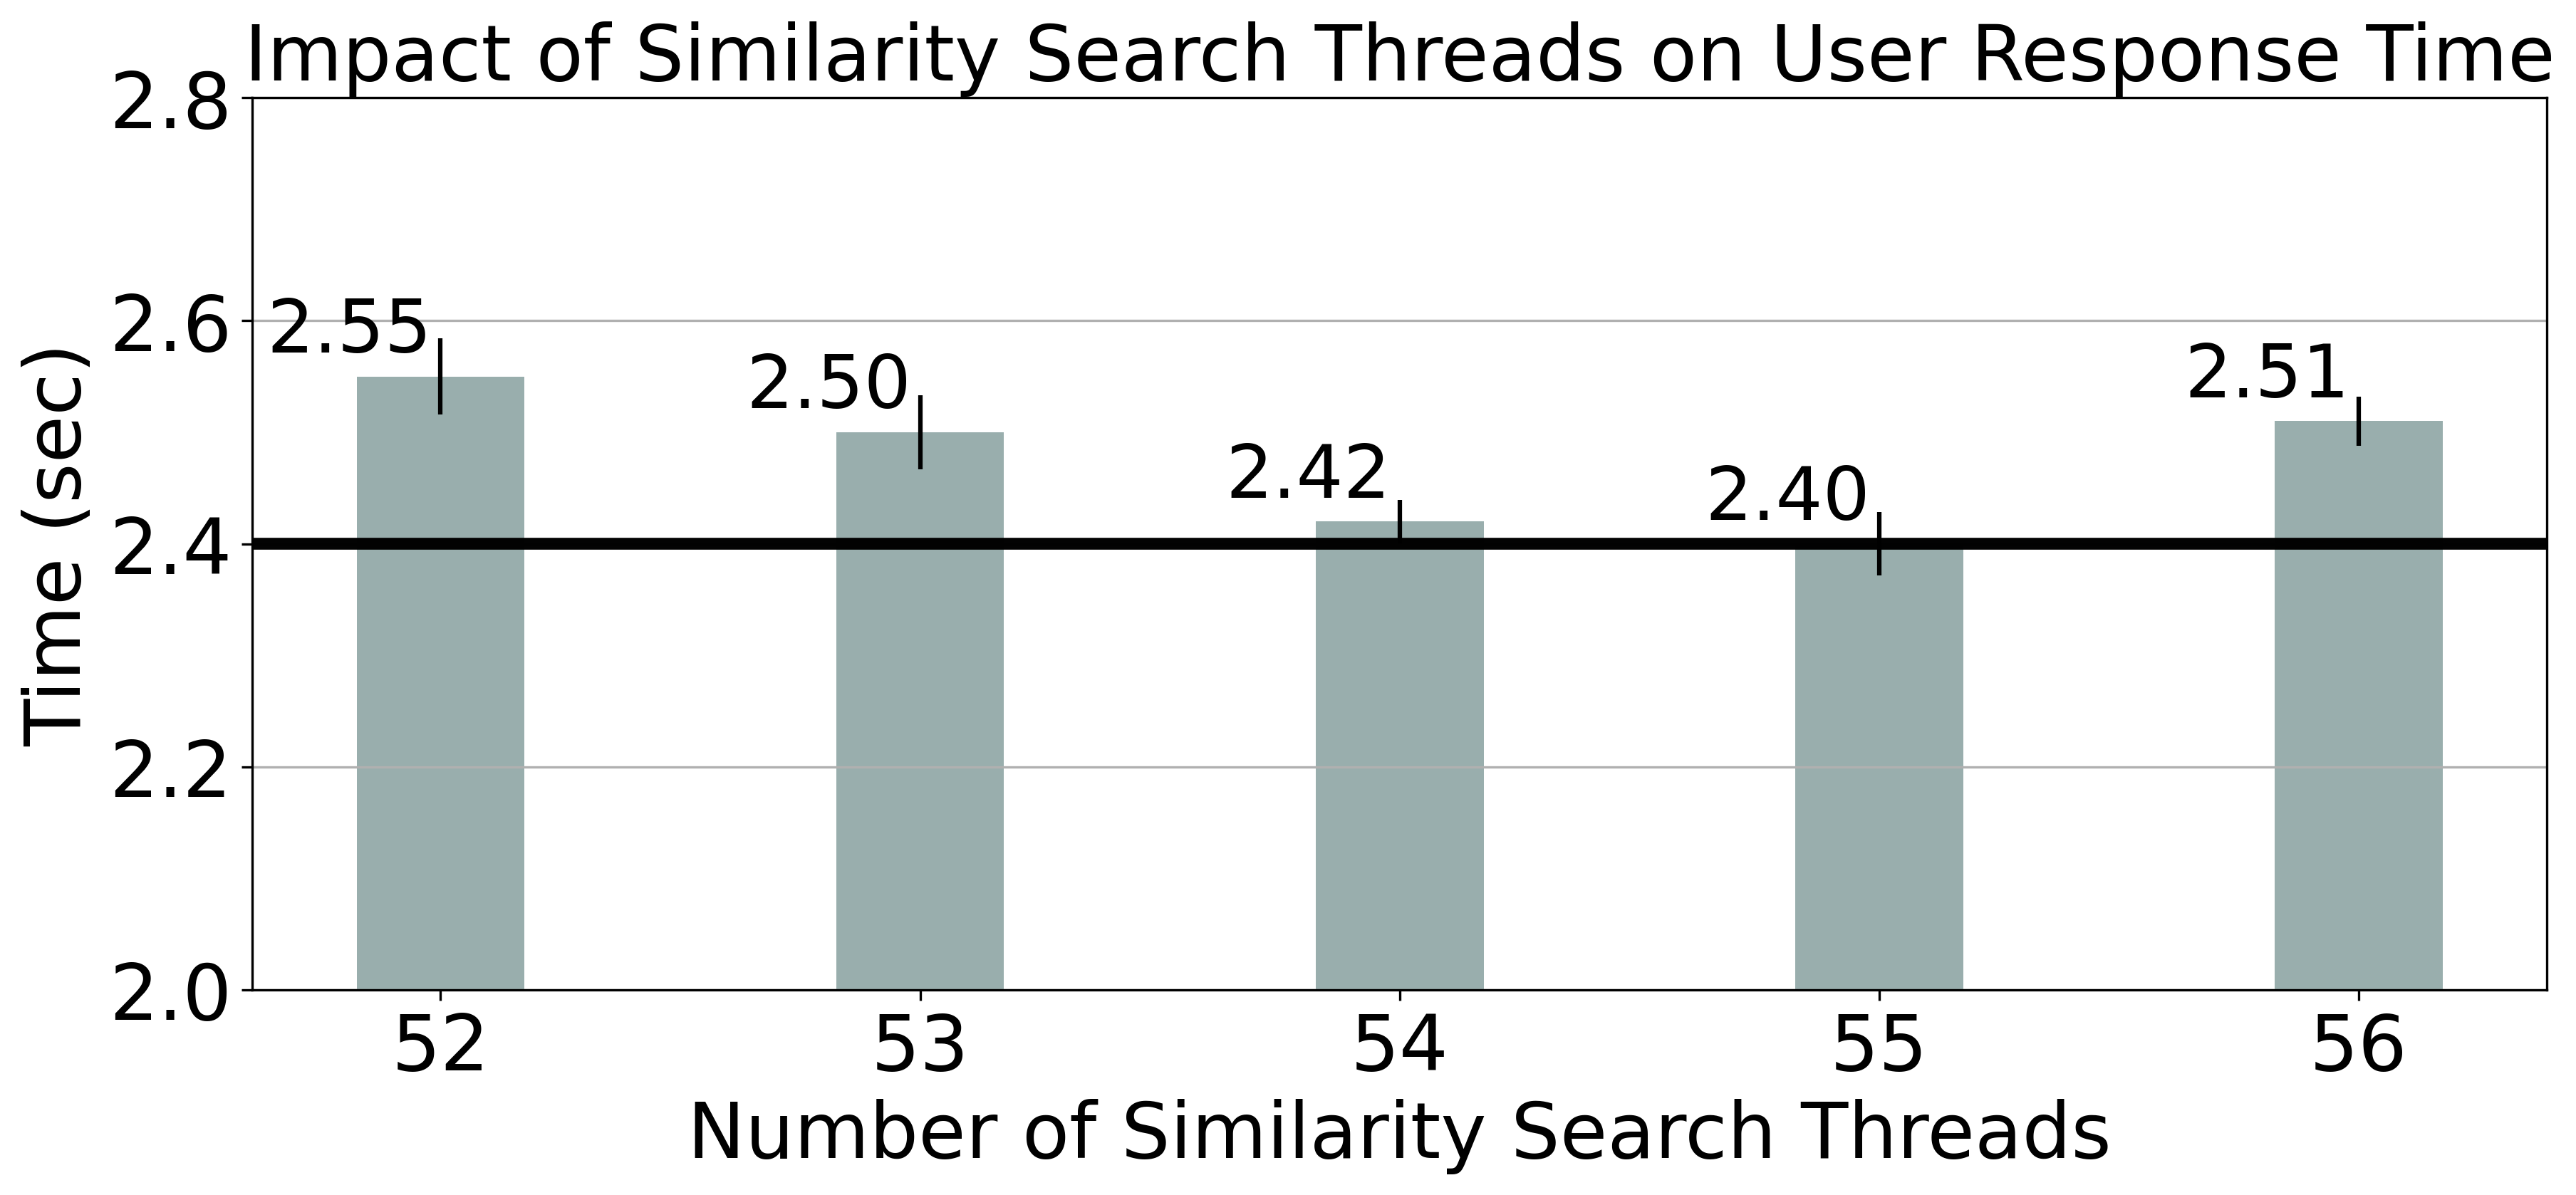
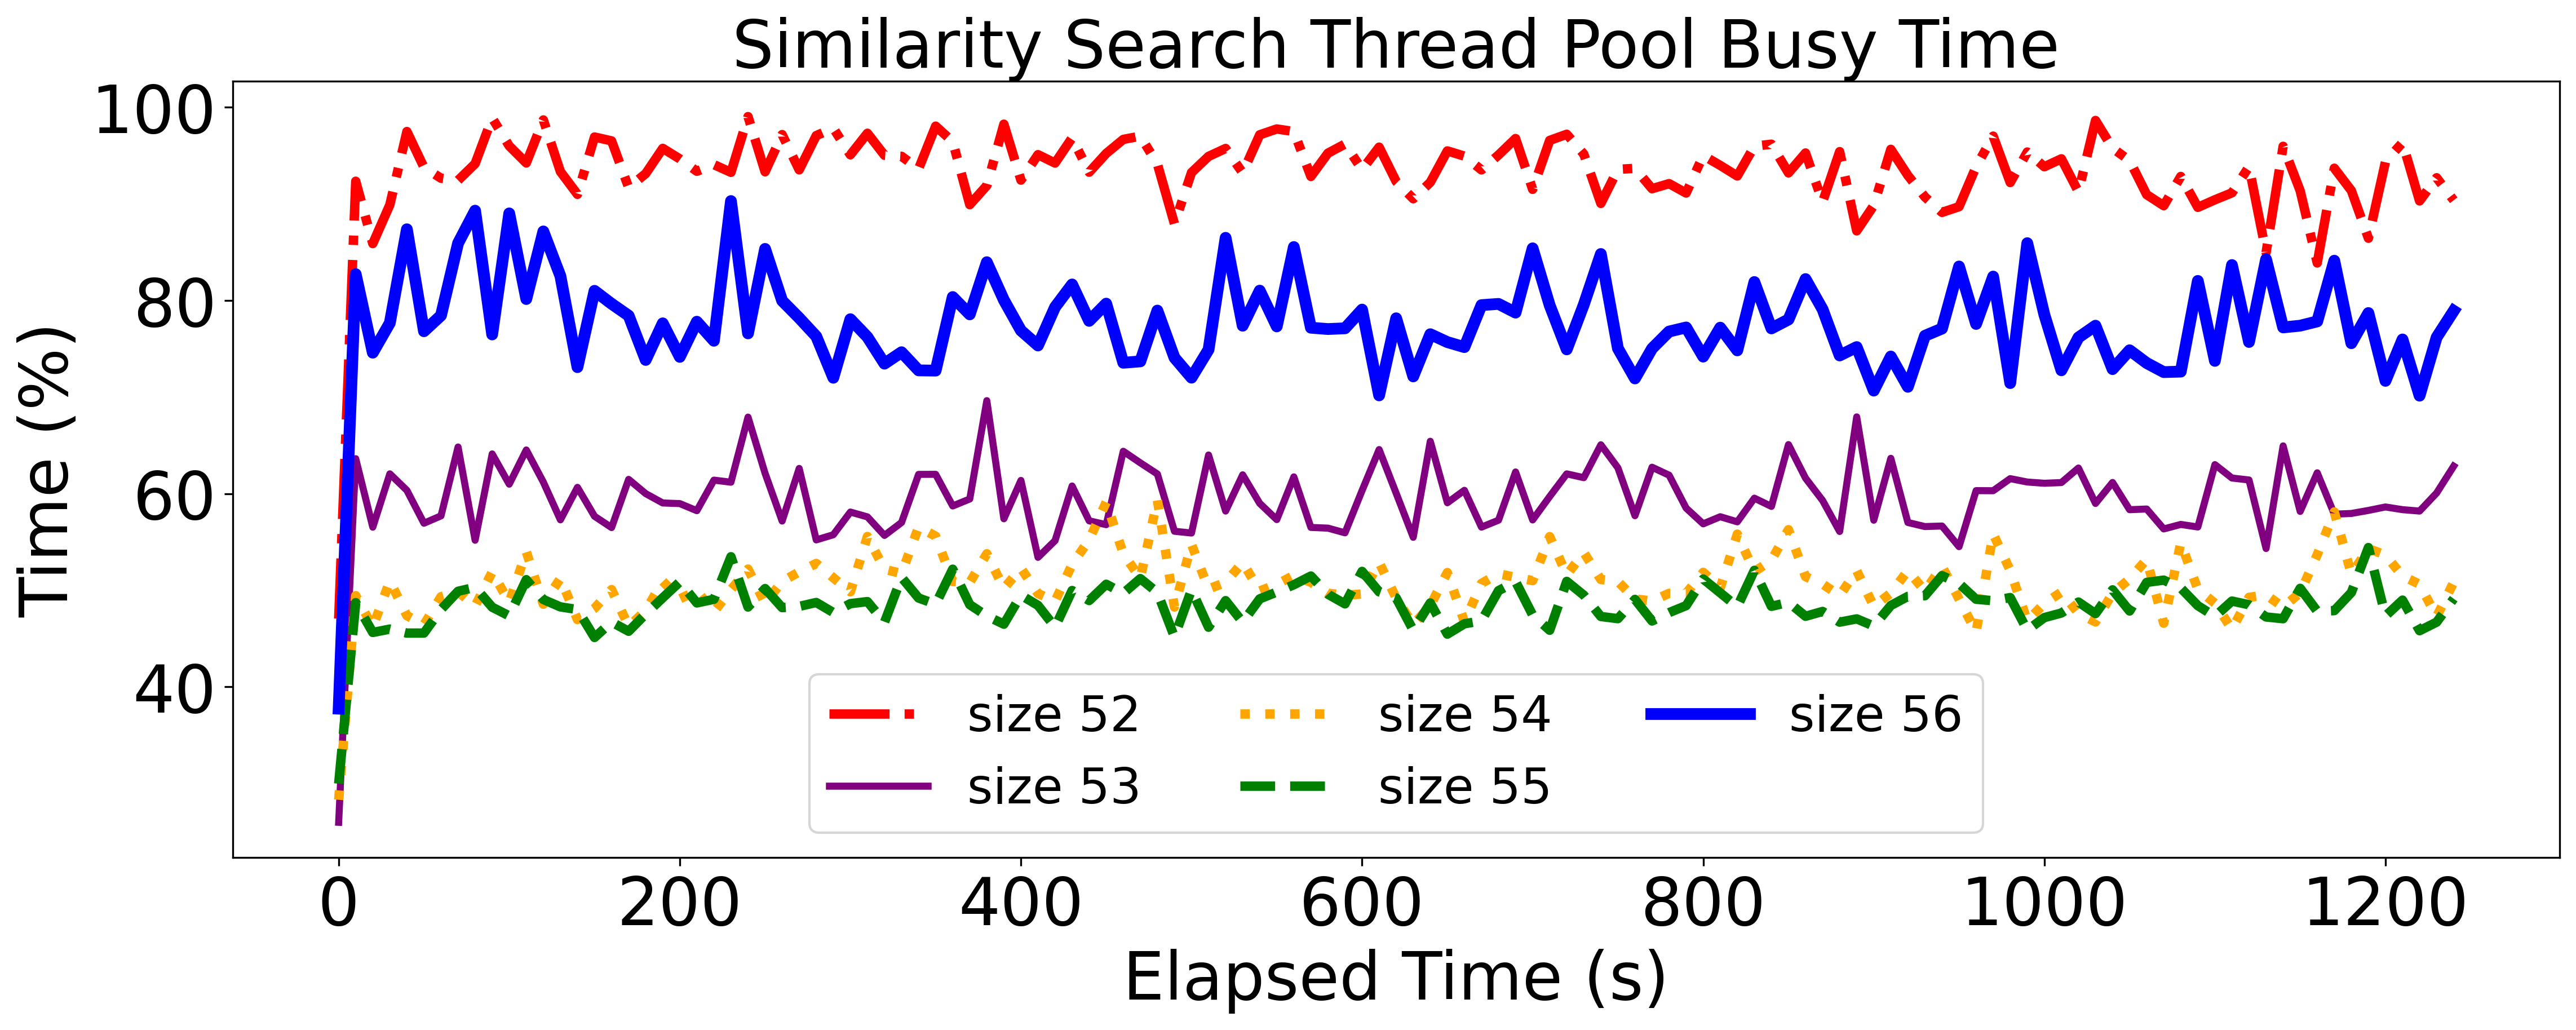
Following our analysis, Figure 10 shows the impact of the thread pool size for similarity search on: (a) user response time and (b) processing time. Besides, in Figure 10(c) and Figure 10(d) we show the thread pool busy time for the similarity search and extract thread pools, respectively.
In Figure 10(a), as one may note, the preliminary optimum configuration with 53 threads may be increased to 55 threads in order to reduce by about 4% the user response time. Regarding the processing time (Figure 10(b)), the simsearch task time confirms what was observed with the user response time, that is, adding more than 55 threads is not worth to decrease the execution time of the simsearch task.
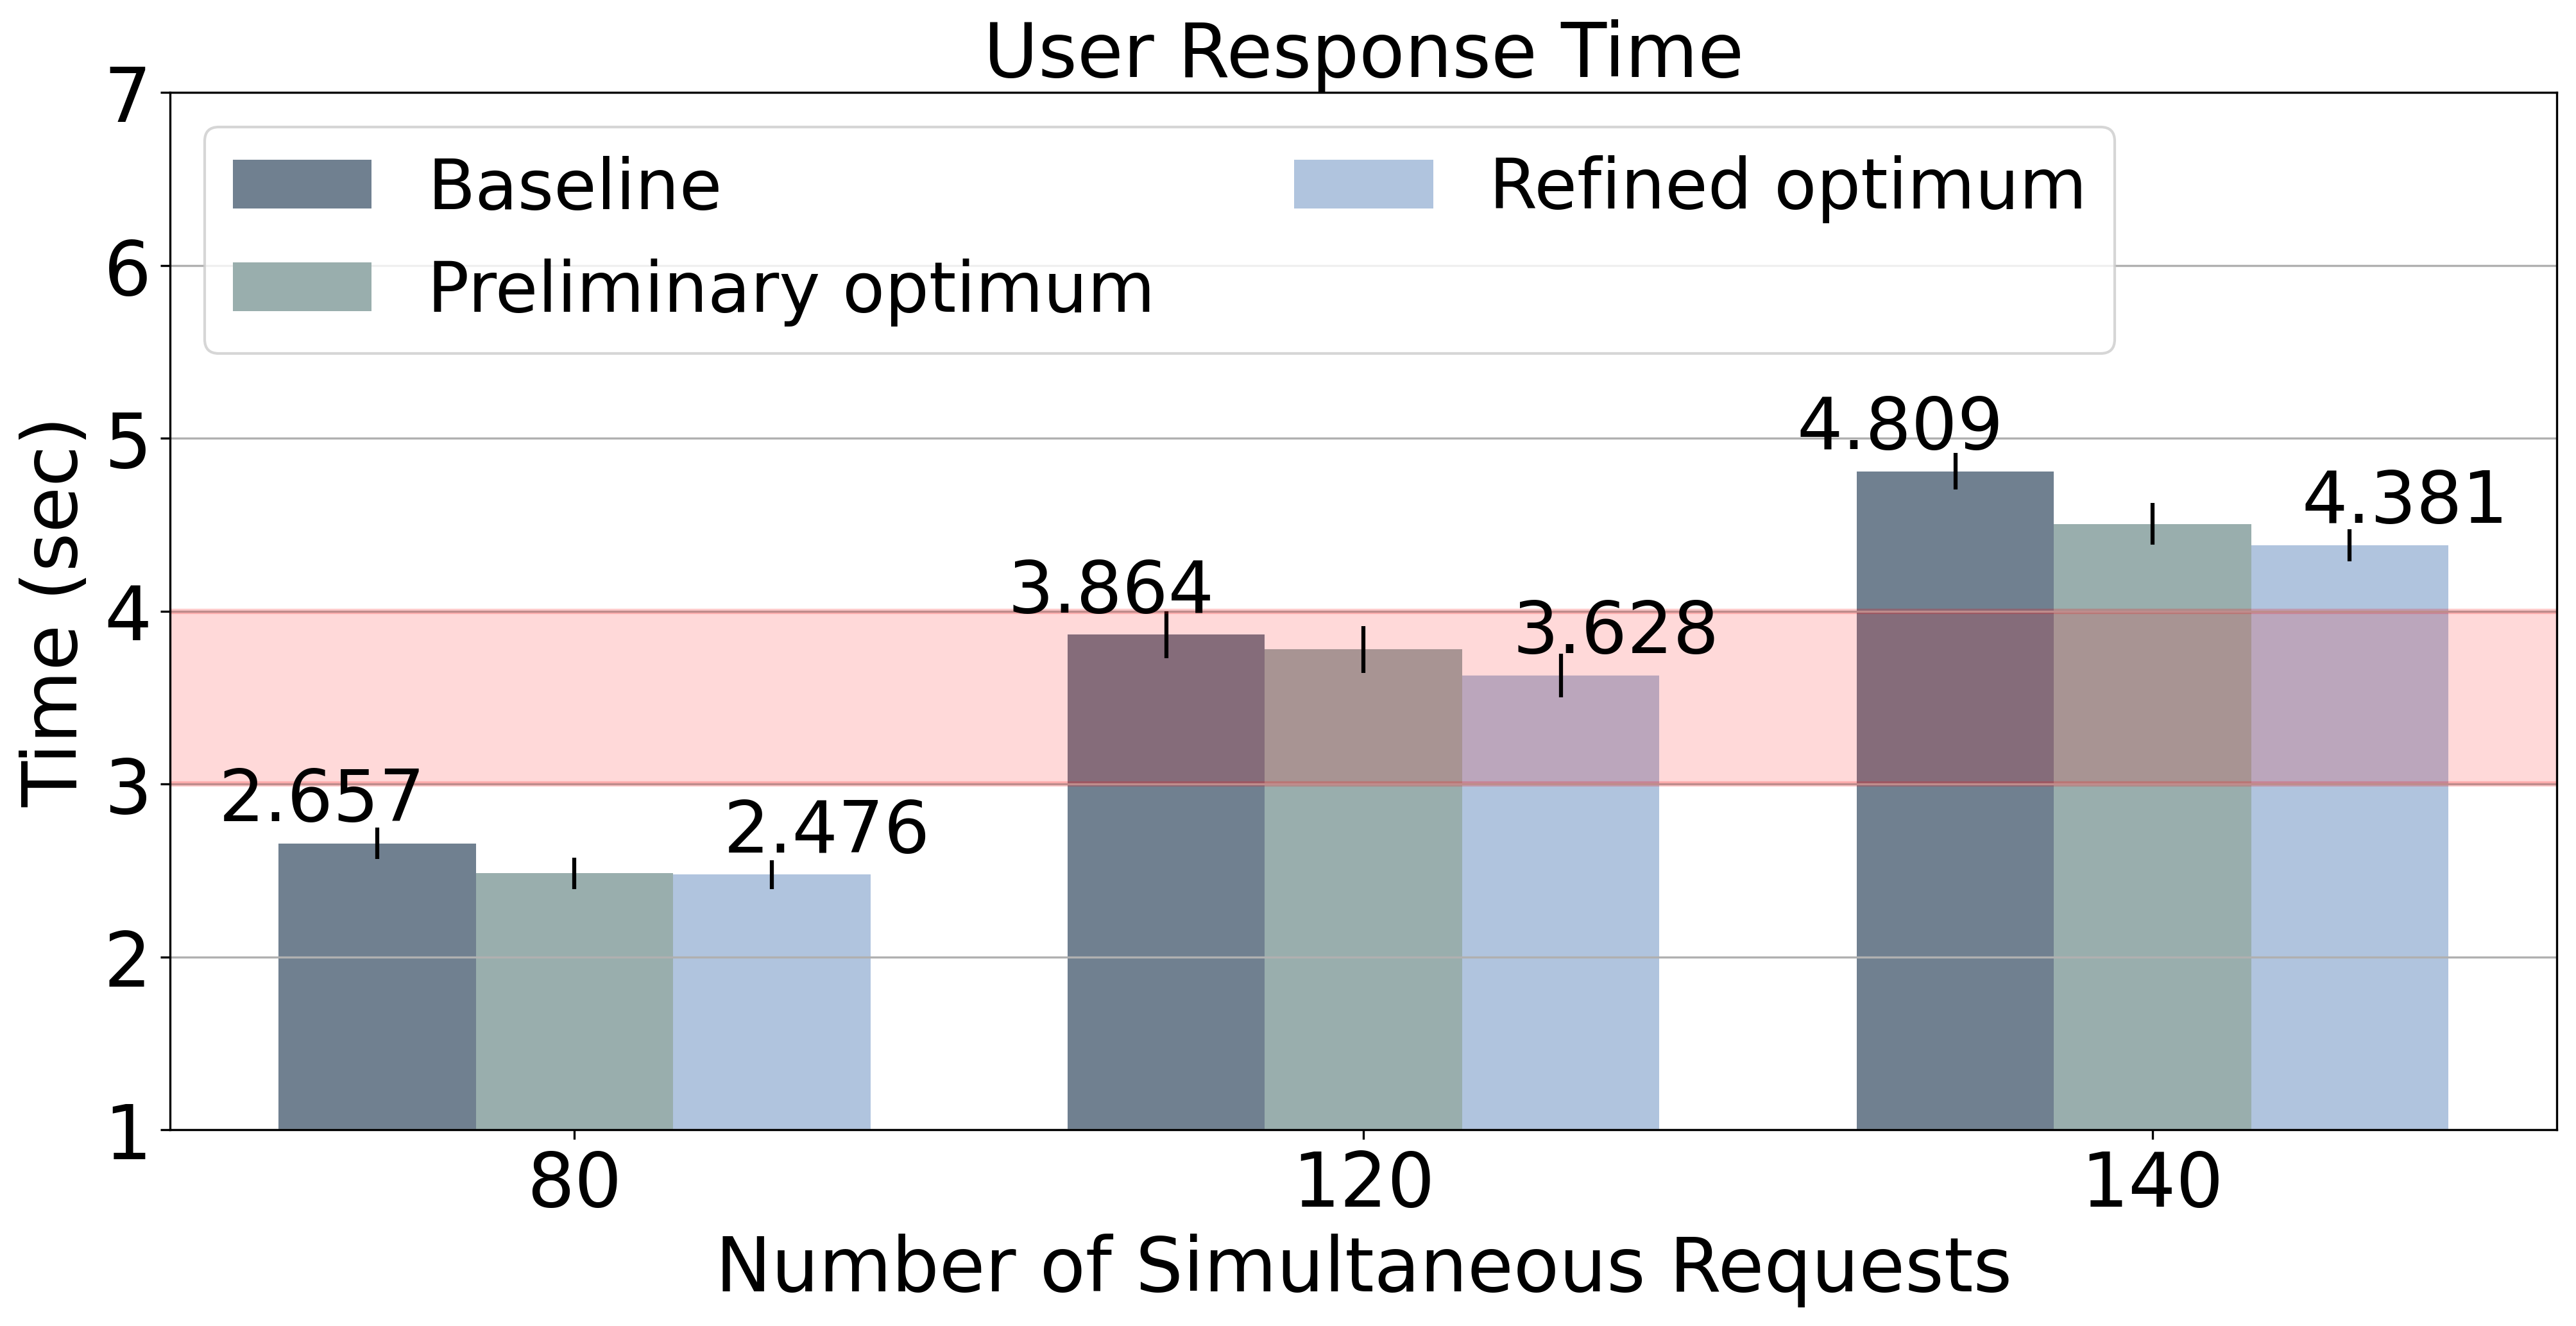
Figure 10(c) shows the correlation of the similarity search pool busy time with the simsearch task time observed in Figure 10(b) and explains its variation. Using 52 threads it is busy between 90% and 100%, while for 53 to 55 it is below 60%, and increases to about 80% with 56 threads. The impact of the similarity search thread pool variation on extract task (Figure 10(b)) can be explained by Figure 10(d). Lower times in wait-extract for sizes 52 and 56 is due to a busy time between 90% and 100%. For sizes from 53 to 55, the busy time is 100%.
Since we observed a lower user response time after analyzing the impact of variations of the extract and simsearch thread pool configurations on the user response time, we exploit this configuration (named refined optimum) with all the previously defined workloads. As presented in Table IV and Figure 11, we observed even better results for all workloads.
Let us note that for all workloads the refined optimum presents the best results, outperforming both baseline and preliminary optimum. Compared with the baseline, the difference between configurations varied with the workloads as follows: from 6.9% to 7.2%; from 2.2% to 6.3%; and from 6.7% to 9.8% for 80, 120, and 140 simultaneous requests, respectively.
In summary, the analysis presented in this section backed by our optimisation methodology helped to understand how variations in the thread pool configuration of the Pl@ntNet engine impact on the processing times (user response time and identification processing steps) by correlating them with the resource usage. Furthermore, this analysis helps to improve the performance of the application by supporting 35% more simultaneous users (54 against 40) and presenting a smaller user response time for different workloads (80, 120, and 140 simultaneous requests) and 30% less GPU memory utilization (7GB against 10GB), when compared to the baseline.
Let us also highlight that, despite our evaluations focusing on the Pl@ntNet as a use case, our methodology and its implementation in E2Clab can be used to analyze other applications in the context of the Edge-to-Cloud Computing Continuum (more details in Section V-C).
V Discussion
The enhanced E2Clab exhibits a series of features that make it a promising platform for future performance optimization of applications on the Edge-to-Cloud Continuum through reproducible experiments. We briefly discuss them here.
V-A Reproducible application optimization
Our optimization methodology is aligned with the Open Science [44] goal to make scientific research processes more transparent and results more accessible. As presented in Section III, it is implemented as an extension of the E2Clab framework for reproducible experimentation across the Edge-to-Cloud Continuum. It provides guidelines to systematically define the whole optimization cycle, such as: (Phase-I) defines the optimization problem and the application-related parameters to optimize; (Phase-II) defines the sampling methods and the optimization techniques and hyperparameters; and (Phase-III) provides access to the optimization results.
The whole optimization cycle is defined through a configuration file (Listing 1). This file was designed to be easy to use and to understand, and it can be easily adapted to different optimization problems (find out more in the documentation Web page [36]). At the end of each optimization cycle, E2Clab provides an archive of the generated data. Such archive consists of data from Phases I and II, needed to allow other researches to reproduce the research results. Regarding this work, the access to the experimental artifacts; definition of the experimental environment; and experimental results are publicly available at [45].
V-B Scalable and parallel application optimization on large-scale testbeds
The proposed optimization methodology enables scalable (on large-scale testbeds), parallel (through asynchronous model training) and reproducible (by following a rigorous experimental methodology) application optimization. This approach speeds up the search of application parameters thanks to parallel and asynchronous application deployments on large-scale testbeds which helps to significantly reduce the application optimization time from days to hours compared to a sequential optimization approach.
The parallel evaluation of the application configuration has the potential to scale to hundreds of machines in a large-scale testbed. Therefore, one may compute simultaneously 10, 20, or even more (depending on the testbed limits and the hardware requirements of the application) evaluations of the objective function to speed-up the computations. We plan to explore this potential in future work.
V-C Optimizing other applications
Our approach is generic: the optimization of other applications may be achieved by describing the application optimization problem in the optimization configuration file. It allows one to define the optimization cycle and easily adapt it to different optimization application-specific problems.
Furthermore, users may easily apply our methodology to their applications thanks to the Services abstraction provided by E2Clab. Services represent any system or a group of systems that provide a specific functionality or action in the scenario workflow. For instance, such services may refer to Flink, Spark or Kafka clusters, among others.
In order to support their applications, users have to implement their User-Defined Services. For this purpose, E2Clab provides a Service class in which users have to override a deploy method to define the deployment logic of their services, such as: the distribution of services to the physical machines; and to install the required software to run these services. Next, E2Clab’s Service class provides a method to register the user services. Lastly, E2Clab managers will be able to deploy each service on the testbed. Therefore, in the work described in this paper, we had to implement the Pl@ntNet service.
VI Related Work
With the popularity of complex application workflows requiring hybrid execution infrastructures, the holistic analysis of such applications combining IoT Edge devices and Cloud/HPC systems has been a very active field of research in the last few years.
Existing solutions focus on the simulation and emulation of parts of the Edge-to-Cloud infrastructure. EdgeCloudSim [11] is an environment for performance evaluation of Edge computing systems that provides simulation for Edge-based scenarios. Users may run experiments considering computational and networking resources. EmuFog [12] is an extensible emulation framework for Fog-based scenarios that allows the emulation of real applications and workloads. However, they focus on the Edge and Fog layers separately, not on the Edge-to-Cloud Continuum as a whole.
In [46], the authors proposed an approach for automated deployment (using Kubernetes [47]) of Cloud applications in the Edge-to-Cloud Continuum. This approach explores methods for selection of the optimal infrastructure, satisfying QoS requirements of Cloud applications. While, A3-E [48] provides a unified model for managing the life cycle of continuum applications (mobile, Edge, and Cloud resources). A3-E focuses on the placement of computation along the continuum based on the specific context and user requirements. However, both works fail on providing configuration control of the parameters of the application and of the underlying Edge-to-Cloud infrastructure; it is widely known and demonstrated that configuration strongly impacts performance. Thus, that support is essential for performing reproducible experiments.
In contrast, our optimization methodology integrates reproducibility by design, and its implementation within E2Clab enables instrumentation of real-life applications on large-scale testbeds across the entire Edge-to-Cloud Continuum.
VII Conclusions
The optimization methodology proposed in this paper has proven useful for understanding and improving the performance of a real-life application used in production at large-scale. Thanks to the extension presented in this work, E2Clab becomes, to the best of our knowledge, the first framework to support the complete deployment and analysis cycle of application workflows executed on the Computing Continuum, including deployment, configuration, monitoring, and gathering of results, and now performance optimization.
We have validated our proposed optimization methodology at large scale on 42 nodes of the Grid´5000 testbed. We have shown how it can be used to analyze and optimize the performance of the Pl@ntNet botanical application, used by more than 10 million users in 180 countries.
The thread pool allocation found using our methodology increases the number of simultaneous requests processed in parallel by 35% compared to the baseline; it reduces user response time for different workloads; and consumes 30% less GPU memory. Despite our focus on Pl@ntNet, the methodology can be generalized to other applications in the Edge-to-Cloud Continuum.
Acknowledgments
This work was funded by Inria through the HPC-BigData Inria Challenge (IPL) and by French ANR OverFlow project (ANR-15- CE25-0003). Experiments presented in this paper were carried out using the Grid’5000 testbed, supported by a scientific interest group hosted by Inria and including CNRS, RENATER and several Universities as well as other organizations. We also would like to thank Romain Egele, Jaehoon Koo, Prasanna Balaprakash, and Orcun Yildiz from Argonne National Laboratory for their support.
References
- [1] P. Beckman, J. Dongarra, N. Ferrier, G. Fox, T. Moore, D. Reed, and M. Beck, Harnessing the Computing Continuum for Programming Our World, 2020, pp. 215–230.
- [2] J. Wang and D. Li, “Adaptive computing optimization in software-defined network-based industrial internet of things with fog computing,” Sensors, vol. 18, no. 8, p. 2509, 2018.
- [3] S. Midya, A. Roy, K. Majumder, and S. Phadikar, “Multi-objective optimization technique for resource allocation and task scheduling in vehicular cloud architecture: A hybrid adaptive nature inspired approach,” Journal of Network and Computer Applications, vol. 103, pp. 58–84, 2018.
- [4] Y. Xia, X. Etchevers, L. Letondeur, A. Lebre, T. Coupaye, and F. Desprez, “Combining heuristics to optimize and scale the placement of iot applications in the fog,” in 2018 IEEE/ACM 11th International Conference on Utility and Cloud Computing (UCC). IEEE, 2018, pp. 153–163.
- [5] R. Ranjan, O. Rana, S. Nepal, M. Yousif, P. James, Z. Wen, S. Barr, P. Watson, P. P. Jayaraman, D. Georgakopoulos et al., “The next grand challenges: Integrating the internet of things and data science,” IEEE Cloud Computing, vol. 5, no. 3, pp. 12–26, 2018.
- [6] J. Bellendorf and Z. Á. Mann, “Classification of optimization problems in fog computing,” Future Generation Computer Systems, vol. 107, pp. 158–176, 2020.
- [7] H. Xu, W. Yu, D. Griffith, and N. Golmie, “A survey on industrial internet of things: A cyber-physical systems perspective,” IEEE Access, vol. 6, pp. 78 238–78 259, 2018.
- [8] A. Joly, P. Bonnet, H. Goëau, J. Barbe, S. Selmi, J. Champ, S. Dufour-Kowalski, A. Affouard, J. Carré, J.-F. Molino et al., “A look inside the pl@ntnet experience,” Multimedia Systems, vol. 22, no. 6, pp. 751–766, 2016.
- [9] R. N. Calheiros, R. Ranjan, A. Beloglazov, C. A. De Rose, and R. Buyya, “Cloudsim: a toolkit for modeling and simulation of cloud computing environments and evaluation of resource provisioning algorithms,” Software: Practice and experience, vol. 41, no. 1, pp. 23–50, 2011.
- [10] H. Gupta, A. Vahid Dastjerdi, S. K. Ghosh, and R. Buyya, “ifogsim: A toolkit for modeling and simulation of resource management techniques in the internet of things, edge and fog computing environments,” Software: Practice and Experience, vol. 47, no. 9, pp. 1275–1296, 2017.
- [11] C. Sonmez, A. Ozgovde, and C. Ersoy, “Edgecloudsim: An environment for performance evaluation of edge computing systems,” Transactions on Emerging Telecommunications Technologies, vol. 29, no. 11, p. e3493, 2018.
- [12] R. Mayer, L. Graser, H. Gupta, E. Saurez, and U. Ramachandran, “Emufog: Extensible and scalable emulation of large-scale fog computing infrastructures,” in 2017 IEEE Fog World Congress (FWC). IEEE, 2017, pp. 1–6.
- [13] D. Pham and D. Karaboga, Intelligent optimisation techniques: genetic algorithms, tabu search, simulated annealing and neural networks. Springer Science & Business Media, 2012.
- [14] D. Rosendo, P. Silva, M. Simonin, A. Costan, and G. Antoniu, “E2clab: Exploring the computing continuum through repeatable, replicable and reproducible edge-to-cloud experiments,” in 2020 IEEE International Conference on Cluster Computing (CLUSTER). IEEE, 2020, pp. 176–186.
- [15] R. Bolze, F. Cappello, E. Caron, M. Daydé, F. Desprez, E. Jeannot, Y. Jégou, S. Lanteri, J. Leduc, N. Melab et al., “Grid’5000: a large scale and highly reconfigurable experimental grid testbed,” The International Journal of High Performance Computing Applications, vol. 20, no. 4, pp. 481–494, 2006.
- [16] AppDynamics. (2015, jan) 16 metrics to ensure mobile app success. [Online]. Available: https://www.appdynamics.com/media/uploaded-files/1432066155/white-paper-16-metrics-every-mobile-team-should-monitor.pdf
- [17] M. S. Aslanpour, S. S. Gill, and A. N. Toosi, “Performance evaluation metrics for cloud, fog and edge computing: A review, taxonomy, benchmarks and standards for future research,” Internet of Things, p. 100273, 2020.
- [18] Scikit-Optimize. (2020, mar) Sequential model-based optimization. [Online]. Available: https://scikit-optimize.github.io/stable/
- [19] F. Pedregosa, G. Varoquaux, A. Gramfort, V. Michel, B. Thirion, O. Grisel, M. Blondel, P. Prettenhofer, R. Weiss, V. Dubourg et al., “Scikit-learn: Machine learning in python,” the Journal of machine Learning research, vol. 12, pp. 2825–2830, 2011.
- [20] M. A. Bouhlel, J. T. Hwang, N. Bartoli, R. Lafage, J. Morlier, and J. R. R. A. Martins, “A python surrogate modeling framework with derivatives,” Advances in Engineering Software, p. 102662, 2019.
- [21] P. Balaprakash, M. Salim, T. D. Uram, V. Vishwanath, and S. M. Wild, “Deephyper: Asynchronous hyperparameter search for deep neural networks,” in 2018 IEEE 25th international conference on high performance computing (HiPC). IEEE, 2018, pp. 42–51.
- [22] (2021, jul) E2clab source code. [Online]. Available: https://gitlab.inria.fr/E2Clab/e2clab
- [23] J. Snoek, H. Larochelle, and R. P. Adams, “Practical bayesian optimization of machine learning algorithms,” arXiv preprint arXiv:1206.2944, 2012.
- [24] T. W. Simpson, T. M. Mauery, J. J. Korte, and F. Mistree, “Kriging models for global approximation in simulation-based multidisciplinary design optimization,” AIAA journal, vol. 39, no. 12, pp. 2233–2241, 2001.
- [25] X. Wang, B. Chen, G. Qian, and F. Ye, “On the optimization of fuzzy decision trees,” Fuzzy Sets and Systems, vol. 112, no. 1, pp. 117–125, 2000.
- [26] L. Breiman, “Random forests,” Machine learning, vol. 45, no. 1, pp. 5–32, 2001.
- [27] J. H. Friedman, “Greedy function approximation: a gradient boosting machine,” Annals of statistics, pp. 1189–1232, 2001.
- [28] I. Steinwart and A. Christmann, Support vector machines. Springer Science & Business Media, 2008.
- [29] E. Ostertagová, “Modelling using polynomial regression,” Procedia Engineering, vol. 48, pp. 500–506, 2012.
- [30] J. C. Helton and F. J. Davis, “Latin hypercube sampling and the propagation of uncertainty in analyses of complex systems,” Reliability Engineering & System Safety, vol. 81, no. 1, pp. 23–69, 2003.
- [31] L. Kocis and W. J. Whiten, “Computational investigations of low-discrepancy sequences,” ACM Transactions on Mathematical Software (TOMS), vol. 23, no. 2, pp. 266–294, 1997.
- [32] S. Mirjalili, “Genetic algorithm,” in Evolutionary algorithms and neural networks. Springer, 2019, pp. 43–55.
- [33] S. Das, S. S. Mullick, and P. N. Suganthan, “Recent advances in differential evolution–an updated survey,” Swarm and Evolutionary Computation, vol. 27, pp. 1–30, 2016.
- [34] P. J. Van Laarhoven and E. H. Aarts, “Simulated annealing,” in Simulated annealing: Theory and applications. Springer, 1987, pp. 7–15.
- [35] K.-L. Du and M. Swamy, “Particle swarm optimization,” in Search and optimization by metaheuristics. Springer, 2016, pp. 153–173.
- [36] (2020, feb) Welcome to e2clab’s documentation! [Online]. Available: https://kerdata.gitlabpages.inria.fr/Kerdata-Codes/e2clab/
- [37] Ray. (2021, may) What is ray? [Online]. Available: https://docs.ray.io/en/latest/index.html
- [38] R. Liaw, E. Liang, R. Nishihara, P. Moritz, J. E. Gonzalez, and I. Stoica, “Tune: A research platform for distributed model selection and training,” arXiv preprint arXiv:1807.05118, 2018.
- [39] K. Kandasamy, K. R. Vysyaraju, W. Neiswanger, B. Paria, C. R. Collins, J. Schneider, B. Poczos, and E. P. Xing, “Tuning hyperparameters without grad students: Scalable and robust bayesian optimisation with dragonfly,” arXiv preprint arXiv:1903.06694, 2019.
- [40] M. Balandat, B. Karrer, D. R. Jiang, S. Daulton, B. Letham, A. G. Wilson, and E. Bakshy, “BoTorch: A Framework for Efficient Monte-Carlo Bayesian Optimization,” in Advances in Neural Information Processing Systems 33, 2020. [Online]. Available: http://arxiv.org/abs/1910.06403
- [41] A. I. Cowen-Rivers, W. Lyu, Z. Wang, R. Tutunov, H. Jianye, J. Wang, and H. B. Ammar, “Hebo: Heteroscedastic evolutionary bayesian optimisation,” arXiv preprint arXiv:2012.03826, 2020, winning submission to the NeurIPS 2020 Black Box Optimisation Challenge.
- [42] P. I. Frazier, “A tutorial on bayesian optimization,” arXiv preprint arXiv:1807.02811, 2018.
- [43] D. Hamby, “A comparison of sensitivity analysis techniques,” Health physics, vol. 68, no. 2, pp. 195–204, 1995.
- [44] B. Fecher and S. Friesike, “Open science: one term, five schools of thought,” Opening science, pp. 17–47, 2014.
- [45] (2021, may) E2clab experimental artifacts. [Online]. Available: https://gitlab.inria.fr/E2Clab/Paper-Artifacts/plantnet
- [46] P. Kochovski, R. Sakellariou, M. Bajec, P. Drobintsev, and V. Stankovski, “An architecture and stochastic method for database container placement in the edge-fog-cloud continuum,” in 2019 IEEE International Parallel and Distributed Processing Symposium (IPDPS). IEEE, 2019, pp. 396–405.
- [47] D. Bernstein, “Containers and cloud: From lxc to docker to kubernetes,” IEEE Cloud Computing, vol. 1, no. 3, pp. 81–84, 2014.
- [48] L. Baresi, D. F. Mendonça, M. Garriga, S. Guinea, and G. Quattrocchi, “A unified model for the mobile-edge-cloud continuum,” ACM Transactions on Internet Technology (TOIT), vol. 19, no. 2, pp. 1–21, 2019.