NETWORK OF SCIENTIFIC CONCEPTS: EMPIRICAL ANALYSIS AND MODELING111Preprint of an article accepted for publication in Advances in Complex Systems journal [copyright World Scientific Publishing Company]
Abstract
Concepts in a certain domain of science are linked via intrinsic connections reflecting the structure of knowledge. To get a qualitative insight and a quantitative description of this structure, we perform empirical analysis and modeling of the network of scientific concepts in the domain of physics. To this end we use a collection of manuscripts submitted to the e-print repository arXiv and the vocabulary of scientific concepts collected via the ScienceWISE.info platform and construct a network of scientific concepts based on their co-occurrences in publications. The resulting complex network possesses a number of specific features (high node density, dissortativity, structural correlations, skewed node degree distribution) that can not be understood as a result of simple growth by several commonly used network models. We show that the model based on a simultaneous account of two factors, growth by blocks and preferential selection, gives an explanation of empirically observed properties of the concepts network.
1 L4 Collaboration & Doctoral College for the Statistical Physics of Complex Systems,
Leipzig-Lorraine-Lviv-Coventry, Europe
2 Institute for Condensed Matter Physics, National Acad. Sci. of Ukraine, UA–79011 Lviv, Ukraine
3 Centre for Fluid and Complex Systems, Coventry University, Coventry,
CV1 5FB, United Kingdom
Keywords: logology, complex systems, semantic networks, concepts network, generative models
1 Introduction
Semantic networks, i.e., networks that reflect connections between concepts within a particular domain, are among the tools to formalize knowledge as a whole [39]. Their history (at least their written history) can be traced back to the famous Porphyrian tree333A diagram representing the classification of substances in Aristotle’s “Categories” (in a written, not drawn form though) by Neoplatonist philosopher Porphyry[23]. and extended up to the modern ontologies in a computer and information science [13, 17]. The description of knowledge system is also a part of logology –- the science of science, that aims in quantitative understanding of origins of scientific discovery and creativity, its structure and practice [47, 44]. Since scientific publication remains the main form of documentation of the research output, the structure of scientific domains can be mapped using the vast amounts of currently available bibliographic data [19].
While it is impossible to know the exact structure of the abstract system of knowledge, there are many ways to model it using its projections. The semantic space for different domains can be modeled as a complex network of topic-indicating labels. To name a few, one can mention analysis of the topical landscape for research papers based on the network of co-used PACS (Physics and Astronomy Classification Scheme) numbers [21, 35]; co-mentions of chemical entities in biomedical papers [18]; close co-occurrence of pre-defined terms in full texts of papers in cognitive neuroscience [4]; co-appearance of pre-defined concepts in titles or abstracts of papers in quantum physics [28]; analysis of mutual hyperlinks between Wikipedia pages devoted to mathematical theorems [38]. The similarities between documents, authors, research groups, and other entities can be established using information about co-occurrence of terms, co-usage of keywords or topical indices, co-citations or bibliographic couplings, etc. Complex network formalism allows us to visualize [43] and quantify the structure of such similarities, which are typically considered as indicators of topical relatedness and, therefore, as projections of knowledge.
The networks discussed emerge as an outcome of a dynamic process at which the new knowledge is acquired. The new pieces of knowledge or innovations can be modeled either as an emergence of new ideas or concepts (i.e. new nodes in network representation) or new connections between the existing ones (i.e. by establishing new or reinforcing existing network links) [25, 42, 7]. Modeling such processes is a challenging task both for its fundamental relevance and numerous practical implementations. It may be used to build an efficient policy aimed at financial support or targeted stimulation of national research or to detect “hot topics” and emerging trends for research topic selection. The quantitative analysis of scholarly metadata provides a possibility to reveal not only explicit interrelations and patterns but also implicit ones [16].
The process of scientific discovery is governed by the structure of scientific knowledge, but at the same time the evolution of this structure is dependent on the process of appearing new concepts and links between them. Such interplay between the structure and dynamics is a typical feature of any complex system [20, 22]. Sometimes it is hard to distinguish the evolution of the principal structure of knowledge from the dynamic process governed by this structure since both are recursively interrelated. To this end, the models are constructed to capture how terms, keywords, labels, or tags become co-chosen from some predefined semantic space [9, 25, 36].
With all said above, it is of a primary importance to analyze the structure of semantic networks in science and to model processes of their evolution. In this paper, we plan to address both questions. To this end, we will use a collection of manuscripts submitted to the e-print repository arXiv.org and the vocabulary of scientific concepts collected via the ScienceWISE.info platform444ScienceWISE.info is a web service connected to the main online repositories such as arXiv, whose peculiarity is a bottom-up approach in the management of scientific concepts (http://sciencewise.info/faq). The concepts are extracted automatically from scientific publications using KPEX algorithm [10] and then validated by registered users of the platform, see also [32] for more details., see Fig. 1. To our knowledge, this vocabulary currently contains the most comprehensive collection of scientific concepts in the domain of physics. To consider relations between the concepts, we will analyze how do the concepts co-occur in publications. Such analysis will allow constructing the network of concepts – empirical analysis and modeling of this network is our main subject of study in this paper. Some of our results were previously announced in a Letter [34].
The rest of the paper is organized as follows. In the next section we describe the data under analysis in detail, explain how the network of scientific concepts is constructed, and analyze its essential features. We show that the empirically observed network is a dense one and possesses other non-trivial characteristics that cannot be understood within simple generative models as Erdős-Rényi random graph (section 2.3) or Barabási-Albert model (section 2.4). To understand possible mechanisms that lead to the concepts network under discussion, in Section 3 we develop a model that reproduces the principal empirically observed features. The key assumption of the model is growth by blocks with preferential selection. We show that both ingredients are crucial in network modeling and further discuss the relation of the suggested model to the others used in dense networks modeling. We discuss the results in Section 4 and finish by conclusions and outlook in Section 5.
2 Scientific concepts network
2.1 Data
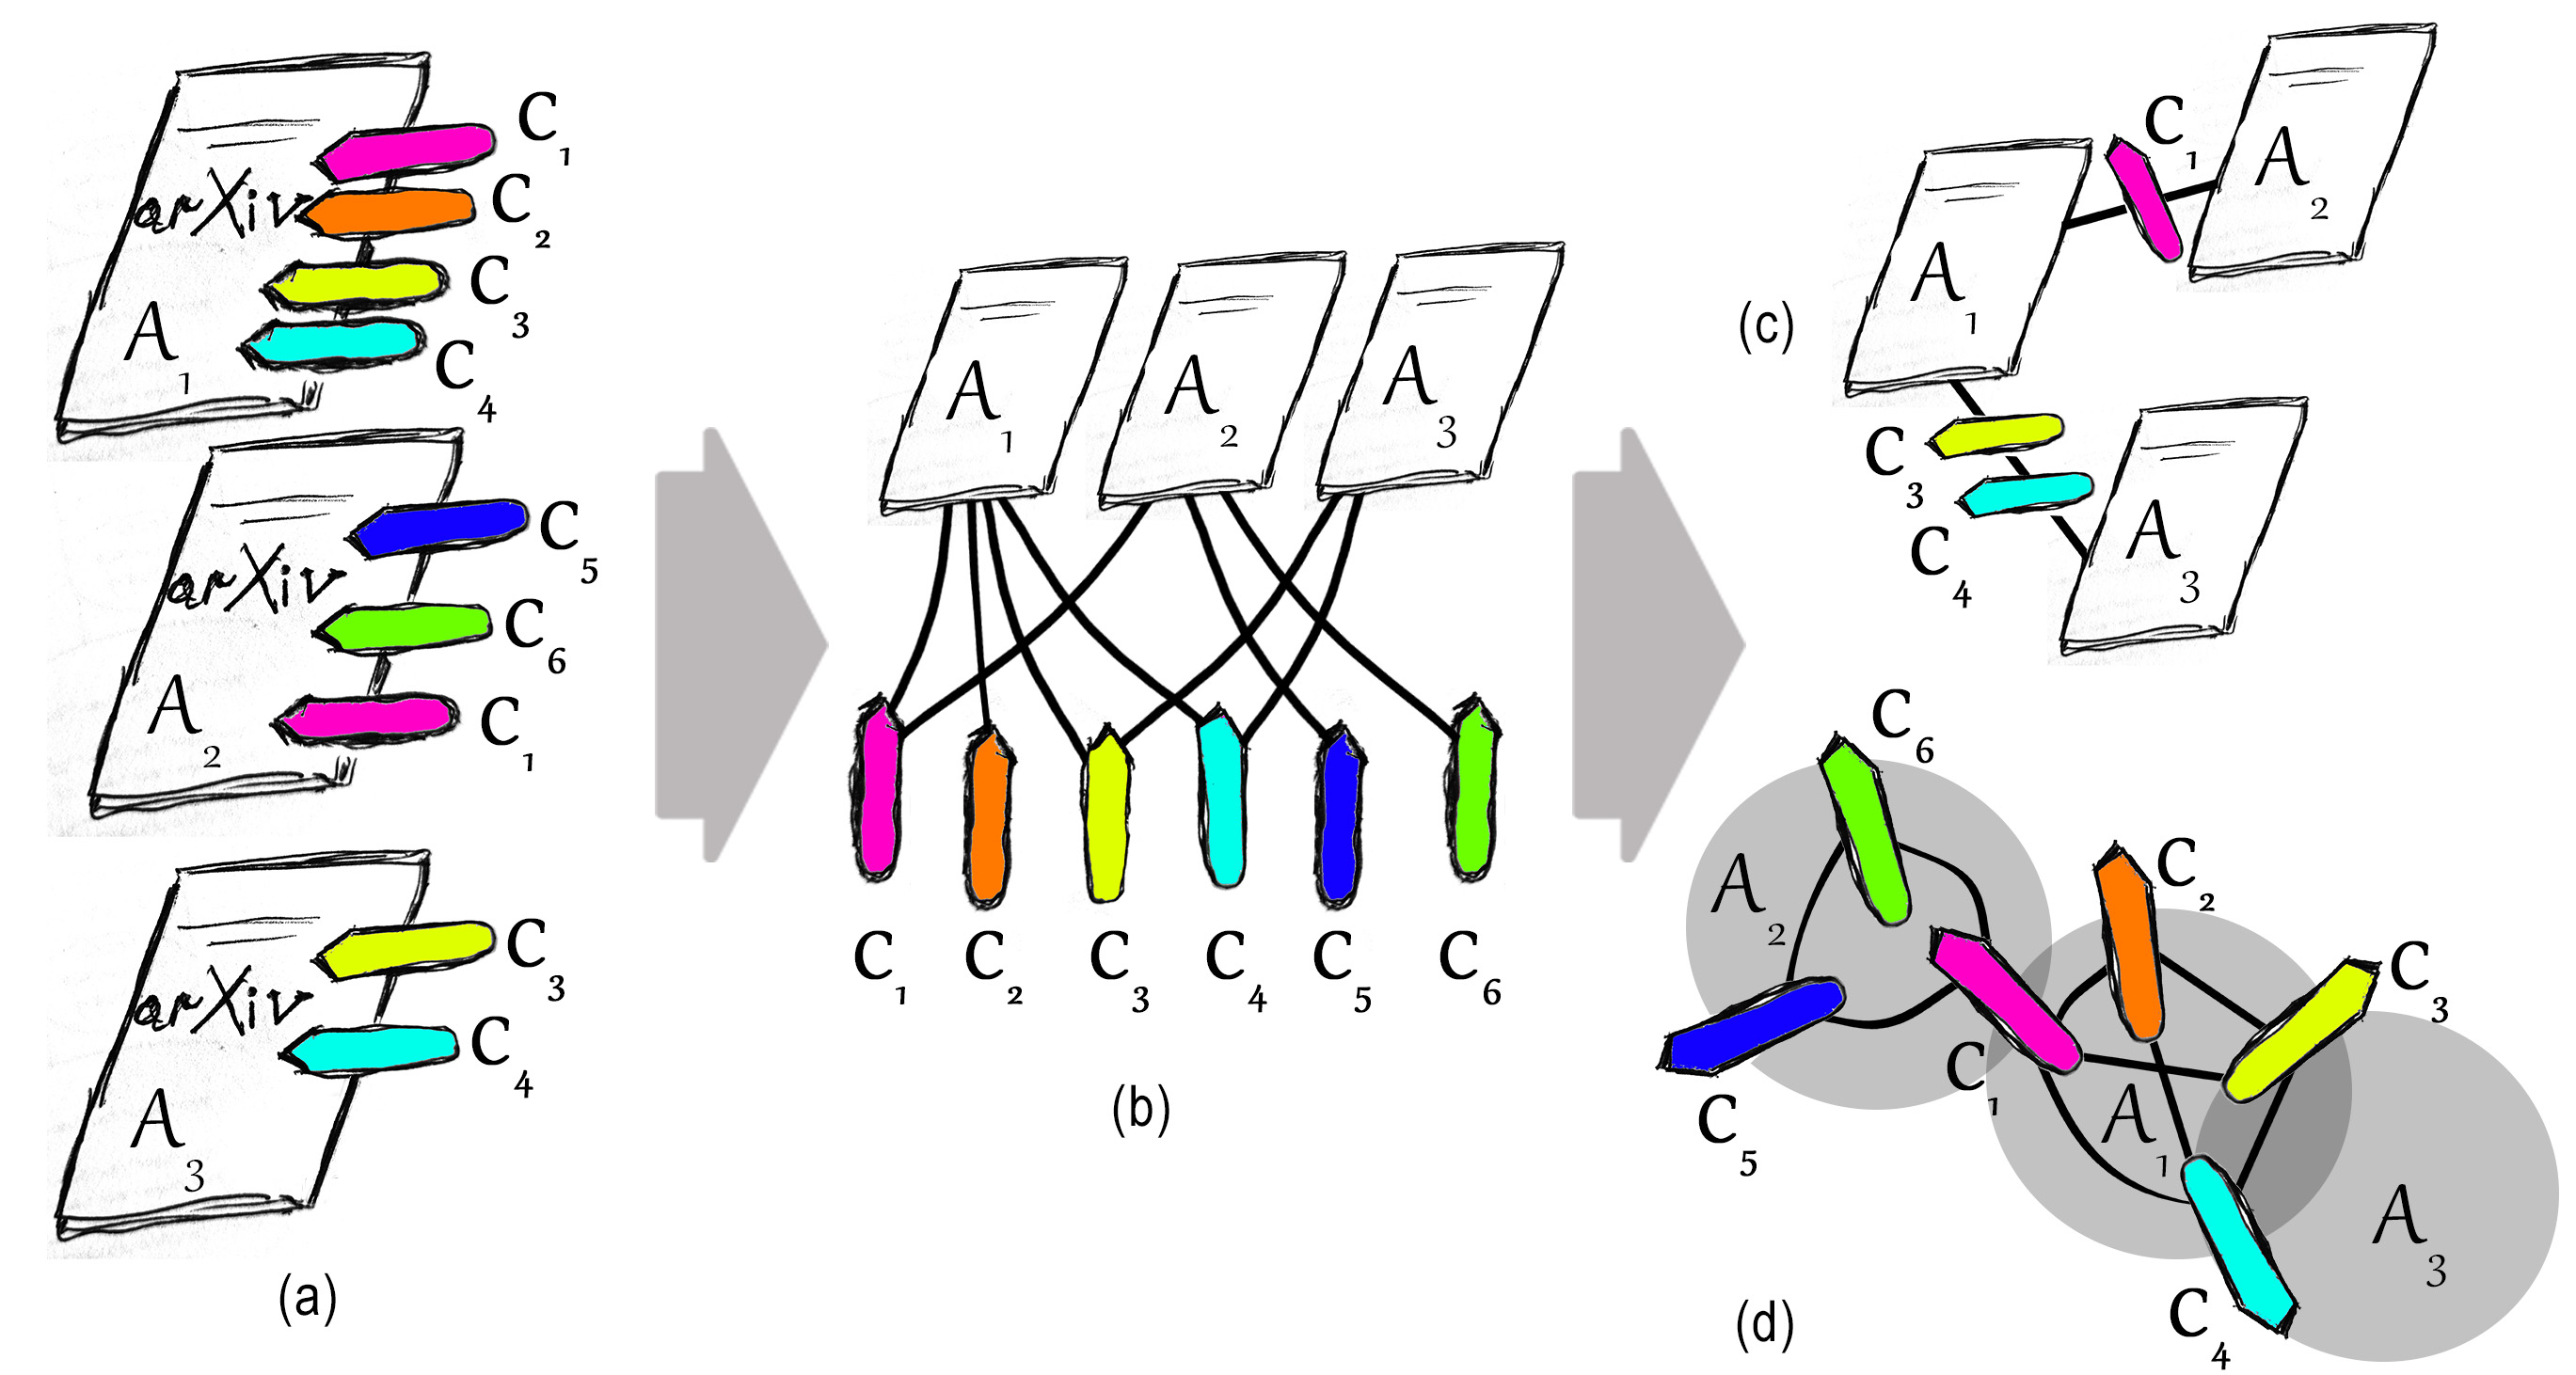
We consider a collection of scientific publications in Physics domain. The sample of manuscripts consists of 36,386 preprints submitted to e-repository arXiv.org during a single year 2013 that have been assigned to a single category during the submission process. Cross-categorical articles have been discarded from the current analysis in order to have one-to-one correspondence with the data sets analyzed in [32, 33, 7]. For each of the manuscripts, a set of its inherent concepts has been extracted using ScienceWISE [1] platform. In this way, the data under consideration, see Fig. 1 (a), can be conveniently described in the form of a bipartite network (this and other definitions related to the theory of complex networks in more details can be found, e.g., in [2]) that consists of nodes of two types: articles and concepts , see Fig. 1 (b). In [32] the purpose was to analyse the structure of the single-mode projection of the bipartite network into the space of articles Fig. 1 (c). In this way, the communities has been found that reveal an inner thematic structure. In turn, the analysis reported below will concern the network of concepts: being of interest per se, it may serve also as a complementary step in analysis of the whole bipartite network, Fig. 1 (d), via its another single-mode projection.
In the process of concept extraction, the ScienceWISE platform classifies concepts as generic and non-generic ones.555See Appendix where we give several examples of generic and non-generic scientific concepts as extracted via the ScienceWISE platform. Overall number of concepts in the data set under consideration is 12,200, out of these 347 concepts are generic and 11,853 are non-generic ones. In Ref. [32], generic concepts have been excluded from the analysis to avoid over-densifying the article network. To have a direct correspondence with the research conducted in [32], the concepts marked as generic ones by ScienceWISE have been excluded from our analysis in this paper too. As a result of such routine we have found that a manuscript contains on average 37 concepts. The distribution of the number of concepts per manuscript has rather skewed shape as shown in Fig. 2, where the tail reaches about concepts per manuscript.
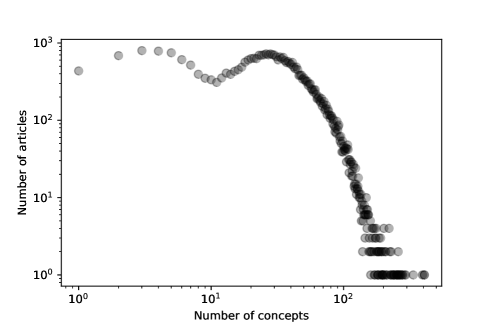
Beside a maximum around 30 concepts per article one may observe another one around 3 concepts, which may correspond to short report style submissions. Alternatively, the cause could lie in document parsing process: for some manuscripts ScienceWISE was not able to scan the full text, but could scan only abstract instead.
2.2 Network construction and its basic features
The data set described contains distinct non-generic concepts. We consider them as building blocks of the system of disciplinary knowledge. However, not only ideas are important in scientific creative processes, but the way how they are combined. Therefore, we represent each concept by a node of the network, and connect two nodes by a unit-weight link if the corresponding concepts appeared together within at least a single publication. The structure and evolution of this network, called hereafter an empirical concepts network, is a subject of our analysis.
The resulting empirical concepts network consists of nodes connected by links666All network properties were calculated using a Python implementation of igraph package [40].. All, except two isolated nodes, belong to the largest connected component. In a considered collection of scientific publications, each of concepts represented by the isolated nodes appeared only once in a single document. These concepts are Finite strain theory and Nanomotor. The manuscripts they appear in do not contain any other non-generic concepts (in fact, each of them contains 2 or 3 other generic concepts, which were excluded from consideration).
The density of links , i.e. the ratio between the total number of links and the number of all possible links in the network , reaches . Such high value is not typical for networks actively analyzed in the literature. For example, density of such benchmark networks as Internet has , for power grid, for scientific collaboration network, see e.g. [2] and references therein. As one of the consequences of high density of links, average node degree in this network is quite high as well: . In this respect, it is interesting to relate the network under consideration with the so-called dense networks, see e.g. [11].
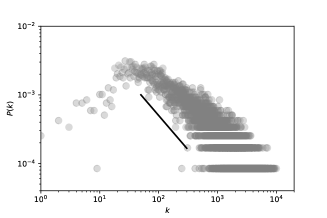
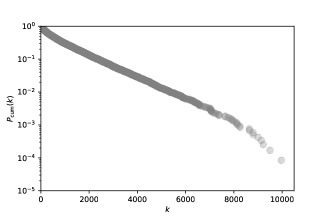
The connectivity patterns of different nodes/concepts vary: rather expectedly, more specific concepts appear with a few others only, while more generic ones co-occur with a lot of others. For example, Statistics concept has co-occurred with concepts ( of other concepts in the data set) and has the highest degree in the network . Standard deviation of the node degree distribution reaches value of and indicates high level of inhomogeneity among concept co-occurrence statistics. The above features of node degree distribution may hint for its skewed shape. Indeed, the tail of node degree distribution shown in Fig. 3a in a double logarithmic scale may be visually compared to a power-law function with exponent close to , while cumulative degree distribution may be well fitted by a straight line in semi-log scale, see Fig. 3b, which hints for its exponential decay.
 (a)
(b)
(a)
(b)
Due to the finite size of the data set under investigation the functional form of the degree distribution cannot be definitely identified.
Another feature of the node degree distribution is the increase of with for small degrees, see Fig. 3a. It means that, e.g., the probability of a randomly selected node to have degree is smaller than its probability to have degree . This is quite natural since the number of distinct concepts in a manuscript sets a lower bound for node degrees. Indeed, all concepts met in the same manuscript are represented by a complete sub-graph (or clique). Therefore, the maximum at around 30 concepts per article in Fig. 2 may correspond to the maximum for the node degree distribution (see Fig. 3a). Similar shapes of node degree distributions were found and declared to be robust for a few other empirical data sets analysed in [9], where the co-usage of topical tags annotating various web resources is considered and for the network of chemical entities co-occurring in the abstracts of research papers and patents [36]. The summary of basic network metrics is shown in the first line (empirical) of the Table 1.
| , | , % | ||||||||
| empirical | 11853 | 5.38 | 7.66 | 908 | 1146 | 9970 | -0.28 | 0.74 | 0.38 |
| Erdős-Rényi | 11853 | 5.38 | 7.66 | 908 | 29 | 1023 | 0.00 | 0.08 | 0.08 |
| Barabási-Albert | 11853 | 5.38 | 7.66 | 908 | 568 | 3875 | 0.01 | 0.15 | 0.15 |
| USP, 37 | 11551 | 14.62 | 21.92 | 2531 | 1516 | 5204 | 0.23 | 0.40 | 0.45 |
| USP, EMP | 11538 | 19.65 | 29.53 | 3407 | 1850 | 6433 | 0.19 | 0.49 | 0.53 |
| PSP, 37 | 11557 | 0.86 | 1.28 | 148 | 618 | 8602 | -0.55 | 0.94 | 0.06 |
| PSP, EMP | 11554 | 1.50 | 2.25 | 260 | 788 | 7603 | -0.62 | 0.95 | 0.12 |
Besides the nodes have distinct degrees, it is important to check whether the nodes tend to be connected to the nodes that are similar to them. Such node degrees correlations can be found in real networks: e.g., high-degree nodes prefer to connect to the other high-degree nodes more likely than one would expect by chance for social networks (including co-authorship networks) while the situation is the opposite for technological networks, where high-degree nodes prefer to connect to low-degree nodes [31]. Such preferences may be quantitatively measured in terms of assortativity mixing by degrees , which is defined as a Pearson correlation coefficient between node degrees on both ends of each link in the network. Positive values of reflect degree homophily (i.e. that high-degree nodes are likely to be connected to the other high-degree nodes), while negative values of indicate that high-degree nodes tend to be connected to the low-degree ones. The considered network of concepts has negative assortativity, : the similar absolute value (same order of magnitude) as for the co-authorship network (, see [31]) but opposite sign. This indicates that unlike the mechanisms in social networks, in concepts network high-degree nodes tend to attract low-degree ones. Presumably, to describe a specific problem, a list of specific terms is used, but some more generic ones are used to give a context to the wider audience or to connect specific problem/domain to more widely known existing knowledge.
Node degree, as described above, reflects the level of connectedness of a given concept to others in the network. One may also investigate the local connectivity patterns around the nodes: how densely interconnected closest neighbours of a node are. Since all concepts found in the same document are fully interconnected by definition, the lower connectivity of node’s nearest neighbours indicates that the corresponding concept was used in different papers bringing different set of concepts together. If given node has concepts/nodes connected to it by links, one may ask a question how many of these nodes are directly interconnected. Given there are such connections, the ratio between and the number of all such possible connections is defined as a clustering coefficient of node
| (1) |
Average clustering coefficient is defined as an average value of
| (2) |
where runs over all nodes in the network. In general, this metrics does not correlate with the node degree or network density. These correlations rather depend on the network type. For example, average clustering coefficient of the fully connected network or of the network that consists of isolated fully connected sub-graphs equals , while for a tree-like network is independent of its density. For some network models (e.g. the Erdős-Rényi random graph) clustering coefficient by definition (for the graph of a large enough size). The reason is that with the underlying design of the graph, a probability that two randomly chosen neighbours of node have a link between each other is the same as the probability that two randomly chosen nodes are connected by a link.
An alternative way to investigate local correlations is to consider transitivity (sometimes referred to as global clustering coefficient, see [2]). It is defined as a ratio between the number of closed triplets in the network and the total number of network triplets [30]. Similarly to the average clustering coefficient , for a fully connected network and for a tree-like graph. However, the difference between the two ( and ) may indicate some special topological features of the network.
To get a better understanding of the processes behind generation of scientific knowledge and the corresponding knowledge graph, let us compare the resulting empirical concepts network topology with the topology of networks of a similar size obtained within familiar generative models.
2.3 Comparison with the Erdős-Rényi model
Generation of scientific knowledge involves creativity which is not a deterministic process. Moreover, each author may use different terms to describe the same observation. This may lead to the basic assumption of random connections between concepts, which corresponds to the maximum entropy principle given no other restrictions besides number of nodes and links. In terms of networks this process is represented by the Erdős-Rényi random graph [15, 2]. Exponential decay of the cumulative degree distribution and the existence of a clear maximum of support the idea behind a choice of such model.
This model allows to generate uncorrelated networks with the same number of nodes and links as the original one. To this end, choosing and as given in the first row of Table 1 we have generated 100 realizations of the Erdős-Rényi graph. Since we deal with dense networks, we found in practice that every single realization of the Erdős-Rényi graph does not contain disconnected components and consists of a single connected component. More detailed description of the empirical concepts network features is shown in the second row of the Table. 1.777For this and subsequent models, an averaging over 100 network realizations has been performed. For the network sizes explored, the self-averaging effect has been observed: all network characteristics reported in the Table coincide for each network realization with their average values within the reported accuracy. The only feature that slightly fluctuates, is the maximal node degree.
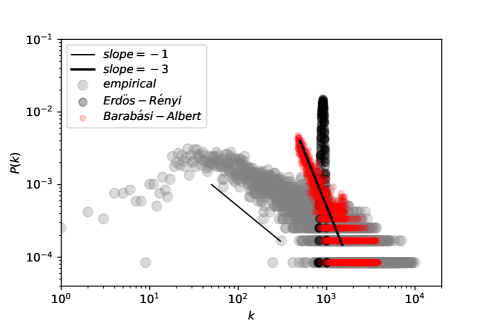
Given the same number of nodes and links, the density of links and the average node degree coincide in the empirically observed network and the ones generated by the Erdős-Rényi model. The discrepancies become visible with more in-depth analysis. Maximally observed node degree in networks generated by the Erdős-Rényi model exceeds its average value by only, while in the empirical concepts network exceeds by almost . In terms of standard deviation , its value for Erdős-Rényi random graphs is almost times smaller than for the empirical one. These mean that the empirical concepts network is much more heterogeneous than the Erdős-Rényi random graph. This may be visually observed in Fig. 4, where beside the node degree distribution for the empirical concepts network (grey discs), the corresponding distribution for a single realization of the network generated by the Erdős-Rényi model is shown by black discs.
The discrepancies between the empirical concepts network and the random graph topologies are also observed for connectivity patterns between nodes of different degrees. While the empirical concepts network is disassortative (), random network is neither disassortative nor assortative with . This indicates the nature of the model where no correlations have been incorporated during the process of network generation. Finally, the random network differs from the empirical one in terms of the clustering coefficient and transitivity . The fact that the values of both and are smaller for the random graph than for the empirical network is not a big surprise. The most insightful observation is that and are almost identical for the random graph, while they differ significantly for the empirical concepts network. The above observations indicate that random processes incorporated into the Erdős-Rényi model are not sufficient enough to describe the processes behind creative processes of scientific writing; and more sophisticated models should be considered.
This leads us to compare the empirical concepts network with another model that could arrive at a more heterogeneous and more correlated graph than the Erdős-Rényi one. Let us consider the Barabási-Albert model that has growth and preferential attachment as key ingredients and is known to generate heterogeneous graph with power law decay of the node degree distribution [3].
2.4 Comparison with the Barabási-Albert model
To remind, this generative model starts with isolated nodes at time . At each time step a node is added and it is connected by links to the existing nodes. The choice of which nodes to connect to is governed by the preferential attachment scenario: the more connections the existing node has, the more likely it will be selected for upcoming links. Here we consider linear preference as it has been originally proposed in [3]. This model is known to produce heterogeneous graphs that in the limit of are characterized by a power-law node degree distribution with the exponent . We expect that due to its heterogeneity the network generated by the Barabási-Albert model will have more similar topology to the empirical concepts network than the Erdős-Rényi random graph.
To this end, we generated networks that have the same number of nodes and only slightly different number of links as compared to the empirical concepts network.888In general, the Barabási-Albert process cannot arrive at arbitrary predefined number of links without additional processes that involves link removal or addition of extra links, since at each time the links arrive at blocks of size . We decided to stick to the original formulation of the model with discrepancy in the number of links instead of arriving at exactly the same number of links in cost of modification of the underlying processes. This is achieved by starting with isolated nodes and adding step-by-step nodes with connections each. Doing so, after steps we arrived at a network with nodes and links. As in the former case of the Erdős-Rényi model, we have generated realizations of the Barabási-Albert model and found that due to the network size the self-averaging occurs: the characteristics of the resulting networks hardly depend on the realization, they are summarized in the third row of Table 1.
As expected, the Barabási-Albert model reproduces empirical network topology better than the Erdős-Rényi model does, especially in terms of node degree heterogeneity. For example, maximal node degree exceeds its average value by more than (vs for the Erdős-Rényi model and for the empirical concepts network). Regarding standard deviations, even though for the Barabási-Albert model is twice smaller than for the original concepts network, it exceeds its value for the Erdős-Rényi graph in almost times. The difference in node degree heterogeneity is clearly visible in Fig. 4, where node degree distributions for single realizations of the Erdős-Rényi graph and the Barabási-Albert network are shown. It is also seen that neither of the models can reproduce the empirical node degree distribution.
Similarly to the Erdős-Rényi graph, the Barabási-Albert network is neither assortative, nor disassortative, indicating the feature of the empirical concepts network that cannot be captured by the model. The other feature that is not captured by the model is the difference between the average clustering coefficient and transitivity , even though the values for both are closer to the empirical concepts network than the ones for the Erdős-Rényi network.
To understand possible mechanisms that lead to the concepts network under consideration, let us develop a model that is capable to reproduce its empirically observed features. Doing so, we will not put as a primary goal to rich a high precision of reproducing given set of metrics. Rather we will be interested in a qualitative description of main tendencies in network structure and their explanation by network generation mechanisms.
3 Growth by blocks with preferential selection
The model we suggest to describe the concepts network growth is based on two main features: i) growth by blocks and ii) preferential selection. By growth by blocks we mean that every generated article enters the concepts network as a complete sub-graph of concepts it contains. By preferential selection we refer to the concept selection mechanism. The concepts selected to populate an article may be novel as well as already existing ones. In the case of selection from the existing concepts, the preference is given to the concepts that appeared more frequently in the past.
3.1 Discrete time process
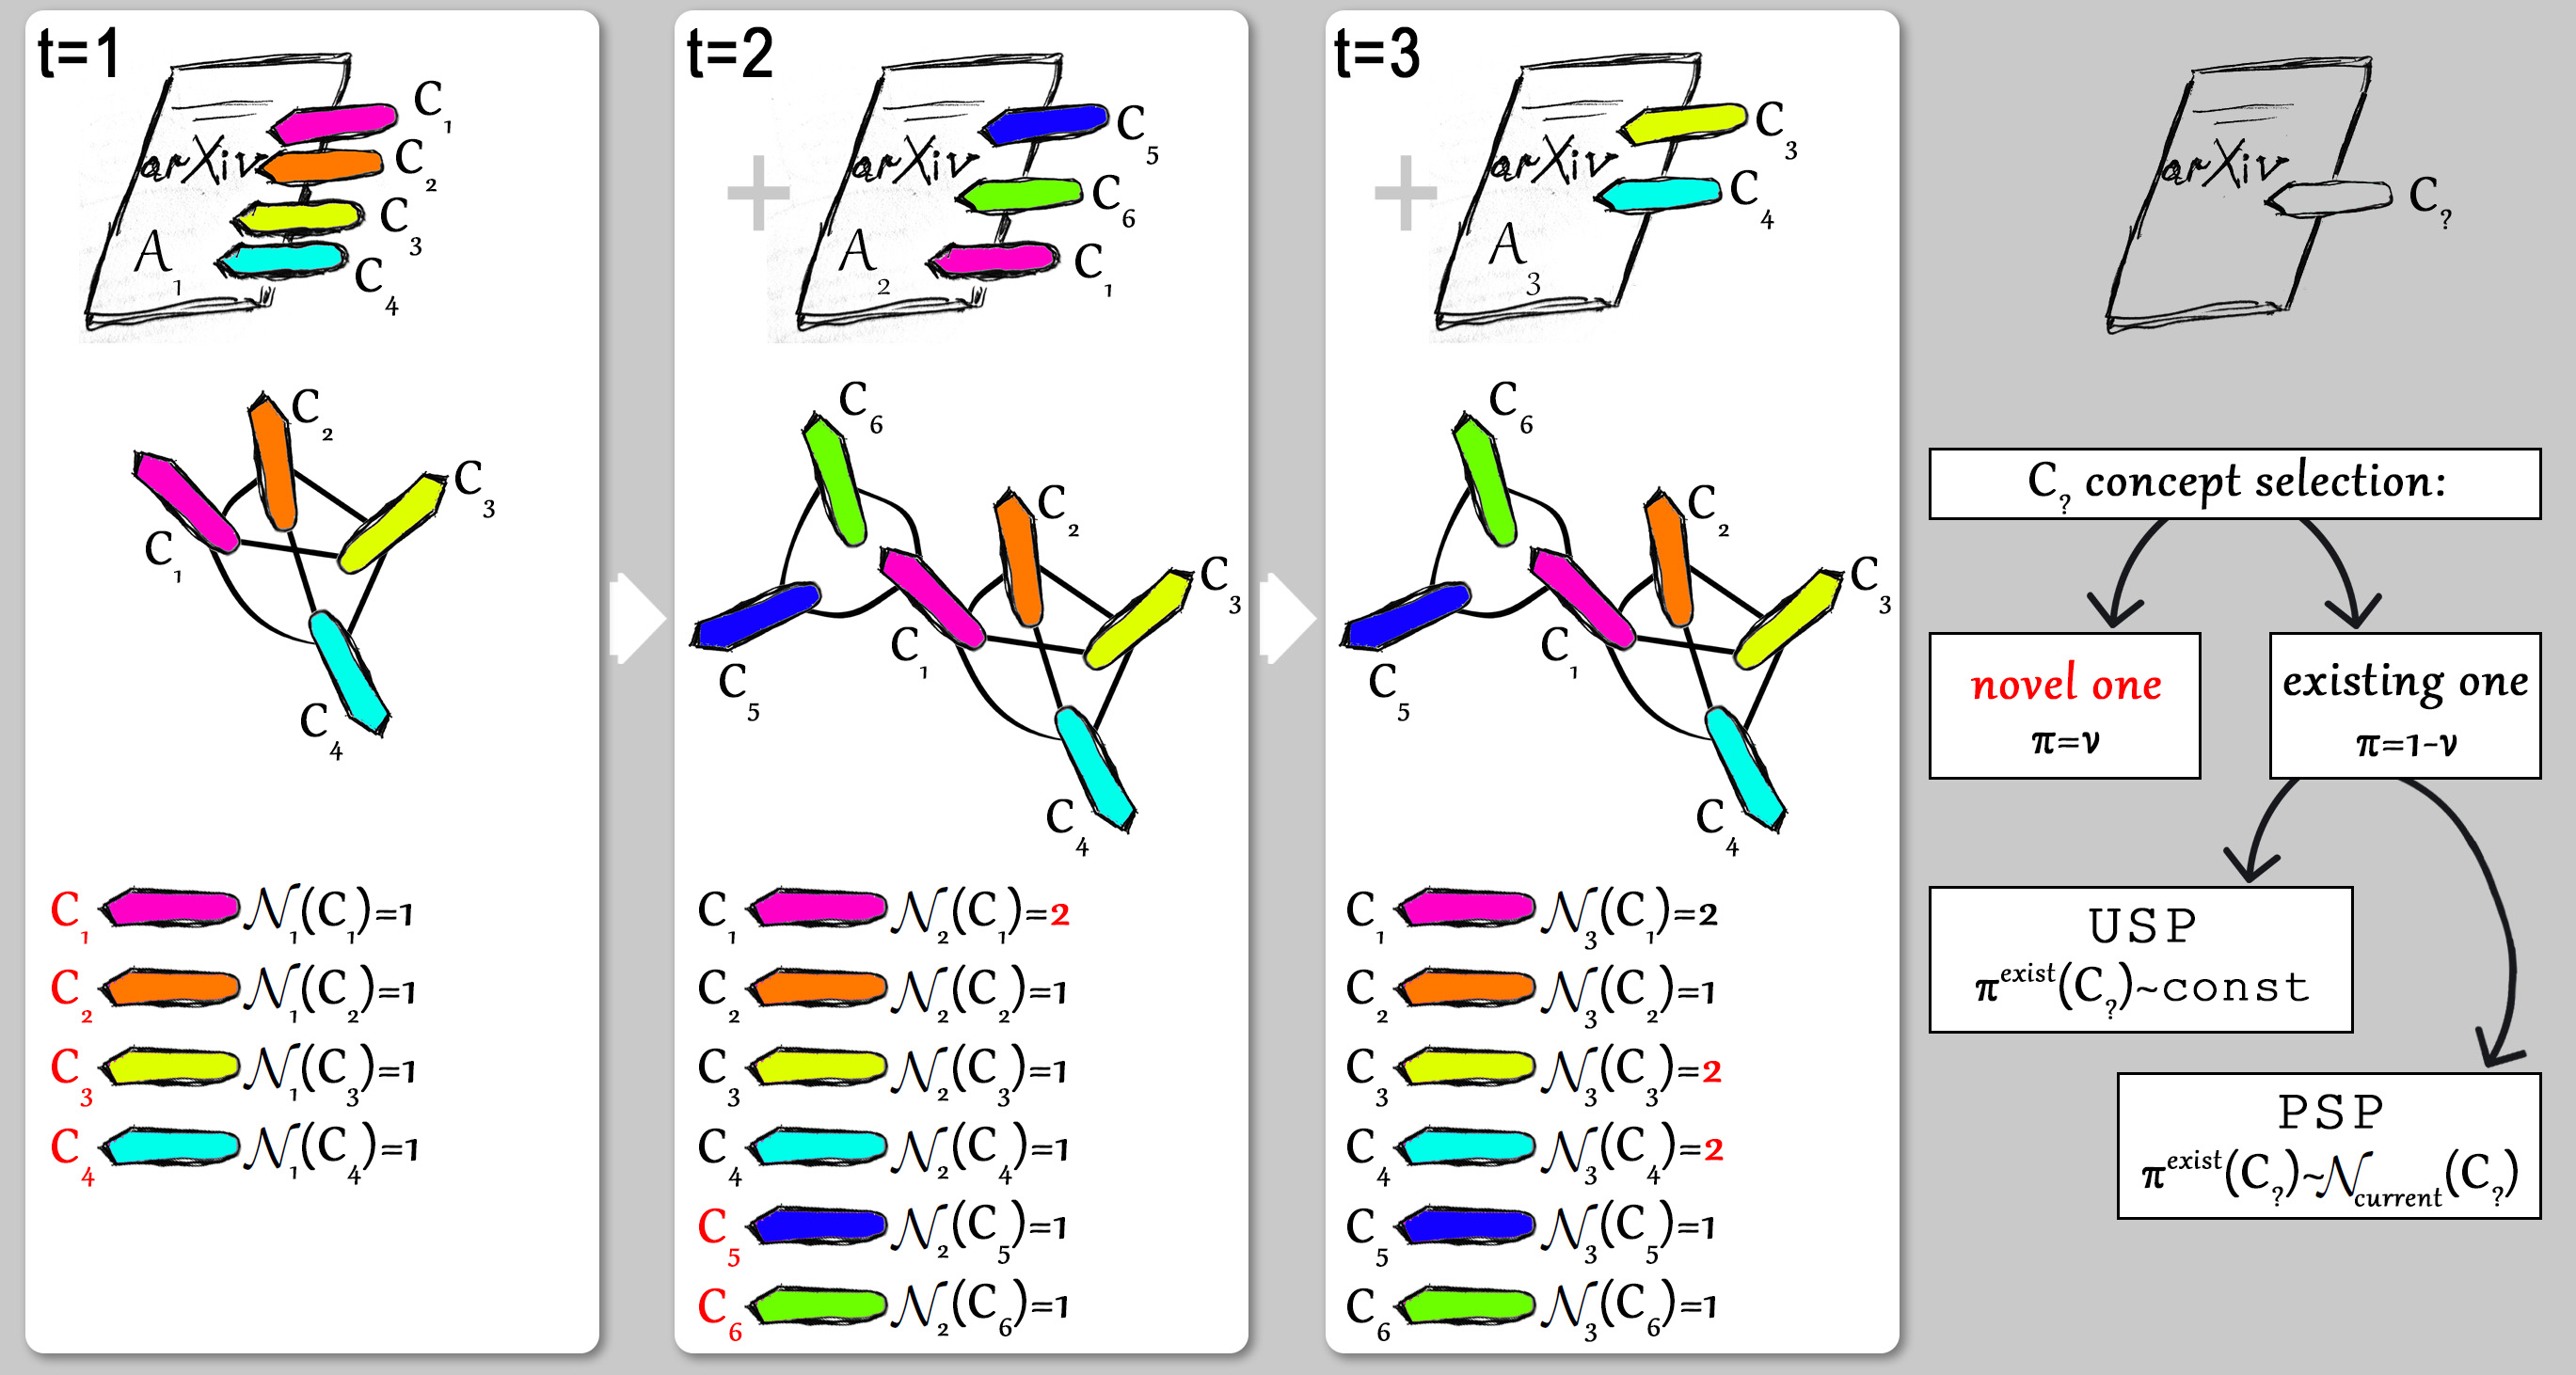
Let us consider a discrete time process where time changes in a range . At each time step a new article is generated. We will refer to this article by . Each article is modelled as a set of distinct concepts, i.e. a block of concepts. The process of article generation consists of i) drawing the block size and ii) selection of concepts to populate the article, see Fig. 5 for the process demonstration. Below we describe the details of choice and the concepts selection procedures.
3.2 Block sizes
In order to correspond to the empirically observed network, we will ensure the average block size (i.e. the average number of concepts per article) to be the same as in the empirical data set. Here, we consider two alternative ways to satisfy this condition. At the first instance, we employ the simplest mechanism such that is fixed and independent of . This strategy can be found, e.g., in the generative models proposed in [36] (the network of co-used chemical annotations is growing by adding a link on each time step, i.e., ) and [45] (hyperedge containing three nodes is repetitively added, i.e., ). Second, we draw from the actual distribution of the number of concepts per article in the arXiv data set. An example is given in the first row of Fig. 5, with (four concepts , , , in article ), (three concepts , , in article ) and (two concepts , in article ). Such settings allow us to analyze whether the variations in block sizes affect the resulting network topology.
Once is defined, the next step is to select the concepts themselves. The following subsection describes the mechanisms that are used in the model to perform such selection.
3.3 Selecting the concepts set
Let us consider a time step . The generated up to this moment data set consists of articles and different concepts (let us denote the set of these concepts by ), see Fig. 5 for illustration. The article generated at time may contain some of the above concepts as well as the concepts that are introduced in the article for the first time. Let us call the latter ones as novel concepts. Within our model we fix the probability for each of the article concepts to be a novel one. Consequently, a concept of the generated article is one of already existing concepts with probability . Moreover, let us consider that different already existing concept have different chances to be selected to populate an article: the more popular the concepts is among first articles, the more likely it will be selected to populate the -th one. We will call such process a preferential selection. For comparison, we will also consider a uniform selection process that picks existing concepts for article independently of their frequencies of appearances among first articles. Below, we describe the concepts selection mechanism in more detail.
3.3.1 Novel vs already existing concepts
The process of concept selection for is done one-by-one until the required number is reached. Let us describe below a procedure of selecting the -th concept for article , thus runs in a range .
As explained above, the model says that with a fixed (quite low) probability
| (3) |
the -th concept is a novel one, it does not belong to the set. Accordingly, with the probability
| (4) |
the -th concept belongs the concepts set . For convenience, let us denote the subset of existing concepts contained within first articles and excluding selected concepts for article by . Once the already existing concept has been selected, it cannot be selected again for the same article. Therefore it is to be selected from the set .
Below we suggest two scenarios to select the -th concept for article from the set of already existing concepts.
3.3.2 Uniform selection process
First, let us consider a uniform selection process (USP). This is relatively simple scenario. It assumes that each concept that appeared within set has the same chance to be selected. I.e. the probability that the concept will be selected as a -th one for the article follows
| (5) |
Here is the size of a set .
3.3.3 Preferential selection process
Second, we consider preferential selection process (PSP). Unlike in [36, 25, 9], the preference is not governed by the properties of the underlying network. No input information about the connectivity between concepts is required. In this scenario, the probability for the concept to be selected is proportional to the number of articles in which the concept has appeared:
| (6) |
where the denominator sums the number of times each concept from the set has appeared in all articles.
In both scenarios the concepts network grows by adding cliques to the existing graph, see the third row of Fig. 5. At each time once a new article of concepts is generated, it enters the concepts network as a complete graph of nodes and links between them. Thus, during its evolution, the following processes may be observed in a generated concepts network: i) addition of new nodes, ii) appearance of links between the novel nodes as well as between novel and already existing nodes, iii) appearance of new links between previously unconnected existing nodes, which is important for generation of dense networks.
Although majority of complex networks structures of either natural or man-made origin are sparse, there exists ongoing interest in the so-called dense networks, that are characterized by diverging mean node degree. For the scale-free distributions this means that the corresponding decay exponent takes values between 1 and 2 [6, 11]. Examples of such structures are found in the brain [5], internet (see [37] and references therein), social recommender systems [48]. Familiar preferential attachment-based growth models are not able to reproduce properties of dense networks. The reason is due to the fact that the growth in such models occurs by homogeneous addition of network nodes and links that leads to sparse structures. Certain scenarios circumvent such restriction and lead to dense networks [14, 6, 46, 12, 8, 11]. Although the observed concepts network is characterised by a very high density of links (cf. in Table 1), strictly speaking it cannot be named the dense network in the sense explained above. However, we believe that the model suggested above for its evolution may be useful in studying other networks with high density of links. Once the processes that govern generation of concepts network have been defined, let us explore topological properties of the network generated by the rules described above.
4 Results
In our simulations we set the number of generated articles to be exactly the same as the number of articles () in the arXiv data set. Fixing the number of articles does not guarantee that the generated network will have the same number of nodes (concepts) as the empirical concepts network: the two remaining degrees of freedom of the model may affect the number of different concepts in a generated data set.
4.1 Number of nodes
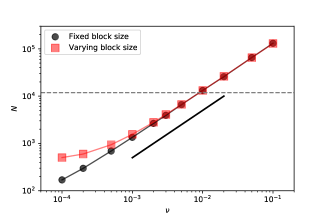
It is natural to expect positive correlations between the parameter (the probability of appearance of a novel concept) and the number of different concepts, i.e. the number of nodes in the resulting network. Indeed, we may see this dependency for generated data sets in Fig. 6a (PSP) and in Fig. 6b (USP) for different values of the model degrees of freedom: the probability the block size distribution.

 (a)
(b)
(a)
(b)
The number of concepts in a generated data set has a tendency to increase independent of the acquired concepts selection mechanism and independent of the block size distribution. Moreover, the number of nodes looks to be rather independent on the concepts selection mechanism. For relatively large values of () the distribution of block sizes considered does not affect the number of concepts in the resulting data set. Thus, further in the analysis of the generated concepts networks we will fix the parameter that gives us approximately the same number of concepts as in the original data set for both types of block size distributions and for the two considered concepts selection mechanisms. Indeed, we performed 100 simulation runs for each set of model parameters (degrees of freedom: ; type of block size distribution; PSP vs USP mechanisms of concepts selection) and observed that the affect of the block size distribution has the same order of magnitude as the stochastic effects of the modelled process confirming our visual conclusions. The number of concept nodes the resulting generated networks contain varies between and over all realizations. The reason to arrive at about the same numbers of concepts for USP and PSP mechanisms may be explained as follows. The difference between the two models consists in which concepts out of existing ones will be selected to populate an article. But the mechanisms to select existing or novel concepts are identical in both processes, leading to the same number of concepts in the large network limit. However, we continue to use both distributions of block sizes for modelling – the difference becomes visible further.
It is worth mentioning that for small the number of concepts in the generated data sets depends significantly on the type of block size distribution. If is small enough, the number of concepts in the generated data set using empirical block sizes exceeds the number of concepts in the generated data set using fixed block sizes. This discrepancy may be explained by considering the limiting scenario with . Within this scenario the number of different concepts in the generated data set equals to the maximal number of concepts observed in an article (block size ) over all articles in the generated data set. If each article has concepts, i.e. fixed block size case, then . However, in the case of the empirical block sizes, will be higher than if the distribution of values has a non-zero probability for at least two values.
4.2 Number of links
So far we adjusted model parameters to make the number of nodes in the generated concepts networks comparable to the number of nodes in the empirical concepts network. There are no parameters left to adjust the number of links for the generated network to contain. Let us now focus on the number of links found in the generated networks.
The numbers of links in the generated concepts networks have the same order of magnitude as the empirical one (millions of links). More detailed inspection, see Table 1 shows that the number of links in the networks generated by USP model exceeds the number of links in the empirical concepts network in about times while this number in the networks generated by PSP is about times smaller than the number in the empirical concepts network. The reason to have significantly smaller number of links in PSP generated network as compared to USP generated network is the following. In frames of the PSP process, a pair of “popular” concepts have relatively high chance to appear in every subsequent article, and such co-appearance does not introduce a new link to the network after the first co-appearance. In USP mechanism popularity of the concepts does not affect their chances to co-occur and new links are introduced with higher probability. Now, let us now proceed with the topological features of the generated networks.
4.3 Node degrees
Let us analyze the node degree distributions first. Since the number of links has a direct relation to the average node degree , average node degrees in the networks generated using PSP mechanism is smaller than in the empirical concepts network, while average node degrees in the networks generated using USP mechanism overestimate the corresponding value for the empirical concepts network, see Table 1. Among the two distributions of block sizes, the empirical one arrives at a closer value of the average degree if PSP mechanism is used. But in the case of USP mechanism, generated networks with fixed block sizes have a closer value of to the original concepts network.
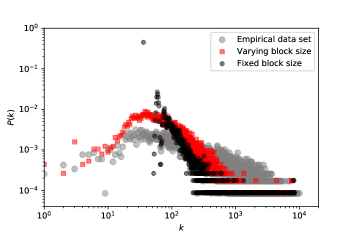
Node degree distributions for the generated networks using PSP and USP mechanisms are shown in Fig. 7 (panels a and b, correspondingly). There, the distribution for the empirical concepts network is provided for comparison.
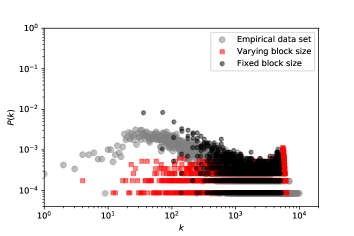 (a)
(b)
(a)
(b)
It can be seen in the figure, that any considered concepts selection mechanisms in combination with considered block size distributions cannot precisely reproduce degree distribution of the empirical concepts network. However, it is possible to capture its general shape if PSP mechanism is chosen.
If PSP mechanism is considered in combination with the fixed block size (black discs in Fig. 7a), degree distribution for relatively large degrees has rather a power-law decay with the exponent close to . The power law decay with is also expected for the Barabási-Albert network [3], which used preferential attachment during the network generation process. The generated concepts networks has zero probability of finding a node with degree by construction, since the minimal block size sets a threshold for the node degree.
If PSP mechanism is considered in combination with varying block size (red discs in Fig. 7a), the node degree distribution of a generated network is closer to the node degree distribution of the empirical concepts network than that for a generated concepts network with the fixed block size. Since the minimal block may consist of a single concept, there is a non-zero probability of finding an isolated node in the generated network, which is not seen in Fig. 7a due to the logarithmic scale. Then has a tendency to increase with up to similarly to the degree distribution of the empirical concepts network. The further decay of the node degree distribution is slower than in the generated concepts network with the fixed block size, however it is faster than in the empirical concepts network. Even though PSP mechanism in combination with varying block size distribution does not allow to generate a concepts network that accurately reproduces node degree distribution of the empirical concepts network, it allows to generate a network with that shares similar properties with the empirical network: an increase of for small values and relative slow decay for large values.
4.4 Check of other network parameters
While node degree distribution is one of the basic parameters which describe the network, a number of other network characteristics have to be checked to get more information about its structure and the nature of data it reflects.
Assortativity mixing by degree. The tendency of nodes with high degree to be connected with poorly connected nodes for real network is reproduced only if PSP scenario of concepts selection is used for simulation, see Table 1. Although the absolute value of in this case is larger than the corresponding value for the empirical network, its sign is considered as a significant indicator supporting the generative mechanism implemented. Following the interpretations discussed before, the concepts of different levels of generality are naturally combined to indicate the general topical area and more specific context. Since any topical classification is usually characterized by hierarchical structure (i.e., more specific topics belong to more general topical areas), co-usage of more general concepts and more specific ones is considered as natural.
Transitivity and mean clustering coefficient. Let us remind the feature of the empirical concepts network which was not captured by the Erdős-Rényi and by the Barabási-Albert models. It is a difference between the mean clustering coefficient and the transitivity . Our simulations show that the generative model with a uniform concept selection mechanism is unable to reproduce this difference too. However, if the preferential selection of concepts is used, the average clustering coefficient of the generated network differs from its transitivity and is significantly higher than (see Table 1). Even though the model overestimates this difference, the considered scenario enables one to reproduce this feature qualitatively. This result highlights the importance of the preferential selection process in the proposed model.
5 Conclusions and Outlook
In the first part of this work, analysis of the network of scientific concepts built on real data is performed. A number of specific features such as high density, disassortativity, difference between transitivity and mean clustering coefficient together with a skewed node degree distribution were found. In the second part of this work, attempts to find an appropriate model to reproduce such combination of network features were made. It was shown that commonly used network models – the Erdős-Rényi graph and the Barabási-Albert model – fail to generate a network with the desired properties. Therefore, we have proposed a simple generative model. It is based on the general logic of scientific concepts usage: the concepts do not arrive in isolation, but a group of them has to be used to describe the content. Therefore, it is natural to model network growth as an arrival of sets of concepts with each new paper. In this case, a fully-connected group of nodes represents this set of concepts.
A particular feature of the empirical network of scientific concepts is the high value of links density. The value of found in our study means that any randomly chosen concept co-occurs on average with any other concept with the probability . In turn, this shows that scientific concepts are densely connected within the considered discipline. The proposed generative model reproduces and explains this network feature. Although the resulting network strictly speaking does not belong to the class of dense networks actively discussed in the literature [14, 6, 46, 12, 8, 11], the model suggested for its evolution may be useful in studying other networks with high density of links.
Growth of the concepts network happens not only by adding new nodes and attaching them to the existing ones in the graph, but also by the emergence of new links between the previously existing nodes. The latter case may correspond to the appearance of links between the established scientific fields and may refer to atypical combinations of scientific knowledge [42]. As we have shown, the two mechanisms have to be taken into account to get satisfactory results in modeling such phenomena: i) growth by blocks and ii) preferential selection of concepts. The proposed simple model allows one to generate a network with properties qualitatively similar to the properties of the empirical concepts network. Neither of these mechanisms on its own gives a satisfactory outcome: the observed structure of the network is reproduced due to their interplay.
The discussions around topics of scientific discovery, appearing of novelty, disruptive and developing character of research and many others are not new but they are still ongoing [29, 42, 36, 41]. However, there are no much possibilities to provide quantitative description of these processes. To our believe, the formalized network of scientific concepts allows one to highlight one of many aspects of knowledge development. Therefore, our case study of empirical data as well as the model suggested here enrich the toolkit for quantitative study of the process of scientific research.
Another possible continuation of our analysis may be achieved by application of the hypernetwork framework, when the notion of a relation between two objects is generalized to relations between many objects [26]. Such approach is effective in modeling processes when “bags of entities” arrive to join the existing network and is used to describe, e.g., the network of authors, citations or references joined by paper or journal, see [45, 24].
Acknowledgements
This work was supported in part by the National Academy of Sciences of Ukraine, project KPKBK 6541030 (O.M. & Yu.H) and by the National Research Foundation of Ukraine, project 2020.01/0338 (M.K.).
Appendix
In this appendix we give some examples of generic and non-generic concepts extracted by the ScienceWISE.info platform from several papers submitted to the e-print repository arXiv.org.999ScienceWISE.info web-page accessed July 26, 2021.
-
•
Albert-László Barabási, Réka Albert. Emergence of scaling in random networks. arXiv:cond-mat/9910332 [cond-mat.dis-nn] [3].
Generic concepts: Networks, Topology, Probability, Communication, Field, Generic property.
Non-generic concepts: Scale-free, Preferential attachment, Complex systems, Graph, Random graph, Neural network, Numerical simulation, Poisson distribution, Protein, Scale invariance.
-
•
V. Palchykov, M. Krasnytska, O. Mryglod, Yu. Holovatch. A mechanism for evolution of the physical concepts network. arXiv:2106.01022 [physics.soc-ph] [34].
Generic concepts: Networks, Picture, Probability, Precision, Simulations, Topology.
Non-generic concepts: Complex network, Graph, Barabasi-Albert model, Clustering coefficient, Ontology, Bipartite network, Degree distribution, Preferential attachment, Random graph, Standard deviation, Primary, Assortative mixing, Complex systems, Key phrase, Pearson’s correlation, Semantic network, Statistics.
-
•
M. Krasnytska, B. Berche, Yu. Holovatch, R. Kenna. Ising model with variable spin/agent strengths. arXiv:2004.05134 [cond-mat.stat-mech] [27].
Generic concepts: Spin, Networks, Free energy, Geometry, Temperature, Thermodynamic limit, Topology, Magnetic moment, Particles, Probability, Thermodynamics, Magnetic field, Symmetry.
Non-generic concepts: Ising model, Phase diagram, Statistical physics, Universality class, Many-body systems, Partition function, Graph, Scale-free, Quenching, Critical exponent, Degree distribution, Disorder, Exact solution, Phase transitions, Random graph, Scaling law, Adjacency matrix, Concurrence, Continuous Spin, Degree of freedom, Duality, Hamiltonian, Magnetization, Mean field, Mean-field approximation, Network model, Polydispersity, Potts model, Social network, Social systems, Spin glass, Spontaneous magnetization.
References
- [1] ScienceWISE.info (accessed June 20, 2020), http://sciencewise.info.
- [2] Barabási, A.-L., Network science book, Network Science 625 (2014).
- [3] Barabási, A.-L. and Albert, R., Emergence of scaling in random networks, Science 286 (1999) 509–512.
- [4] Beam, E., Appelbaum, L. G., Jack, J., Moody, J., and Huettel, S. A., Mapping the semantic structure of cognitive neuroscience, Journal of Cognitive Neuroscience 26 (2014) 1949–1965.
- [5] Bonifazi, P., Goldin, M., Picardo, M. A., Jorquera, I., Cattani, A., Bianconi, G., Represa, A., Ben-Ari, Y., and Cossart, R., Gabaergic hub neurons orchestrate synchrony in developing hippocampal networks, Science 326 (2009) 1419–1424.
- [6] Borgs, C., Chayes, J., Lovász, L., Sós, V., and Vesztergombi, K., Convergent sequences of dense graphs i: Subgraph frequencies, metric properties and testing, Advances in Mathematics 219 (2008) 1801–1851.
- [7] Brodiuk, S., Palchykov, V., and Holovatch, Y., Embedding technique and network analysis of scientific innovations emergence in an arxiv-based concept network, in 2020 IEEE Third International Conference on Data Stream Mining Processing (DSMP) (2020), pp. 366–371, doi:10.1109/DSMP47368.2020.9204220.
- [8] Caron, F. and Fox, E. B., Sparse graphs using exchangeable random measures, Journal of the Royal Statistical Society: Series B (Statistical Methodology) 79 (2017) 1295–1366.
- [9] Cattuto, C., Barrat, A., Baldassarri, A., Schehr, G., and Loreto, V., Collective dynamics of social annotation, Proceedings of the National Academy of Sciences 106 (2009) 10511–10515.
- [10] Constantin, A., Automatic structure and keyphrase analysis of scientific publications (The University of Manchester (United Kingdom), 2014).
- [11] Courtney, O. T. and Bianconi, G., Dense power-law networks and simplicial complexes, Phys. Rev. E 97 (2018) 052303.
- [12] Crane, H. and Dempsey, W., Edge exchangeable models for network data, arXiv:1603.04571 (2016).
- [13] da Fontoura Costa, L., Learning about knowledge: A complex network approach, Phys. Rev. E 74 (2006) 026103.
- [14] Diaconis, P. and Janson, S., Graph limits and exchangeable random graphs, arXiv:0712.2749 (2007).
- [15] Erdös, P. and Rényi, A., Erdös-rényi model, Publ. Math. Debrecen (1959) 290–297.
- [16] Evans, J. A. and Foster, J. G., Metaknowledge, Science 331 (2011) 721–725.
- [17] Fensel, D., Ontologies, in Ontologies (Springer Berlin Heidelberg, 2001), pp. 11–18.
- [18] Foster, J. G., Rzhetsky, A., and Evans, J. A., Tradition and innovation in scientists’ research strategies, American Sociological Review 80 (2015) 875–908.
- [19] Glänzel, W., Moed, H. F., Schmoch, U., and Thelwall, M. (eds.), Springer Handbook of Science and Technology Indicators (Springer International Publishing, 2019).
- [20] Hanel, R., Thurner, S., and Klimek, P., Introduction to the Theory of Complex Systems (Oxford University Press, 2018).
- [21] Herrera, M., Roberts, D. C., and Gulbahce, N., Mapping the evolution of scientific fields, PLoS ONE 5 (2010) e10355.
- [22] Holovatch, Y., Kenna, R., and Thurner, S., Complex systems: physics beyond physics, European Journal of Physics 38 (2017) 023002.
- [23] Horrocks, I., Ontologies and the semantic web, Communications of the ACM 51 (2008) 58–67.
- [24] Hu, F., Ma, L., Zhan, X.-X., Zhou, Y., Liu, C., Zhao, H., and Zhang, Z.-K., The aging effect in evolving scientific citation networks, Scientometrics (2021).
- [25] Iacopini, I., Milojević, S., and Latora, V., Network dynamics of innovation processes, Physical review letters 120 (2018) 048301.
- [26] Johnson, J., Hypernetworks in the science of complex systems, Vol. 3 (World Scientific, 2013).
- [27] Krasnytska, M., Berche, B., Holovatch, Y., and Kenna, R., Ising model with variable spin/agent strengths, Journal of Physics: Complexity 1 (2020) 035008.
- [28] Krenn, M. and Zeilinger, A., Predicting research trends with semantic and neural networks with an application in quantum physics, Proceedings of the National Academy of Sciences 117 (2020) 1910–1916.
- [29] Kuhn, T. S., The essential tension (The University of Chicago, 1977).
- [30] Luce, R. D. and Perry, A. D., A method of matrix analysis of group structure, Psychometrika 14 (1949) 95–116.
- [31] Newman, M. E., Assortative mixing in networks, Physical review letters 89 (2002) 208701.
- [32] Palchykov, V., Gemmetto, V., Boyarsky, A., and Garlaschelli, D., Ground truth? concept-based communities versus the external classification of physics manuscripts, EPJ Data Science 5 (2016) 28.
- [33] Palchykov, V. and Holovatch, Y., Bipartite graph analysis as an alternative to reveal clusterization in complex systems, in 2018 IEEE Second International Conference on Data Stream Mining Processing (DSMP) (2018), pp. 84–87, doi:10.1109/DSMP.2018.8478505.
- [34] Palchykov, V., Krasnytska, M., Mryglod, O., and Holovatch, Y., A mechanism for evolution of the physical concepts network, Condens. Matter Phys. 24 (2021) 1–6.
- [35] Pan, R. K., Sinha, S., Kaski, K., and Saramäki, J., The evolution of interdisciplinarity in physics research, Scientific Reports 2 (2012).
- [36] Rzhetsky, A., Foster, J. G., Foster, I. T., and Evans, J. A., Choosing experiments to accelerate collective discovery, Proceedings of the National Academy of Sciences 112 (2015) 14569–14574.
- [37] Seyed-allaei, H., Bianconi, G., and Marsili, M., Scale-free networks with an exponent less than two, Phys. Rev. E 73 (2006) 046113.
- [38] Silva, F. N., Travençolo, B. A. N., Viana, M. P., and da Fontoura Costa, L., Identifying the borders of mathematical knowledge, Journal of Physics A: Mathematical and Theoretical 43 (2010) 325202.
- [39] Sowa, J. F., Semantic networks, in Encyclopedia of Artificial Intelligence, second edition, ed. Shapiro, S. C. (Wiley, 1992), p. 25.
- [40] The network analysis package, igraph, https://igraph.org.
- [41] Thurner, S., Liu, W., Klimek, P., and Cheong, S. A., The role of mainstreamness and interdisciplinarity for the relevance of scientific papers, PLOS ONE 15 (2020) e0230325.
- [42] Uzzi, B., Mukherjee, S., Stringer, M., and Jones, B., Atypical combinations and scientific impact, Science 342 (2013) 468–472.
- [43] van Eck, N. J. and Waltman, L., Software survey: VOSviewer, a computer program for bibliometric mapping, Scientometrics 84 (2009) 523–538.
- [44] Wang, D. and Barabási, A.-L., The Science of Science (Cambridge University Press, 2021), p. 304.
- [45] Wang, J.-W., Rong, L.-L., Deng, Q.-H., and Zhang, J.-Y., Evolving hypernetwork model, The European Physical Journal B 77 (2010) 493–498.
- [46] Wolfe, P. J. and Olhede, S. C., Nonparametric graphon estimation, arXiv:1309.5936 (2013).
- [47] Zeng, A., Shen, Z., Zhou, J., Wu, J., Fan, Y., Wang, Y., and Stanley, H. E., The science of science: From the perspective of complex systems, Physics Reports 714-715 (2017) 1–73.
- [48] Zhou, T., Medo, M., Cimini, G., Zhang, Z.-K., and Zhang, Y.-C., Emergence of scale-free leadership structure in social recommender systems, PLOS ONE 6 (2011) 1–6.