Motility and self-organization of gliding Chlamydomonas populations
Abstract
Cellular appendages such as cilia and flagella represent universal tools enabling cells and microbes, among other essential functionalities, to propel themselves in diverse environments. In its planktonic, i.e. freely swimming, state the unicellular bi-flagellated microbe Chlamydomonas reinhardtii employs a periodic breaststroke-like flagellar beating to displace the surrounding fluid. Another flagella-mediated motility mode is observed for surface-associated Chlamydomonas cells, which glide along the surface by means of force transduction through an intraflagellar transport machinery. Experiments and statistical motility analysis demonstrate that this gliding motility enhances clustering and supports self-organization of Chlamydomonas populations. We employ Minkowski functionals to characterize the spatiotemporal organization of the surface-associated cell monolayer. We find that simulations based on a purely mechanistic approach cannot capture the observed non-random cell configurations. Quantitative agreement with experimental data however is achieved when considering a minimal cognitive model of the flagellar mechanosensing.
Motility is a key feature of microorganisms to respond to environmental cues and to actively search for favourable living conditions, nutrient sources and mating partners [1, 2, 3]. Microbial self-propulsion can be realized by means of shape deformations [4, 5], the formation of lamellipodia [6, 7] and the periodic actuation of single or multiple cilia or flagella [8, 9, 10]. Such cellular appendages represent universal building blocks of life that enable cells and microbes to sense and interact with their environment. The fast and coordinated actuation of the two flagella of Chlamydomonas reinhardtii [11, 12, 13, 14, 15, 16], which is capable of propelling the cell body in a liquid medium [17, 18], has received ample attention recently as a prime model system. Chlamydomonas dwells in complex geometric confinement [19] and exhibits light-regulated and flagella-mediated adhesion to surfaces, i.e. the cells may transition from the free-swimming state to a surface-associated state [20, 21]. Even in the latter state, the cells are not static: an intraflagellar transport (IFT) machinery [22] translocates the cell body along the flagella [23], a process termed gliding motility [24, 25]. However, the purpose of this gliding motility to date ‘still remains a mystery’ [19].
In this Letter, we demonstrate that gliding motility enables surface-associated Chlamydomonas cells to cluster and form compact, interconnected microbial communities. We analyze the statistics of cell trajectories and characterize the spatiotemporal evolution of the cell positions within the population using two-dimensional Minkowski functionals. Simulations successfully capture the non-random cell positions for different cell densities from very dilute systems of merely isolated cells to densely-packed monolayers. These simulations go well beyond a purely mechanistic approach, which we show fails at capturing the experimental data, and include cognitive forces to recover the spatiotemporal dynamics of the cell population.
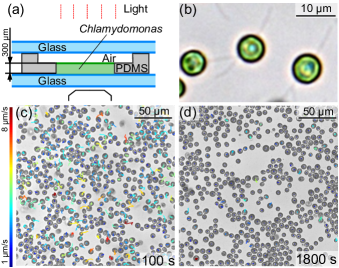
– Experiments Experiments are performed using suspensions of motile cells confined in a liquid film that is supported by a glass surface, on which the cells may adhere upon a switch from red to blue light [20], see Fig. 1(a). We use the wild-type Chlamydomonas reinhardtii strain SAG11-32b, which we cultivate axenically in Tris-Acetate-Phosphate (TAP) medium on a 12h/12h day/night cycle following established recipes [20]. The surface-adhered cells are observed using bright-field video microscopy in inverted configuration (Olympus IX-83) while being illuminated from the top using narrow bandpass filters for red (nm) light before adsorption and blue light (nm) to induce surface adhesion. After the surface association process, most cells have achieved the gliding configuration with both flagella in a widespread 180∘ configuration, see Fig. 1(b). Time-resolved cell positions are recorded using a monochromatic camera (FLIR Systems, GS3-U3-41C6M-C, 2048x2048 pixels) at 5 frames per second and analyzed using digital image processing following established cell tracking protocols 111Cell tracking code is available at https://doi.org/10.5281/zenodo.4449791.. We find that the population exhibits a relatively high activity during which cells adsorb to the glass substrate and eventually a plateau cell density is achieved, see Fig. 1(c). Using the displacement of the cells, we observe that this overall activity decays over time and the cells reach quasi-static positions, which differ from their initial adsorption sites and show distinct signatures of clustering and compactification, see Fig. 1(d). We now dissect the link between cell motility and clustering by a) characterizing the motility signatures on the single-cell as well as on the population level and b) analyzing the cell positions from a morphological perspective.
– Motility Analysis The biological process of gliding motility is based on a set of glycoproteins that mediate the adhesion between the surface and the flagella membrane [24, 23]. However, these adhesion sites are attached to IFT trains and can be translocated through molecular motors towards the cell body, effectively pulling the cell body towards adhesion sites [23]. Since these forces are applied on both flagella, the cell can experience a stochastic force in either direction. In addition, occasional elevation of Ca+2 on one of the flagellum, transiently reverses the direction of the IFT trains causing the cell to move rapidly away from the activated flagellum [27, 28].
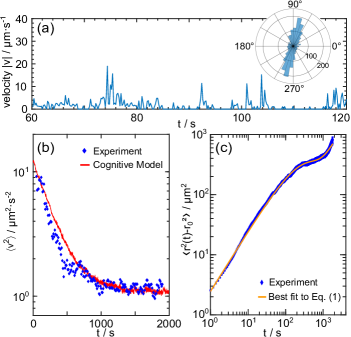
We start with single-cell tracking, and extract position, velocity and directionality of the cell’s motion. We find that the cell velocity exhibits distinct bursts of activity followed by pause periods, see Fig. 2(a), which is likely reminiscent to the tug-of-war of active IFT trains on both flagella [23]; in the following we refer to these bursts of activity as ‘intermittency’. As a result of the specific gliding configuration of the two flagella, the directionality of the motion is predominantly, but not exclusively, constrained to the initial angle of flagella orientation with respect to the lab frame, see inset of Fig. 2(a). On occasion, one flagellum might also transiently detach, which may result in reorientation events [23]. In order to characterize the spatiotemporal evolution and statistics of cell trajectories, we employ population-averaged quantitative measures. The mean-squared velocity (MSV) is found to decrease exponentially, exhibiting a cell density-independent decay time of about 39050 s with a maximum and minimum squared velocity of about µm2 s-2 and µm2 s-2, with the latter matching the speed of a single dynein motor [29], see Fig. 2(b). In addition, we quantify the orientation of the cells using the orientation auto-correlation function (OACF), , where is the orientation of the flagella 222See Supplemental Material at [URL] for details of the theoretical models, simulation parameters and additional experimental data.. We find that the orientation decorrelates on characteristic time scales of tens of seconds, which is a result of transient flagella de- and reattachment events and reorientation during gliding [23]. Specifically, the OACF decays with a characteristic time , which is measured as OACF, and is related to the orientational diffusion constant (see Fig. S1 in 22footnotemark: 2). By calculating at different times of the experiment, we find that progressively increases, indicating that the cells rotate less over time. By considering the loss of activity from the MSV and describing the single-cell motility as predominantly diffusive, a superposition of both mechanisms provides an analytical description of the time-dependent mean-squared displacement (MSD) as
| (1) |
where and are constants describing the activity of the system, the decay time, and the reversal time. We find that Eq. (1) describes the observed MSD, shown in Fig. 2(c), with fitting parameters µm2 s-2, s, while is set as a fixed parameter obtained from the MSV.
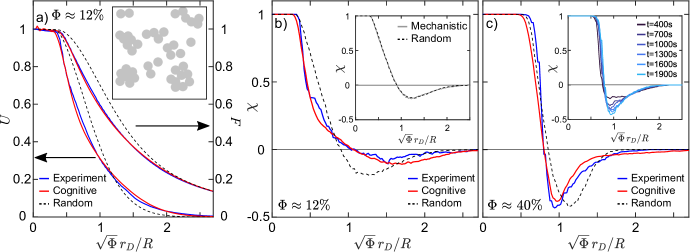
– Morphological Analysis We find that the two-point correlation function, which describe positional correlations between objects, is insensitive to our experimental observations (see Fig. S2 in 22footnotemark: 2). Hence, we turn towards an alternative morphological analysis of the spatiotemporal evolution of cell positions. For different surface packing fractions, , we calculate the two-dimensional (2D) Minkowski functionals, i.e. area, boundary length and Euler number [31]. Minkowski functionals are elegant tools from integral geometry (persistent homology) to dissect morphological information regarding the evolution of object positions in space and time and have been successfully applied to a plethora of systems, from nucleated holes in a liquid film [32], colloidal suspensions [33], and soil structure [34] to galaxies in the universe [35]. Detected cell centers are used as nuclei for inflating 2D discs with radius , see inset of Fig. 3(a). At different values of , the area, boundary length, and Euler number are calculated. The latter is defined as the difference between the number of connected regions and holes in a binary 2D image. The normalized area , boundary length , and Euler number (normalized with , , and , respectively, where is the total number of cells) is shown in Fig. 3(a,b) in case of an experimental cell packing fraction of about 12%. Upon inflating the discs the spatial connectivity of the 2D pattern typically changes from isolated discs to connected areas, such that the Euler value may become negative [36]. Normalization of using the square-root of the packing fraction, , and the cell radius allows us to compare different cell densities. We find that for small packing fractions, , , and show a distinctive different behavior compared to a random distribution (see Fig. S3 in 22footnotemark: 2). However, this is not the case for large (see Fig. S4 in 22footnotemark: 2), where only is robust to morphological changes, thus using it as our main tool for comparison.
This procedure is applied to the momentary cell positions at any time, for which representative curves are shown as solid blue lines in Fig. 3(b,c) for packing fractions of 12% and 40%, respectively. At all times, the experimentally obtained cell positions are at variance with a distribution of randomly placed particles of the same density (dashed lines). Notably, we find that for low cell densities (e.g. Fig. 3(b)) the Euler number does not exhibit a time dependence: sharply decreases when exceeds the cell radius and exhibits a minimum that is less pronounced and at a larger radius as compared to the random distributed particles. While the Euler parameter does not change over time for cell densities up to , we see a time dependency for filling fractions of and higher, see inset of Fig. 3(c): the minimum of becomes successively more pronounced as time proceeds. In general, as increases, the cell positions overlap producing connected regions that reduce . The disc radius corresponding to the minimum in indicates the typical intercellular distance. A faster decrease of compared to a random distribution means that there are significantly more cells with a distance where this sudden decrease occurs, and is therefore indicative of the existence of clusters. For , the behavior of indicates local clusters, since the initial drop of is due to the mean intercellular distance within the cluster, while the secondary decrease to the shallow minimum is due to the mean intercluster distance, see Fig. 3(b). However for , there is a fully interconnected network, since the sudden decrease and the minimum of occur at the same , see Fig. 3(c). The Euler number for a range of filling fractions is shown in Fig. S5 in 22footnotemark: 2.
– Simulations To model the dynamics of the system several considerations have to be made. Figure 2(a) shows that the movement of the cells is essentially confined to the direction of the flagella , which changes over time according to some weak rotational diffusion. Furthermore, from the change in MSV we can discern that the average kinetic energy of the system decreases exponentially over time. To capture these dynamics we propose the equation of motion based on a purely mechanistic model
| (2) |
where is the position of cell , its velocity; represents viscous damping of the liquid medium, the force generated by the flagella modulated by a coefficient , which decreases exponentially over time, and if , otherwise, the purely repulsive harmonic interactions among cells , at positions , , respectively, , . The coefficients and were chosen so that the average kinetic energy is the same as in the experiments. The magnitude of the force on each flagellum, , is independently drawn from an exponential distribution, and their direction is parallel or antiparallel to the flagellar orientation; thus the total flagellar tug reads . We integrate Newton’s equations for a polydisperse population of cells 22footnotemark: 2 where each cell is subject to the force in Eq. (2) using standard methods [37]. As shown in the inset of Fig. 3(b), this approach cannot capture the final cell configuration, see inset of Fig. 3(b).
In order to capture the experimental data, we extend our simulation approach towards implementing a mechanosensing mechanism [38, 27], which we term cognitive cell-cell interactions. Extending a recent approach [39, 40, 41], we define a cognitive force associated to the cell’s mechanosensing and exploration of its surrounding
| (3) |
The computation of relies on the calculation of a Boltzmann–Shannon entropy measuring the information content of the surrounding environment, specifically, the location of the neighboring cells. This information is sampled statistically with sampling Brownian trajectories emanating from the current cell position and interacting (only via ) with the other cells. The sampling trajectories collectively form the ‘cognitive map’ of each cell, whose average size is equal to µm, which corresponds to the average length of the flagella. For details, see 22footnotemark: 2. The force in a given direction is weighted by the space available to the sampling trajectories starting in the same direction . As the Chlamydomonas cells exhibit clustering dynamics, we propose that has to minimise the available space around the cells. The radius of gyration is a natural choice, and we arrive at , where is the square radius of gyration associated to the trajectory and the maximum square radius of gyration for all trajectories. Finally, the cognitive force is projected onto the direction of the flagella , , which replaces in Eq. (2). The equation of motion for each cell in the cognitive model reads as
| (4) |
Following the observed intermittency of the cells (see Fig. 2), we apply the cognitive force intermittently. At each time step we draw a uniformly distributed random number such that if , and otherwise.
Newton’s equations with the force in Eq. (4) for all cells at any timestep are integrated using standard molecular dynamics methods [37]. We find that the cognitive model can reproduce both the MSV (Fig. 2(b)) and the morphological features as measured by the three Minkowski functional (Fig. 3), which was confirmed with a residual analysis (see Fig. S6 in 22footnotemark: 2).
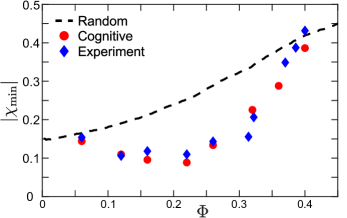
– Discussion Overall, we use the depth of the minimum of the Euler number, , for quantitative comparison of experimental data, randomly distributed objects and theoretical modelling, which is displayed in Fig. 4. For less dense populations, in experiments is found to be smaller than for randomly distributed particles (with and without mechanistic activity). At a packing fraction , we see a steep increase of the minimum, which eventually crosses the random model prediction. This significant change in is accompanied by mesoscopic changes of the cell distribution, where the local cell clusters become interconnected for packing fractions 34% (see Fig. S7 in 22footnotemark: 2).
We can describe this change in global connectivity using percolation theory. Spherical 2D particles typically form triangular lattices, which has a site percolation threshold of 0.5 [42]. Using the random close packing of 2D spheres [43], we estimate the percolation threshold for our system to be . The difference with the observed threshold can be attributed to the tendency of the cells to cluster and the fact that our system does not form exact triangular lattices. This percolation threshold is quantitatively captured by our model that incorporates cognitive forces (see Fig. S8 in 22footnotemark: 2).
The need to include cognitive forces in the model to reproduce the clustering observed in the experiments indicates that there is an active mechanism that drives the cells together. As aforementioned, a rapid cell motion is attributed to an elevated Ca2+ signal in a flagellum. However, it has been shown that a Ca2+ signal can be induced by exerting a mechanical stress on the flagellum [27]. A flagellum that has less available area around it, due to the presence of other cells, will have fewer adhesion sites with the substrate and thus experience smaller mechanical stresses. However, a flagellum away from clusters will have a larger available area and thus more adhesion sites, leading to a higher mechanical stress exerted on the flagellum. As a result, it will experience more frequent elevations of Ca2+ signals causing it to move statistically away from diluted regions, thus promoting cluster formation. Our cognitive force offers an economic model of the sensory processes underpinned by the Ca2+-dynamics in the flagella, by identifying the size of the cognitive map with the flagellar size.
– Conclusion In conclusion, we employed the Euler number, one of the three Minkowski functionals for 2D systems, to dissect the role of gliding motility with regard to the self-organization and clustering of surface-associated Chlamydomonas cells. A cognitive-force model representing the flagellar exploration of available space and its mechanosensory response can, in contrast to classical mechanistic approaches, reproduce the non-random cell positions obtained in the experiments.
We find that the gliding motility is a key mechanism for the formation of a compact monolayer of Chlamydomonas cells on a surface, which represents a favourable configuration for these photoactive microorganisms to perform photosynthesis. Swimming motility assisted by phototaxis is essential for Chlamydomonas in their natural habitats to map their environment for light sources. Once the cells have found optimal light conditions for photosynthesis, their gliding motility mode enables the population to form compact surface-bound monolayers for highly efficient light harvesting.
The authors thank the Göttingen Algae Culture Collection (SAG) for providing the Chlamydomonas reinhardtii wild-type strain SAG 11-32b. We acknowledge S. Klumpp, S. Herminghaus and M. Lorenz for fruitful discussions.
References
- Berg and Brown [1972] H. C. Berg and D. A. Brown, Chemotaxis in Escherichia coli analysed by three-dimensional tracking, Nature 239, 500 (1972).
- Miller and Bassler [2001] M. B. Miller and B. L. Bassler, Quorum sensing in bacteria, Annu. Rev. Microbiol. 55, 165 (2001).
- Lauga and Powers [2009] E. Lauga and T. R. Powers, The hydrodynamics of swimming microorganisms, Rep. Prog. Phys. 72, 096601 (2009).
- Schulman et al. [2014] R. D. Schulman, M. Backholm, W. S. Ryu, and K. Dalnoki-Veress, Dynamic force patterns of an undulatory microswimmer, Phys. Rev. E 89, 050701 (2014).
- Noselli et al. [2019] G. Noselli, A. Beran, M. Arroyo, and A. DeSimone, Swimming euglena respond to confinement with a behavioural change enabling effective crawling, Nat. Phys. 15, 496–502 (2019).
- Mitchinson and Cramer [1996] T. Mitchinson and L. Cramer, Actin-based cell motility and cell locomotion, Cell 84, 371 (1996).
- Batchelder et al. [2011] E. L. Batchelder, G. Hollopeter, C. Campillo, X. Mezanges, E. M. Jorgensen, P. Nassoy, P. Sens, and J. Plastino, Membrane tension regulates motility by controlling lamellipodium organization, Proc. Natl. Acad. Sci. USA 108, 11429 (2011).
- Rossi et al. [2017] M. Rossi, G. Cicconofri, A. Beran, G. Noselli, and A. DeSimone, Kinematics of flagellar swimming in Euglena gracilis: Helical trajectories and flagellar shapes, Proc. Natl. Acad. Sci. USA 114, 13085 (2017).
- Wan and Goldstein [2018] K. Y. Wan and R. E. Goldstein, Time irreversibility and criticality in the motility of a flagellate microorganism, Phys. Rev. Lett. 121, 058103 (2018).
- Tsang et al. [2018] A. C. H. Tsang, A. T. Lam, and I. H. Riedel-Kruse, Polygonal motion and adaptable phototaxis via flagellar beat switching in the microswimmer euglena gracilis, Nat. Phys. 14, 1216–1222 (2018).
- Rüffer and Nultsch [1985] U. Rüffer and W. Nultsch, High-speed cinematographic analysis of the movement of chlamydomonas, Cell Motil. 5, 251 (1985).
- Drescher et al. [2010] K. Drescher, R. E. Goldstein, N. Michel, M. Polin, and I. Tuval, Direct measurement of the flow field around swimming microorganisms, Phys. Rev. Lett. 105, 168101 (2010).
- Friedrich and Jülicher [2012] B. M. Friedrich and F. Jülicher, Flagellar synchronization independent of hydrodynamic interactions, Phys. Rev. Lett. 109, 138102 (2012).
- Geyer et al. [2013] V. F. Geyer, F. Jülicher, J. Howard, and B. M. Friedrich, Cell-body rocking is a dominant mechanism for flagellar synchronization in a swimming alga, Proc. Natl. Acad. Sci. USA 110, 18058 (2013).
- Wan and Goldstein [2016] K. Y. Wan and R. E. Goldstein, Coordinated beating of algal flagella is mediated by basal coupling, Proc. Natl. Acad. Sci. USA 113, E2784 (2016).
- Böddeker et al. [2020] T. J. Böddeker, S. Karpitschka, C. T. Kreis, Q. Magdelaine, and O. Bäumchen, Dynamic force measurements on swimming Chlamydomonas cells using micropipette force sensors, J. R. Soc. Interface 17, 20190580 (2020).
- Polin et al. [2009] M. Polin, I. Tuval, K. Drescher, J. P. Gollub, and R. E. Goldstein, Chlamydomonas swims with two “gears” in a eukaryotic version of run-and-tumble locomotion, Science 325, 487 (2009).
- Ostapenko et al. [2018] T. Ostapenko, F. J. Schwarzendahl, T. J. Böddeker, C. T. Kreis, J. Cammann, M. G. Mazza, and O. Bäumchen, Curvature-guided motility of microalgae in geometric confinement, Phys. Rev. Lett. 120, 068002 (2018).
- Harris et al. [2009] E. H. Harris, D. B. Stern, and G. B. Witman, The Chlamydomonas Sourcebook, Vol. 1 (Elsevier, San Diego, CA, 2009).
- Kreis et al. [2018] C. T. Kreis, M. Le Blay, C. Linne, M. M. Makowski, and O. Bäumchen, Adhesion of chlamydomonas microalgae to surfaces is switchable by light, Nat. Phys. 14, 45 (2018).
- Kreis et al. [2019] C. T. Kreis, A. Grangier, and O. Bäumchen, In vivo adhesion force measurements of Chlamydomonas on model substrates, Soft Matter 15, 3027 (2019).
- Stepanek and Pigino [2016] L. Stepanek and G. Pigino, Microtubule doublets are double-track railways for intraflagellar transport trains, Science 352, 721 (2016).
- Shih et al. [2013] S. M. Shih, B. D. Engel, F. Kocabas, T. Bilyard, A. Gennerich, W. F. Marshall, and A. Yildiz, Intraflagellar transport drives flagellar surface motility, eLife 2, e00744 (2013).
- Bloodgood [1981] R. Bloodgood, Flagella-dependent gliding motility in chlamydomonas, Protoplasma 106, 183–192 (1981).
- Xu et al. [2020] N. Xu, A. Oltmanns, L. Zhao, A. Girot, M. Karimi, L. Hoepfner, S. Kelterborn, M. Scholz, J. Beißel, P. Hegemann, O. Bäumchen, L.-N. Liu, K. Huang, and M. Hippler, Altered N-glycan composition impacts flagella-mediated adhesion in Chlamydomonas reinhardtii, eLife 9, e58805 (2020).
- Note [1] Cell tracking code is available at https://doi.org/10.5281/zenodo.4449791.
- Collingridge et al. [2013] P. Collingridge, C. Brownlee, and G. L. Wheeler, Compartmentalized calcium signaling in cilia regulates intraflagellar transport, Curr. Biol. 23, 2311 (2013).
- Fort et al. [2021] C. Fort, P. Collingridge, C. Brownlee, and G. Wheeler, Ca2+ elevations disrupt interactions between intraflagellar transport and the flagella membrane in chlamydomonas, J. Cell Sci. 134, jcs253492 (2021).
- Kural et al. [2005] C. Kural, H. Kim, S. Syed, G. Goshima, V. I. Gelfand, and P. R. Selvin, Kinesin and dynein move a peroxisome in vivo: a tug-of-war or coordinated movement?, Science 308, 1469 (2005).
- Note [2] See Supplemental Material at [URL] for details of the theoretical models, simulation parameters and additional experimental data.
- Mecke [2000] K. R. Mecke, Additivity, convexity, and beyond: Applications of minkowski functionals in statistical physics, in Statistical Physics and Spatial Statistics, edited by K. R. Mecke and D. Stoyan (Springer Berlin Heidelberg, Berlin, Heidelberg, 2000) pp. 111–184.
- Herminghaus et al. [1998] S. Herminghaus, K. Jacobs, K. Mecke, J. Bischof, A. Fery, M. Ibn-Elhaj, and S. Schlagowski, Spinodal dewetting in liquid crystal and liquid metal films, Science 282, 916 (1998).
- Hoffmann et al. [2006] N. Hoffmann, F. Ebert, C. N. Likos, H. Löwen, and G. Maret, Partial clustering in binary two-dimensional colloidal suspensions, Phys. Rev. Lett. 97, 078301 (2006).
- Vogel et al. [2010] H.-J. Vogel, U. Weller, and S. Schlüter, Quantification of soil structure based on minkowski functions, Comput. Geosci. 36, 1236 (2010).
- Mecke et al. [1994] K. R. Mecke, T. Buchert, and H. Wagner, Robust morphological measures for large scale structure in the universe, Astron. Astrophys. 288, 697 (1994).
- Mantz et al. [2008] H. Mantz, K. Jacobs, and K. Mecke, Utilizing Minkowski functionals for image analysis: a marching square algorithm, J. Stat. Mech.: Theory Exp. 2008 (12), P12015.
- Allen and Tildesley [2017] M. P. Allen and D. J. Tildesley, Computer simulation of liquids (Oxford university press, 2017).
- Fujiu et al. [2011] K. Fujiu, Y. Nakayama, H. Iida, M. Sokabe, and K. Yoshimura, Mechanoreception in motile flagella of Chlamydomonas, Nat. Cell Biol. 13, 630 (2011).
- Hornischer et al. [2019] H. Hornischer, S. Herminghaus, and M. G. Mazza, Structural transition in the collective behavior of cognitive agents, Sci. Rep. 9, 1 (2019).
- Hornischer et al. [2022] H. Hornischer, P. J. Pritz, J. Pritz, M. G. Mazza, and M. Boos, Modeling of human group coordination, Phys. Rev. Res. 4, 023037 (2022).
- Wissner-Gross and Freer [2013] A. D. Wissner-Gross and C. E. Freer, Causal entropic forces, Phys. Rev. Lett. 110, 168702 (2013).
- van der Marck [1997] S. C. van der Marck, Percolation thresholds and universal formulas, Phys. Rev. E 55, 1514 (1997).
- Meyer et al. [2010] S. Meyer, C. Song, Y. Jin, K. Wang, and H. A. Makse, Jamming in two-dimensional packings, Physica A 389, 5137 (2010).