- GSD
- ground sample distance
- UAV
- unmanned aerial vehicle
- SGD
- stochastic gradient descent
- GPS
- global positioning system
- CNN
- convolutional neural network
- HarDNet
- harmonic densely connected network
- DDRNet
- deep dual-resolution networks
- BiSeNet
- bilateral segmentation network
- DNN
- deep neural network
- FOV
- field of view
- DCNN
- deep convolutional neural network
Safe Vessel Navigation Visually Aided by Autonomous Unmanned Aerial Vehicles in Congested Harbors and Waterways
Abstract
In the maritime sector, safe vessel navigation is of great importance, particularly in congested harbors and waterways. The focus of this work is to estimate the distance between an object of interest and potential obstacles using a companion UAV. The proposed approach fuses global positioning system (GPS) data with long-range aerial images. First, we employ semantic segmentation deep neural networks for discriminating the vessel of interest, water, and potential solid objects using raw image data. The network is trained with both real and images generated and automatically labeled from a realistic AirSim simulation environment. Then, the distances between the extracted vessel and non-water obstacle blobs are computed using a novel ground sample distance (GSD) estimation algorithm. To the best of our knowledge, this work is the first attempt to detect and estimate distances to unknown objects from long-range visual data captured with conventional RGB cameras and auxiliary absolute positioning systems (e.g. GPS). The simulation results illustrate the accuracy and efficacy of the proposed method for visually aided navigation of vessels assisted by unmanned aerial vehicles.
I Introduction
In the maritime sector, request for accurate and safe vessel navigation induces a need for reliable operation due to high risks of accidents when maneuvering in highly dynamic environments. In this study, an unmanned aerial vehicle (UAV)-assisted vessel navigation framework is proposed. The focus of this work is to estimate the distance between an object of interest (i.e. a vessel) and potential obstacles (i.e., shipyard objects), using a companion UAV.
There are several successful robotics and autonomous driving methods in which relative locations and distances are accurately determined for successful and safe interaction with the surrounding environment. However, to the best of our knowledge, the literature lacks methods to determine relative distances between an object of interest and unknown objects in the environment.
In this study, we propose a long-range aerial obstacle detection methodology for vessel guidance. Our solution combines absolute positioning measurements given by GPS and magnetometer devices, located on the vessel and a companion UAV, with visual information provided by a consumer-grade RGB camera mounted on the bottom of the UAV. The contributions of this study are the followings:
-
•
First, we employ the state-of-the-art convolutional neural network (CNN)-based semantic segmentation methods for real-time extraction of complex appearance and highly-variable vessel, water, and potential non-water obstacle silhouettes in pixel coordinates. We create a large annotated dataset using a realistic AirSim environment for training and testing the semantic segmentation performance on shipyard structures.
-
•
Second, we propose a method using absolute positioning data provided by GPS and magnetometers located on the vessel and UAV to accurately determine where the object of interest (i.e. a vessel) is located from 3D world coordinates to the image plane. A GSD strategy is employed to determine relative distances between objects on the ground.
-
•
Finally, we thoroughly assess our methods with a set of experiments in a realistic simulation scenario and with real data. The experiments demonstrate that our real-time approach is accurate and suitable for range estimation from aerial images and absolute positioning data provided by GPS and magnetometer.
The rest of this article is organised as follows: in Section II we overview the state-of-the-art on image-based semantic segmentation, localization and range estimation. In Section III-A we describe the proposed solution for computing distance from aerial images acquired from long distance systems (e.g. flying drone). Lastly we wrap-up with results in Section IV, while drawing ideas for future work in Section IV-C.
II Related Work
II-A Image Semantic Segmentation
Semantic segmentation deals with the problem of associating image pixel values to object classes and has become an important topic in the last few years in various domains. Particularly in biomedical and robotics applications, with impressive achievements in autonomous car driving applications. In this section, we overview different neural network-based methods, which are the top performers in visual semantic segmentation tasks, including the large-scale Cityscapes dataset and bench-marking suite for visual semantic scene understanding [1].
The bilateral segmentation network (BiSeNet) [2] comprises two different paths: the spatial path, which encodes low-level high detailed information, and the context path, which mainly encodes high-level context information. A feature fusion module is used to fuse features from these two paths. First, these are concatenated, and then batch normalization is used to balance the scale of the features. Finally, the concatenated features are pooled and re-weighted using a weight vector.
The harmonic densely connected network (HarDNet) [3] is a sparse, highly efficient, low memory traffic CNN, based on the sparse densely connected networks (DenseNets) [4]. Unlike traditional CNNs with -layers that have connections, in HarDNet a layer creates a connection to layer if divides , where is a non-negative integer and . Utilizing this connection method, once layer is processed, each layer from 1 to can be flushed from memory. They significantly reduce the number of parameters, alleviate the vanishing-gradient problem, and improve feature reuse along layers. Hong et al. [3] propose removing layers with very low Model of Computation (MoC), reducing DRAM traffic by when compared with DenseNets [4].
The authors of [5] propose a deep dual-resolution networks (DDRNet) for real-time semantic segmentation of road scenes. The main novelty is a contextual information extractor named Deep Aggregation Pyramid Pooling Module (DAPPM) that simultaneously enlarges receptive fields and fuses multi-scale context. When compared to the former, DDRNet promotes more information sharing across layers and the generation of higher-resolution feature maps with sufficiently large receptive fields.
II-B Range Measurement Techniques
Different techniques exist in the literature for extracting the location between objects in the environment, using a variety of sensors. On one hand, methods based on sensors that capture the internal dynamics of the system, such as accelerometers, magnetometers, GPS, encoders, are often referred to as being proprioceptive-based methods. On the other hand, methods based on contactless sensors, in particular Lidar, RGB-D, Radar, or a combination of the former, are often called exteroceptive-based methods. Proprioceptive sensors are typically suitable for self-localization and motion estimation, whereas the latter are more indicated for the perception of the surrounding environment, e.g. determining relative distances to external objects in the environment.
In the work of [10], the authors present an approach for estimating the distance between self-driving cars and other vehicles and objects along its path, using high precision exteroceptive lidar and RGB data [11]. In [12], the authors use a 2D laser scanner to assess the evenness of walls in a service robot application. In [13] the authors provide a thorough overview of sensor fusion methods, both for proprioceptive and exteroceptive data that were successfully employed in autonomous driving applications.
Vision-based approaches typically rely on a combination of RGB and depth information; however, depth sensors become less accurate as the distance grows, being unsuitable for long-range distance estimation when object or landmark locations are unknown. This is typically the case when one needs to detect or measure distances of objects on the ground [14],[15], using aerial images captured from UAV or satellites. GSD techniques [16] are often employed to tackle this problem by determining the size of each on the ground in metric units.
III Methodologies
In this work, we combine proprioceptive data given by GPS, and magnetometer sensors located on the target vessel and companion drone, with exteroceptive visual data provided from a downward-facing camera located on the drone, to compute absolute distances between the vessel surface and obstacles in the environment.
III-A Problem Definition
The problem tackled in this work is: given an aerial RGB image and the global pose of the UAV and the object of interest (i.e., vessel), estimate the distance between the vessel and the surrounding obstacles, to be used as an auxiliary guidance mechanism for safe navigation in harbor scenarios.
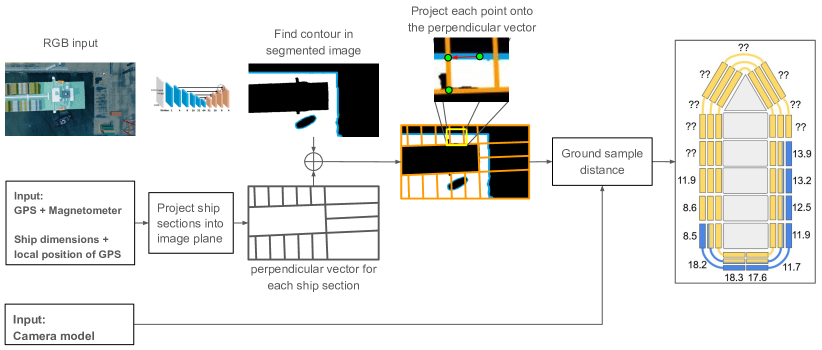
The proposed method (Fig. 3) first relies on a semantic segmentation approach for extracting locations of objects and vessels in the environment that receives RGB images as input. The network first performs multi-class segmentation (i.e. water, ship, dock object). Then it binarizes the image to distinguish between solid objects (i.e. ships and dock objects) and water in order to extract contours that enclose solid structures in the shipyard environment. Finally, the proposed method computes the distance between lines belonging to the vessel of interest (distinguished from other vessels using an onboard GPS) and every other object in the environment (i.e. other vessels and dock objects).
III-B System Overview
The adopted environment structure representation, i.e. 3D map, is a discrete projection of the world structure in the world reference frame . In order to be able to perform absolute distance measuring, the proposed system is equipped with two sensing modalities:
- •
-
•
exteroceptive - visual recognition abilities and relative distances between objects in the environment provided by a monocular camera installed on the UAV.
At each time instant, the proprioceptive modalities report the UAV and vessel state. More specifically, the global positions and headings of the UAV and vessel, , respectively, in the world inertial reference frame . The transformation from the vessel () to camera pixel coordinates () can be recovered applying the following camera projective model
| (1) |
where represents the camera intrinsic parameter matrix and the transformations between frames. For the sake of simplicity, we assume the transformation between the camera () and the UAV base () is fixed, and the other transformations determined from the noise-free proprioceptive modalities. In other words, we consider that the positioning measurement errors are negligible, and therefore the transformations between the various reference frames involved in our system (see Fig. 2) can be deterministic determined.
At each time instant, the sensing system computes the distance between the vessel and the closest obstacle found, given the list of distance estimates defined in the camera optical reference frame , estimated from RGB images, and noisy proprioception data. The observation model described in Section III-C explains how distance measurements are generated from the environment given GPS and visual RGB data only.
III-C Observation Model
The proposed method relies on GPS and magnetometer to simultaneously estimate the position and attitude of the UAV and the vessel of interest. To distinguish between solid obstacles and safe navigation areas (i.e. water), we begin by first employing a semantic segmentation algorithm that masks out image regions belonging to water. The remaining regions not belonging to the vessel of interest are considered potential objects used for computing distances.
III-C1 Image-based Semantic Segmentation
In order to detect shipyard obstacles and vessel structures, we rely on image data provided by the pointing bottom camera located on the bottom of the UAV, and data-driven semantic segmentation methods based on DNN, that provide pixel-level class probability distributions regarding the likelihood of each class, pertaining in RGB images. These DNN are optimized with large annotated image data-sets, acquired using realistic physics and rendering engines. We have tested three different networks [2, 3, 5], which are the top performers in semantic segmentation tasks, in the large-scale Cityscapes data-set and bench-marking suite for visual semantic understanding [1].
Dataset Acquisition
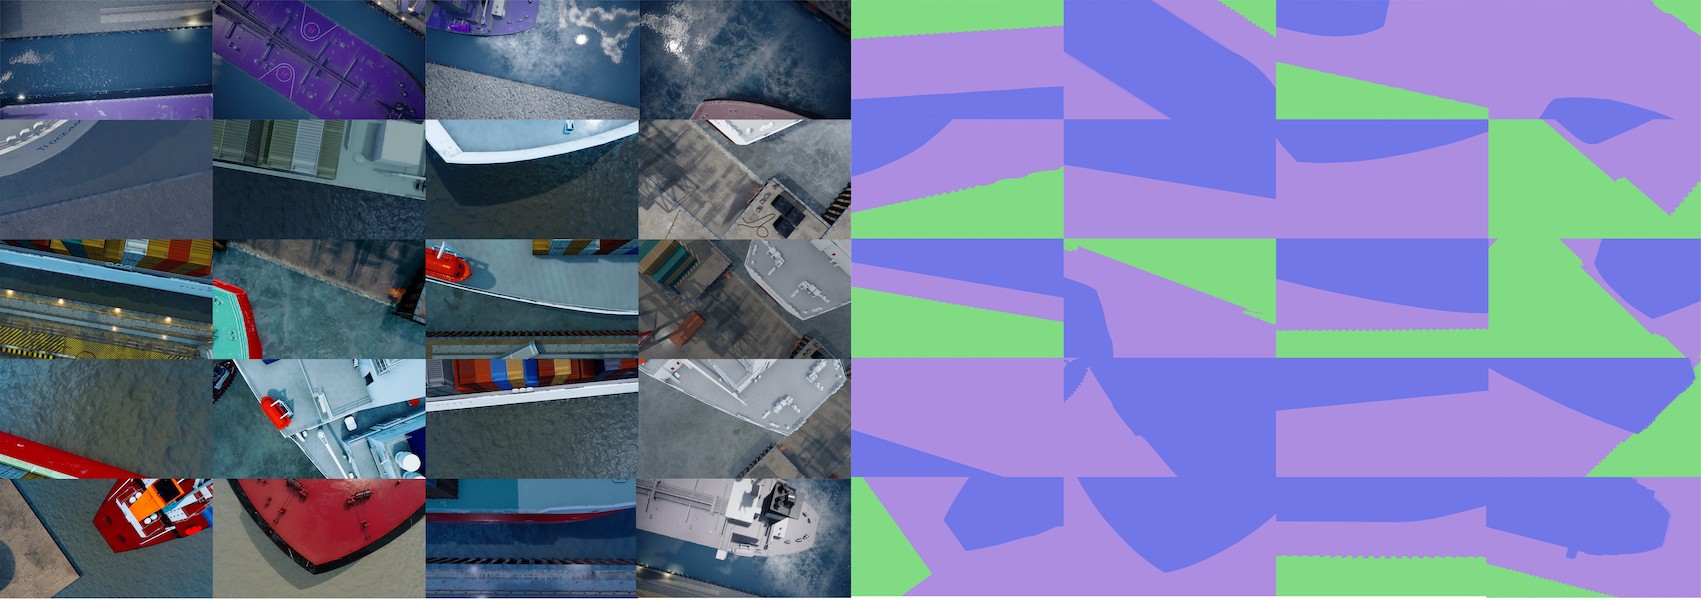
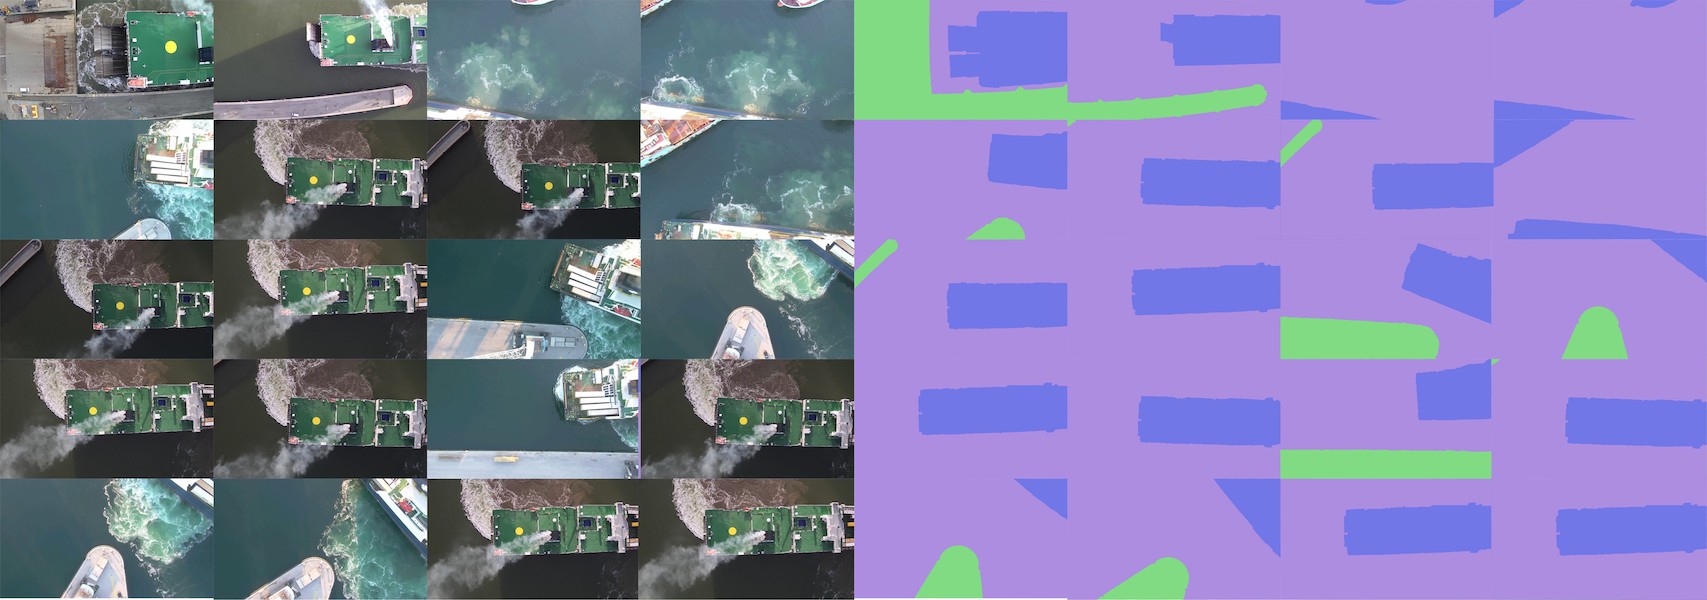
The dataset used for training our semantic segmentation networks is generated using a combination of Unreal Engine 4 [17] to create a realistic dock environment, and AirSim [18] to extract raw RGB and labeled, in an automatic manner. Unreal engine is a modern 3D engine used to create games and CGI in movies and is well known for its high-quality graphics, and AirSim a tool for simulating cars or UAV in either Unreal Engine or Unity 3D. To bridge the gap between the simulation and the real environment, we randomize the color, shape of the ships, weather, and time of the day (illumination and shadows) and add random Gaussian noise on the water surface shape and texture (e.g. foaming) [19]. In all our experiments each network is trained from scratch using the dataset described in Table I, using stochastic gradient descent (SGD) and bootstrapped cross-entropy loss function [20], with learning rate . To improve robustness to translations and orientations, we augment the original dataset with mirrored and flipped images. While simulation data and transfer learning can help the network learn, the training dataset contains both simulated and real-world image samples (see Fig. 4), to incorporate smaller details that are difficult to simulate using state-of-the-art rendering engines, such as foam, smoke, surface scattering (e.g. how much the light penetrates the water). The dataset is collected at to meters altitude.
| Total of images in dataset | Images containing category | |||||
| Total | Real | Simulation | Ship | Water | Unknown | |
| Train | 8459 | 165 | 8294 | 8269 | 8444 | 4868 |
| Val | 22 | 22 | 0 | 22 | 22 | 14 |
| Test | 100 | 100 | 0 | 93 | 100 | 63 |
III-C2 Image-based Distance Computation
After finding the segmented blobs for a given image, we employ topological analysis of binarized images [21], to extract contours, i.e., the surrounding relations among the outermost borders of the binary image. The resulting silhouettes are then used for computing object-specific relative distances using two approaches described next.
The 3D silhouette of the vessel is represented by a set of lines defined in the vessel coordinate frame , as follows
| (2) |
is precomputed from a known CAD model and simplified using a convex hull representation, which is discretized into a user-specified number of subsections, according to safety structural requirements. Each subsection is represented by two delimiting points, which are precomputed and stored in a list structure at initialization time. In the online step, we transform each vessel line section into the image plane coordinates, according to
| (3) |
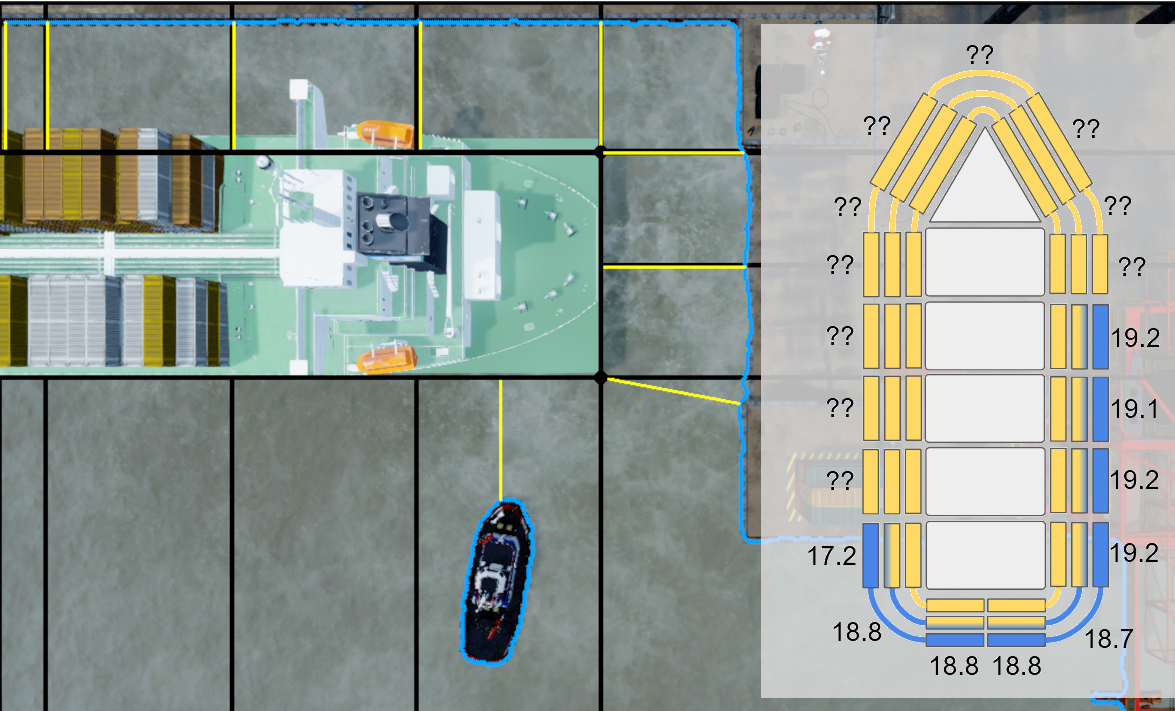
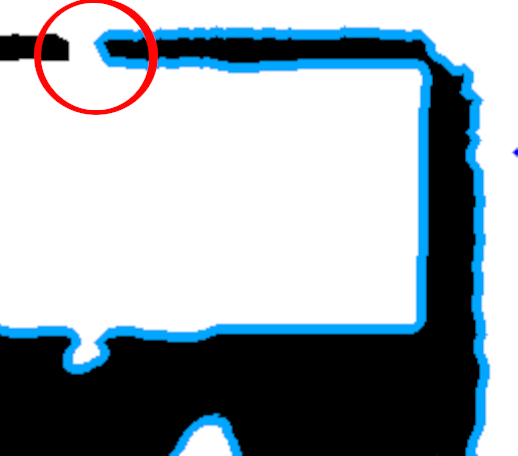
Then, we compute perpendicular vectors for each subsection, departing from each of these points, to define regions that enclose potential obstacles represented by non-vessel found contours. The distance between the contours and the corresponding vessel subsection is obtained by projecting each contour point into the line defined by the points delimiting the subsection (see Fig. 1) and finding the minimum distance one, according to
| (4) |
with , where is the closest point to on the vessel (i.e. section ), and the orthogonal vector from to .
The distances in pixel coordinates are converted to distances in vessel coordinates using the GSD function, according to
| (5) |
where represents the altitude of the camera, the camera sensor height, the height, the camera sensor width, the image width and the camera focal length, is the min distance in pixel units and is the euclidean distance found in meters. This is a reasonable approximation when the viewpoint altitude is significantly larger than the height of the structures on the ground (i.e. or at sea level).
IV Experimental Results
The experiments intend to show the accuracy and efficiency of the proposed method as a whole. To accomplish this, we break the evaluation down into; evaluating the performance of the leading semantic segmentation networks on our dataset and the overall expected performance of the methods estimated distance measurements.
IV-A Semantic Segmentation
As the proposed method is developed around planar projection and GSD to convert pixels to metric euclidean distances, every pixel matters in maintaining good accuracy, one of the significant determinants on which the method depends are the semantic segmentation models, which foremost objectives are to interpret the given input image and produce a mask separating water from solids. The selection of the semantic segmentation models is not only based on their accuracy, but also efficiency and speed as the pipeline might need to perform in near real-time using onboard resources. We generally have to sacrifice some accuracy to get a low memory and fast model, which is why we have chosen to test HarDNet, BiSeNetv2, and DDRNet.
For the training of all models, we use a SGD optimizer with an initial learning rate set to , the momentum to , and weight decay to . The batch size is set to per GPU, and the training is stopped after epochs. We use Bootstrapped cross-entropy on each image instead of over a batch of images so that each image will contribute to the loss. The parameter used for bootstrapped cross-entropy is going from of the pixels to , and a warm-up period from to with the idea of the network can learn to adapt to the easy regions first and transit to the more challenging regions. For the rest of the parameters, the original values are being used.
The test and validation dataset only contains real-case images as we want to optimize the model for real-case data only and avoid over-fitting by training and evaluating on different domains. The test dataset is captured from a different ship, season, and time of day to determine if the models are over-fitted.
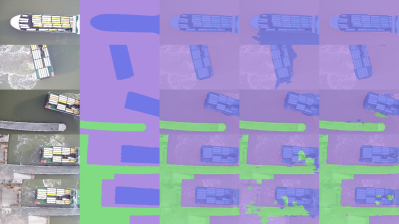
Table II shows the mean accuracy of all three models on both the validation and test sets. While BiSeNetV2 and DDRNet are victims of overfitting, HarDNet shows an exceptional result with high accuracy on both the validation and test set and good IoU on all three classes. This accuracy comes with the cost of being the slowest among the three models. In Fig. 5 we can see the low resolution output coming from DDRNet. This is because the output of DDRNet is eight times lower than the given input, which in our model is . DDRNet is performing better on high-resolution images. In the proposed method, only the water estimations are being processed since knowing the semantic difference of ships and harbor has little value for estimating distance on water surfaces.
| Model | Dataset | Mean accuracy | IoU | Speed (FPS) | Resolution (w,h) | Params | |||
| Unknown | Water | Ship | Mean | ||||||
| BiSeNet v2 | Val | 96.4 | 91. | 97.7 | 93.3 | 94.0 | 133.43 | 512x288 | 3.5M |
| Test | 75.4 | 47.5 | 70.2 | 54.5 | 57.4 | ||||
| HarDNet | Val | 98.6 | 96.3 | 98.7 | 96.6 | 97.2 | 91.75 | 640x360 | 4M |
| Test | 97.3 | 90.9 | 96.6 | 92.6 | 93.4 | ||||
| DDRNet-23 | Val | 97.4 | 92.5 | 97.6 | 92.9 | 94.3 | 100.12 | 640x360 | 7.6M |
| Test | 86.4 | 73.4 | 80.4 | 62. | 72. | ||||
IV-B Distance Estimation
Since ground truth distance between real docking vessels and surrounding obstacles was not available during experiments, we conduct these experiments inside an AirSim simulation. We use ray-casting to compute the exact ground-truth distance between the vessel and all the other objects in the environment. In order to evaluate the performance of the whole method, we let the UAV move around the shipyard at different altitudes and recorded all proprioceptive and exteroceptive sensor data and ground truth. More specifically, we consider image samples taken from a fixed altitude. The number of altitudes were discretized into .
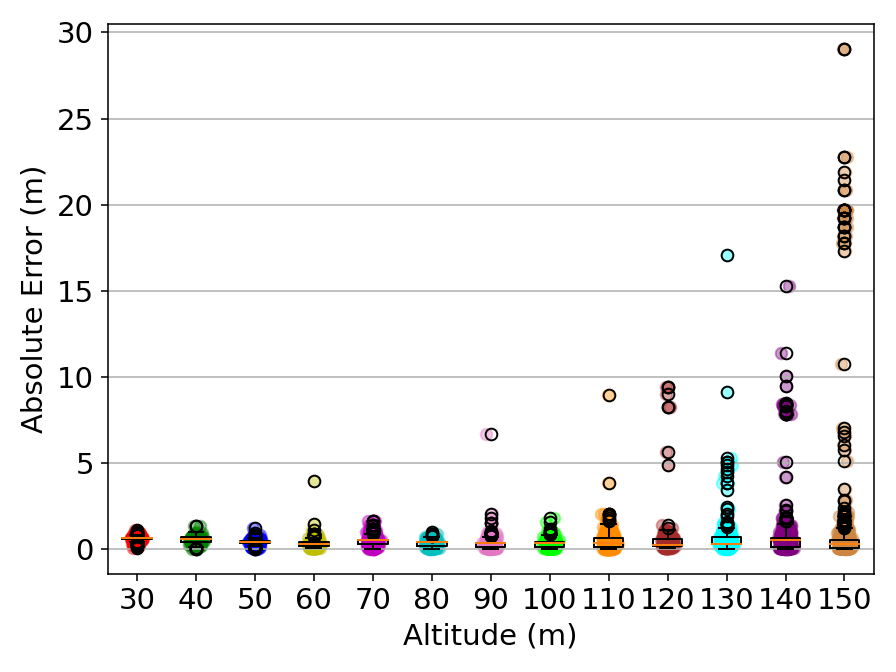
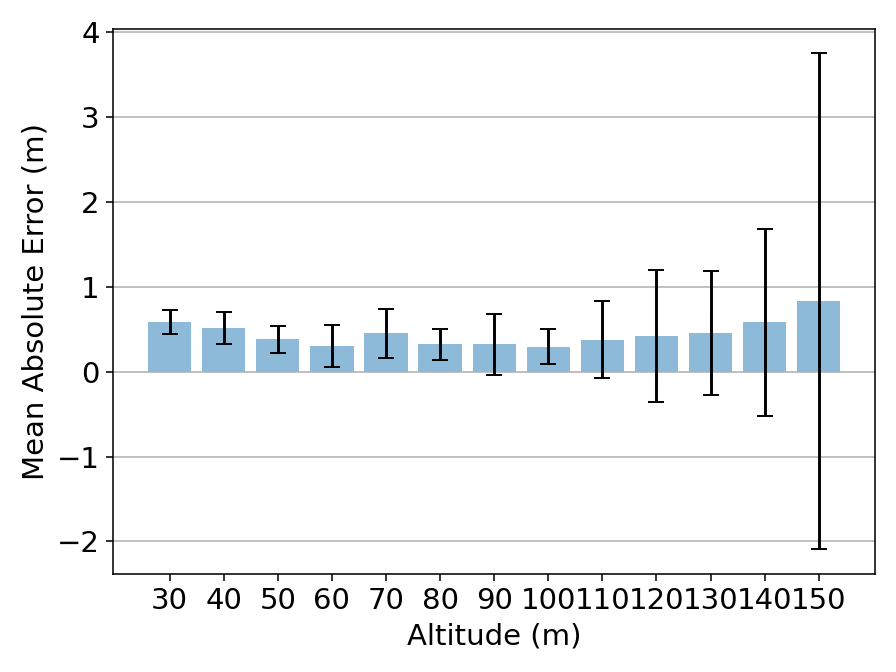
Figures 6 and 7 show the correlation between the altitude and absolute distance error. Figure 7 is the zoomed version of Fig. 6 where we can have a closer look at the mean absolute error, while Fig. 7 shows the overall absolute errors of all estimated distances. The results show that the distance mean error and standard deviation increase with altitude. This is expected due to the fact that the segmentation model is only trained for up to 100 meters, which justified the amount the continuous increase in the number of outliers. Also, the GSD error grows quadratically as altitude increases due to quantization errors.
IV-C Discussion
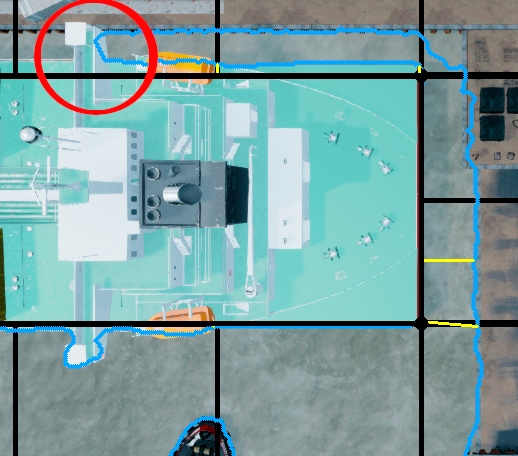
While the average absolute error shown in Figs. 6 and 7 show excellent results, there are three sources of noise that contribute to errors in distance computation, depending on image acquisition altitude: The first is quantization issues. As we increase the altitude, the measuring accuracy decreases since pixel resolution is limited. The proposed method is utilizing GSD to convert pixels into a distance metric system, and as the altitude increases, the higher value per pixel. The second is due to the planar assumption, which for lower altitudes becomes faulty. In these cases, measurement accuracy is affected by the height of the ground structures, and the extraction of contours will be faulty and noisy. This is not strictly on lower altitudes that the planar assumption is a problem. When structures are relatively high above the sea surface, they will start to overlap with the environment, and as we can see in our from Fig. 8 at , the top of the vessel is overlapping with the surface resulting in chaotic contour results. It is a delicate balance between keeping low altitudes for better pixel accuracy and high altitude for lowering 3D disturbance. The last is due to limitations in the semantic segmentation model.
While HarDNet has shown the best performance in terms of accuracy, BiSeNet, having fewer parameters, is the fastest and might be more suitable for onboard applications. As the altitude increases, the greater the distance value per pixel we get from the GSD, and as a result, small mistakes from the model can jeopardize distance estimation accuracy.
V Conclusions
In this work, we have presented a novel approach for relative inter-object distance extraction from aerial image data captured from a companion UAV, combined with absolute GPS and magnetometer localization data. The proposed method first employs semantic segmentation networks to discriminate between the vessel of interest and potential solid objects from raw image data, and a GSD method that considers proprioceptive GPS and magnetometer data to accurately determine the relative distance between the vessel and the environment obstacles.
A dataset has been developed to train a segmentation network that consists of both photo-realistic images using AirSim and real-world images. The extensive simulation results demonstrate that the developed framework gives satisfactory accuracy in distance estimation between the object of interest (i.e. vessel) and surrounding objects. We believe the UAV-assisted framework can improve the navigation performance of vessels when they have to maneuver in congested harbors and waterways. Although our method relies on RGB visual data for object segmentation, the proposed framework is general enough to be extended to other types of imagery data, e.g. infrared or thermal, as long as suitable training data is provided.
In future work, we intend to extend the system to fuse information over time (e.g. probabilistic Bayesian framework) to keep track of dynamic obstacles [22], the vessel, and their distances in the environment. This way, one could extend the proposed framework for NBV planning [23] to improve distance estimation over time and propose safe trajectories to the ship.
VI Acknowledgement
The authors would like to acknowledge the financial contribution from Smart Industry Program (European Regional Development Fund and Region Midtjylland, grant no.: RFM-17-0020). The authors would further like to thank Upteko Aps for bringing the use-case challenge and for collection of real life datasets.
References
- [1] M. Cordts, M. Omran, S. Ramos, T. Rehfeld, M. Enzweiler, R. Benenson, U. Franke, S. Roth, and B. Schiele, “The cityscapes dataset for semantic urban scene understanding,” in Proceedings of the IEEE Conference on Computer Vision and Pattern Recognition (CVPR), June 2016.
- [2] C. Yu, J. Wang, C. Peng, C. Gao, G. Yu, and N. Sang, “Bisenet: Bilateral segmentation network for real-time semantic segmentation,” CoRR, vol. abs/1808.00897, 2018. [Online]. Available: http://arxiv.org/abs/1808.00897
- [3] P. Chao, C.-Y. Kao, Y.-S. Ruan, C.-H. Huang, and Y.-L. Lin, “Hardnet: A low memory traffic network,” in Proceedings of the IEEE/CVF International Conference on Computer Vision (ICCV), October 2019.
- [4] G. Huang, Z. Liu, L. Van Der Maaten, and K. Q. Weinberger, “Densely connected convolutional networks,” in 2017 IEEE Conference on Computer Vision and Pattern Recognition (CVPR), 2017, pp. 2261–2269.
- [5] Y. Hong, H. Pan, W. Sun, and Y. Jia, “Deep dual-resolution networks for real-time and accurate semantic segmentation of road scenes,” arXiv preprint arXiv:2101.06085, 2021.
- [6] I. Bozcan and E. Kayacan, “Uav-adnet: Unsupervised anomaly detection using deep neural networks for aerial surveillance,” in 2020 IEEE/RSJ International Conference on Intelligent Robots and Systems (IROS), Las Vegas, NV, USA, 2020, pp. 1158–1164.
- [7] ——, “Context-dependent anomaly detection for low altitude traffic surveillance,” in 2021 IEEE International Conference on Robotics and Automation (ICRA), Xi’an, China, To appear.
- [8] E. Camci, D. Campolo, and E. Kayacan, “Deep reinforcement learning for motion planning of quadrotors using raw depth images,” in 2020 International Joint Conference on Neural Networks (IJCNN), 2020, pp. 1–7.
- [9] E. Camci and E. Kayacan, “End-to-end motion planning of quadrotors using deep reinforcement learning,” CoRR, vol. abs/1909.13599, 2019. [Online]. Available: http://arxiv.org/abs/1909.13599
- [10] G. A. Kumar, J. H. Lee, J. Hwang, J. Park, S. H. Youn, and S. Kwon, “Lidar and camera fusion approach for object distance estimation in self-driving vehicles,” Symmetry, vol. 12, no. 2, 2020. [Online]. Available: https://www.mdpi.com/2073-8994/12/2/324
- [11] L. Piotrowsky, T. Jaeschke, S. Kueppers, J. Siska, and N. Pohl, “Enabling high accuracy distance measurements with fmcw radar sensors,” IEEE Transactions on Microwave Theory and Techniques, vol. 67, no. 12, pp. 5360–5371, 2019.
- [12] R.-J. Yan, E. Kayacan, I.-M. Chen, L. K. Tiong, and J. Wu, “Quicabot: Quality inspection and assessment robot,” IEEE Transactions on Automation Science and Engineering, vol. 16, no. 2, pp. 506–517, 2019.
- [13] J. Fayyad, M. A. Jaradat, D. Gruyer, and H. Najjaran, “Deep learning sensor fusion for autonomous vehicle perception and localization: A review,” Sensors, vol. 20, no. 15, 2020. [Online]. Available: https://www.mdpi.com/1424-8220/20/15/4220
- [14] I. Bozcan, J. Le Fevre, H. X. Pham, and E. Kayacan, “Gridnet: Image-agnostic conditional anomaly detection for indoor surveillance,” IEEE Robotics and Automation Letters, vol. 6, no. 2, pp. 1638–1645, 2021.
- [15] I. Bozcan and E. Kayacan, “Au-air: A multi-modal unmanned aerial vehicle dataset for low altitude traffic surveillance,” in 2020 IEEE International Conference on Robotics and Automation (ICRA), 2020, pp. 8504–8510.
- [16] B. Felipe-García, D. Hernández-López, and J. L. Lerma, “Analysis of the ground sample distance on large photogrammetric surveys,” Applied Geomatics, vol. 4, no. 4, pp. 231–244, 2012.
- [17] Epic Games, “Unreal Engine v4.24.3,” last accessed 27 October 2020. [Online]. Available: https://www.unrealengine.com
- [18] S. Shah, D. Dey, C. Lovett, and A. Kapoor, “Airsim: High-fidelity visual and physical simulation for autonomous vehicles,” in Field and service robotics. Springer, 2018, pp. 621–635.
- [19] A. Dehban, J. Borrego, R. Figueiredo, P. Moreno, A. Bernardino, and J. Santos-Victor, “The impact of domain randomization on object detection: A case study on parametric shapes and synthetic textures,” in 2019 IEEE/RSJ International Conference on Intelligent Robots and Systems (IROS). IEEE, 2019, pp. 2593–2600.
- [20] S. E. Reed, H. Lee, D. Anguelov, C. Szegedy, D. Erhan, and A. Rabinovich, “Training deep neural networks on noisy labels with bootstrapping,” in ICLR 2015, 2015. [Online]. Available: http://arxiv.org/abs/1412.6596
- [21] S. Suzuki and K. Abe, “Topological structural analysis of digitized binary images by border following.” Computer Vision, Graphics, and Image Processing, vol. 30, no. 1, pp. 32–46, 1985. [Online]. Available: http://dblp.uni-trier.de/db/journals/cvgip/cvgip30.html#SuzukiA85
- [22] R. Figueiredo, J. Avelino, A. Dehban, A. Bernardino, P. Lima, and H. Araújo, “Efficient resource allocation for sparse multiple object tracking,” in Proceedings of the 12th International Joint Conference on Computer Vision, Imaging and Computer Graphics Theory and Applications - Volume 6: VISAPP, (VISIGRAPP 2017), INSTICC. SciTePress, 2017, pp. 300–307.
- [23] R. P. de Figueiredo, J. G. Hansen, J. L. Fevre, M. Brandão, and E. Kayacan, “On the advantages of multiple stereo vision camera designs for autonomous drone navigation,” CoRR, vol. abs/2105.12691, 2021. [Online]. Available: https://arxiv.org/abs/2105.12691