10.1109/TVCG.2021.3114820 \onlineid0 \vgtccategoryResearch \vgtcpapertypeplease specify \authorfooter Arpit Narechania is with Georgia Tech. E-mail: arpitnarechania@gatech.edu. Alireza Karduni and Ryan Wesslen are with UNC-Charlotte. E-mails: {akarduni, rwesslen}@uncc.edu. Emily Wall is with Emory University. Email: emily.wall@emory.edu *work performed while at Northwestern University. \shortauthortitleNarechania et al.: Word Embedding Approach for Identifying Relevant Vis Literature
vitaLITy: Promoting Serendipitous Discovery of Academic Literature with Transformers & Visual Analytics
Abstract
There are a few prominent practices for conducting reviews of academic literature, including searching for specific keywords on Google Scholar or checking citations from some initial seed paper(s). These approaches serve a critical purpose for academic literature reviews, yet there remain challenges in identifying relevant literature when similar work may utilize different terminology (e.g., mixed-initiative visual analytics papers may not use the same terminology as papers on model-steering, yet the two topics are relevant to one another). In this paper, we introduce a system, vitaLITy, intended to complement existing practices. In particular, vitaLITy promotes serendipitous discovery of relevant literature using transformer language models, allowing users to find semantically similar papers in a word embedding space given (1) a list of input paper(s) or (2) a working abstract. vitaLITy visualizes this document-level embedding space in an interactive 2-D scatterplot using dimension reduction. vitaLITy also summarizes meta information about the document corpus or search query, including keywords and co-authors, and allows users to save and export papers for use in a literature review. We present qualitative findings from an evaluation of vitaLITy, suggesting it can be a promising complementary technique for conducting academic literature reviews. Furthermore, we contribute data from 38 popular data visualization publication venues in vitaLITy, and we provide scrapers for the open-source community to continue to grow the list of supported venues.
keywords:
transformers, word embeddings, literature review, web scraper, dataset, visual analyticsK.6.1Management of Computing and Information SystemsProject and People ManagementLife Cycle;
\CCScatK.7.mThe Computing ProfessionMiscellaneousEthics
\teaser
![[Uncaptioned image]](/html/2108.03366/assets/x1.png) The vitaLITy User Interface. (A) Paper Collection View shows the entire corpus of publications, (B) Similarity Search View shows options to look-up publications that are similar to another list of publications or by a work-in-progress title and abstract, (C) Visualization Canvas shows an interactive 2-D UMAP projection of the embedding space of the entire paper collection, (D) Meta View shows summaries of certain attributes with respect to the Paper Collection View (A), (E) Opens a Saved Papers View from where the saved papers can be exported as JSON. Within the Paper Collection View (A), (1) shows an overview with global UI controls (e.g., filters), (2) shows attribute-level UI filters (range sliders, multiselect dropdowns), and (3) shows an interactive table of all publications.
\vgtcinsertpkg
The vitaLITy User Interface. (A) Paper Collection View shows the entire corpus of publications, (B) Similarity Search View shows options to look-up publications that are similar to another list of publications or by a work-in-progress title and abstract, (C) Visualization Canvas shows an interactive 2-D UMAP projection of the embedding space of the entire paper collection, (D) Meta View shows summaries of certain attributes with respect to the Paper Collection View (A), (E) Opens a Saved Papers View from where the saved papers can be exported as JSON. Within the Paper Collection View (A), (1) shows an overview with global UI controls (e.g., filters), (2) shows attribute-level UI filters (range sliders, multiselect dropdowns), and (3) shows an interactive table of all publications.
\vgtcinsertpkg
Introduction
Visualization research is inherently interdisciplinary, borne out of fields such as Computer Graphics and Human-Computer Interaction, with heavy influence from fields outside of computing such as Perceptual Psychology and Cognitive Science. Furthermore, visualization is applied to explore data and support data-driven decision making problems in domains ranging from enterprise analytics to medicine. As a result of the multi-faceted nature of the field, there may be parallel research efforts that can be difficult to become aware of, even with a comprehensive methodology for conducting literature reviews.
One challenge of interdisciplinary research is when different fields use similar terminology to study different problems. For instance, transformer in electronics refers to a device that transfers energy between circuits [40]; while in computing, transformer refers to a type of neural network based on attention mechanisms, commonly applied to unstructured text data [63]. As a result, keyword searches often yield irrelevant work. Further, sifting through all hits from a keyword search may still miss critical work. For instance, the recent wave of work on bias in visualization (e.g., [18, 17, 66, 67, 11, 62, 68, 47]) seldom mentions uncertainty (e.g., [34, 32]). Yet, as the seminal work on bias in Cognitive Science points out, bias emerges when people make decisions under uncertainty [61]; hence, there is a critical need to examine uncertainty literature that may fundamentally address similar problems using different terminology. As a result, conducting a simple keyword search for “bias” (i.e., matching tokens in a paper title or abstract) to identify relevant work may neglect pockets of influential research. However, these challenges are not unique to data visualization research or even computing. They extend to virtually all interdisciplinary research.
Current prevalent practices for conducting literature reviews tend to utilize two common search strategies: (1) keyword search and (2) examination of back-references from a snowballing set of seed papers, usually through searching Google Scholar or DBLP. These approaches can successfully identify a large number of relevant citations, but can suffer from at least two key limitations: thoroughness and efficiency. That is, they may fail to unearth related papers that use different terminology, and they require significant manual effort to gauge relevancy of potentially thousands of hits. In other words, a prominent challenge, then, in conducting literature reviews or surveys is to effectively identify research of significance to a given topic based on similarity of topics, irrespective of matching exact keywords.
To address these challenges, we introduce vitaLITy, an open-source visualization system designed to support a flexible exploration of research articles. Inspired by work on insight in visualization (i.e., “eureka” or “aha” moments [9]), we similarly aim to support serendipity with vitaLITy, .
In summary, this work presents the following contributions:
-
1.
results of a formative interview study in which visualization researchers identified key challenges in current literature review practices (Section 2),
-
2.
a dataset of scraped metadata from 59,232 academic articles (https://figshare.com/articles/dataset/VitaLITy_A_Dataset_of_Academic_Articles/14329151 [48], CC0 License), including paper titles, keywords, and abstracts from 38 popular venues for visualization research (Section 3.1),
-
3.
an open-source tool, vitaLITy (http://vitality-vis.github.io, MIT License), for supporting discovery of relevant articles while conducting literature reviews (Section 3.2),
-
4.
usage scenarios describing potential workflows in which vitaLITy might be used in different ways to support serendipitous discovery of relevant academic literature (Section 4), and
-
5.
results of a summative evaluation of vitaLITy (Section 5).
1 Related Work
1.1 Literature Review Methodologies
Literature reviews and surveys are an essential part of scientific disciplines. They are broadly defined as systematic ways of collecting and synthesizing research on a specific topic [4, 56]. There are a variety of different guidelines and methodologies, such as systematic reviews [45], narrative reviews [4], and integrative reviews [60]. These guidelines and methods mostly vary in how they organize, synthesize, and analyze a set of selected articles through a combination of quantitative and qualitative methods [56]. These methodologies often include multiple stages, the first of which is related to identifying a strategy for searching and selecting a set of related literature. For example, Hannah Snyder states that “a search strategy for identifying relevant literature must be developed. This includes selecting search terms and appropriate databases and deciding on inclusion and exclusion criteria. Here, a number of important decisions must be made that are crucial and will eventually determine the quality and rigor of the review”[56].
Similarly, within the visualization community, defining search strategies and keywords are described as the primary step for conducting literature reviews [43]. Many visualization survey papers include explicit excerpts about their selection criteria that describe keywords, databases, and the search process of each survey paper [59, 27, 54]. For example, in their survey of glyph visualization techniques, Fusch et al. employ a “snow ball” sampling technique in which they start by searching the keyword “glyph” within various libraries, select all the findings, filter based on their exclusion criteria, and then look at the related work of the selected papers to find more papers [27].
Although keyword search is the most prevalent method for searching literature, it comes with some limitations:
-
•
Often it won’t yield papers that do not include a specific keyword but might be very related to the topic at hand.
-
•
Within different communities, different keywords are used to represent a common concept.
As a result, selecting sufficiently broad yet relevant keywords can be a challenge. vitaLITy offers a visual system that complements traditional keyword search-based methods to enhance literature searches.vitaLITy implements a state-of-the-art transformer-based document similarity search that can find semantically similar documents that may not always share the same set of keywords.
1.2 Visualization of Academic Articles
Visual analytics research has been effective in incorporating many machine learning and natural language processing models (e.g., topic modeling or word embeddings) into vis systems for exploratory analysis of large corpora of text documents [22, 42, 20, 21]. A common task is identifying similar documents [24]. Early visualization papers on document similarities used representations of a corpus’ similarity matrix through dot plots [13] or histograms [26]. More recent vis systems have considered more author assigned keyword-based approaches like constructive text similarity [1] and GlassViz [7]. Alternative approaches have considered word embeddings including for iterative lexicon construction [49] that provide related ability to query documents.
One key application area for incorporating visual techniques to help users find similar and relevant documents is in searches for academic articles. Several prominent article databases have implemented such systems to find relevant articles. Text Analyzer by JSTOR extracts the most important topics and keywords from entered papers and recommends other relevant documents to users (https://www.jstor.org/analyze/). Pubmed uses a word-based technique to help users retrieve the most similar papers ( https://pubmed.ncbi.nlm.nih.gov/help/#pubmedhelp.Computation_of_Weighted_Relev). Open Knowledge graph uses similarity scores provided by Pubmed and develops a circle packing visualization to help users understand groups of related research relevant to their search terms (https://openknowledgemaps.org/).
Within the visualization community, several works highlight the importance of understanding and visualizing academic literature. Felix et al., introduce a design space and highlight how different keyword summarization techniques might impact users’ understanding of related literature [25]. Using the open source vis literature dataset (VisPubData), Isenberg et al. introduce KeyVis and analyze keywords utilized in the visualization community [36, 35]. Others introduce relevant systems for supporting dissemination of curated survey results [5], , analysis of the contextual reasons for citations [73], and an emergent design space for considering visualizations of literature collections [31]. In general, within visualization systems on academic literature we can observe three themes: (1) visualization systems that focus on citation networks (e.g., [72, 29, 12, 15]), systems that focus on clustering or similarity (typically by matching keywords, e.g., [70], or using topic modeling, e.g., [2, 36]), and (3) systems that focus on both citation networks and similarity measures (e.g., [46, 10]).
Inspired by these works, our paper introduces (1) a more comprehensive public dataset of visualization literature, and (2) utilizes state-of-the-art document embedding techniques using transformers to enable serendipitous discovery of articles.
1.3 Word Embeddings and Transformers
Document similarity is a classic problem in natural language processing and information retrieval [38]. Word embeddings provide an approach in which words (or documents) that have similar meanings have similar (vector) representations. Beginning with word2vec [44], many extensions of learned dense representations of word vectors have followed including GloVe [50], fasttext [8], skipthought [39], ELMo [51], and BERT [16].
2 Formative Study
We conducted a formative study to better understand the needs of researchers as they perform literature reviews. Participants were 4 Computer Science PhD students (3 female, 1 male; avg. 2.75 yrs. into PhD program) who had prior experience conducting literature reviews in the field of visualization. Sessions lasted approximately 45 minutes. Participation was voluntary with no compensation.
We presented the first two participants with an initial version of the literature review tool. After incorporating feedback in the next iteration of the system, we worked with the next two participants using the updated system. Finally, we incorporated feedback from all formative study participants in vitaLITy, presented in the next section.
2.1 Current Workflow
After obtaining informed consent, we asked participants to describe their typical workflow for conducting literature reviews via a semi-structured interview. Participants expressed some haphazard nature to the beginning of their processes, e.g., “someone tells [them] about a paper, and [they] look up the citations and branch out from there” (P1) or “use a starting point from an advisor” (P2). From there, there are some commonalities in processes.
Participants all utilized keyword searches on Google Scholar (P1-4). As a fairly comprehensive database, participants did not worry whether a venue or paper would be present, and they appreciated the “cited by” feature to identify more recent relevant papers. However, participants also expressed that keyword searches on Google Scholar result in many irrelevant papers that require a lot of manual filtering for relevance. For instance, P4 viewed Google Scholar as a last resort, expressing they really only use it “if [they] don’t have a better starting point seed paper.” Echoing some of the motivation for this work, P1 indicated, “if a keyword is used differently in different fields, [they] have to read a lot of abstracts to determine whether it’s relevant or not.”
While Google Scholar seems to be the default search tool, there are others that participants integrate in various parts of their workflow when conducting literature reviews. For instance, P4 indicated regular use of bibliography management tools like Mendeley and Zotero. Among our relatively small sample in this formative study, participants did not mention some other elements in their workflow that we anticipated, e.g., DBLP, manual scripting / web scraping, etc.
2.2 Preliminary Feedback
Next, participants used a preliminary version of our literature review tool. The preliminary tool included 17,926 papers from the following venues over the past 39 years (1982-2020): {CGA, CGF, EuroVis, Graphics Interface, Information Visualization, Interact, Journal of Visualization, PacificVis, SciVis, TVCG, VAST, VIS} and supported two main mechanisms for searching the corpus: keyword search and similarity search (described in greater detail in the next section). After using the tool, we asked participants for additional feedback about the current implementation, possible improvements, and any new capabilities that they could envision to better support their literature review process.
Participants appreciated the ability to start their search with a seed paper or papers (P1 said they got “pages and pages of results which is what [they] would get on Google Scholar, but these are actually more relevant”). P2 searched based on the seminal paper on hypothetical outcome plots (HOPs) [34] and observed “it pulled up lots of uncertainty vis papers, which were not in the title – cool!” but expressed that there was still a lot of noise when searching by keywords.
Participants new features: being able to visualize connections between papers (e.g., by citations, co-authors, etc. - P1), adding critical information on citation count as a mechanism for determining importance of a paper (P1), making the overview interactive (with brushing and linking, summarizing dynamic regions, etc. - P2), and being able to type in a custom abstract or paper idea as the basis of the similarity search (e.g., to identify relevant literature for a paper idea that hasn’t been fully fleshed out yet - P2). Participants also steered away from one of the features in the tool: the word cloud. P4 indicated “it wasn’t clear how it was related to what [they] had selected.”
Overall, participants indicated that a tool like this in their workflow could supplement tools like Google Scholar for serendipitous exploration. P4 suggested it would be beneficial in the early “discovery” phases of literature review, with the caveat that the data on included venues needed to be sufficiently comprehensive. As a result of this feedback, we updated the system to address these ideas, including scraping data from additional venues, adding citation counts, adding brushing and linking between views, and searching by a custom abstract. We did not add features based on citation networks in our system.
2.3 Design Goals
Collectively, these interviews led us to the following set of four design goals for our literature review system.
DG 1. Serendipity: Enable serendipitous identification of semantically related articles that do not necessarily have shared keywords through visual exploration.
DG 2. Familiarity: Facilitate a familiar search functionality to what users are currently accustomed to, such as keyword and author search.
DG 3. Novelty: Afford users to find semantically related articles by searching based on the author’s own ideas in the form of unpublished sentences / abstract.
DG 4. Overview: Enable users to interact with a visual overview of a group of papers.
3 vitaLITy
We present vitaLITy, a system designed to complement existing tooling for conducting academic literature reviews by supporting serendipitous discovery of relevant literature.
3.1 Data
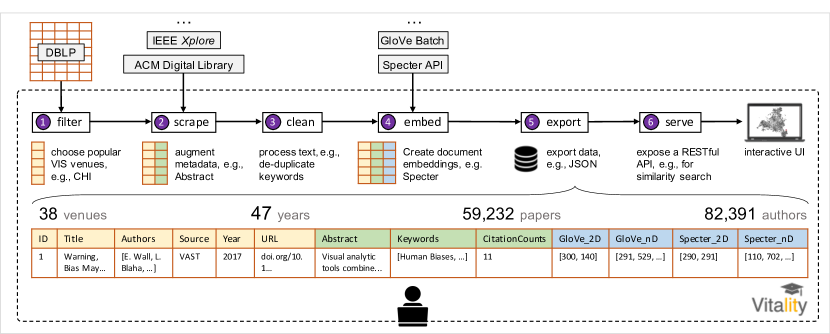
Figure 1 outlines the pipeline for curating the paper corpus.
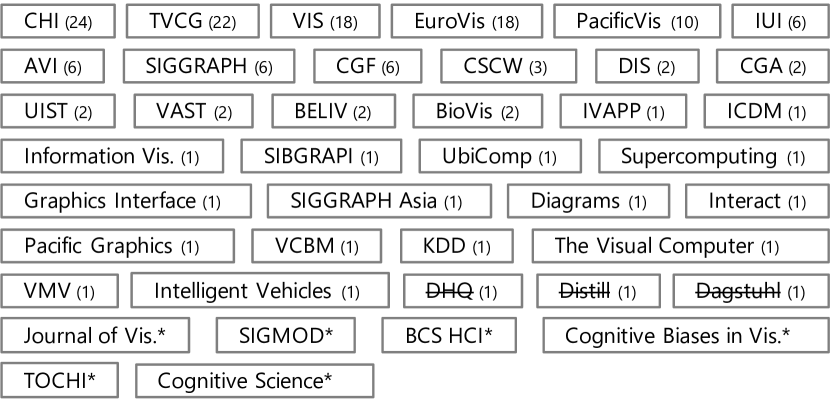
1. Filter: We conducted an open-ended crowd-sourced survey on Twitter asking visualization researchers about venues (e.g., journals, conferences, workshops) where they publish. We received responses from 24 users (current roles: 17 Ph.D. students, 4 Faculty, 2 Industry researchers, and 1 Postdoctoral scholar; self-reported visualization literacy out of 5: =4, =1.142, median=4). We supplemented the list with six additional venues based on our own knowledge that were not captured in the survey. Figure 2 outlines the final list of 38 venues within our corpus. Next, we downloaded the November 2020 release 111https://dblp.org/xml/release/dblp-2020-11-01.xml.gz of DBLP [58] and filtered it for the aforementioned 38 venues. From the resultant subset, we chose the Title, Authors, Source (venue), Year (published), and URL attributes and added a unique ID for tracking. Note that the vitaLITy dataset and hence the UI show more than 38 venues because DBLP (a) utilizes multiple descriptors to represent different tracks at the same venue (e.g., Eurographics (Area Papers), Eurographics (State of the Art Papers), Eurographics (Short Papers), etc.) and (b) splits some venues across different versions (e.g., Interact, Interact (1), Interact (2), etc.).
2. Scrape: The DBLP dataset does not include abstracts, keywords, and number of citations for papers. Thus, we developed a scraper module that, given a list of publication URLs, scrapes the corresponding publisher’s webpage (e.g., IEEE Xplore, ACM Digital Library) and extracts the Abstract, Keywords, and CitationCounts from it.
3. Clean: We performed data cleaning and transformation operations. To aid search, we encoded all text attributes to ASCII and converted Authors and Keywords into a JSON array from a comma separated list. We de-duplicated Keywords by matching their lowercase forms; we combined similar keywords (e.g., HCI & Human-Computer Interaction, Visualization & Visualisation) through manual inspection. We dropped 1497 papers with null {Title, Authors, Abstract} values, and very short or very long Title (5, 250 characters) and Abstract (50, 2500 characters) to create effective word embeddings. We retained DBLP’s strategy in disambiguating author names (e.g., J. Thompson and J. Thompson 001). At the end of this step, the dataset has 8 attributes (columns) and 59,232 papers (rows).
4. Embed: We next curated a dataframe of Title, Abstract, Authors, Source, Year, and Keywords and created the GloVe [50] and Specter[14] document embeddings. To create the document embeddings for GloVe, we used TF-IDF weightings (instead of mean vectors) and SIF weightings that have been shown to remove noise through PCA reduction [3]. We used the public API to create the Specter embeddings [14]. With these document embeddings, we used UMAP to construct 2-D document representations used in the Visualization Canvas (see Figure 3).
5. Export: We export the consolidated dataset as JSON and a MongoDB dump for different open-source use.
6. Serve: We also developed a server that exposes a RESTful API to (a) load the vitaLITy document corpus, (b) perform similarity search by a list of seed papers as input, (c) perform similarity search by a working title and abstract as input, and (d) download metadata of (saved) papers as a JSON array. The similarity search by seed papers (b) supports querying by 2-D UMAP as well as n-D document embeddings for both GloVe and Specter. We used MongoDB to maintain the 2-D indexes and Facebook Research’s faiss library [37] to maintain the n-D indexes. The vitaLITy UI interfaces with this server, described next.
3.2 System Overview
The system, shown in Figure vitaLITy: Promoting Serendipitous Discovery of Academic Literature with Transformers & Visual Analytics, is comprised of a Paper Collection View (A), Similarity Search View (B), Visualization Canvas (C), Meta View (D), and Saved Papers View (E), described in turn below.
Paper Collection View shows the entire corpus of papers in an interactive tabular layout. (1) shows an overview (number of visible papers) and UI controls to perform a global search (\faSearch), show hidden columns ([Column \faPlus]), add all papers to the input list of papers in the Similarity Search table ([\faPlusCircle All]), and save all papers to the “cart” in the Saved Papers View ([\faSave All]). (2) shows the attributes along with UI controls to filter (range sliders for Quantitative attributes, multiselect dropdowns for Nominal attributes), hide a column (\faEyeSlash), and define a column on hover (\faQuestionCircle). (3) shows an interactive table of all papers with options to see detail (\faInfoCircle), locate in the UMAP (\faMapMarker), add to the input list of papers for similarity search (\faPlusCircle), and save to the “cart” (\faSave). Search and filter capabilities are designed to be an intuitive entry-point into the dataset of academic articles (DG 2).
Similarity Search View shows options to find papers similar to (a) one or more input papers (Figure 5, DG 1) or (b) a work-in-progress title and abstract (Figure 6, DG 3). vitaLITy supports setting the dimensions (2-Dimensional, n-Dimensional), number of similar papers to return, and the word embedding approach (e.g., Specter) to compute similarity.
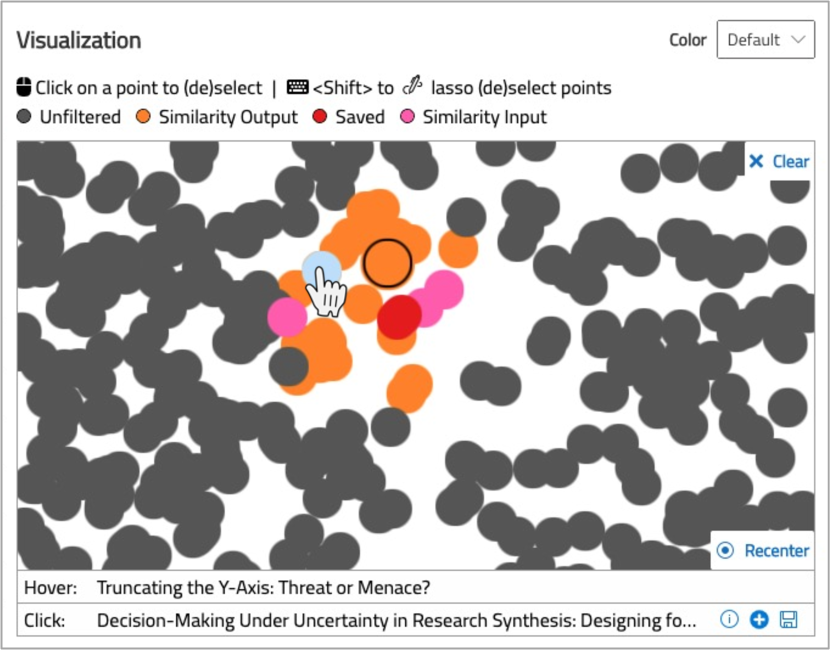
Visualization Canvas shows a 2-D UMAP projection of the embedding space of the entire paper collection (Figure 3, DG 4): hovering on a point highlights it, shows the corresponding title in a fixed tooltip below, and automatically scrolls the collection (table) to bring the corresponding paper (row) into the viewport; clicking on a point (de)selects it and shows it in the tooltip below with additional options to \faInfoCircle, \faPlusCircle, \faSave; clicking on \faTimes deselects all selected points; pressing Shift enables lasso-mode to select multiple points using a free-form lasso operation; zooming and panning support helps navigate the UMAP to specific regions; clicking on \faDotCircleO re-centers and fits the UMAP in the viewport. By default, each point in the UMAP is colored based on the state of the corresponding paper (“Default”): Unfiltered (unfiltered and visible in the main paper collection table; dark-grey), Filtered (filtered out and not visible in the paper collection table; light-grey), Similarity Input (added to the By Papers section in the Similarity Search View; pink), Similarity Output (in the Output Similar table; orange), and Saved (added to the Saved Papers table; red). Other options to color include Source, Year, CitationCounts, and Similarity Score.
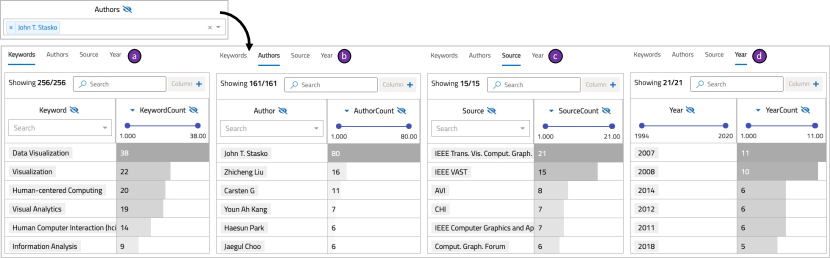
Meta View shows aggregated summaries of Keywords, Authors, Source, Year with respect to the Paper Collection View (A). Figure 4 shows how a filter in the main table (Authors=John T. Stasko) updates the Meta Views with the distribution of keywords (a) associated with their research, their co-authors (b), venues where they have published (c), and in which years (d).
Saved Papers View shows a table with the papers added to the “cart” with an additional option to export them as a JSON (Figure 5d).
3.3 Implementation
The filter, scrape, clean, embed, export, and serve modules are all implemented in Python. The UI is developed in React and uses the regl-based WebGL library222https://github.com/flekschas/regl-scatterplot to render the UMAP. MongoDB provides the document corpus to the UI and maintains the 2-D indexes while faiss [37] maintains the n-D indexes for efficient similarity search.
4 Usage Scenarios
A common thread among the authors’ prior research deals with human bias in data visualization, and in particular, the authors have focused on defining [67], detecting [11, 66, 65, 64], and mitigating [69, 47, 68] cognitive biases. Thus, we find it fitting to demonstrate the usage of vitaLITy through a series of usage scenarios in the context of a literature review on bias in visualization.
4.1 Usage Scenario 1: Identifying Missing Papers
Maya is a data visualization PhD student working on their dissertation on the topic of “Mitigating Bias in Data Visualization.” They are wrapping up the related work and preparing to submit their thesis. Before submitting, Maya wants to check for potential gaps in the literature review and ensure there is no critical missing work. Maya decides to use vitaLITy to explore the visualization literature.
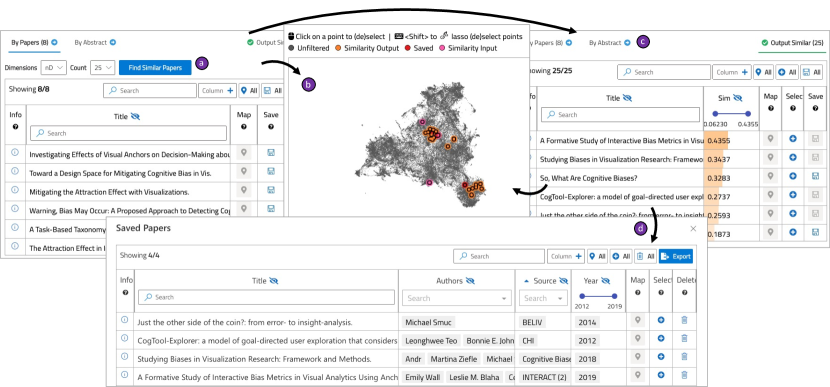
Maya wants to be systematic about their search. They begin by taking some of the key papers related to bias in visualization, including the following [18, 19, 17, 66, 69, 11, 71, 28]. Maya has already examined the papers cited from these works and written about the relevant ones in their dissertation. They locate these key papers in vitaLITy and “select” them [add them as input to Similarity Search] (Figure 5a), then map them in the Visualization (Figure 5b).
Starting with N-Dimensional Specter embedding, Maya searches for similar papers (Figure 5c). The first result, “A Formative Study of Interactive Bias Metrics in Visual Analytics Using Anchoring Bias” [65] (similarity score 0.4355), is cited in one of the papers [69] so Maya was already aware. Scanning down the list, the fourth result is “CogTool-Explorer: A Model of Goal-Directed User Exploration That Considers Information Layout” [57], a paper Maya is not aware of. Published at CHI in 2012, this paper describes a method for modeling and predicting user interactive behavior. Intrigued by the relevance of precursory work in HCI to predict interactive behavior [57] to work on modeling user bias [66], Maya saves this paper to the “cart”.
Continuing to examine the list of output papers, the next result also proves relevant with a similarity score of 0.2593: a BELIV paper titled “Just the Other Side of the Coin? From Error to Insight Analysis” [55] which models errors and insights in cognitive processing. Several others also catch Maya’s eye relevant to the design of bias mitigation strategies, including research about introducing visualization “difficulties” in design to aid comprehension and recall [33] and even use of so-called “transparent deception” in visualization if and when it is aligned with certain user goals [53]. Maya saves these papers and exports them for further review (Figure 5d).
Furthermore, Maya notices a particularly relevant paper, “Priming and Anchoring Effects in Visualization” [62], which they forgot about, so adds it to the input similarity search and re-computes the output. They find “Pushing the (Visual) Narrative: the Effects of Prior Knowledge Elicitation in Provocative Topics” [30], discussing persuasive visualization designs, which again Maya finds relevant for designing bias mitigation interventions. Maya continues iterating on their exploration of the literature, augmenting their dissertation related work section and filling in gaps, especially from the CHI community.
4.2 Usage Scenario 2: Analysis of Keyword Quality
Katherine is a visualization researcher who focuses on topics related to bias and decision making. She has primarily relied on keyword searches supported by IEEE Xplore, ACM Digital Library, etc. for identifying relevant literature in the past. Beginning with a set of known papers about bias in visualization (i.e., the same set from the previous scenario [28, 66, 69, 11, 71, 18, 19, 17]), she identifies several relevant keywords, including human biases, bias mitigation, bias mitigation strategies, bias alleviation, debiasing, cognition, cognitive bias, cognitive biases, cognitive heuristics, heuristics, decision making, decision-making, human decision-making, sensemaking capabilities, uncertainty, anchoring bias, and attraction effect. She disregards several others that she believes are too broad, e.g., visualization, information visualization, data visualization, human-centered computing, visual analytics, etc. She notes the multiplicity of some keywords defined by authors.
Katherine conducts a similarity search using vitaLITy (yielding the same output as the previous scenario for Maya’s literature review). She notes a number of papers that she would have been unable to identify given only these keyword searches. For instance, “Designing Information for Remediating Cognitive Biases in Decision-Making” [74] contains keywords Human Computer Interaction (hci) and Human-centered Computing and would have been missed by targeted bias-related keywords and likely lost among a sea of other papers by searching for more generic HCI keywords. Similarly, “A Lie Reveals the Truth: Quasimodes for Task-Aligned Data Presentation” [53] contains very broad keywords, including Visualization, Empirical Studies In Visualization, and Human-centered Computing. Other papers not directly related to bias, but still relevant, are even less likely to contain keyword matches. For instance, “Observation-Level Interaction with Statistical Models for Visual Analytics” [23] describes data- or “observation”-level interactions users perform with data based on perceived relationships and interests in the data, a topic of precursory relevance to bias research in data visualization. However, it contains keywords with no overlap to the bias-related search terms: Principal Component Analysis, Data Models, Data Visualization, Visual Analytics, Analytical Models, and Layout.
Notably, Katherine observes that some venues expose only index terms from e.g., IEEE or ACM, while others also expose author-defined keywords. This provides different levels of granularity in the ability to search for literature by keyword. Hence, Katherine finds that alternative approaches based on document-level embeddings can be a fruitful way to identify literature when keyword searches prove insufficient or inconsistent across venues.
4.3 Usage Scenario 3: Beginning a New Project
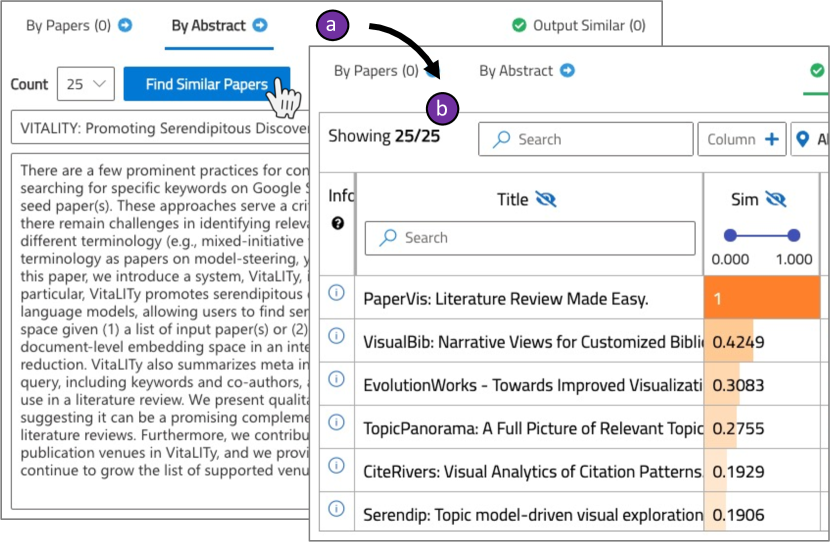
In this scenario, we showcase how vitaLITy facilitated our own literature review for the present work. After using traditional approaches based on keyword searches or citations from known papers, we found vitaLITy helped us identify a plethora of additional literature we were previously unaware of. We used the Similarity Search by Abstract feature of vitaLITy with our paper title and abstract (Figure 6a).
The first returned result is a 2011 Computer Graphics Forum paper titled “PaperVis: Literature Review Made Easy” [12] that utilizes a node-link visualization approach to support literature review and creates a topic hierarchy based on semantically meaningful topics (Figure 6b). The next paper similarly focuses on creating iterative citation networks to facilitate creation and sharing of bibliographies [15]. In general, after searching the output, a few themes emerge: (1) visualization systems that focus on citation networks (e.g., [72, 29]), systems that focus on clustering or similarity (typically by matching keywords, e.g., [70], or using topic modeling, e.g., [2]), and (3) systems that focus on both citation networks and similarity measures (e.g., [46]). Other notable topics also surfaced, including a design space [25] and analyses of keywords utilized in the visualization community [36], a system for supporting dissemination of curated survey results [5], analysis of the contextual reasons for citations [73], and an emergent design space for considering visualizations of literature collections [31].
Reflecting on these findings, we believe traditional methods for searching literature left many gaps in our literature review for two primary reasons: (1) many of these works are distributed across several publication venues (e.g., IV, PacificVis, Interact, VAST, TVCG), and (2) many of these papers received relatively little traction since their original publication 5-10 years ago.
4.4 Usage Scenario 4: Getting to Know VIS
Rosa is a new PhD student joining a lab that conducts research in data visualization. To become acquainted with the field, her advisor suggests that Rosa browse through some of the prominent literature in vitaLITy. Upon loading the system, Rosa observes that it contains 59,232 papers in the Paper Collection View. Inspecting the Meta View, she observes those papers are described by 49,278 keywords, written by 82,391 authors from 55 different venues, across 47 years. Among the top keywords are Human-centered Computing and Human Computer Interaction (hci), describing 13,833 and 8,365 papers respectively. The lineage of data visualization becomes apparent to Rosa when she notices that the fifth most common keyword is Computer Graphics, followed by Data Visualization. Other common keywords that catch Rosa’s eye describe topics such as Machine Learning, Information Retrieval, Artificial Intelligence, Interaction Design, and Animation, among others.
Rosa enters Data Visualization as a filter in the Keywords column of the Paper Collection View, then filters to show only papers in the past 10 years to focus on the 2,032 most relevant recent works in the field. Interestingly, these papers appear in a fairly dense area near the center of the Visualization. In the Meta View, she notes a few authors whose names she recognizes, including Kwan-liu Ma who authored 58 of the papers with the keyword Data Visualization since 2010. She also notices Daniel Keim, John T. Stasko, Niklas Elmqvist, and Hanspeter Pfister, among others. She next filters the Paper Collection View to see only John T. Stasko’s papers (80) and removes the other filters (Figure 4a-d). The Meta View reveals that his work is associated with the following keywords: data visualization, visualization, human-center computing, visual analytics, human computer interaction (hci) (a). Some of his common co-authors include Zhicheng Liu, Carsten Gorg, and Youn Ah Kang (b). He publishes primarily at TVCG (21) and VAST (15) (c), with 2007 his most productive year (11 publications) followed by 2008 (10 publications) then 2011, 2012, and 2014 each with 6 publications (d).
5 Evaluation
Based on the final form of vitaLITy, developed from formative feedback with visualization researchers, we next describe the summative evaluation of vitaLITy in a qualitative study. We recruited 6 Computer Science PhD students (1 female, 5 male; avg. 3.3 yrs. into PhD program) whose primary research area is within the field of visualization. None of the participants were involved in the formative study. Sessions lasted approximately 45 minutes. Participation was voluntary with no compensation.
5.1 Task & Procedures
After obtaining informed consent, participants were asked to reflect on a topic for which they had recently or were currently conducting a literature review. vitaLITy was loaded with all 59,232 papers, described in Section 3.1, running locally on the study investigator’s machine. Participants connected to the study virtually via Microsoft Teams. They were asked to recreate or continue their literature review using vitaLITy, which they interacted with by using Microsoft Teams’s “Request Control” feature on the study investigator’s machine. We utilized a think aloud protocol to capture users’ impressions and qualitative feedback on the system. Sessions were screen-recorded for subsequent analysis.
Participants chose the following topics for their literature reviews: multiple comparisons problem, interpretable machine learning, misinformation, network visualization, scrollytelling visualization, and transformation / similarity between two visualizations.
5.2 Findings
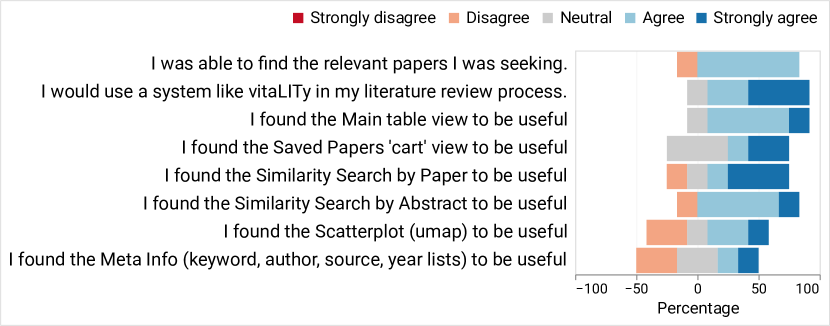
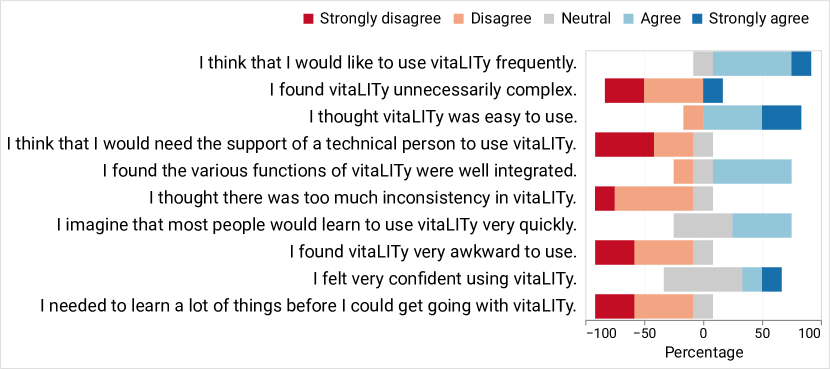
In this section, we discuss qualitative findings from our evaluation of vitaLITy for each of its primary features (Figure 7), and lastly summarize participants’ general impressions of the system (Figure 8).
5.2.1 Paper Collection View
Participants felt that the Paper Collection View was a good “entry point” into the paper corpus in vitaLITy, containing familiar data that users expected to see, e.g., authors, abstracts, etc (S02). Searching by keyword was familiar and produced expected outcomes. For instance, S03 identified some papers previously read as well as an interesting new one, which led them to iterate on their search query to find other papers by the same author.
However, some users expressed the desire for the keyword search features to support more robust or customizable queries. As a case in point, S01 conducted a global search for multiple keyword variations “uncertainty visualisations” “uncertainty visualizations” “uncertainty visualization”, which returned 0, 8, and 49 hits respectively. Fuzzy string matching would be a useful feature to support in subsequent iterations of vitaLITy (S06). Another small usability issue that arose was lack of feedback upon clearing filters. For instance, some participants would backspace to delete text; however, the system would only remove filters by selecting the ‘x’ icon next to the filter (S01, S05). Furthermore, S06 suggested it would be useful for vitaLITy to expand the searchable text beyond titles and abstracts: “Google Scholar searches body text too.”
5.2.2 Similarity Search
By Paper. The ability to start with a seed paper(s) and identify other relevant literature was appreciated, with varying opinions about the quality and relevance of results. Many participants were able to identify interesting and relevant papers; e.g., S04 identified a relevant paper from two key authors that they were not aware had collaborated. S05 indicated a significant finding of a paper that “did something similar to what [they] were considering doing.” Compared to searching by keywords, S05 said “the papers [they are] seeing now are a lot more relevant. Some of these papers [they have] been reviewing. Some of them are kind of new.” S05 later acknowledged the utility of the similarity score: “It seems reasonable… Those on top tended to be more relevant to what [they were] looking for.” S06 commented that the similarity score was good feedback on the precision and quality of the search itself: “some would return like 0.0001 and [they] could see that [their] search was wrong.”
Not all feedback about the similarity search was positive, however. S01 was uncertain about the quality of the results, stating they “could find a few papers that came up that slipped [their] mind, but [they] didn’t find any new papers that [they] hadn’t already cited. […] [they] have some confidence that it would work, but for this particular context, [they] did not find anything new.” In response to some search queries, participants expressed disappointment with the results. For instance, using a single seed paper as input to similarity search, S02 indicated “these do not seem to be good results. The 2-D search does not seem to be good with GloVe. The N-D results were much better.” S02 then added additional papers as input to the similarity search and again noted “some match, but some do not. […] [they] could have expected better search results.” S02 ultimately suggested to explore other transformer embeddings, e.g., BERT.
By Abstract. While not all participants had an abstract prepared to utilize the Similarity Search by Abstract feature, they nonetheless saw value in it. S01, for instance, indicated that if they are “starting a new project […] [they] can write up some words in the form of an abstract to see if this has been done.”
S06 interestingly appropriated the abstract search in response to perceived shortcomings of traditional search features. For instance, after searching by keyword, applying filters, and iteratively revising queries to try to capture multiple keywords, S06 felt dissatisfied with the limitations of searching by keyword in vitaLITy: “Maybe [they] should use word embeddings because it might have more flexibility, and [they] can pass more information in [their] search.” They wrote a quick abstract paragraph during the study session and observed that the results showed “a lot of foundational literature.” They iterated, adding additional details to the abstract and expressed “Wow, this shows much better results now than the short abstract.” By the end of the study session, S06 identified several papers they had already cited as well as a few key new ones: “For 15 minutes, [they] found two papers [they] might be interested in. It’s a really useful process. Otherwise [they] might spend a lot of time scanning PDFs, which is not a very pleasant experience.”
5.2.3 Visualization Canvas
Many participants found the projection visualization of the embedded space to be a useful way to identify conceptually “nearby” relevant papers. S05 suggested the visualization “provides a nice overview of the selected papers, and [they] could see to drill down into more details or look for clusters.” S01 appreciated the ability to select nearby papers in the embedded space via lasso, indicating “It’s like a mystery. [They] feel like if [they] spent some time on this, [they] might stumble upon a paper that was relevant that was published in a different domain […] It might be especially useful if [they] worked on a different topic that [they] had not worked on in the past.” S04 echoed this sentiment and added that the feature to locate a given paper on the visualization was helpful for orienting.
However, this impression was not universal. While S06 appreciated searching by abstract, they preferred to examine results in tabular format, because “personally [they are] not super familiar with these visualizations, dimensionality reduction, so it’s harder to interpret how to assess this information.” S03 was skeptical about the accuracy of the projection, stating “the algorithm might be bad, or the projection. It doesn’t accurately depict similarity between papers.”
Some participants suggested variations, such as spacing out papers in the visualization and connecting them by edges where the weight reflects the similarity with other papers in the visualization (S04). S06 suggested for lasso selection, it would be useful to see “factors that can cluster similar papers.” Furthermore, S04 suggested additional interactivity to filter out papers on different “layers” in the visualization, e.g., those that are part of similarity search, saved papers, etc. S02 suggested a minor tweak: “when [they] do this similarity search, it should automatically zoom to show the paper(s) that were the beginning search point and the papers that it found, rather than this zoomed out view where [they] have to look for the orange or red dots.”
5.2.4 Meta View
The Meta View went relatively unused compared to other features of vitaLITy. However, some participants did express ideas to improve its utility. For instance, S03 expressed that they would have preferred if the Meta View “[did not display] keywords for the stuff above [Paper Collection View], but for what [they] have selected [Similarity Search input, Saved papers].” S05 suggested that the Meta View could offer additional keyword recommendations based on semantically similar keywords, to help users identify other potential search terms. Others indicated a desire for further integration of the Meta View such that selecting a keyword could highlight papers in the visualization (S04) or filter the Paper Collection View (S06).
5.2.5 Saved Papers Cart
The Saved Papers Cart was also not used as often as some of the other views. Some preferred their existing workflow of downloading PDFs directly (S06), while others appreciated the “cart” analogy and the accompanying mindfulness to “fill the cart with relevant papers” (S02) as an alternative to manually maintaining “a word document to keep track of the titles” (S03).
5.2.6 Summary & Workflow
Overall Impressions. Users believed that vitaLITy would be useful in a variety of contexts. Several users believed vitaLITy would be helpful in identifying gaps in their literature review (S01, S04). For instance, S04 indicated “it’s very helpful to actually find a set of papers that are semantically relevant to one paper. If [they] identify a paper that [they] missed in the lit review, [they] can find other papers similar to that one to be sure [they] don’t miss anything else.” Participants felt that it could help avoid “embarassment” of reviewers pointing out missing related work (S01, S06).
While participants generally liked using vitaLITy, several expressed that, given the large number of features, customization of the screen real estate would have been beneficial (S02, S04, S06). For instance, S02 indicated “when [they] had already filtered by keywords, [they are] only focusing on this view [Visualization Canvas]. It’s very small in the screen space. [They] want to hide the Meta View and maybe even the [Paper Collection View], so [they] can easily zoom and pan and lasso. The Similarity Search panel could also be bigger.” Others echoed formative feedback, wanting to see the citation network in vitaLITy, e.g., which papers cite others (S01, S06).
Workflow. Some participants viewed vitaLITy as a complementary component to their existing literature review workflow. For instance, S01 indicated they would “interleave this with a Google Scholar search. If [they] found a few relevant papers, [they] would go to Google Scholar to see the references in that paper and who has cited that paper.” S06 indicated preference to continue their existing approach of beginning a literature review with Google Scholar and use vitaLITy at a later stage of the research, e.g., “when [they] want to do some sanity checks […] [after they] have [their] abstract, papers [they] have already cited, and based on that [they] can do a more narrow search for papers [they] might be missing,” while others preferred to use vitaLITy as early in the lit review process that you are able to “structure the related work sections […] and [identify] those 2-3 themes” (S05).
Others felt that vitaLITy suffered from many of the same problems that existing tooling has. For instance, S01 said “[The] target is one unknown paper among hundreds. A lot of the papers [they] find because coauthors tell [them] about them.” S03 indicated they would use the tool primarily in the same ways as Google Scholar, e.g., “[they] would just search for keywords.”
6 Discussion
Quality of Search Results. Across our (relatively small) sample of participants, there was variability in terms of perceived relevance of Similarity Search results. Some participants felt that, like Google Scholar, relevant results were lost among a sea of irrelevant papers, while others felt that the results were highly relevant. In general, participants perceived results from SPECTER embeddings to be more relevant than GloVe, suggesting that further exploration of alternative transformer-based approaches (e.g., BERT [16], or training a custom model on the target document corpus) could yield better search results. Furthermore, given the disparity in perceived quality and disparity in participants’ perception of when this approach could be useful in their literature review process, future work could develop additional guidelines that assess the specific role of document retrieval based on semantic similarity.
Relevance & Space. Presuming vitaLITy is able to provide serendipitous discovery of relevant literature, the process doesn’t abruptly come to a successful end. Authors still need to manage goals in their writing that may be at odds with one another: i.e., the tradeoff of relevance or salience of related work and the commodity of space. From this perspective, vitaLITy is best viewed as a way to identify critical gaps or serve as kindling for a new literature review. In its current form, vitaLITy shows (1) similarity score, and (2) citation counts as the primary cues of relevance or salience of a given paper. It still requires substantial knowledge from the author to (1) read an abstract or paper and determine its actual relevance to a given topic, and (2) assess the credibility of the work, author(s), and venue. Subsequent versions of vitaLITy could focus on innovating solutions to support these and other parts of the literature review process.
Future Work. Based on our use of vitaLITy and participant feedback, we identify a number of potential future directions. , current similarity scores in the projected 2-D space (UMAP) are based on the reciprocal of the distance measure and might yield different results compared to distances in the N-D embedding space. These scores and their context may not be especially intuitive for users. Hence, future work could refine the similarity score formulation and / or presentation in vitaLITy to provide users an accessible framework to interpret results. , the Saved Papers Cart currently exports a file in JSON format with the papers. At least two improvements could be made within this view, including exporting files in .bibtex format for easy incorporation in LaTeX bibliographies. Furthermore, it could be useful to users to provide a meta analysis of the saved papers, e.g., via topic modeling. How can these papers be summarized?
7 Conclusion
We introduced a visualization system, vitaLITy, designed to promote serendipitous discovery of relevant academic literature. Designed and developed with formative input from data visualization researchers, vitaLITy allows users to search and explore academic literature using a document-level transformer-based approach to identify semantically similar literature. In addition, we contributed a dataset about 59,232 academic articles with metadata (titles, abstracts, authors, keywords, citation counts, etc.) across 38 venues common in data visualization research, along with open-source scrapers to expand and customize the corpus of literature searchable in vitaLITy. We demonstrated how vitaLITy can complement existing academic literature review practices through a series of usage scenarios and shared feedback from 6 data visualization researchers from a qualitative study. Participants expressed excitement to incorporate vitaLITy in their workflow, to identify gaps in their academic literature searches or to kickstart the literature review of a new topic.
References
- [1] A. Abdul-Rahman, G. Roe, M. Olsen, C. Gladstone, R. Whaling, N. Cronk, R. Morrissey, and M. Chen. Constructive visual analytics for text similarity detection. In Computer Graphics Forum, vol. 36, pp. 237–248. Wiley Online Library, 2017.
- [2] E. Alexander, J. Kohlmann, R. Valenza, M. Witmore, and M. Gleicher. Serendip: Topic model-driven visual exploration of text corpora. In 2014 IEEE Conference on Visual Analytics Science and Technology (VAST), pp. 173–182. IEEE, 2014.
- [3] S. Arora, Y. Liang, and T. Ma. A simple but tough-to-beat baseline for sentence embeddings. In 5th International Conference on Learning Representations, ICLR 2017, 2017.
- [4] R. F. Baumeister and M. R. Leary. Writing narrative literature reviews. Review of general psychology, 1(3):311–320, 1997.
- [5] F. Beck, S. Koch, and D. Weiskopf. Visual analysis and dissemination of scientific literature collections with survis. IEEE Transactions on Visualization and Computer Graphics, 22(1):180–189, 2015.
- [6] I. Beltagy, K. Lo, and A. Cohan. Scibert: A pretrained language model for scientific text. In Proceedings of the 2019 Conference on Empirical Methods in Natural Language Processing and the 9th International Joint Conference on Natural Language Processing (EMNLP-IJCNLP), pp. 3606–3611, 2019.
- [7] A. Benito-Santos and R. Therón. Glassviz: Visualizing automatically-extracted entry points for exploring scientific corpora in problem-driven visualization research. arXiv preprint arXiv:2009.02094, 2020.
- [8] P. Bojanowski, E. Grave, A. Joulin, and T. Mikolov. Enriching word vectors with subword information. Transactions of the Association for Computational Linguistics, 5:135–146, 2017.
- [9] R. Chang, C. Ziemkiewicz, T. M. Green, and W. Ribarsky. Defining insight for visual analytics. IEEE Computer Graphics and Applications, 29(2):14–17, 2009.
- [10] C. Chen. Citespace ii: Detecting and visualizing emerging trends and transient patterns in scientific literature. Journal of the American Society for information Science and Technology, 57(3):359–377, 2006.
- [11] I. Cho, R. Wesslen, A. Karduni, S. Santhanam, S. Shaikh, and W. Dou. The anchoring effect in decision-making with visual analytics. IEEE Conference on Visual Analytics Science and Technology (VAST), 2017.
- [12] J.-K. Chou and C.-K. Yang. Papervis: Literature review made easy. In Computer Graphics Forum, vol. 30, pp. 721–730. Wiley Online Library, 2011.
- [13] K. W. Church and J. I. Helfman. Dotplot: A program for exploring self-similarity in millions of lines of text and code. Journal of Computational and Graphical Statistics, 2(2):153–174, 1993.
- [14] A. Cohan, S. Feldman, I. Beltagy, D. Downey, and D. S. Weld. Specter: Document-level representation learning using citation-informed transformers. In Proceedings of the 58th Annual Meeting of the Association for Computational Linguistics, pp. 2270–2282, 2020.
- [15] A. Dattolo and M. Corbatto. Visualbib: narrative views for customized bibliographies. In 2018 22nd International Conference Information Visualisation (IV), pp. 133–138. IEEE, 2018.
- [16] J. Devlin, M.-W. Chang, K. Lee, and K. Toutanova. Bert: Pre-training of deep bidirectional transformers for language understanding. arXiv preprint arXiv:1810.04805, 2018.
- [17] E. Dimara, G. Bailly, A. Bezerianos, and S. Franconeri. Mitigating the attraction effect with visualizations. IEEE transactions on visualization and computer graphics, 25(1):850–860, 2019.
- [18] E. Dimara, A. Bezerianos, and P. Dragicevic. The attraction effect in information visualization. IEEE transactions on visualization and computer graphics, 23(1):471–480, 2017.
- [19] E. Dimara, S. Franconeri, C. Plaisant, A. Bezerianos, and P. Dragicevic. A task-based taxonomy of cognitive biases for information visualization. IEEE transactions on visualization and computer graphics, 2018.
- [20] W. Dou, L. Yu, X. Wang, Z. Ma, and W. Ribarsky. Hierarchicaltopics: Visually exploring large text collections using topic hierarchies. IEEE Transactions on Visualization and Computer Graphics, 19(12):2002–2011, 2013.
- [21] M. El-Assady, R. Sevastjanova, F. Sperrle, D. Keim, and C. Collins. Progressive learning of topic modeling parameters: A visual analytics framework. IEEE transactions on visualization and computer graphics, 24(1):382–391, 2017.
- [22] A. Endert, P. Fiaux, and C. North. Semantic interaction for visual text analytics. Proceedings of the 2012 ACM annual conference on Human Factors in Computing Systems - CHI ’12, pp. 473–482, 2012.
- [23] A. Endert, C. Han, D. Maiti, L. House, S. Leman, and C. North. Observation-level interaction with statistical models for visual analytics. IEEE Conference on Visual Analytics Science and Technology (VAST), pp. 121–130, 2011. doi: 10 . 1109/VAST . 2011 . 6102449
- [24] A. Endert, W. Ribarsky, C. Turkay, B. W. Wong, I. Nabney, I. D. Blanco, and F. Rossi. The state of the art in integrating machine learning into visual analytics. In Computer Graphics Forum, vol. 36, pp. 458–486. Wiley Online Library, 2017.
- [25] C. Felix, S. Franconeri, and E. Bertini. Taking word clouds apart: An empirical investigation of the design space for keyword summaries. IEEE transactions on visualization and computer graphics, 24(1):657–666, 2017.
- [26] M. Freire. Visualizing program similarity in the ac plagiarism detection system. In Proceedings of the working conference on Advanced visual interfaces, pp. 404–407, 2008.
- [27] J. Fuchs, P. Isenberg, A. Bezerianos, and D. Keim. A systematic review of experimental studies on data glyphs. IEEE transactions on visualization and computer graphics, 23(7):1863–1879, 2016.
- [28] D. Gotz, S. Sun, and N. Cao. Adaptive contextualization: Combating bias during high-dimensional visualization and data selection. In Proceedings of the 21st International Conference on Intelligent User Interfaces, pp. 85–95. ACM, 2016.
- [29] F. Heimerl, Q. Han, S. Koch, and T. Ertl. Citerivers: Visual analytics of citation patterns. IEEE transactions on visualization and computer graphics, 22(1):190–199, 2015.
- [30] J. Heyer, N. K. Raveendranath, and K. Reda. Pushing the (visual) narrative: the effects of prior knowledge elicitation in provocative topics. In Proceedings of the 2020 CHI Conference on Human Factors in Computing Systems, pp. 1–14, 2020.
- [31] U. Hinrichs, S. Forlini, and B. Moynihan. Speculative practices: Utilizing infovis to explore untapped literary collections. IEEE transactions on visualization and computer graphics, 22(1):429–438, 2015.
- [32] J. Hullman. Why authors don’t visualize uncertainty. IEEE transactions on visualization and computer graphics, 26(1):130–139, 2019.
- [33] J. Hullman, E. Adar, and P. Shah. Benefitting infovis with visual difficulties. IEEE Transactions on Visualization and Computer Graphics, 17(12):2213–2222, 2011.
- [34] J. Hullman, P. Resnick, and E. Adar. Hypothetical outcome plots outperform error bars and violin plots for inferences about reliability of variable ordering. PloS one, 10(11), 2015.
- [35] P. Isenberg, F. Heimerl, S. Koch, T. Isenberg, P. Xu, C. Stolper, M. Sedlmair, J. Chen, T. Möller, and J. Stasko. vispubdata.org: A metadata collection about IEEE visualization (VIS) publications. IEEE Transactions on Visualization and Computer Graphics, 23(9):2199–2206, Sept. 2017. doi: 10 . 1109/TVCG . 2016 . 2615308
- [36] P. Isenberg, T. Isenberg, M. Sedlmair, J. Chen, and T. Möller. Visualization as seen through its research paper keywords. IEEE Transactions on Visualization and Computer Graphics, 23(1):771–780, 2016.
- [37] J. Johnson, M. Douze, and H. Jégou. Billion-scale similarity search with gpus. arXiv preprint arXiv:1702.08734, 2017.
- [38] D. Jurafsky and J. H. Martin. Speech and language processing : an introduction to natural language processing, computational linguistics, and speech recognition. Pearson Prentice Hall, 2021.
- [39] R. Kiros, Y. Zhu, R. Salakhutdinov, R. S. Zemel, A. Torralba, R. Urtasun, and S. Fidler. Skip-thought vectors. arXiv preprint arXiv:1506.06726, 2015.
- [40] S. V. Kulkarni and S. A. Khaparde. Transformer engineering: design, technology, and diagnostics. CRC press, 2017.
- [41] S. Liu, Y. Chen, H. Wei, J. Yang, K. Zhou, and S. M. Drucker. Exploring topical lead-lag across corpora. IEEE Transactions on Knowledge and Data Engineering, 27(1):115–129, 2014.
- [42] S. Liu, X. Wang, C. Collins, W. Dou, F. Ouyang, M. El-Assady, L. Jiang, and D. A. Keim. Bridging text visualization and mining: A task-driven survey. IEEE transactions on visualization and computer graphics, 25(7):2482–2504, 2018.
- [43] L. McNabb and R. S. Laramee. How to write a visualization survey paper: A starting point. In Eurographics 2019-Education Papers. The Eurographics Association, 2019.
- [44] T. Mikolov, K. Chen, G. Corrado, and J. Dean. Efficient estimation of word representations in vector space. arXiv preprint arXiv:1301.3781, 2013.
- [45] D. Moher, A. Liberati, J. Tetzlaff, D. G. Altman, P. Group, et al. Preferred reporting items for systematic reviews and meta-analyses: the prisma statement. PLoS medicine, 6(7):e1000097, 2009.
- [46] R. Nakazawa, T. Itoh, and T. Saito. Analytics and visualization of citation network applying topic-based clustering. Journal of Visualization, 21(4):681–693, 2018.
- [47] A. Narechania, A. Coscia, E. Wall, and A. Endert. Lumos: Increasing awareness of analytic behavior during visual data analysis. IEEE Transactions on Visualization and Computer Graphics, 2021. To appear.
- [48] A. Narechania, A. Karduni, R. Wesslen, and E. Wall. VitaLITy: A Dataset of Academic Articles. 3 2021. doi: 10 . 6084/m9 . figshare . 14329151 . v1
- [49] D. Park, S. Kim, J. Lee, J. Choo, N. Diakopoulos, and N. Elmqvist. Conceptvector: text visual analytics via interactive lexicon building using word embedding. IEEE transactions on visualization and computer graphics, 24(1):361–370, 2017.
- [50] J. Pennington, R. Socher, and C. D. Manning. Glove: Global vectors for word representation. In Proceedings of the 2014 conference on empirical methods in natural language processing (EMNLP), pp. 1532–1543, 2014.
- [51] M. E. Peters, M. Neumann, M. Iyyer, M. Gardner, C. Clark, K. Lee, and L. Zettlemoyer. Deep contextualized word representations. arXiv preprint arXiv:1802.05365, 2018.
- [52] N. Reimers and I. Gurevych. Sentence-BERT: Sentence embeddings using Siamese BERT-networks. In Proceedings of the 2019 Conference on Empirical Methods in Natural Language Processing and the 9th International Joint Conference on Natural Language Processing (EMNLP-IJCNLP), pp. 3982–3992. Association for Computational Linguistics, Hong Kong, China, Nov. 2019. doi: 10 . 18653/v1/D19-1410
- [53] J. Ritchie, D. Wigdor, and F. Chevalier. A lie reveals the truth: Quasimodes for task-aligned data presentation. In Proceedings of the 2019 CHI Conference on Human Factors in Computing Systems, pp. 1–13, 2019.
- [54] R. C. Roberts and R. S. Laramee. Visualising business data: A survey. Information, 9(11):285, 2018.
- [55] M. Smuc. Just the other side of the coin? from error to insight analysis. Information Visualization, 15(4):312–324, 2016.
- [56] H. Snyder. Literature review as a research methodology: An overview and guidelines. Journal of Business Research, 104:333–339, 2019.
- [57] L.-H. Teo, B. John, and M. Blackmon. Cogtool-explorer: A model of goal-directed user exploration that considers information layout. In Proceedings of the SIGCHI conference on human factors in computing systems, pp. 2479–2488, 2012.
- [58] The dblp team. dblp computer science bibliography. Monthly snapshot release of November 2020.
- [59] C. Tong, R. Roberts, R. Borgo, S. Walton, R. S. Laramee, K. Wegba, A. Lu, Y. Wang, H. Qu, Q. Luo, et al. Storytelling and visualization: An extended survey. Information, 9(3):65, 2018.
- [60] R. J. Torraco. Writing integrative literature reviews: Guidelines and examples. Human resource development review, 4(3):356–367, 2005.
- [61] A. Tversky and D. Kahneman. Judgment under uncertainty: Heuristics and biases. Science, 185:1124–1131, 1974.
- [62] A. C. Valdez, M. Ziefle, and M. Sedlmair. Priming and anchoring effects in visualization. IEEE Transactions on Visualization and Computer Graphics, 24(1):584–594, 2018.
- [63] A. Vaswani, N. Shazeer, N. Parmar, J. Uszkoreit, L. Jones, A. N. Gomez, L. Kaiser, and I. Polosukhin. Attention is all you need. arXiv preprint arXiv:1706.03762, 2017.
- [64] E. Wall, A. Arcalgud, K. Gupta, and A. Jo. A markov model of users’ interactive behavior in scatterplots. In 2019 IEEE Visualization Conference (VIS), pp. 81–85. IEEE, 2019.
- [65] E. Wall, L. Blaha, C. Paul, and A. Endert. A formative study of interactive bias metrics in visual analytics using anchoring bias. In IFIP Conference on Human-Computer Interaction, pp. 555–575. Springer, 2019.
- [66] E. Wall, L. M. Blaha, L. Franklin, and A. Endert. Warning, bias may occur: A proposed approach to detecting cognitive bias in interactive visual analytics. In 2017 IEEE Conference on Visual Analytics Science and Technology (VAST), pp. 104–115. IEEE, 2017.
- [67] E. Wall, L. M. Blaha, C. L. Paul, K. Cook, and A. Endert. Four perspectives on human bias in visual analytics. In Cognitive biases in visualizations, pp. 29–42. Springer, 2018.
- [68] E. Wall, A. Narechania, A. Coscia, J. Paden, and A. Endert. Left, right, and gender: Exploring interaction traces to mitigate human biases. IEEE Transactions on Visualization and Computer Graphics, 2021. To appear.
- [69] E. Wall, J. Stasko, and A. Endert. Toward a design space for mitigating cognitive bias in vis. In 2019 IEEE Visualization Conference (VIS), pp. 111–115. IEEE, 2019.
- [70] Y. Wang, M. Yu, G. Shan, H.-W. Shen, and Z. Lu. Vispubcompas: a comparative analytical system for visualization publication data. Journal of Visualization, 22(5):941–953, 2019.
- [71] R. Wesslen, S. Santhanam, A. Karduni, I. Cho, S. Shaikh, and W. Dou. Investigating effects of visual anchors on decision-making about misinformation. In Computer Graphics Forum, vol. 38, pp. 161–171. Wiley Online Library, 2019.
- [72] J. Wilkins, J. Järvi, A. Jain, G. Kejriwal, A. Kerne, and V. Gumudavelly. Evolutionworks. In IFIP Conference on Human-Computer Interaction, pp. 213–230. Springer, 2015.
- [73] T. Yoon, H. Han, H. Ha, J. Hong, and K. Lee. A conference paper exploring system based on citing motivation and topic. In 2020 IEEE Pacific Visualization Symposium (PacificVis), pp. 231–235. IEEE, 2020.
- [74] Y. Zhang, R. K. Bellamy, and W. A. Kellogg. Designing information for remediating cognitive biases in decision-making. In Proceedings of the 33rd annual ACM conference on human factors in computing systems, pp. 2211–2220, 2015.