The first nova eruption in a novalike variable: YZ Ret as seen in X-rays and -rays
Abstract
Peaking at 3.7 mag on 2020 July 11, YZ Ret was the second-brightest nova of the decade. The nova’s moderate proximity (2.7 kpc, from Gaia) provided an opportunity to explore its multi-wavelength properties in great detail. Here we report on YZ Ret as part of a long-term project to identify the physical mechanisms responsible for high-energy emission in classical novae. We use simultaneous Fermi/LAT and NuSTAR observations complemented by XMM-Newton X-ray grating spectroscopy to probe the physical parameters of the shocked ejecta and the nova-hosting white dwarf. The XMM-Newton observations revealed a super-soft X-ray emission which is dominated by emission lines of C v, C vi, N vi, N vii, and O viii rather than a blackbody-like continuum, suggesting CO-composition of the white dwarf in a high-inclination binary system. Fermi/LAT detected YZ Ret for 15 days with the -ray spectrum best described by a power law with an exponential cut-off at GeV. In stark contrast with theoretical predictions and in keeping with previous NuSTAR observations of Fermi-detected classical novae (V5855 Sgr and V906 Car), the 3.5-78 keV X-ray emission is found to be two orders of magnitude fainter than the GeV emission. The X-ray emission observed by NuSTAR is consistent with a single-temperature thermal plasma model. We do not detect a non-thermal tail of the GeV emission expected to extend down to the NuSTAR band. NuSTAR observations continue to challenge theories of high-energy emission from shocks in novae.
keywords:
stars: novae, cataclysmic variables – stars: white dwarfs – stars: individual: YZ Ret1 Introduction
1.1 Classical and dwarf novae
Accreting white dwarf binaries are called cataclysmic variables when the donor is at or near the main sequence, or symbiotic for a giant donor. Many of them display two distinct types of violent phenomena that dramatically increase their brightness (Hellier, 2001; Warner, 2003; Knigge et al., 2011): classical nova eruptions (powered by nuclear burning on the white dwarf surface) and dwarf nova outbursts (occurring in the accretion disc). Nova eruptions may strongly affect the evolutionary path of those binaries (Schenker et al., 1998; Nelemans et al., 2016; Ginzburg & Quataert, 2021).
The nova eruption results from a thermonuclear runaway at the bottom of a hydrogen-rich shell of material accreted on to the white dwarf (Bode & Evans, 2008; Starrfield et al., 2016). Novae reach optical peak absolute magnitudes in the range to mag (Shafter, 2017) and are observed across the electromagnetic spectrum from GeV -rays to cm-band radio (see the recent reviews by Poggiani, 2018; Della Valle & Izzo, 2020; Chomiuk et al., 2021). The less dramatic (peak absolute magnitudes ; Patterson 2011), but much more frequent, phenomenon is the dwarf nova outburst. A dwarf nova occurs when the accretion disc surrounding a white dwarf switches from a low-viscosity, low-accretion-rate state to a high-viscosity, high-accretion-rate state (Osaki 2005; Hameury 2020; see also § 2.2.1 of Done et al. 2007). Dwarf novae are prominent X-ray sources (Byckling et al., 2010) and faint radio emitters (Coppejans et al., 2016).
The link between classical and dwarf novae has long been established by the similarities of the white dwarf hosting binaries where these phenomena occur. It is believed that all cataclysmic variables accreting below the rate needed to sustain stable hydrogen burning on the white dwarf (Kato, 2010; Wolf et al., 2013) periodically display nova eruptions (e.g. Shara, 1989; Patterson et al., 2013; Hillman et al., 2020). It is expected that most observed novae erupt in systems with a high mass transfer rate. Such systems tend to have long periods above the 2–3 h period gap where the mass transfer is presumably driven by the magnetic braking mechanism (Verbunt, 1984; Howell et al., 2001). The magnetic braking may be more efficient than the gravitational wave radiation driving the evolution of white dwarf binaries below the period gap. The typical high mass accretion rate allows white dwarfs in long-period systems to quickly accumulate mass needed for the next nova eruption (Yaron et al., 2005), however with the exception of 10 known recurrent novae (Schaefer, 2010), all other novae in the Milky Way recur on time-scales years.
Old nova shells are found around some dwarf novae (Shara et al. 2007, 2012; Miszalski et al. 2016; Bond & Miszalski 2018; Bond 2020; Denisenko 2020; but not others – Schmidtobreick et al. 2015). Some systems show dwarf nova outbursts after a classical nova eruption: Nova Per 1901 (GK Per; e.g. Evans et al., 2009), Nova Ser 1903 (X Ser; Šimon, 2018), Nova Sgr 1919 (V1017 Sgr; Salazar et al., 2017), Nova Cen 2005 (V1047 Cen; Geballe et al., 2019; Aydi et al., 2021), Nova Oph 1954 (V908 Oph, OGLE-BLG-DN-0023; Tappert et al., 2016; Mróz et al., 2015), Nova Her 1960 (V446 Her; Honeycutt et al., 2011) and the historical Nova Sco 1437 (Shara et al., 2017) and Nova Lyn 101 (BK Lyn; Patterson et al., 2013). The first four systems show long-lasting outbursts that notably differ from those of ordinary dwarf novae. It is debated if some of these outbursts may be related to symbiotic outbursts, called ZAND-type according to the General Catalogue of Variable Stars (GCVS; Samus’ et al., 2017) classification scheme111http://www.sai.msu.su/gcvs/gcvs/iii/vartype.txt. ZAND-type outbursts are probably partly powered by nuclear burning (Sokoloski et al., 2006). Some old novae show low-amplitude ‘stunted’ outbursts, but it is unclear if they are driven by the same disc instability mechanism as dwarf novae (Honeycutt et al., 1998; Vogt et al., 2018). The archival data revealed that V1017 Sgr and V1213 Cen (Mróz et al., 2016) were showing dwarf nova outbursts prior to the nova eruption when the variability of these objects was discovered (a few other objects displayed brightness variations prior to nova eruption, but the nature of these variations is uncertain; Collazzi et al. 2009).
YZ Ret, the subject of this paper, is only the third classical (rather than recurrent) nova eruption observed in a previously known white dwarf hosting binary. The previous cases were the symbiotic (giant donor) system V407 Cyg (Munari et al., 2011) and V392 Per (Darnley & Starrfield, 2018; Chochol et al., 2021). Both V407 Cyg and V392 Per were detected as prominent GeV (Abdo et al., 2010; Li et al., 2018), X-ray (Nelson et al., 2012; Darnley et al., 2018) and radio sources (Chomiuk et al., 2012; Giroletti et al., 2020; Linford et al., 2018). Recently, V1405 Cas became the fourth previously known variable showing a nova eruption (Taguchi et al., 2021).
1.2 YZ Ret as Nova Reticuli 2020
The first low-resolution spectra of YZ Ret (under the name EC 035725455) were obtained on 1992-12-19 and 1994-01-15. The South African Astronomical Observatory 1.9-m telescope was used together with the Reticon spectrograph by Kilkenny et al. (2015) in the framework of the Edinburgh-Cape Blue Object Survey. The spectra covering 3400–5400 Å were described as ‘broad Balmer; He I ?’ and at the time, the object was not recognized as a cataclysmic variable222To the best of our knowledge, this is only the second example of a pre-eruption spectrum of a classical (non-symbiotic, non-recurrent) nova, the other being V392 Per (Liu & Hu, 2000).. They are dominated by a blue continuum with superimposed broad high-order Balmer absorption lines and weak H absorption (probably filled with emission). Such absorption line-dominated spectra are seen in some novalike variables and dwarf novae in outburst, for example RW Sex (Cowley & MacConnell, 1972).
The variability of YZ Ret was first noted in August 2019 by Gabriel Murawski, who investigated archival photometry from the Siding Spring Survey (the southern counterpart of the Catalina Sky Survey; Drake et al., 2009) and the All-Sky Automated Survey for Supernovae (ASAS-SN; Shappee et al., 2014; Kochanek et al., 2017) and reported this object to the International Variable Star Index maintained by the American Association of Variable Star Observers (AAVSO VSX333https://www.aavso.org/vsx/) under the name MGAB-V207. The object displayed fast irregular variations in the range 15.8–16.9 mag with two noticeable fadings down to 17.2 mag and 18.0 mag (unfiltered magnitudes with V zero-point). These fadings suggested the object is an ‘antidwarf nova’ – a VY Scl type cataclysmic variable (Leach et al., 1999; Hameury & Lasota, 2002; Honeycutt & Kafka, 2004). Unlike the ordinary dwarf novae that spend most of their time around minimum light (low accretion rate – ‘cold accretion disc’ state), VY Scl type systems spend most of their time near maximum (higher accretion rate – ‘hot accretion disc’) dropping to the minimum light only occasionally. Together with the similar non-magnetic cataclysmic variables that always maintain a hot accretion disc (UX UMa and SW Sex stars), VY Scl systems are referred to as novalike variables (Dhillon, 1996). An explanation of the VY Scl fading phenomenon solely in terms of variable mass transfer from the donor (without relying on disc instability) is discussed in the literature (Hellier & Naylor, 1998; Honeycutt & Kafka, 2004).
McNaught (2020) noticed a 5 mag object coinciding with YZ Ret on digital single-lens reflex camera images obtained on 2020-07-15.590 UT (§ 2.4) and reported the nova candidate to the Central Bureau for Astronomical Telegrams444http://www.cbat.eps.harvard.edu/index.html. Pre-discovery all-sky images by M. A. Phillips show the nova peaking on 2020-07-11.76 ( d, is defined below) at 3.7 mag (Kaufman et al., 2020), while pre-discovery ASAS-SN images indicate the eruption started on 2020-07-08.171 (). The nova was also detected by Gaia Photometric Science Alerts on d as Gaia20elz555http://gsaweb.ast.cam.ac.uk/alerts/alert/Gaia20elz/. The pre-eruption Gaia lightcurve spanning d to d showed irregular variations in the range –.
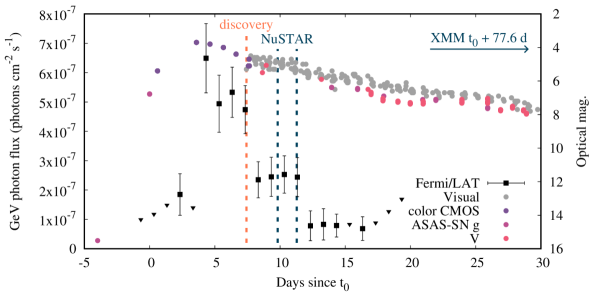
The fact that the naked-eye transient went unnoticed by the astronomical community for about a week is alarming in light of our preparedness for observing the next Galactic supernova (Adams et al., 2013). Existing surveys relying on image subtraction for transient detection should implement special procedures for handling new saturated sources. Regular wide-field imaging of the sky (by both professional and amateur astronomers) aimed at detecting rare bright transients should be encouraged. To the best of our knowledge, only two Galactic novae have first been discovered at wavelengths other then optical or infrared (De et al., 2021): V959 Mon first found in -rays by Fermi/LAT (Cheung et al., 2012) and V598 Pup discovered as an X-ray transient by XMM-Newton (Read et al., 2008). YZ Ret itself was a -ray transient with a daily flux of photons cm-2 s-1 (Fig. 1) for three days prior to its optical discovery, but wasn’t noticed.
Spectroscopic observations by Kaufman et al. (2020), Aydi et al. (2020c), Carr et al. (2020), Izzo et al. (2020), Galan & Mikolajewska (2020), Sitko et al. (2020) confirmed the optical transient to be a classical nova past the optical peak. YZ Ret was assigned its permanent GCVS designation following the nova eruption (Kazarovets et al., 2020). While Kaufman et al. (2020) describe the spectrum obtained on d as that of a Fe II-type nova (according to the classification scheme of Williams, 1992), Carr et al. (2020) report He/N-type based on a series spectra obtained on d with the Australian National University 2.3-m telescope. From an over-abundance of oxygen and the presence of [Ne iii] 3342 Å and [Ne v] 3426 Å lines in the Very Large Telescope/Ultraviolet and Visual Echelle Spectrograph spectrum obtained on d, Izzo et al. (2020) conclude that the nova erupted on an ONe white dwarf (cf. § 3.10). McLoughlin et al. (2021a) describe their exceptionally dense monitoring of the line profile evolution in YZ Ret, while Rudy et al. (2021) report late-time infrared spectroscopy.
YZ Ret was detected on d in the GeV band by the Large Area Telescope (LAT) on the Fermi Gamma-Ray Space Telescope (Li et al. 2020b; § 2.1) and on d at hard X-rays by NuSTAR (Sokolovsky et al. 2020b; § 2.2.1). By 2020-08-04 ( d) the emission at the softer 0.3–10 keV X-ray band was detected by Swift/XRT. On d the soft counts at the XRT band started rising dramatically signifying the appearance of the super-soft-source (SSS; Sokolovsky et al., 2020c). The super-soft emission was also observed on d with the NICER instrument (0.24–10 keV) aboard the International Space Station by Pei et al. (2020) who noted aperiodic variations in the X-ray flux with the amplitude of about 8 per cent on a time-scale of kiloseconds. X-ray grating spectroscopy of YZ Ret was obtained with Chandra by Drake et al. (2020) on d. YZ Ret was also detected as a faint cm-band radio source at d (Gulati et al., 2022) Schaefer (2021) report the pre-eruption orbital period of d for YZ Ret based on TESS optical photometry.
1.3 YZ Ret position, distance and Galactic extinction
The Gaia DR2 (Gaia Collaboration et al., 2018) lists the position of YZ Ret measured at the mean epoch of 2015.5:
03:58:29.56 -54:46:41.2 J2000
with the proper motion of and mas yr-1 in R.A. and Dec. directions, respectively. The Gaia DR2 parallax of mas corresponds to the distance of pc according to Bailer-Jones et al. (2018). The distance may be underestimated without correction of the apparent motion around the common centre of mass of the binary.
We are lucky to have the trigonometric parallax for YZ Ret, as progenitors of many other novae lack Gaia parallaxes due to their faintness. Schaefer (2018) estimates that Gaia provides reliable parallaxes for less than 20 per cent of the known novae. In fact, Schaefer (2018) reports Gaia parallaxes of 41 novae, 9 per cent of the 464 novae666https://github.com/Bill-Gray/galnovae known at the time when that paper was submitted. For YZ Ret, both its relative proximity and intrinsic brightness (the pre-nova was in the hot accretion disc state; § 1.2) helped secure the parallax measurement. However, the distance uncertainty remains the main contributor to the uncertainty in luminosity of YZ Ret. YZ Ret is located 1.9 kpc above the Galactic plane at Galactic coordinates , , so it is likely associated with the Milky Way’s thick disc.
The interstellar reddening towards the nova can be estimated from multicolour photometry, assuming a typical intrinsic colour of when the nova is two magnitudes below its peak (the dispersion of is mag; van den Bergh & Younger, 1987). According to photometry reported by A. Valvasori to AAVSO, on 2020-07-16.817 (JD 2459047.317) YZ Ret had and . Therefore, the colour excess is , which for the standard value of the ratio corresponds to mag. This is consistent with derived from the infrared spectroscopy by Rudy et al. (2021). Given the uncertainty in photometry and the scatter of nova intrinsic colours, the foreground reddening/absorption are consistent with zero.
We can estimate the expected Galactic X-ray absorbing column to YZ Ret using the relation of Güver & Özel (2009):
| (1) |
A small positive value of (and hence ) seems like a better estimate than the hard limit of zero. We adopt the above value for the X-ray spectral analysis (§ 2.2.1). The adopted value is close to the total Galactic H i column in that direction estimated from radio observations of the 21 cm hydrogen line: cm-2 (Kalberla et al., 2005; Bajaja et al., 2005). The 21 cm-derived column density does not account for ionized and molecular hydrogen, while the abundances of X-ray absorbing atoms are normalized to the total number of hydrogen atoms. However, these contributions are small and values are often taken as estimates of the total for the purpose of calculating the X-ray absorbing column. Izzo et al. (2020) used the Ferlet et al. (1985) relation between the column density of Na i (derived from high-resolution optical spectroscopy) and to find for YZ Ret, an order of magnitude lower than what we adopt.
1.4 Novae in -rays and X-rays
High energy emission of novae may be produced by various mechanisms. It has long been predicted that decay of radioactive nuclei produced in nova nucleosynthesis should emit lines in the MeV band (Hernanz, 2014; Jose, 2016). The 511 keV electron-positron annihilation line should also be present. Comptonization will produce continuum emission at energies below each of these lines. The MeV emission from novae has never been observed as the coded aperture mask telescopes currently operating in the MeV band (SPI and IBIS aboard INTEGRAL) are probably sufficiently sensitive to detect only a very nearby nova at a distance kpc, as hinted by the ongoing searches (Hernanz et al., 2002; Siegert et al., 2018).
Another predicted phenomenon, that remained unobserved until very recently, is the thermal emission from the fireball produced by the thermonuclear runaway. Within a few seconds of the onset of the thermonuclear runaway at the bottom of the accreted envelope, the convection turns on which transports the heat and decaying radioactive nuclei to the white dwarf surface (Krautter, 2008; Starrfield et al., 2016). The result is the extreme heating and expansion of the outer layers of the white dwarf. As the fireball expands, its emission peak shifts from soft X-rays to UV and then to the optical band (Schwarz et al., 2001; Krautter, 2002; Ness et al., 2007a). Despite the ongoing searches (Morii et al., 2016; Kato et al., 2016), no unambiguous detection of the fireball has been reported until now (Morii et al., 2013; Li et al., 2012). While this manuscript was in review, (König et al., 2022) presented early Spektr-RG/eROSITA observations of YZ Ret that signified the first clear detection of the nova fireball.
Optically thick thermal emission from the heated atmosphere of the hydrogen-burning white dwarf becomes visible again when the nova ejecta become transparent enough to soft X-rays (SSS phase; Hasinger, 1994; Kahabka & van den Heuvel, 1997; Schwarz et al., 2011). According to the modelling by Wolf et al. (2013), the post-nova white dwarf atmosphere temperature is k keV, while observationally emission at keV is usually considered super-soft.
Shock waves are invoked to explain GeV and hard X-ray emission of novae, as well as synchrotron radio emission and high excitation lines in optical spectra. Shocks compress and heat plasma to X-ray temperatures (e.g. Zel’dovich & Raizer, 1967). The shock-heated plasma gives rise to the optically thin thermal emission at energies 1 keV observed in many novae (Metzger et al., 2014; Mukai et al., 2014; Mukai, 2017; Gordon et al., 2021). Shocks can also amplify any pre-existing magnetic field and use it to accelerate charged particles to high energies (Blandford & Ostriker, 1978; Schure et al., 2012). The relativistic particles may emit synchrotron radio as well as high-energy radiation. Depending on the balance between the acceleration efficiency and energy losses, electrons or protons may be the primary particles producing -rays via leptonic or hadronic mechanisms (Metzger et al., 2015; Martin et al., 2018). In the leptonic scenario electrons are the primary accelerated particles that produce -rays via bremsstrahlung and inverse Compton scattering of ambient as well as their own synchrotron photons. In the hadronic scenario, most of the -ray flux arises from the decay of pions produced in interactions of high-energy protons with the surrounding ions and photons. The secondary electron/positron pairs from charged pion decay also contribute to the -ray emission via inverse Compton scattering and bremsstrahlung (Vurm & Metzger, 2018). The same mechanisms are believed to be responsible for the high-energy emission of blazars777Blazars are active galactic nuclei with relativistic jets pointing close to the line of sight. The majority of extragalactic GeV sources are blazars., except interactions with matter (bremsstrahlung, proton-proton collisions) are expected to be less important in blazar jets than interactions of high-energy particles with photons and the external magnetic field (Böttcher et al., 2013; Cerruti, 2020).
As of August 2021, GeV emission has been detected from 18 novae: the list of Gordon et al. (2021), plus V3890 Sgr (Buson et al., 2019), V1707 Sco (Li et al., 2019), YZ Ret (§ 2.1), V1405 Cas (Buson et al., 2021), V1674 Her (Li, 2021)888https://asd.gsfc.nasa.gov/Koji.Mukai/novae/latnovae.html. Franckowiak et al. (2018) list V679 Car and V1535 Sco as low-significance detections. The -ray properties of novae were investigated by Ackermann et al. (2014), Cheung et al. (2016), Li et al. (2017), Aydi et al. (2020a), Li et al. (2020a), Chomiuk et al. (2021).
1.5 Scope of this work
We analyse simultaneous GeV -ray (0.1–300 GeV from Fermi/LAT; § 2.1) and hard X-ray (3–79 keV from NuSTAR; § 2.2.1) observations of the 2020 classical nova eruption of YZ Ret, complemented by X-ray grating spectroscopy with XMM-Newton at a later epoch when the nova became bright in the 0.2–10 keV band (§ 2.3). We measure the -ray to X-ray flux ratio and use it to constrain the -ray emission mechanism (§ 3.4). We conclude that the hard X-ray emission observed by NuSTAR is thermal, based on its spectral shape and speculate about the possible locations of shocks responsible for the high-energy emission (§ 3.6). The trigonometric parallax from Gaia DR2 (§ 1.3) allows us to accurately determine the -ray, X-ray and optical luminosity of the nova. The paper at hand is a continuation of work by Nelson et al. (2019) and Sokolovsky et al. (2020a) building a sample of novae simultaneously detected by NuSTAR and Fermi/LAT with the aim to characterize shocks in novae.
Throughout this paper we report uncertainties at the level. For power law emission, we use the positively-defined spectral index (commonly used in radio astronomy): where is the spectral flux density and is the frequency; the corresponding index in the distribution of the number of photons as a function of energy (used in high-energy astronomy) is , where is the photon index and . The same power law expressed in spectral energy distribution units (SED, commonly used in multiwavelength studies and in theoretical studies; Gehrels 1997) is . Throughout the text we use the terms ‘GeV novae’ and ‘-ray novae’ interchangeably implying the novae detected in the Fermi/LAT band (0.1–300 GeV). All novae may produce GeV -rays, so ‘-ray novae’ are unlikely to be a distinct class and are only the nearest and/or most luminous novae that we can detect.
2 Observations and analysis
2.1 Fermi/LAT observations
Fermi/LAT is a pair-conversion telescope sensitive to -rays in the range 20 MeV–300 GeV with a field of view of 2.4 sr (Atwood et al., 2009; Abdo et al., 2009; Ackermann et al., 2012). Earlier in the mission, Fermi/LAT performed a nearly-uniform all-sky survey every day. The pointing pattern had to be modified after the solar panel drive failure on 2018-03-16, resulting in a non-uniform exposure over the sky.
We downloaded the Fermi/LAT photon data centred on YZ Ret (search radius: 20 degrees; energy range: 50 MeV–300 GeV; data version: P8R3_SOURCE_V2 Bruel et al. 2018) from the LAT Data Server at the Fermi Science Support Center999https://fermi.gsfc.nasa.gov/ssc/data/. Fermitools 1.2.23 with fermitools-data 0.18 was used to reduce and analyse the -ray data. We performed the binned analysis with a -ray emission model file of the field based on the Fermi Large Area Telescope fourth source catalogue (4FGL; Abdollahi et al. 2020; gll_psc_v22.fit). The model file includes all the 4FGL sources found within 30 degrees from the target. For nearby sources that are within 10 degrees from the nova, we freed the normalization parameters to minimize possible contamination. In addition to the catalogued sources, two background emission components, the Galactic (gll_iem_v07) and isotropic (iso_P8R3_SOURCE_V2_v1) diffuse emission, were adopted.
First, we performed a preliminary analysis in the 100 MeV–300 GeV energy range to determine the -ray active period of YZ Ret (the normalization parameters of all the 4FGL sources in the model file were temporarily fixed to save computational time). Assuming a simple power law -ray spectrum for YZ Ret, we performed analysis with one-day binning in time from 2020-06-30 00:00 to 2020-08-04 00:00 UT (MJD 59030.0–59065.0; to d) to obtain the -ray lightcurve (Fig. 1). With a threshold set at the test statistic (Mattox et al., 1996) (detection significance ), the analysis gives a detection interval from 2020-07-10 to 2020-07-25 (MJD 59040.0–59055.0; to d). Using the LAT data taken in this interval, we tried to fit the photon data with two spectral models for YZ Ret: a simple power law and a power law with an exponential cut-off, Eq. (2). Both models result in significant detection with (power law) and (exponential cut-off power law). A likelihood-ratio test suggests that the exponential cut-off power law is preferred with a significance of . The -ray lightcurve was then updated based on the new exponentially cut-off power law spectral model (except for the normalization parameters of YZ Ret and the background components, all spectral parameters were fixed).
Figure 1 presents the daily Fermi/LAT lightcurve of YZ Ret constructed with the simple power law model. If the source was detected with in a daily integration, its derived photon flux was treated as an upper limit. The -ray emission is first detected () on 2020-07-10 ( d), peaks two days later ( d) at photons cm-2 s-1, equivalent to the 0.1–300 GeV peak energy flux of erg cm-2 s-1, then gradually fades, being last detected on 2020-07-24 ( d).
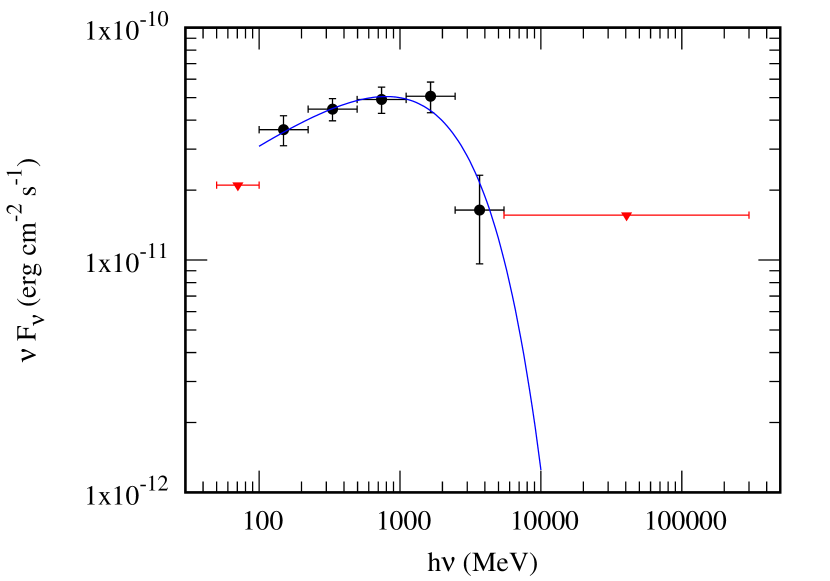
We then analysed Fermi/LAT data collected simultaneously with the NuSTAR observation: 2020-07-17 23:36 – 2020-07-19 10:46 UT (MJD 59047.98–59049.45; – d). YZ Ret is clearly detected in this time interval with and 100 MeV–300 GeV photon flux of photons cm-2 s-1, equivalent to the energy flux of erg cm-2 s-1. We adopted the power law with an exponential cut-off model for the -ray spectrum. The monochromatic flux at 100 MeV derived from this model using Eq. (3) is erg cm-2 s-1. The accuracy of Fermi/LAT absolute calibration at 100 MeV is about 5 per cent (Ackermann et al., 2012).
Fig. 2 presents the Fermi/LAT SED integrated over the whole two-week -ray activity phase (all days with ). The 0.1–300 GeV spectrum (number of photons per unit energy) is approximated with the power law with an exponential cut-off at high energy:
| (2) |
where photons MeV-1 cm-2 s-1 (fitted) at MeV (fixed), (fitted) and the cut-off energy MeV (fitted). In monochromatic flux (SED) units (§ 1.5) the same relation translates to
| (3) |
where is the conversion factor from MeV to erg. This relation is useful if the monochromatic flux is expressed in ergs (the energy and photon fluxes are measured per unit area) while the photon energy and the corresponding constants, , are expressed in MeV ( is in photons MeV-1 cm-2 s-1) according to the Fermitools convention.
As YZ Ret is far from the Galactic plane (§ 1.3) where contamination at MeV from the Galactic diffuse emission is limited, the low-energy LAT data of 50–100 MeV (which is usually unusable due to the huge Galactic background) were also analysed. Despite the low noise level, the nova was undetected in this low energy band (). We computed a 95 per cent upper limit in this band, which is around erg cm-2 s-1. However, because of the low collecting area of Fermi/LAT in this energy range, the limit should be used with caution. We used a ‘flat’ power-law () to derive the photon flux or its upper limit in each energy bin when reconstructing the Fermi/LAT SED of YZ Ret.
The model is fit to the 100 MeV–300 GeV photon data using the maximum likelihood technique (Mattox et al., 1996). The fitting result is compared to the Fermi/LAT SED in Fig. 2. The upper limit on the 50–100 MeV photon flux suggests that the spectrum might be departing from the power law below 100 MeV (Fig. 2). The 0.1–300 GeV photon flux integrated over the whole -ray activity phase is photons cm-2 s-1 equivalent to the energy flux of erg cm-2 s-1.
| Mission | ObsID | PI | Exposure | Date | |
|---|---|---|---|---|---|
| Pointed observations | |||||
| NuSTAR | 80601317002 | Sokolovsky | 66 ks | 2020-07-17 | d |
| XMM-Newton | 0871010101 | Sokolovsky | 28 ks | 2020-09-23 | d |
| Slew exposures | |||||
| ROSAT | Survey | 0.5 ks | 1990-07-11 | d | |
| XMM-Newton | 9042100004 | 0.005 ks | 2002-03-28 | d | |
| XMM-Newton | 9099800003 | 0.007 ks | 2005-05-22 | d | |
| XMM-Newton | 9175600004 | 0.004 ks | 2009-07-12 | d | |
| XMM-Newton | 9272700003 | 0.002 ks | 2014-10-30 | d | |
| XMM-Newton | 9350700002 | 0.010 ks | 2019-02-01 | d | |
| XMM-Newton | 9384600002 | 0.005 ks | 2020-12-08 | d | |
| XMM-Newton | 9389300003 | 0.009 ks | 2021-03-13 | d | |
2.2 NuSTAR observations
NuSTAR (Harrison et al., 2013) is equipped with a pair of identical focusing X-ray telescopes sensitive to hard X-ray photons with energies 3–79 keV (Madsen et al., 2015). It is in a low-Earth orbit, so the observations are periodically interrupted by Earth occultations and the South Atlantic Anomaly (e.g. Heirtzler, 2002) passages.
NuSTAR observed YZ Ret between 2020-07-17 23:36 and 2020-07-19 10:46 UT ( d; ObsID 80601317002; PI: Sokolovsky) for a total exposure of 66 ks (see Table 1 for a summary of X-ray observations). The preliminary analysis of this observation was reported by Sokolovsky et al. (2020b). For the analysis we used nupipeline and nuproducts commands from HEASoft 6.27.2 (Nasa High Energy Astrophysics Science Archive Research Center (Heasarc), 2014) to extract source and background spectra and lightcurves from the focal plane modules A (FPMA) and B (FPMB). The nova is clearly detected with signal-to-noise of by both focal plane modules. We followed the analysis procedure described by Sokolovsky et al. (2020a). Specifically, we utilized a circular extraction region with the radius of 30 centred on the X-ray image of the nova (using ds9; Joye & Mandel 2003) independently for FPMA and FPMB. The background was extracted from five circular regions of the same radius placed on the same CZT (Arnaud et al., 2011) chip as the nova image. For an overview of X-ray spectroscopy and timing analysis techniques, see Arnaud et al. (2011) and Bambi (2020).
2.2.1 NuSTAR spectroscopy
The NuSTAR spectra of previously observed novae where found consistent with being emitted by single-temperature optically thin plasma (Orio et al., 2015; Nelson et al., 2019; Sokolovsky et al., 2020a). The plasma is likely heated by a shock (Zel’dovich & Raizer, 1967) associated with the nova eruption (Metzger et al., 2015). The shock also accelerates high-energy particles responsible for the -ray emission that may extend down to the NuSTAR band (Vurm & Metzger, 2018). Based on the previous nova observations and theoretical expectations, we try two classes of models to describe NuSTAR observations of YZ Ret: single-temperature optically thin thermal plasma emission model and a simple power law, as well as a combination of the two models. It is also known from optical spectroscopy that nova ejecta are overabundant in CNO elements (Williams, 1985; Gehrz et al., 1998; Schwarz et al., 2001). The composition affects both the spectrum of thermally emitting hot plasma and the cold absorber altering the intrinsic thermal and/or non-thermal spectrum. In this section we present a detailed description of the spectral fitting and explain the adoption of the thermal emission model from a plasma with non-solar abundances.
The 3.5–78 keV emission observed by NuSTAR is essentially featureless and can be described equally well by a power law, thermal emission from pure bremsstrahlung (Kellogg et al., 1975), and thermal emission from bremsstrahlung continuum plus line emission (vapec; Brickhouse et al., 2005) with non-solar abundances. The vapec model with solar abundances results in an unacceptable fit with for 22 degrees of freedom (Table 2). In order to suppress the line emission expected for solar-abundance plasma and, specifically, the Fe K emission at 6.7 keV, the plasma should either be Fe-deficient, or overabundant in nitrogen and oxygen. While absent in YZ Ret and V906 Car (Sokolovsky et al., 2020a), the 6.7 keV emission is clearly visible in the NuSTAR spectrum of the recurrent nova V745 Sco, where the shock propagates through the dense wind of the red giant companion that presumably has nearly-solar abundances (Orio et al., 2015). The NuSTAR spectrum of V5855 Sgr had too few counts to constrain the abundances (Nelson et al., 2019). A combination of both Fe-deficiency and NO overabundance is also possible and was found in nova V906 Car by Sokolovsky et al. (2020a). Also in the nova V382 Vel, a post-outburst X-ray grating spectrum contained no Fe lines but strong emission lines of C, N, O, Ne, Mg, and Si (Ness et al., 2005). A power law provides an adequate fit to the spectrum of YZ Ret given the non-solar abundances of the absorber. Physically, the power law model may represent non-thermal emission or thermal emission with a very high temperature. The monochromatic flux at 20 keV derived from the power law fit using Eq. (4) is erg cm-2 s-1.
For nova V906 Car the thermal model could be clearly favoured over the power law thanks to the good statistics. We cannot distinguish between the power law and thermal models for YZ Ret as both provide a statistically acceptable fit. However, we prefer the thermal model for the X-ray emission of YZ Ret as we expect the same emission mechanisms at work in nova systems. In addition, the observed soft power law is at odds with the theoretical expectations as discussed in § 3.4.
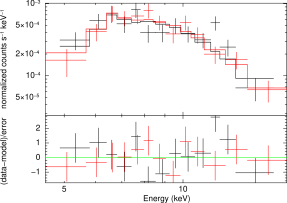
The source and background spectra, together with the associated redistribution matrix and auxiliary response files, were analysed with XSPEC 12.11.0 (Arnaud, 1996). We restrict the energy range to 3.5–78.0 keV to avoid calibration uncertainties near 3.0 keV. These uncertainties are mostly related to the rip in the protective polyimide film (Madsen et al., 2020) that covers both front and back sides of NuSTAR mirror assembly (Craig et al., 2011). The 3.5–78.0 keV spectrum was fit by heavily absorbed, optically thin thermal plasma emission (vapec; Brickhouse et al., 2005), with – cm-2 (depending on the choice of abundances) and keV. The unabsorbed 3.5–78 keV flux is erg cm-2 s-1 (or erg cm-2 s-1, again depending on abundances).
To obtain a good fit to the NuSTAR spectrum, we had to allow for non-solar abundances of N, O and/or Fe for both the absorber and emitter. These elements have prominent absorption and emission features in the NuSTAR band. The lower value in NO overabundance models reduces the Fe K edge resulting in the same broadband absorption as the solar abundance model with higher . Novae are known to show overabundance of CNO elements (Livio & Truran, 1994; Gehrz et al., 1998; Schwarz et al., 2001, and § 3.10). The shape of the NuSTAR spectrum is virtually insensitive to the abundance of C (unlike N and O). Optical spectra reveal the presence of Fe in the ejecta of YZ Ret (Aydi et al., 2020c; Izzo et al., 2020), but it may be under-abundant with respect to solar values.
We simultaneously fit the spectra from the two focal plane modules using the XSPEC model constant*phabs*vphabs*vapec, where constant is needed to compensate for the variable cross-calibration factor between FPMA and FPMB (the average NuSTAR calibration accuracy is at a few per cent level; Madsen et al. 2015), phabs represents the foreground Galactic absorber (with solar abundances and the absorbing column fixed to the value estimated from optical reddening in § 1.3), vphabs represents the intrinsic absorption and is allowed to vary, while vapec is the plasma emission model. We consider two types of models:
-
1.
the abundances of Fe, Co, Ni are tied together and left free to vary, while abundances of all other elements are fixed to the solar values of Asplund et al. (2009);
-
2.
the abundances of N and O are tied together and left free to vary, while abundances of all other elements are fixed to the solar values.
The abundances of the absorber (vphabs) and the emitter (vapec) are tied together in our models. The choice of the abundances dramatically affects the intrinsic absorbing column (that is expressed in terms of the equivalent, pure hydrogen column). The same situation was described for nova V906 Car by Sokolovsky et al. (2020a). Figure 3 presents the NuSTAR spectra compared to our preferred model described in Table 2.
Following Nelson et al. (2019) and Sokolovsky et al. (2020a), we also fit a combination of the thermal plasma and power law emission to constrain the non-thermal contribution on top of the thermal emission (Table 2). We fix the photon index to the theoretically predicted value of (§ 3.4), manually vary the power law normalization and fit for other model parameters. This way we find the brightest power law emission that, together with the thermal emission component still provide an acceptable fit (Null hypothesis probability ). The monochromatic flux at 20 keV for the brightest acceptable power law component computed with Eq. (4) is erg cm-2 s-1. If instead of manually setting the power law normalization, we let it free to vary, the fit always converges to zero contribution of the power law as the observations can be fully explained by thermal emission.
Table 2 summarizes the spectral fitting results. For each model we list the assumed and/or derived Fe, N and O abundances (by number, relative to the solar values of Asplund et al. 2009). One can see that while the particular choice of abundances fixed to the solar values results in a bad fit, a very wide range of Fe, N and O abundances provides acceptable fits, to the point that the abundances of these elements are essentially unconstrained. The temperature of the thermal model as well as the observed flux do not depend strongly on the abundances, the unabsorbed (intrinsic) flux is somewhat dependent while the intrinsic absorbing column, , is extremely sensitive to the choice of the abundances as detailed in Table 2.
| vphabs | k | 3.5–78.0 keV Flux | unabs. 3.5–78.0 keV Flux | d.o.f. | |||||
| ( cm-2) | (keV) | (erg cm-2 s-1) | (erg cm-2 s-1) | ||||||
| constant*phabs*vphabs*powerlaw | |||||||||
| 1* | 0.20 | 26.20 | 21 | ||||||
| constant*phabs*vphabs(vapec+powerlaw) | |||||||||
| 1* | vapec | 0.05 | 42.19 | 29 | |||||
| 1.2* | * powerlaw | ||||||||
| bad model constant*phabs*vphabs*vapec | |||||||||
| 1* | 1* | 0.00 | 43.93 | 22 | |||||
| constant*phabs*vphabs*vapec | |||||||||
| 1* | 0.31 | 23.58 | 21 | ||||||
| preferred model constant*phabs*vphabs*vapec | |||||||||
| 1* | 0.29 | 24.12 | 21 | ||||||
The parameters that were kept fixed for the model fit are marked with the * symbol. Column designation: Col. 1 – intrinsic absorbing column (in excess of the total Galactic value); Col. 2 – temperature of the thermal component; Col. 3 – photon index of the power law component; Col. 4 – Fe abundance by number relative to the solar value; Col. 5 – N and O abundances (tied together) by number relative to the solar values; Col. 6 – the logarithm of the integrated 3.5–78.0 keV flux under the model; Col. 7 – logarithm of the unabsorbed 3.5–78.0 keV flux; Col. 8 – chance occurrence (null hypothesis) probability; Col. 9 – value; Col. 10 – number of degrees of freedom.
2.2.2 NuSTAR lightcurve
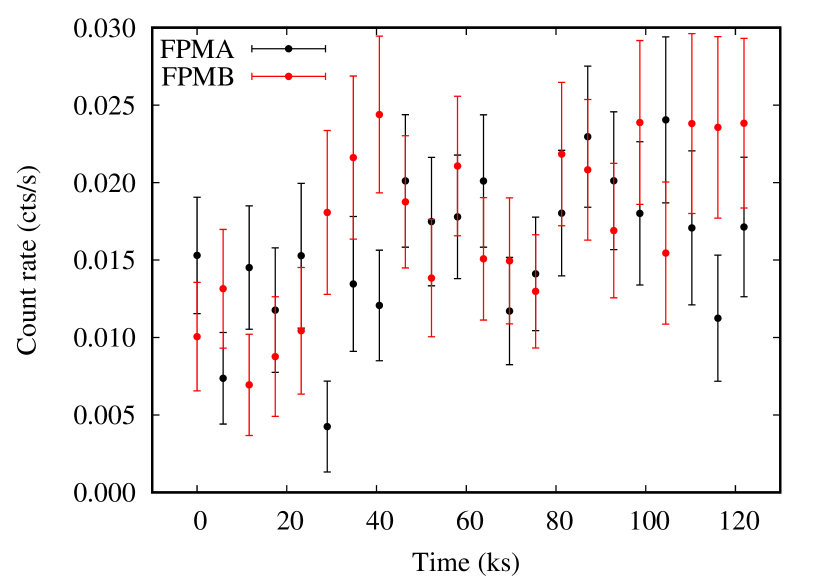
Fig. 4 presents the 3.5–78 keV lightcurves of YZ Ret obtained during the NuSTAR observation described in § 2.2.1. The lightcurves were background-subtracted and binned to 5805 s (corresponding to the NuSTAR orbital period at the time of the observations) resulting in one count rate measurement per orbit. Comparing the scatter of the count rate measurements to their error bars using the test (testing the observations against the null hypothesis that the mean count rate is constant; e.g. de Diego, 2010) we get about 0.03 chance occurrence probability for each of the lightcurves. Combining the FPMA and FPMB lightcurves the chance occurrence probability drops below 0.005, indicating significant variability. The visual inspection of Fig. 4 reveals that both FPMA and FPMB lightcurves show an increase in brightness over the duration of the observations. The test does not take into account the time and order of the photon flux measurements, only the measured values and their error bars, so the variability significance derived from the test may be considered a lower limit: the probability of chance occurrence of a smoothly varying lightcurve is smaller than that reported by this simple test (see the discussion in Tamuz et al., 2006; Figuera Jaimes et al., 2013; Sokolovsky et al., 2017). There is no obvious energy dependence of the variability amplitude, implying that the variations are intrinsic rather than related to changing absorption (that would have mostly affected the lower energies).
The need to collect enough photons for an accurate count rate measurement requires long time bins, which in turn limit the time resolution of the lightcurve. To test for the presence of a periodic signal on time-scales shorter than the NuSTAR orbital period we analysed photon arrival times (an unbinned lightcurve). The idea is that if the lightcurve is periodic, one can smooth (bin) it in phase rather than in time. We used the photon arrival times extracted from an event file to compute the power (defined as the squared modulus of the discrete Fourier transform) as a function of the variability time-scale (‘power spectrum’; Deeming, 1975; Max-Moerbeck et al., 2014). We also computed the -periodogram that for each trial period sums power over multiple harmonics enhancing sensitivity to variations that do not look like a sine-wave (de Jager et al., 1989; de Jager & Büsching, 2010; Kerr, 2011). The periodicity search was performed with the patpc code101010https://github.com/kirxkirx/patpc. We found no significant periodicity in the range 0.5–1000 s that was present in both FPMA and FPMB lightcurves and could not be attributed to harmonics of the NuSTAR orbital period.
2.3 XMM-Newton observations
XMM-Newton is equipped with five X-ray instruments: the two EPIC-MOS111111European Photon Imaging Camera - Metal Oxide Semiconductor (Turner et al., 2001) and the EPIC-pn121212European Photon Imaging Camera with the pn-type detector (Strüder et al., 2001) cameras for imaging and low-resolution spectroscopy in the 0.2–10 keV band and two Reflection Grating Spectrometers (RGS; den Herder et al. 2001) covering the range 0.33–2.1 keV (6–38 Å) with high spectral resolution. The X-ray telescopes are supplemented by the Optical Monitor (Mason et al., 2001). All the instruments are capable of operating simultaneously, with the X-ray photons not dispersed by the RGS gratings being recorded by the EPIC-MOS cameras. The 2-day orbital period of XMM-Newton allows for long uninterrupted observations.
Co-adding data collected prior to eruption, the Upper Limit Server131313http://xmmuls.esac.esa.int/hiligt/ (Saxton & Gimeno, 2011) reports the typical EPIC-pn upper limits of cts/s corresponding to the energy flux limit around erg cm-2 s-1 on the 0.2–12 keV flux (for the six XMM-Newton slews over the nova position in 2002–2019, ObsIDs 9042100004, 9099800003, 9175600004, 9219500004, 9272700003, 9350700002). A ROSAT/PSPC survey observation from 1990 yields an upper limit of cts/s corresponding to erg cm-2 s-1 of the 0.2–2 keV flux (Boller et al., 2016). Two XMM-Newton slews were performed over the position of YZ Ret after the eruption resulting in detection of soft (photon energy keV) emission on 2020-12-08 19:48:42 ( d; cts/s; erg cm-2 s-1; ObsID 9384600002) and 2021-03-13 02:42:17 ( d; cts/s; erg cm-2 s-1; the fluxes and count rates are 0.2–12 keV; ObsID 9389300003). The energy fluxes and limits are computed following Kraft et al. (1991), assuming power law emission with and the ‘standard’ XMM Slew Survey (Saxton et al., 2008) absorbing column of for the count rate to flux conversion.
The dedicated pointed XMM-Newton observation of YZ Ret was performed between 2020-09-23 13:36 and 2020-09-23 21:22 UT ( days; ObsID 0871010101; PI: Sokolovsky) for the total exposure time of 28 ks. We did not use the Optical Monitor as the target was too bright, with a visual magnitude 8.8. The EPIC was operating with the following configuration: pn – Small Window with Thick Filter, MOS1 – Small Window with Thick Filter, MOS2 – Timing with Medium Filter.
2.3.1 XMM-Newton spectroscopy
When choosing the XMM-Newton instrument setup, we were concerned about the possible optical loading (§ 2.4) and possible low-energy calibration issues of the Timing mode (so we choose two different configurations for the MOS cameras). However, the real problem turned out to be pile-up by the soft X-ray photons from the SSS component. Essentially, the SSS component turned out to be much brighter than we anticipated from Swift/XRT observations (Sokolovsky et al., 2020c). Pile-up happens when multiple photons arriving almost at the same time are mistaken by the detector for a single event with the sum of their energies. This distorts the energy spectrum and results in an underestimate of the count rate (two or more events are counted as one). Pile-up is so severe in our observations of YZ Ret that it makes quantitative analysis of the EPIC spectra impossible, even when the (most affected) central region of the source image is excluded.
We thus focus on the dispersive RGS where the photons are spread over a much larger area on the chip, making pile-up generally less likely to happen. However, for extremely bright and soft sources such as ours, pile-up can still occur, but can be dealt with following the approach described by Ness et al. (2007b). The RGS was operated in standard spectroscopy mode. We extracted the RGS 1 and 2 spectra and co-added them with the rgsproc pipeline of the SAS. The RGS spectrum was found to be distorted by pile-up and a special procedure has to be applied to correct for it.
The intrinsic energy resolution of the CCD detector that records the dispersed photons is sufficiently high to identify higher dispersion orders from the photon energies. The pipeline that extracts second-order spectra does not, however, distinguish between pile-up and second-order dispersion. The result is the apparent leakage of counts from the first- to the second-order spectrum. Normally, in the case of second order dispersion, a photon of a certain energy is recorded at a position that corresponds to half the wavelength. i.e. (where is the Planck constant and is the speed of light in vacuum). The software recognizes the higher energy of the photon (thanks to the inherent energy resolution of the CCD detector) and corrects the corresponding wavelength accordingly. Meanwhile, in the case of pile-up, two photons of energy are registered at the chip position that corresponds to the wavelength , but with the sum of their energies, thus . The software then assigns to half the true wavelength resulting in the discrepancies between first and second order spectra which is thus owed to pile-up.
Since there is no first-order emission in the 15–20 Å range where the piled-up photons are recorded, it is easy to correct for pile-up following the approach described by Ness et al. (2007b) by manipulation of the events file. We use the columns of wavelength (derived from the photon positions in dispersion direction) and the Pulse Invariant channel number (PI; encoding the photon energy recorded by the CCD). For each photon recorded within the wavelength range 12–38 Å but twice the corresponding photon energy, two photons are added with double the wavelength value. That way, we re-generated the spectrum with rgsproc starting with the manipulated events file.
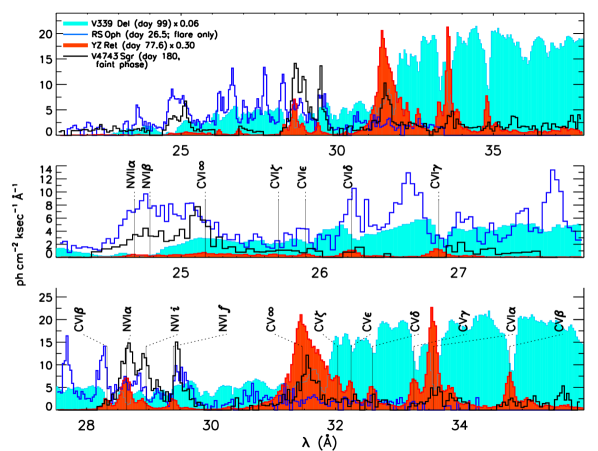
Even after taking into account the leakage of counts from the first to the second order caused by pile-up, the RGS spectrum (Fig. 5) looks somewhat unusual. Instead of a soft blackbody-like emission usually found in SSS (and that can be expected from the EPIC spectrum), the spectrum is dominated by emission lines. Comparison with previously investigated novae helps to interpret this spectrum. Fig. 5 compares the RGS spectrum of YZ Ret to previously observed novae in the SSS phase: V339 Del, RS Oph and V4743 Sgr. The archival RGS spectrum of V339 Del was extracted by us with the standard SAS tasks, while the grating spectra of RS Oph and V4743 Sgr were discussed earlier by Ness et al. (2009) and Ness et al. (2003), respectively. V339 Del shows a typical SSS spectrum dominated by continuum emission modified by absorption lines while the other novae display prominent emission lines. Comparing YZ Ret with V339 Del, one can see some of the YZ Ret emission lines have corresponding absorption lines in V339 Del, while the huge, broad emission line at 31.5 Å is also seen in V4743 Sgr.
We conclude that the RGS spectrum (Fig. 5) is dominated by emission lines of H-like Carbon (C vi) and He-like Carbon (C v). The C v 1s-2p (K or Lyman ) line is outside the range of the RGS, but all other lines of these ions are seen. With increasing principal quantum number, the separation between the lines shrinks, and when the principal quantum number approaches infinity (corresponding to the ionization energy C v to C vi), the lines blend with each other, which explains the shape of the 31.5 Å feature (labelled C v) where we can still resolve the C v (1s-7p) transition in the red wing. In other words, C v is equivalent to the Lyman jump in emission, it is known as ‘radiative recombination continuum’ feature and is observed in grating X-ray spectra of some active galactic nuclei (Guainazzi & Bianchi, 2007; Whewell et al., 2015). For C vi, the lines are weaker in the spectrum of YZ Ret, but we can clearly see all the lines and at 25.3 Å, a small peak can be seen that corresponds to the ionization energy of C vi.
We also see a weak emission line feature corresponding to the N vi 1s-2p transition at 28.8 Å with the resonance, intercombination, and forbidden (1s-2s) lines as well as the N vi 1s-3p (24.9 Å) and N vii 1s-2p line at 24.8 Å. Also present are the O viii 1s-2p and 1s-3p lines and probably also O vii 1s-2p at 21.6 Å.
Identification of all the emission lines discussed above requires a blue-shift of 1500 km s-1. Blue-shifted emission lines were previously observed in X-ray grating spectra of RS Oph (Nelson et al., 2008; Orlando et al., 2009), V959 Mon (Peretz et al., 2016; Nelson et al., 2021), V906 Car (Sokolovsky et al., 2020a) and V3890 Sgr (Orio et al., 2020; Singh et al., 2021; Ness et al., 2022). Blueshifts are also observed for absorption lines on top of the continuum SSS emission of novae (Ness et al., 2007b, 2011; Ness, 2012; Orio et al., 2013, 2018; Orio, 2020; Orio et al., 2021; Ness et al., 2022).
The line-dominated emission observed by XMM-Newton/RGS on is characteristic of photoionized or recombining plasma rather than collisionally-ionized plasma in thermal equilibrium (the vapec model we used to interpret the NuSTAR spectrum obtained on d; § 2.2.1). This is in stark contrast to V906 Car that showed no SSS and allowed modelling its XMM-Newton spectrum with vapec to derive the abundances (Sokolovsky et al., 2020a). Quantitative modelling of the line-dominated SSS emission of YZ Ret is beyond the scope of this paper but we emphasise that it does not need a model to see that carbon is unusually abundant in YZ Ret and in V339 Del. The ejected material originates from the CNO burning layers, and C/N is thus expected to be small as carbon is depleted and N is enhanced. In most novae, C lines are much weaker while N lines dominate. The strong C lines in the XMM-Newton/RGS spectrum of YZ Ret thus indicate that the underlying white dwarf is overabundant in carbon, which is typical of CO white dwarfs.
2.3.2 XMM-Newton periodicity search
We use the pointed XMM-Newton observation carried out on 2020-09-23 described in § 2.3 to search for any periodic variation in the X-ray flux of YZ Ret. We apply the patpc code (§ 2.2.2) to search for a periodicity in the arrival times of photons registered by the MOS2 instrument operating in the timing mode. We use the full 0.2–10 keV band, however we note that the counts are dominated by the super-soft line emission (§ 3.8). No significant periodicity could be identified in the period range 0.5–300 s – (quasi-)periodic variations on these time-scales were reported in other novae, during the SSS phase (Ness et al., 2015; Wolf et al., 2018; Vasilopoulos et al., 2020; Page et al., 2020). This is in accordance with the NICER results reported by Pei et al. (2020). There is significant power distributed across multiple peaks at longer periods which can be attributed to variability on a time-scale of a few ks, either intrinsic to the source or caused by the background variations.
2.4 Optical photometry of YZ Ret
In order to track the overall optical brightness evolution of YZ Ret (Fig. 1), we combined the post-discovery visual (by eye) and -band CCD measurements contributed by the AAVSO observers (Kafka, 2021) with -band CCD photometry from the ASAS-SN survey (Shappee et al., 2014; Kochanek et al., 2017) and early observations reported via the Central Bureau Electronic Telegrams (CBET; McNaught, 2020; Kaufman et al., 2020; Kazarovets et al., 2020). The CBET-reported observations were performed using colour (chip with a Bayer filter) CMOS cameras. The magnitude zero-point offsets between observations obtained with these methods are expected to be small compared to the nova amplitude. The CMOS and CCD images were measured with aperture photometry techniques utilizing various sets of comparison stars, while visual magnitude estimates were made following the AAVSO Visual Observing Manual141414https://www.aavso.org/visual-star-observing-manual (see also Hoffmeister et al., 1984).
The latest detection in pre-discovery quiescence ( on d) is followed by the ASAS-SN detection of the eruption at (2020-07-08.171 UT; ). Subsequently, the lightcurve continued to rise, peaking at 3.7 mag probably just before d (Fig. 1). The peak is followed by a nearly linear decline in magnitude (exponential decline in flux). At d, when the optical decline rate dramatically slows down coinciding with the appearance of super-soft X-ray emission (Sokolovsky et al. 2020c, see e.g. fig. 1 of McLoughlin et al. 2021a).
By fitting a straight line to the visual, band, and colour-CMOS magnitude estimates obtained between d (when the dense observational coverage started) and d (just before the lightcurve kink) we estimate the time to decline by 2 mag (3 mag) to be d ( d). The uncertainties of the and values are about a day, dominated by the exact choice of the outlier measurements to reject, fitting time interval, the relative weighting of visual and CCD measurements, and the choice of the fitting algorithm. The values above were obtained with the robust linear regression (implemented in the GNU Scientific Library Gough, 2009) effectively assigning equal weights to visual and CCD/CMOS measurements. While the CCD measurements are inherently more precise than visual estimates, the CCD observations are sparse and have zero-point difference with visual and between the different CCD observers. (Note the excursion toward the lower fluxes in band around d that doesn’t seem to have a counterpart in visual data. We attribute this discrepancy to a colour change.) Rudy et al. (2021) report a value shorter by four days, also citing the AAVSO data.
3 Discussion
3.1 Relation between optical and -ray emission
The -ray lightcurve peaks in the daily bin centred at d, which is d past the optical peak (Fig. 1; § 2.4). The optical peak time is not well constrained (no observations in three days between the latest pre-maximum and maximum lightcurve points), so the optical to -ray peak delay value should be treated with caution. Delayed onset of -ray emission with respect to the optical peak has been observed in other novae (e.g. Cheung et al., 2016). Two possibilities may explain this delay. The -rays may be created simultaneously with the optical emission, but initially get absorbed (e.g. Fang et al., 2020). This scenario is similar to the one explaining the delayed onset of shock-powered X-ray emission – we know that the X-rays are present early in eruption thanks to NuSTAR penetrating through dense absorbing ejecta (Nelson et al., 2019; Sokolovsky et al., 2020a). The other possibility is that the shock accelerating the -ray emitting particles needs time to form. Munari et al. (2017) suggest there may be two peaks in optical lightcurves of -ray novae: the first one from the freely expanding nova fireball (common to all novae) and the second peak powered by shocks (specific to the -ray novae). According to Aydi et al. (2020b), the -ray emitting shock forms when a fast radiation-driven wind from the white dwarf catches up with the slowly expanding shell ejected early in the eruption (perhaps through common envelope interaction). Correlated -ray and optical variations (Li et al., 2017; Aydi et al., 2020a) suggest that shocks within the nova ejecta can vary in power on a time-scale of days, which tentatively suggests the delayed shock formation scenario is plausible.
In contrast with the two -ray novae discussed by Munari et al. (2017), YZ Ret shows a single-peaked optical lightcurve. In the ‘two peaks/delayed shock formation’ scenario, this means that the shocks in YZ Ret formed quickly, and the fireball and shock-powered optical lightcurve peaks merge together (or at least are indistinguishable given the limited photometric coverage between and d, Fig. 1).
Following Metzger et al. (2015), Li et al. (2017), Aydi et al. (2020a), and Li et al. (2020a), we compute the ratio of the -ray flux in the Fermi/LAT band (0.1–300 GeV; § 2.1) to the bolometric optical flux. The typical intrinsic colour of a nova near peak brightness is (van den Bergh & Younger, 1987). For a blackbody with temperature K (corresponding to spectral types later than A0) the temperature can be estimated from the colour as K (relation derived from the simple comparison of 4400 Å and 5500 Å flux densities predicted by the Rayleigh-Jeans law). The blackbody bolometric correction (defined in e.g. Kitchin, 2009) for K is 0.03 according to table 3.1 of Budding & Demircan (2007). Adopting the observed bolometric magnitude from the colour-CMOS magnitude of 3.7 (the best available approximation to the peak magnitude) and following Mamajek et al. (2015), we obtain a peak bolometric flux of corresponding to an optical luminosity of erg s-1, a factor of 6 above the Eddington luminosity of a 1.0 white dwarf (see e.g. §1.2 of Frank et al. 2002 and Shaviv 1998). The ratio of the peak -ray luminosity (§ 2.1) to peak optical luminosity is . This value is comparable to what was observed in V339 Del, and an order of magnitude lower than what was found for the other -ray bright novae (see supplementary fig. 14 of Aydi et al., 2020a).
Using the same technique we estimate the optical bolometric luminosity of YZ Ret during the NuSTAR observation to be erg s-1 based on 27 visual magnitude estimates made during the NuSTAR observation (mean 5.12 mag), assuming post-peak (§ 1.3; van den Bergh & Younger, 1987) corresponding to K (bolometric correction ). Given the uncertainty of magnitude estimates, nova colour and the corresponding bolometric correction, uncertainty of putting the visual and unfiltered CMOS photometry on the magnitude scale as well as the uncertainty of zero-point and distance to YZ Ret, it is unlikely that the estimated luminosities are accurate to better than 10 per cent.
The -ray to optical flux ratio places a constraint on the particle acceleration efficiency in nova shocks. If we assume that (i) all optical luminosity is powered by shocks; (ii) most of the shock energy is eventually dissipated as optical radiation; and (iii) the accelerated particles emit all their energy within the Fermi/LAT band, the ratio of the Fermi/LAT to optical fluxes will yield the particle acceleration efficiency. Clearly, a large fraction of the optical luminosity comes from the expanded photosphere heated directly by the nuclear burning white dwarf, so the GeV to optical flux ratio sets a lower limit on the acceleration efficiency.
To facilitate comparison with the following paragraphs where we use monochromatic X-ray and -ray fluxes, we compute the peak monochromatic optical flux at 2.25 eV (5500 Å): erg cm-2 s-1. The monochromatic optical flux at the time of the NuSTAR observation is erg cm-2 s-1. For the magnitude to flux density conversion we use the absolute fluxes (corresponding to zero magnitude) from Bessell et al. (1998). We note that this conversion is approximate as it depends on the source spectrum. The observed magnitudes were corrected for derived in § 1.3.
3.2 The luminosity of YZ Ret at high energies
Here we consider the X-ray and -ray luminosities of YZ Ret and compare it to previously observed novae, considering order-of-magnitude estimates only. The following factors limit the accuracy of luminosity measurements.
-
•
The distances to previously observed novae are often not well constrained.
-
•
The nova flux is changing over the course of its eruption. While the GeV and optical bands are often well covered by observations and one can estimate the peak or average flux, the observed X-ray flux is a strong function of the observation date – we know this from Swift/XRT monitoring, while in the harder NuSTAR band the best-covered lightcurve of V906 Car has only two epochs.
-
•
The derived GeV and X-ray fluxes depend on the choice of the spectral model and different models have been used in the literature.
Note that while in § 3.5 we will discuss monochromatic flux ratios, here we discuss luminosities integrated over the specific energy bands.
Integrating the exponentially cut-off power law that fits the Fermi/LAT spectrum (§ 2.1) and relying on the Gaia distance (§ 1.3), we estimate the average 0.1–300 GeV luminosity of YZ Ret over its -ray bright period to be erg s-1. Scaling this to the -ray photon flux at peak and at the NuSTAR epoch (assuming the spectrum does not change) we obtain the peak luminosity of erg s-1 and the luminosity during the NuSTAR observation of erg s-1. As the Fermi upper limit to the flux at 0.05–0.1 GeV is well below the value from the extrapolation of the power law fit (Fig. 2), the -ray spectrum is consistent with a substantial drop toward lower energies, so that the 0.1–300 GeV luminosity may well be representative of the total -ray luminosity of the nova. The luminosity estimates at different epochs and bands are summarized in Table 3.
The GeV luminosity of YZ Ret is about an order of magnitude lower than that of the brightest known -ray nova, V906 Car (Aydi et al., 2020a), and a factor of 5 lower than that of V5855 Sgr (Nelson et al., 2019). Taking the Fermi/LAT photon fluxes and distances for -ray-detected novae from Gordon et al. (2021) and applying the same photon to energy conversion factor as we adopted for YZ Ret (assuming the other novae have the same spectrum as YZ Ret) we find a median MeV luminosity of erg s-1, close to that of YZ Ret. The lowest-luminosity detected GeV nova in the Gordon et al. (2021) sample (V1369 Cen, which is also the most nearby, § 3.4; Cheung et al., 2016) has the luminosity an order of magnitude lower than YZ Ret. V549 Vel may be a few times fainter than V1369 Cen, however there are questions about the reliability of its distance (and hence luminosity; Li et al., 2020a).
Integrating the thermal plasma model that fits the NuSTAR spectrum of YZ Ret in the 3.5–78 keV energy range we obtain an intrinsic X-ray luminosity of erg s-1. Extrapolating from the model down to a low-energy limit of 0.3 keV, the resulting luminosity increases by a factor of two. It is hard to say how representative these values are of the total X-ray energy output of the nova, as soft X-rays are completely hidden by the intrinsic absorption at the time of the NuSTAR observation. A very bright emission component can, in principle, be completely hidden from view if it is sufficiently soft to provide no detectable contribution above 3.5 keV in the NuSTAR band (§ 3.5; Sokolovsky et al., 2020a). The SSS emission from the white dwarf is an obvious example, but there might be other shock-related emission components hidden at low energies.
The shock-powered X-ray luminosity derived from the NuSTAR observation of YZ Ret is comparable to that of GeV-bright novae observed by Swift and analysed by Gordon et al. (2021). Comparing to NuSTAR-observed novae, YZ Ret is an order of magnitude fainter than V906 Car (Sokolovsky et al., 2020a) and a factor of 8 fainter than V5855 Sgr (Nelson et al., 2019).
| Band | Luminosity |
|---|---|
| -ray/optical peak at d: | |
| 0.1–300 GeV | erg s-1 |
| bolometric optical | erg s-1 |
| NuSTAR epoch at d: | |
| 0.1–300 GeV | erg s-1 |
| 3.5–78 keV | erg s-1 |
| extrapolated 0.3–78 keV | erg s-1 |
| bolometric optical | erg s-1 |
3.3 Comparing X-ray properties of YZ Ret to nova-quiescent systems
The pre-eruption X-ray upper limits indicate that the nova has brightened at least an order of magnitude by the time of the post-eruption XMM-Newton observation (§ 2.3). We compare the X-ray properties of YZ Ret 10 to 78 days after the nova eruption to the more nearby (and, therefore, brighter) non-nova cataclysmic variables. Zemko et al. (2014) examined X-ray properties of four VY Scl variables whose spectra are described with two thermal plasma components (one with keV and the other with keV), sometimes requiring super-solar abundances. The physical interpretation of the two components is unclear. It is likely that the true emission is from a multi-temperature plasma, while the two-temperature model is just the next simplest thing after the single-temperature model and provides an acceptable description of the data just because of the low photon statistics.
No SSS emission (which would indicate continuous nuclear burning) was found in VY Scl systems observed by Zemko et al. (2014). The nova eruption in YZ Ret disfavours the suggestion by Greiner & Teeseling (1998), Greiner et al. (1999); Greiner et al. (2001), Greiner (2000) and Honeycutt (2001) that continuous nuclear burning is a common feature of VY Scl systems (in accordance with the results of Greiner et al. 2010 and Zemko et al. 2014). The emergence of the post-nova SSS in YZ Ret (§ 3.8; Sokolovsky et al. 2020c) supports this conclusion suggesting the pre-nova SSS that could have been indicating continuous nuclear burning was likely non-existent, rather than somehow hidden from our view.
Combining the unabsorbed flux estimates of VY Scl type systems reported by Zemko et al. (2014), Greiner et al. (2010) and Page et al. (2014) with the Gaia distances (Bailer-Jones et al., 2018), we estimate the typical luminosity of VY Scl systems to be erg s-1, about an order of magnitude lower than the post-nova emission of YZ Ret (§ 3.2; Table 3). The X-ray luminosity of individual VY Scl type systems varies with time and, possibly, with their optical (high/low) state.
YZ Ret can also be compared to the old nova high accretion rate system V603 Aql (Nova Aquilae 1918) observed in 2001 by Chandra and RXTE. Mukai & Orio (2005) found that V603 Aql displays strong irregular variability on time-scales of a few ks, the 1–7 keV luminosity erg s-1 and the spectrum described by the cooling flow model.
As expected, the X-ray spectra of YZ Ret during its nova eruption (bright single-temperature optically thin thermal emission joined later by the super-soft component) clearly distinguish it from the quiescent spectra of similar systems that did not show a nova outburst in recent decades. Therefore, the X-ray emission we observe in YZ Ret is related to the nova event rather than any accretion-related phenomena (for a detailed discussion of accretion-powered X-rays see Mukai, 2017; Balman, 2020; Sun et al., 2020).
3.4 The mechanisms of X-ray and -ray emission
Models for power law emission (powerlaw), thermal bremsstrahlung (bremss; Kellogg et al. 1975), and thermal plasma emission (vapec; Brickhouse et al., 2005) all fit the observed NuSTAR spectrum well (§ 2.2.1, Table 2), if we allow for non-solar abundances of the absorber vphabs (Balucinska-Church & McCammon, 1992). The intrinsic X-ray emission spectrum in the NuSTAR band is essentially smooth and featureless, with few clear signposts allowing us to differentiate between emission models.
Comptonization of the radioactive MeV lines (Livio et al., 1992; Suzuki & Shigeyama, 2010; Hernanz, 2014) should produce a flat or rising spectrum below 100 keV according to Gomez-Gomar et al. (1998). Nelson et al. (2019) argue that the Compton optical depth in a nova is insufficient to produce a detectable hard X-ray flux via this mechanism. Therefore, we rule out Comptonization as the mechanism behind the X-ray emission of YZ Ret.
The low-energy extension of the energy distribution of particles responsible for the -ray emission should give rise to powerlaw emission in the hard X-ray band. Vurm & Metzger (2018) investigate this possibility and predict the spectral energy distribution to ( to ; § 1.5) at energies keV. The photon index for the power law fit is soft, (the power law index of in units, § 1.5; Table 2). The observed spectral slope in the NuSTAR band (Table 2) is inconsistent with this prediction. It appears likely that the power law model with its soft photon index and high absorbing column just mimic the intrinsically curved bremsstrahlung spectrum resulting in a good fit.
Finally, we should mention the possibility of synchrotron emission reaching all the way to hard X-rays and manifesting itself as a soft power law. This seems unlikely as no signs of synchrotron emission in novae were reported at frequencies above the radio band. Generating such emission would require a very high shock magnetization. Particles emitting synchrotron X-rays would also emit GeV -rays in the hadronic scenario, in contradiction with the observed cut-off around 2 GeV (§ 2.1).
In summary, we suggest that all the emission observed from YZ Ret by NuSTAR is thermal based on the following two considerations:
- •
-
•
The thermal plasma model was clearly preferred over the power law fit for a brighter NuSTAR nova V906 Car (Sokolovsky et al., 2020a), and we expect similar emission mechanisms across novae.
It is conceivable that some non-thermal emission is mixed into mostly thermal emission as discussed in § 2.2.1 (model with two emission components in Table 2), but we have no observational evidence to support this possibility.
| Nova | Reference | ||
| V339 Del | Vurm & Metzger (2018) | ||
| V5668 Sgr | Vurm & Metzger (2018) | ||
| V5855 Sgr | 0.017 | Nelson et al. (2019) | |
| V906 Car | 0.020 | Sokolovsky et al. (2020a) | |
| YZ Ret | this work |
Vurm & Metzger (2018) make another important prediction: there should be a lower limit on the ratio of non-thermal X-ray to -ray fluxes and this limit depends on the -ray emission mechanism. The predicted monochromatic flux ratios in units are for the leptonic model and for the hadronic model. As no non-thermal X-rays were detected by NuSTAR while the GeV -rays were observed by Fermi/LAT, we can constrain the value of this ratio for YZ Ret and compare it to the previously observed novae (Table 4). To compute the upper limit on the non-thermal monochromatic flux at 20 keV we use the parameters of the powerlaw component in the model constant*phabs*vphabs(vapec+powerlaw) (Table 2):
| (4) |
where is the conversion factor from keV to erg. is the prefactor in the powerlaw component of the model. For the absorbed power law model (constant*phabs*vphabs*powerlaw in Table 2) photons keV-1 cm-2 s-1 at 1 keV, while for the absorbed faint power law on top of the bright thermal emission model (constant*phabs*vphabs(vapec+powerlaw) in Table 2) photons keV-1 cm-2 s-1 at 1 keV. is the photon index listed in Table 2 and keV, cf. Eq. (3). The absorption does not affect the calculation (except when fitting the model) as we are interested in the intrinsic value of . The corresponding monochromatic flux at 100 MeV is computed using Eq. (3) in § 2.1. The derived upper limit on for YZ Ret is consistent with both leptonic and hadronic models, while the observations of V5855 Sgr and V906 Car are consistent only with the hadronic scenario.
3.5 and the missing thermal X-ray flux
While Vurm & Metzger (2018) discuss non-thermal hard X-ray emission associated with the -ray emitting particle population, Metzger et al. (2015) consider thermal X-ray emission of the shock responsible for accelerating these particles. Metzger et al. (2015) predict bright thermal X-rays that accompany the -rays. For a radiative shock that accelerates particles with an expected efficiency of few percent, thermal X-ray emission should be 1–2 orders of magnitude brighter (in units) than the GeV emission. The observed X-ray luminosity is instead 0.007 , as measured in the simultaneous Fermi/LAT and NuSTAR observations (Table 4).
For the high densities present early in a nova eruption, a large fraction of the X-ray radiation is absorbed and then re-emitted at longer wavelengths. From the shape of the NuSTAR spectrum, we estimate how much radiation was absorbed and use the unabsorbed (intrinsic) X-ray luminosity to calculate the ratio. The uncertainty in resulting from uncertain elemental abundances of the neutral absorber (Table 2; § 2.2.1; § 3.10) has less than 1 per cent effect on as we estimate it at 20 keV where the absorption is small.
Studies which simulate particle acceleration at shocks find that at most 20 per cent of the shock power goes into non-thermal particles (Caprioli & Spitkovsky, 2014), which effectively sets a lower limit of 5 on the ratio. The modelling of Steinberg & Metzger (2018) suggests that the corrugated geometry of the shock front may suppress X-ray emission by an order of magnitude for the same particle acceleration efficiency. The X-ray emission may also be Compton scattered away from the line of sight, if the nova ejecta are highly non-spherical (Nelson et al., 2019), further lowering the ratio by maybe an order of magnitude. However, even acting together these effects cannot explain the X-ray emission in the NuSTAR band being two to three orders of magnitude fainter than the GeV emission. The observed ratio measured from the simultaneous Fermi/LAT and NuSTAR observations of YZ Ret and other novae is presented in Table 4.
Absorption, corrugated shock front geometry and Compton scattering in an asymmetric shell cannot account for the observed ratio. We are forced to assume that either the shock spends most of its energy on something other than X-ray radiation, such as adiabatic losses or unexpectedly efficient particle acceleration. Alternatively, the shock responsible for the X-rays observed by NuSTAR is not the same shock that accelerates the -ray emitting particles. We discuss these possibilities further in the following paragraphs.
Steinberg & Metzger (2018) and Steinberg & Metzger (2020) point out that there are two distinct channels for adiabatic losses. The first is the usual conversion of thermal energy into kinetic energy of the expanding gas. The second channel appears as the corrugated shock front has two phases of gas, a cold dense phase and a hot dilute phase. In the turbulence behind the shock front, the hot gas can transfer some of its thermal energy to the cold phase in what are technically also adiabatic losses. This energy is then radiated by the cold phase at long wavelengths (optical). This is a different mechanism to emit optical radiation than reprocessing X-ray emission from the hot phase as the energy transfer from the hot to cold phase is not done via X-ray emission/absorption. The shock energy transferred through this channel will not contribute to the unabsorbed X-ray luminosity that we derive from the X-ray spectrum analysis, but it is questionable if most of the shock energy can be transferred this way.
In principle, one can imagine that shocks in novae are somehow especially efficient at accelerating particles compared to shocks in supernova remnants. One possibility is that a shock-accelerated particle interacting with the surrounding matter in dense environment of a nova shock may produce secondary particles. The secondary particles may have sufficient energies to be picked up by the acceleration process. Such avalanche effect may provide an ‘infinite’ supply of seed particles injected into diffusive shock acceleration. The idea is similar to runaway electron production mechanisms (Gurevich et al., 1992; Dwyer, 2012) thought to be responsible for terrestrial -ray flashes (e.g. Mailyan et al., 2016) and -ray glows (e.g. Wada et al., 2021). However, this ‘shock spending most of its energy accelerating particles’ scenario does not account for the observations of correlated -ray/optical variability in V5856 Sgr and V906 Car that together with the -ray/optical flux ratio suggested that most of the shock energy is eventually radiated in the optical band (Li et al., 2017; Aydi et al., 2020a).
A second shock, different from the one responsible for the NuSTAR-detected emission, traveling at a velocity of a few hundred km s-1 may accelerate particles that produce Fermi/LAT-detected -rays. The low temperature of this second shock would put the associated X-ray emission below the NuSTAR band according to Eq. (5). Vlasov et al. (2016) mention the possibility that different shocks may be responsible for emission observed in different bands, or even in the same band at different times. Multiple optically thin thermal emission components (that may correspond to multiple shocks) are observed in some classical novae (Nelson et al., 2021), but not in others (Sokolovsky et al., 2020a) (multi-temperature emission is commonly observed in novae with an evolved donor; Nelson et al. 2008, 2012; Orio et al. 2013; Orio et al. 2015; Orio et al. 2021). Swift/XRT 0.3–10 keV observations of YZ Ret were fit with a single-temperature thermal plasma emission until the emergence of the SSS (Sokolovsky et al., 2020c). However, the more novae that are observed by NuSTAR, the harder it becomes to support this somewhat contrived scenario of multiple shocks as the explanation for the low ratio.
3.6 Location of the shocked region
Determining the location of the shocked region(s) within the nova ejecta is important to draw an accurate physical picture of the eruption and, specifically, to estimate the influence of -ray opacity on the observed GeV spectrum (Metzger et al., 2016). The -rays may be absorbed via Bethe-Heitler photo-nuclear pair production (the same process used by Fermi/LAT to detect -rays) and Breit-Wheeler pair production.
The X-ray flux approximately doubled over the 120 ks duration of the NuSTAR observation (Fig. 4; a weighted linear fit to the lightcurve results in a count rate ratio at time 120 ks to time 0 of ). We can take this as an estimate of the variability time-scale associated with the shock, if we attribute the X-ray emission to the shock-heated plasma (§ 3.4). The post-shock temperature () can be related to the shock velocity () for a strong shock propagating in monoatomic gas (with polytropic exponent 5/3):
| (5) |
(equation [6.58] of Dyson & Williams 1997), where is the proton mass, is the Boltzmann constant, and is the mean molecular weight. This relation is derived from the Rankine–Hugoniot jump conditions that follow from conservation of mass, momentum, and energy. Here we neglect the shock energy losses on particle acceleration (Tatischeff & Hernanz, 2007). For a fully ionized gas with solar abundances (Asplund et al., 2009) , while the composition derived for V906 Car by Sokolovsky et al. (2020a) implies . Assuming the V906 Car abundances and temperature derived from the NuSTAR observation (Table 2), we find km s-1. Multiplying by the variability time-scale, we constrain the shocked region size at d (the date of the NuSTAR observation) to be less than 1.6 au. The upper limit on the shocked region size allows it to be larger than the binary separation and the optical photosphere (§ 3.1).
At d NICER observed irregular variations on a time-scale of kiloseconds in soft X-rays (Pei et al., 2020), corresponding to the size of au for the velocities of 1000 km/s. This variability is in the super-soft emission that is directly related to the white dwarf (and attributed to changes either in emission or absorption in the vicinity of the white dwarf).
Finally, we mention the possibility that rather than having one shock (or a pair of forward and reverse shocks) at the interface between the fast and slow components of the nova outflow (Chomiuk et al., 2014a; Aydi et al., 2020b), multiple shocks associated with individual dense clumps within the nova ejecta may be responsible for the high-energy emission. This is the mechanism thought to produce X-rays in early-type stars (e.g. sec. 4 of Güdel & Nazé, 2009) and similar clumps should form in nova ejecta (Shaviv, 2001a, b). If many clumps emit simultaneously, the fast variability associated with individual clumps may average out. The ratio of X-ray to bolometric optical luminosity of O-type stars is (fig. 6 of Chlebowski & Garmany, 1991), comparable to what we find in YZ Ret (§ 3.1, 3.2), but single early-type stars are not known to emit -rays. In the multiple-clumps/multiple-shocks scenario one may expect a wide range of temperatures associated with the individual emitting regions.
3.7 Single-temperature fit to NuSTAR spectrum
It is somewhat surprising that the hard X-ray spectra of YZ Ret (§ 2.2.1) and other novae observed by NuSTAR (V745 Sco with a giant donor, Orio et al. 2015; V5855 Sgr, Nelson et al. 2019; and the brightest of them, V906 Car, Sokolovsky et al. 2020a) resembles that of a single-temperature plasma, even if the emission is produced by one single shock. The plasma heated by the shock to a temperature determined by Eq. (5) should cool by radiation (e.g. Derdzinski et al., 2017) producing a temperature gradient in the post-shock region. The direction-dependent density profile of the external medium may make the shock propagate with different velocities in different directions, resulting in a range of shock temperatures (most relevant in novae with a giant donor Orlando et al., 2017). Apparently, in practice there is some characteristic temperature associated with the highest emission measure and possibly modified by absorption that preferentially affects low-temperature emission. The single-temperature approximation is typically sufficient to describe a NuSTAR spectrum of a nova.
The exponential cut-off of the bremsstrahlung spectrum is well within the NuSTAR energy range constraining the (highest) temperature of the emitting plasma. However, the presence of an uncertain amount of intrinsic absorption makes it hard to distinguish between the single-temperature and multi-temperature models. The difference between the models is mainly in the observed slope of the bremsstrahlung continuum, which may be altered by ‘adding’ more absorbing material to the model. A high resolution and signal-to-noise spectrum may distinguish between the effects of absorption and temperature distribution by resolving contribution of individual absorption edges and thermal emission lines. Even then the narrowness of the effective bandpass (between the low-energy cut-off due to absorption and the exponential cut-off at ) may prevent one from reaching an unambiguous conclusion. In summary, the NuSTAR spectrum of YZ Ret allows us to characterize the shock temperature, the temperature distribution of the post-shock plasma cannot be reliably constrained.
3.8 Line-dominated SSS emission
According to NuSTAR (§ 2.2), Swift/XRT (Sokolovsky et al., 2020c) and NICER (Pei et al., 2020) observations, the early X-ray emission of YZ Ret was hard, dominated by shock-heated plasma. Around d the nova ejecta cleared sufficiently to reveal super-soft X-rays originating in the vicinity of the hydrogen-burning white dwarf. The XMM-Newton observed YZ Ret on d, around the peak of its SSS phase, revealing a rare emission-line dominated SSS spectrum.
At low spectral resolution, the SSS component in novae is often approximated as a blackbody (e.g. Schwarz et al., 2011). However, grating spectra have revealed two types of SSS: the ones dominated by a blackbody-like continuum, and in most cases modified by absorption lines, and the ones dominated by emission lines on top of a weak blackbody-like continuum (Ness et al., 2013). The emission-line-dominated SSS (e.g. U Sco; Ness et al., 2012), can be interpreted as being the result of obscuration of central continuum emission while emission lines are formed further outside. The central blackbody-like continuum emission is thus suppressed increasing the contrast to emission lines that are always present. Such obscuration may appear in high-inclination systems (viewed edge-on), where the white dwarf is obscured by the accretion disc (that survives or gets quickly re-formed following the nova eruption; Figueira et al. 2018). The XMM-Newton/RGS spectrum presented in Fig. 5 firmly places YZ Ret in the latter category, implying it may be a high-inclination system.
The extremely soft emission-line-dominated spectrum of YZ Ret was also observed with Chandra by Drake et al. (2020) on d. The line-dominated nature of YZ Ret’s SSS spectrum is apparent only with X-ray grating spectroscopy. The low resolution EPIC spectrum could have been easily mistaken for a blackbody. Since the emission-line spectrum is likely created by scattering of the primary (blackbody-like) emission by a medium that has a temperature similar to that of the stellar surface (as shown by the mirror image absorption/emission lines), the result is a spectrum that looks blackbody-like at low spectral resolution.
3.9 Jets in YZ Ret?
Flows of plasma collimated to an opening angle of often producing non-thermal emission are known as jets. Jets power astrophysical phenomena emitting in a very wide range of the electromagnetic spectrum, from -rays to radio: blazars, microquasars and -ray bursts (Romero et al., 2017; Kumar & Zhang, 2015). The exceptions (non-jetted phenomena observed across the electromagnetic spectrum) are colliding wind binaries (Pshirkov, 2016; Dubus et al., 2017), the Galaxy (Gaggero et al., 2015), the Sun (Abdo et al., 2011; Ajello et al., 2021) and Earth (Dwyer et al., 2012; Madlee et al., 2020). One may ask if jets play a role in novae?
There were several reports of jets in novae based on optical spectral line profile studies (Kato & Hachisu, 2003; Iijima & Esenoglu, 2003; Darnley et al., 2017) as well as radio (Davis et al., 1988; Sokoloski et al., 2008; Rupen et al., 2008; Giroletti et al., 2020) and X-ray (Toalá et al., 2020) imaging. Some earlier claims of observations of nova jets were later disputed (O’Brien & Cohen, 1998; Harvey et al., 2016). It is actively debated if non-nova cataclysmic variables have jets (Coppejans & Knigge, 2020).
McLoughlin et al. (2021a) argue that the H line profile in YZ Ret can be explained as a sum of emission from the approaching and receding jets and the accretion disc. The authors assume that the contribution from the non- or weakly-collimated ejecta to the total line flux is small. McLoughlin et al. (2021b) offer the similar line profile interpretation for other novae.
The observations discussed in the present paper do not allow us to deduce the ejecta geometry, however the following considerations seem to disfavour the jet scenario. First, the line-dominated SSS (§ 3.8) indicates that YZ Ret is a high-inclination system. The jets need to be fast in order to produce the high-velocity emission line components while being aligned nearly perpendicular to the line of sight. Second, McLoughlin et al. (2021a) suggest the X-ray emitting shocks are produced by collision of individual blobs of material traveling down the jet with various speeds. Our observations do not require multi-temperature emission, which would support the jet model. In the colliding blobs scenario, one could also expect variability on a time-scale of the blob size over the blob collision velocity. The blob size should be of the order of the jet width. Instead, the observed variability time-scale and the shock velocity (derived from the shock temperature) suggest a large emitting region (§ 3.6).
A large nearly-single-temperature shocked region seems to fit more naturally into the scenario of a slow equatorial outflow (possibly ejected via the common envelope interaction during the nova eruption) with the fast wind (accelerated by the white dwarf radiation) – the scenario favoured by Chomiuk et al. (2014a), Chomiuk et al. (2021) and Aydi et al. (2020b). In this scenario, the shock is formed at the interface between the fast and slow flows while multiple ejections with different velocities and the complex shape of the ejecta formed via their interaction are responsible for the complex optical line profiles. In a sense, the question of the existence of jets is about the degree of collimation that can be achieved by the fast flow: an opening angle of a few degrees for a jet or a few tens of degrees for a bipolar outflow. We speculate that the presence of particle-accelerating shocks, rather than the presence of these shocks specifically in the highly-collimated jets, may be the physical mechanism unifying the high-energy to radio emitting phenomena listed above.
3.10 Ejecta abundances and the white dwarf composition
Optical, infrared and X-ray spectra indicate that nova ejecta are typically enriched in heavy elements that must be eroded from the white dwarf (e.g. Gehrz et al., 1998; Helton et al., 2012; Sokolovsky et al., 2020a). Thermonuclear burning in the nova proceeds through the hot carbon-nitrogen-oxygen (CNO) cycle (Wiescher et al., 2010), and may change the relative abundances of C, N and O, but will not increase the total abundance of CNO relative to other elements (Starrfield et al., 1972; Truran & Livio, 1986).
The XMM-Newton/RGS spectra (§ 2.3.1; Fig. 5) of YZ Ret show no signs of Ne and Mg emission lines that would normally fall into the RGS band. Such lines are visible in the X-ray grating spectra of V382 Vel (Ness et al., 2005), U Sco (Ness et al., 2012), V959 Mon (Nelson et al., 2021) and V3890 Sgr (Orio et al., 2020). Instead, the RGS spectra are dominated by emission lines of C and N, suggesting that the white dwarf in the YZ Ret system may be of CO composition rather than ONeMg. The ONeMg composition for YZ Ret was suggested by Izzo et al. (2020) who detected optical lines [Ne iii] 3342 Å and [Ne v] 3426 Å. It is possible that the Ne detected in the optical spectrum is associated with the material accreted from the companion star (or ablated from the companion star during eruption?) rather than with the white dwarf material. A CO white dwarf may have non-zero Ne content on its own (Fields et al., 2016). It cannot be excluded that Ne and Mg lines are not visible in the X-ray spectrum due to the low temperature of the ionizing radiation from the white dwarf, as Ne and Mg have higher ionization potential than C and N. An ONeMg white dwarf may have a CO envelope, so the presence of C emission does not exclude the ONeMg scenario. If the white dwarf in the YZ Ret system is of CO composition as it seems to be the case, then it qualifies as a Supernova Ia progenitor candidate.
NuSTAR spectra rule out solar abundances, but are consistent with Fe-deficient and/or NO-overabundant plasma (§ 2.2.1). Accretion of low-metallicity material from the secondary is a possibility given the high elevation above the Galactic disc (§ 1.3), suggesting the system belongs to an old stellar population. But the composition of the accreted matter is not the only possible source of iron deficiency. Heavy elements, including Fe, are expected to sink below the surface of a white dwarf and they sink faster the hotter the white dwarf is (Koester, 2009; Kepler et al., 2016). If a large portion of the ejecta originates on the white dwarf, it is natural to expect it may be both Fe-deficient and CNO-overabundant. This is exactly what was found in the XMM-Newton spectroscopy of V906 Car (Sokolovsky et al., 2020a).
3.11 Ejecta mass
One can use the column density, expressed in and derived from the X-ray spectral fitting (§ 2.2.1), to estimate the nova ejecta mass under a set of assumptions. We assume that the source of hard X-rays is embedded deep within the ejecta (shining through most of it). The ejecta ahead of the shock (absorbing the X-ray emission) is neutral or weakly ionized, as atoms stripped of all their electrons will not contribute to photoelectric absorption. A spherical absorbing shell is ejected at and expands with velocities ranging from to . The ejecta are distributed with a density profile (e.g. Bode & Evans, 2008). This is the ‘Hubble flow’ model often used to describe thermal radio emission of novae (Weston et al., 2016a, b; Finzell et al., 2018, e.g.). Following Chomiuk et al. (2014b), we assume .
Our assumptions about the ejecta abundances (§ 3.10) have a dramatic effect on the derived column density (§ 2.2.1), with the true value likely lying somewhere between the two extremes listed in Table 2. Aydi el al. (in prep.) identify two flows on the basis of optical spectroscopy of YZ Ret: the fast flow with velocity of 2700 km s-1 and an intermediate flow with velocity of 1200 km s-1. We do not know which of the two flows carries the most mass. Combining the assumptions about column density (abundances) and maximum ejecta velocity for the flow that carries the most mass, we end up with estimates of the ejected mass of hydrogen in the range ( km s-1, cm-2) to ( km s-1, cm-2). To obtain the total ejecta mass, the hydrogen mass should be multiplied by a factor of 1.90 for the abundances of nova V906 Car (Sokolovsky et al., 2020a), or a factor of 1.36 for the solar abundances of Asplund et al. (2009).
Our final estimate of the ejecta mass in YZ Ret is , with an order of magnitude uncertainty, as described above. The ejecta mass derived for V906 Car by Sokolovsky et al. (2020a) using the same technique falls in the middle of the range allowed for YZ Ret, so we speculate that the ejected mass in the two novae may be comparable.
Comparing the X-ray absorption-based ejecta mass estimate to theoretical expectations and ejecta mass estimates made via other methods, we can check where the X-ray emitting shock is located relative to the bulk of the ejecta. If the column ahead of the shocks is high (ejecta mass ), than the shocks are likely embedded behind the bulk of the ejecta (since nova ejecta masses are strained to go above ; Yaron et al. 2005). On the other hand, if the column implies the ejecta mass , than the observed emission may be dominated by X-rays escaping from a select few directions with a particularly low column. The ejecta mass range estimated above seems to support the former picture.
4 Conclusions
We conducted a joint analysis of Fermi/LAT, NuSTAR and XMM-Newton observations of a bright Galactic nova YZ Ret. The luminosity of YZ Ret (Table 3) is well constrained thanks to a Gaia parallax measurement of the bright progenitor: a VY Scl type novalike variable with hot accretion disc. The GeV, X-ray and optical luminosity of YZ Ret is similar to other GeV-bright novae (§ 3.2).
The nova X-ray emission observed by NuSTAR at d is consistent with being single-temperature thermal (§ 3.4). The low ratio is at odds with the theoretical predictions (§ 3.5, Table 4, Metzger et al., 2015). The absence of non-thermal X-rays is consistent with both the leptonic and hadronic scenarios for the production of -rays detected by Fermi/LAT (§ 3.4).
From the variability time-scale and shock velocity arguments, we constrain the shocked region size to be less than 1.6 au on d (§ 3.6). No periodicities were identified in the arrival times of X-ray photons recorded by NuSTAR (§ 2.2.2) and XMM-Newton (§ 2.3.2). The shock-heated region must be associated with the expanding nova shell, not a structure within the binary system (such as the white dwarf magnetosphere, accretion disc, bow shock of the donor star). The emission line dominated SSS spectrum observed with XMM-Newton at d suggests YZ Ret is a high-inclination system (§ 3.8) with a CO white dwarf.
We use the intrinsic absorption affecting the NuSTAR spectrum to estimate an ejecta mass of (with an order of magnitude uncertainty) in the framework of the Hubble flow model (§ 3.11). The estimate is model-dependent and highly sensitive to the assumptions on the range of ejecta velocities, abundances, ejection time and location of the X-ray emitting region. This results in at least an order of magnitude uncertainty in the ejected mass estimate. Also the photoelectric-absorption based ejecta mass estimate does not account for any fully ionized material.
Data availability
The processed data underlying this work are available at the request to the first author. The raw data are publicly available at NuSTAR, XMM-Newton and Fermi science archives.
Acknowledgements
We thank Dr. Marina Orio for sharing the Chandra spectrum of YZ Ret, which greatly helped interpreting the results of XMM-Newton spectroscopy. We acknowledge with thanks the variable star observations from the AAVSO International Database contributed by observers worldwide and used in this research. KVS thanks Dr. Nikolai N. Samus for the help in gathering information about the circumstances surrounding the discovery of YZ Ret. We acknowledge ESA Gaia, DPAC and the Photometric Science Alerts Team (http://gsaweb.ast.cam.ac.uk/alerts). This material is based upon work supported by the National Science Foundation under Grant No. AST-1751874. We acknowledge support for this work from NASA grants NASA/NuSTAR 80NSSC21K0277, NASA/Fermi 80NSSC20K1535, and NASA/Swift 80NSSC21K0173 and from a Cottrell Scholarship from the Research Corporation. We acknowledge support from the Packard Foundation. RLO acknowledges financial support from the Brazilian institutions Conselho Nacional de Desenvolvimento Científico e Tecnológico (CNPq - PQ Grant; 312705/2020-4) and Fundação de Amparo à Pesquisa do Estado de São Paulo (FAPESP - Visiting Researcher Grant; 2020/00457-4). BDM acknowledges support from NASA (grant 80NSSC20K1557). KLP acknowledges support from the UK Space Agency. JS acknowledges support from the Packard Foundation. KLL is supported by the Ministry of Science and Technology of the Republic of China (Taiwan) through grants 108-2112-M-007-025-MY3 and 109-2636-M-006-017, and he is a Yushan (Young) Scholar of the Ministry of Education of the Republic of China (Taiwan). IV acknowledges support by the ETAg grant PRG1006 and by EU through the ERDF CoE grant TK133.
References
- Abdo et al. (2009) Abdo A. A., et al., 2009, Astroparticle Physics, 32, 193
- Abdo et al. (2010) Abdo A. A., et al., 2010, Science, 329, 817
- Abdo et al. (2011) Abdo A. A., et al., 2011, ApJ, 734, 116
- Abdollahi et al. (2020) Abdollahi S., et al., 2020, ApJS, 247, 33
- Ackermann et al. (2012) Ackermann M., et al., 2012, ApJS, 203, 4
- Ackermann et al. (2014) Ackermann M., et al., 2014, Science, 345, 554
- Adams et al. (2013) Adams S. M., Kochanek C. S., Beacom J. F., Vagins M. R., Stanek K. Z., 2013, ApJ, 778, 164
- Ajello et al. (2021) Ajello M., et al., 2021, ApJS, 252, 13
- Arnaud (1996) Arnaud K. A., 1996, in Jacoby G. H., Barnes J., eds, Astronomical Society of the Pacific Conference Series Vol. 101, Astronomical Data Analysis Software and Systems V. p. 17
- Arnaud et al. (2011) Arnaud K., Smith R., Siemiginowska A., 2011, Handbook of X-ray Astronomy
- Asplund et al. (2009) Asplund M., Grevesse N., Sauval A. J., Scott P., 2009, ARA&A, 47, 481
- Atwood et al. (2009) Atwood W. B., et al., 2009, ApJ, 697, 1071
- Aydi et al. (2020a) Aydi E., et al., 2020a, Nature Astronomy, 4, 776
- Aydi et al. (2020b) Aydi E., et al., 2020b, ApJ, 905, 62
- Aydi et al. (2020c) Aydi E., et al., 2020c, The Astronomer’s Telegram, 13867, 1
- Aydi et al. (2021) Aydi E., et al., 2021, arXiv e-prints, p. arXiv:2108.07868
- Bailer-Jones et al. (2018) Bailer-Jones C. A. L., Rybizki J., Fouesneau M., Mantelet G., Andrae R., 2018, AJ, 156, 58
- Bajaja et al. (2005) Bajaja E., Arnal E. M., Larrarte J. J., Morras R., Pöppel W. G. L., Kalberla P. M. W., 2005, A&A, 440, 767
- Balman (2020) Balman Ş., 2020, Advances in Space Research, 66, 1097
- Balucinska-Church & McCammon (1992) Balucinska-Church M., McCammon D., 1992, ApJ, 400, 699
- Bambi (2020) Bambi C., 2020, Tutorial Guide to X-ray and Gamma-ray Astronomy; Data Reduction and Analysis, doi:10.1007/978-981-15-6337-9.
- Bessell et al. (1998) Bessell M. S., Castelli F., Plez B., 1998, A&A, 333, 231
- Blandford & Ostriker (1978) Blandford R. D., Ostriker J. P., 1978, ApJ, 221, L29
- Bode & Evans (2008) Bode M. F., Evans A., 2008, Classical Novae
- Boller et al. (2016) Boller T., Freyberg M. J., Trümper J., Haberl F., Voges W., Nandra K., 2016, A&A, 588, A103
- Bond (2020) Bond H. E., 2020, The Astronomer’s Telegram, 13825, 1
- Bond & Miszalski (2018) Bond H. E., Miszalski B., 2018, PASP, 130, 094201
- Böttcher et al. (2013) Böttcher M., Reimer A., Sweeney K., Prakash A., 2013, ApJ, 768, 54
- Brickhouse et al. (2005) Brickhouse N. S., Desai P., Hoogerwerf R., Liedahl D. A., Smith R. K., 2005, in Smith R., ed., American Institute of Physics Conference Series Vol. 774, X-ray Diagnostics of Astrophysical Plasmas: Theory, Experiment, and Observation. pp 405–407, doi:10.1063/1.1960961
- Brinkman et al. (2000) Brinkman A. C., et al., 2000, ApJ, 530, L111
- Bruel et al. (2018) Bruel P., Burnett T. H., Digel S. W., Johannesson G., Omodei N., Wood M., 2018, arXiv e-prints, p. arXiv:1810.11394
- Budding & Demircan (2007) Budding E., Demircan O., 2007, Introduction to Astronomical Photometry. Cambridge observing handbooks for research astronomers Vol. 6
- Buson et al. (2019) Buson S., Jean P., Cheung C. C., 2019, The Astronomer’s Telegram, 13114, 1
- Buson et al. (2021) Buson S., Cheung C. C., Jean P., 2021, The Astronomer’s Telegram, 14658, 1
- Byckling et al. (2010) Byckling K., Mukai K., Thorstensen J. R., Osborne J. P., 2010, MNRAS, 408, 2298
- Caprioli & Spitkovsky (2014) Caprioli D., Spitkovsky A., 2014, ApJ, 783, 91
- Carr et al. (2020) Carr A., Said K., Davis T. M., Lidman C., Tucker B. E., 2020, The Astronomer’s Telegram, 13874, 1
- Cerruti (2020) Cerruti M., 2020, Galaxies, 8, 72
- Cheung et al. (2012) Cheung C. C., Shore S. N., De Gennaro Aquino I., Charbonnel S., Edlin J., Hays E., Corbet R. H. D., Wood D. L., 2012, The Astronomer’s Telegram, 4310, 1
- Cheung et al. (2016) Cheung C. C., et al., 2016, ApJ, 826, 142
- Chlebowski & Garmany (1991) Chlebowski T., Garmany C. D., 1991, ApJ, 368, 241
- Chochol et al. (2021) Chochol D., Shugarov S., Hambálek Ľ., Skopal A., Parimucha Š., Dubovský P., 2021, in The Golden Age of Cataclysmic Variables and Related Objects V. 2-7 September 2019. Palermo. p. 29 (arXiv:2007.13337)
- Chomiuk et al. (2012) Chomiuk L., et al., 2012, ApJ, 761, 173
- Chomiuk et al. (2014a) Chomiuk L., et al., 2014a, Nature, 514, 339
- Chomiuk et al. (2014b) Chomiuk L., et al., 2014b, ApJ, 788, 130
- Chomiuk et al. (2021) Chomiuk L., Metzger B. D., Shen K. J., 2021, ARA&A, 59
- Collazzi et al. (2009) Collazzi A. C., Schaefer B. E., Xiao L., Pagnotta A., Kroll P., Löchel K., Henden A. A., 2009, AJ, 138, 1846
- Coppejans & Knigge (2020) Coppejans D. L., Knigge C., 2020, New Astron. Rev., 89, 101540
- Coppejans et al. (2016) Coppejans D. L., et al., 2016, MNRAS, 463, 2229
- Cowley & MacConnell (1972) Cowley A. P., MacConnell D. J., 1972, ApJ, 176, L27
- Craig et al. (2011) Craig W. W., et al., 2011, in O’Dell S. L., Pareschi G., eds, Society of Photo-Optical Instrumentation Engineers (SPIE) Conference Series Vol. 8147, Society of Photo-Optical Instrumentation Engineers (SPIE) Conference Series. p. 81470H, doi:10.1117/12.895278
- Darnley & Starrfield (2018) Darnley M. J., Starrfield S., 2018, Research Notes of the American Astronomical Society, 2, 24
- Darnley et al. (2017) Darnley M. J., et al., 2017, ApJ, 847, 35
- Darnley et al. (2018) Darnley M. J., Page K. L., Beardmore A. P., Henze M., Starrfield S., 2018, The Astronomer’s Telegram, 11905, 1
- Davis et al. (1988) Davis R. J., Taylor A. R., Bode M. F., Porcas R. W., 1988, in Reid M. J., Moran J. M., eds, Proceedings of the 129th IAU Symposium, Cambridge, MA, May 10-15, 1987 Vol. 129, The Impact of VLBI on Astrophysics and Geophysics. p. 277
- De et al. (2021) De K., et al., 2021, ApJ, 912, 19
- Deeming (1975) Deeming T. J., 1975, Ap&SS, 36, 137
- Della Valle & Izzo (2020) Della Valle M., Izzo L., 2020, A&ARv, 28, 3
- Denisenko (2020) Denisenko D., 2020, The Astronomer’s Telegram, 13829, 1
- Derdzinski et al. (2017) Derdzinski A. M., Metzger B. D., Lazzati D., 2017, MNRAS, 469, 1314
- Dhillon (1996) Dhillon V. S., 1996, The Nova-like variables. p. 3, doi:10.1007/978-94-009-0325-8_1
- Done et al. (2007) Done C., Gierliński M., Kubota A., 2007, A&ARv, 15, 1
- Drake et al. (2009) Drake A. J., et al., 2009, ApJ, 696, 870
- Drake et al. (2020) Drake J. J., Orio M., Bearmore A., Behar E., Luna G. J. M., Ness J.-U., 2020, The Astronomer’s Telegram, 14214, 1
- Dubus et al. (2017) Dubus G., Guillard N., Petrucci P.-O., Martin P., 2017, A&A, 608, A59
- Dwyer (2012) Dwyer J. R., 2012, Journal of Geophysical Research (Space Physics), 117, A02308
- Dwyer et al. (2012) Dwyer J. R., Smith D. M., Cummer S. A., 2012, Space Sci. Rev., 173, 133
- Dyson & Williams (1997) Dyson J. E., Williams D. A., 1997, The physics of the interstellar medium, doi:10.1201/9780585368115.
- Evans et al. (2009) Evans P. A., Beardmore A. P., Osborne J. P., Wynn G. A., 2009, MNRAS, 399, 1167
- Fang et al. (2020) Fang K., Metzger B. D., Vurm I., Aydi E., Chomiuk L., 2020, ApJ, 904, 4
- Ferlet et al. (1985) Ferlet R., Vidal-Madjar A., Gry C., 1985, ApJ, 298, 838
- Fields et al. (2016) Fields C. E., Farmer R., Petermann I., Iliadis C., Timmes F. X., 2016, ApJ, 823, 46
- Figueira et al. (2018) Figueira J., José J., García-Berro E., Campbell S. W., García-Senz D., Mohamed S., 2018, A&A, 613, A8
- Figuera Jaimes et al. (2013) Figuera Jaimes R., Arellano Ferro A., Bramich D. M., Giridhar S., Kuppuswamy K., 2013, A&A, 556, A20
- Finzell et al. (2018) Finzell T., et al., 2018, ApJ, 852, 108
- Franckowiak et al. (2018) Franckowiak A., Jean P., Wood M., Cheung C. C., Buson S., 2018, A&A, 609, A120
- Frank et al. (2002) Frank J., King A., Raine D. J., 2002, Accretion Power in Astrophysics: Third Edition
- Gaggero et al. (2015) Gaggero D., Grasso D., Marinelli A., Urbano A., Valli M., 2015, ApJ, 815, L25
- Gaia Collaboration et al. (2018) Gaia Collaboration et al., 2018, A&A, 616, A1
- Galan & Mikolajewska (2020) Galan C., Mikolajewska J., 2020, The Astronomer’s Telegram, 14149, 1
- Geballe et al. (2019) Geballe T. R., et al., 2019, ApJ, 886, L14
- Gehrels (1997) Gehrels N., 1997, Nuovo Cimento B Serie, 112B, 11
- Gehrz et al. (1998) Gehrz R. D., Truran J. W., Williams R. E., Starrfield S., 1998, PASP, 110, 3
- Ginzburg & Quataert (2021) Ginzburg S., Quataert E., 2021, MNRAS, 507, 475
- Giroletti et al. (2020) Giroletti M., et al., 2020, A&A, 638, A130
- Gomez-Gomar et al. (1998) Gomez-Gomar J., Hernanz M., Jose J., Isern J., 1998, MNRAS, 296, 913
- Gordon et al. (2021) Gordon A. C., Aydi E., Page K. L., Li K.-L., Chomiuk L., Sokolovsky K. V., Mukai K., Seitz J., 2021, ApJ, 910, 134
- Gough (2009) Gough B., 2009, GNU scientific library reference manual. Network Theory Ltd.
- Greiner (2000) Greiner J., 2000, New Astron. Rev., 44, 149
- Greiner & Teeseling (1998) Greiner J., Teeseling A., 1998, A&A, 339, L21
- Greiner et al. (1999) Greiner J., Tovmassian G. H., Di Stefano R., Prestwich A., González-Riestra R., Szentasko L., Chavarría C., 1999, A&A, 343, 183
- Greiner et al. (2001) Greiner J., et al., 2001, A&A, 376, 1031
- Greiner et al. (2010) Greiner J., Schwarz R., Tappert C., Mennickent R. E., Reinsch K., Sala G., 2010, Astronomische Nachrichten, 331, 227
- Guainazzi & Bianchi (2007) Guainazzi M., Bianchi S., 2007, MNRAS, 374, 1290
- Güdel & Nazé (2009) Güdel M., Nazé Y., 2009, A&ARv, 17, 309
- Gulati et al. (2022) Gulati A., Murphy T., Wang Y., Leung J., Pritchard J., Lenc E., Kaplan D., 2022, The Astronomer’s Telegram, 15264, 1
- Gurevich et al. (1992) Gurevich A. V., Milikh G. M., Roussel-Dupre R., 1992, Physics Letters A, 165, 463
- Güver & Özel (2009) Güver T., Özel F., 2009, MNRAS, 400, 2050
- Hameury (2020) Hameury J. M., 2020, Advances in Space Research, 66, 1004
- Hameury & Lasota (2002) Hameury J. M., Lasota J. P., 2002, A&A, 394, 231
- Harrison et al. (2013) Harrison F. A., et al., 2013, ApJ, 770, 103
- Harvey et al. (2016) Harvey E., Redman M. P., Boumis P., Akras S., 2016, A&A, 595, A64
- Hasinger (1994) Hasinger G., 1994, Reviews in Modern Astronomy, 7, 129
- Heirtzler (2002) Heirtzler J., 2002, Journal of Atmospheric and Solar-Terrestrial Physics, 64, 1701
- Hellier (2001) Hellier C., 2001, Cataclysmic Variable Stars
- Hellier & Naylor (1998) Hellier C., Naylor T., 1998, MNRAS, 295, L50
- Helton et al. (2012) Helton L. A., et al., 2012, ApJ, 755, 37
- Hernanz (2014) Hernanz M., 2014, in Woudt P. A., Ribeiro V. A. R. M., eds, Astronomical Society of the Pacific Conference Series Vol. 490, Stellar Novae: Past and Future Decades. p. 319 (arXiv:1305.0769)
- Hernanz et al. (2002) Hernanz M., et al., 2002, in Hernanz M., José J., eds, American Institute of Physics Conference Series Vol. 637, Classical Nova Explosions. pp 435–439, doi:10.1063/1.1518243
- Hillman et al. (2020) Hillman Y., Shara M. M., Prialnik D., Kovetz A., 2020, Nature Astronomy, 4, 886
- Hoffmeister et al. (1984) Hoffmeister C., Richter G., Wenzel W., 1984, Veraenderliche Sterne
- Honeycutt (2001) Honeycutt R. K., 2001, PASP, 113, 473
- Honeycutt & Kafka (2004) Honeycutt R. K., Kafka S., 2004, AJ, 128, 1279
- Honeycutt et al. (1998) Honeycutt R. K., Robertson J. W., Turner G. W., 1998, AJ, 115, 2527
- Honeycutt et al. (2011) Honeycutt R. K., Robertson J. W., Kafka S., 2011, AJ, 141, 121
- Howell et al. (2001) Howell S. B., Nelson L. A., Rappaport S., 2001, ApJ, 550, 897
- Iijima & Esenoglu (2003) Iijima T., Esenoglu H. H., 2003, A&A, 404, 997
- Izzo et al. (2020) Izzo L., et al., 2020, The Astronomer’s Telegram, 14048, 1
- Jose (2016) Jose J., 2016, Stellar Explosions: Hydrodynamics and Nucleosynthesis, doi:10.1201/b19165.
- Joye & Mandel (2003) Joye W. A., Mandel E., 2003, New Features of SAOImage DS9. p. 489
- Kafka (2021) Kafka S., 2021, Observations from the AAVSO International Database, https://www.aavso.org
- Kahabka & van den Heuvel (1997) Kahabka P., van den Heuvel E. P. J., 1997, ARA&A, 35, 69
- Kalberla et al. (2005) Kalberla P. M. W., Burton W. B., Hartmann D., Arnal E. M., Bajaja E., Morras R., Pöppel W. G. L., 2005, A&A, 440, 775
- Kato (2010) Kato M., 2010, Astronomische Nachrichten, 331, 140
- Kato & Hachisu (2003) Kato M., Hachisu I., 2003, ApJ, 587, L39
- Kato et al. (2016) Kato M., et al., 2016, ApJ, 830, 40
- Kaufman et al. (2020) Kaufman R., et al., 2020, Central Bureau Electronic Telegrams, 4812, 1
- Kazarovets et al. (2020) Kazarovets E., O’Meara S. J., McNaught R. H., Pearce A., de S. Aguiar J. G., Souza W., 2020, Central Bureau Electronic Telegrams, 4826, 1
- Kellogg et al. (1975) Kellogg E., Baldwin J. R., Koch D., 1975, ApJ, 199, 299
- Kepler et al. (2016) Kepler S. O., Koester D., Ourique G., 2016, Science, 352, 67
- Kerr (2011) Kerr M., 2011, ApJ, 732, 38
- Kilkenny et al. (2015) Kilkenny D., O’Donoghue D., Worters H. L., Koen C., Hambly N., MacGillivray H., 2015, MNRAS, 453, 1879
- Kitchin (2009) Kitchin C. R., 2009, Astrophysical Techniques, Fifth Edition
- Knigge et al. (2011) Knigge C., Baraffe I., Patterson J., 2011, ApJS, 194, 28
- Kochanek et al. (2017) Kochanek C. S., et al., 2017, PASP, 129, 104502
- Koester (2009) Koester D., 2009, A&A, 498, 517
- König et al. (2022) König O., et al., 2022, Nature, 605, 248
- Kraft et al. (1991) Kraft R. P., Burrows D. N., Nousek J. A., 1991, ApJ, 374, 344
- Krautter (2002) Krautter J., 2002, in Hernanz M., José J., eds, American Institute of Physics Conference Series Vol. 637, Classical Nova Explosions. pp 345–354, doi:10.1063/1.1518228
- Krautter (2008) Krautter J., 2008, in Evans A., Bode M. F., O’Brien T. J., Darnley M. J., eds, Astronomical Society of the Pacific Conference Series Vol. 401, RS Ophiuchi (2006) and the Recurrent Nova Phenomenon. p. 139
- Kumar & Zhang (2015) Kumar P., Zhang B., 2015, Phys. Rep., 561, 1
- Leach et al. (1999) Leach R., Hessman F. V., King A. R., Stehle R., Mattei J., 1999, MNRAS, 305, 225
- Li (2021) Li K.-L., 2021, The Astronomer’s Telegram, 14705, 1
- Li et al. (2012) Li K. L., et al., 2012, ApJ, 761, 99
- Li et al. (2017) Li K.-L., et al., 2017, Nature Astronomy, 1, 697
- Li et al. (2018) Li K.-L., Chomiuk L., Strader J., 2018, The Astronomer’s Telegram, 11590, 1
- Li et al. (2019) Li K.-L., et al., 2019, The Astronomer’s Telegram, 13116, 1
- Li et al. (2020a) Li K.-L., Hambsch F.-J., Munari U., Metzger B. D., Chomiuk L., Frigo A., Strader J., 2020a, ApJ, 905, 114
- Li et al. (2020b) Li K.-L., Kong A., Aydi E., Sokolovsky K., Chomiuk L., Kawash A., Strader J., 2020b, The Astronomer’s Telegram, 13868, 1
- Linford et al. (2018) Linford J. D., et al., 2018, The Astronomer’s Telegram, 11647, 1
- Liu & Hu (2000) Liu W., Hu J. Y., 2000, ApJS, 128, 387
- Livio & Truran (1994) Livio M., Truran J. W., 1994, ApJ, 425, 797
- Livio et al. (1992) Livio M., Mastichiadis A., Oegelman H., Truran J. W., 1992, ApJ, 394, 217
- Madlee et al. (2020) Madlee S., Mitthumsiri W., Ruffolo D., Digel S., Nuntiyakul W., 2020, Journal of Geophysical Research (Space Physics), 125, e28151
- Madsen et al. (2015) Madsen K. K., et al., 2015, ApJS, 220, 8
- Madsen et al. (2020) Madsen K. K., Grefenstette B. W., Pike S., Miyasaka H., Brightman M., Forster K., Harrison F. A., 2020, arXiv e-prints, p. arXiv:2005.00569
- Mailyan et al. (2016) Mailyan B. G., et al., 2016, Journal of Geophysical Research (Space Physics), 121, 11,346
- Mamajek et al. (2015) Mamajek E. E., et al., 2015, arXiv e-prints, p. arXiv:1510.06262
- Martin et al. (2018) Martin P., Dubus G., Jean P., Tatischeff V., Dosne C., 2018, A&A, 612, A38
- Mason et al. (2001) Mason K. O., et al., 2001, A&A, 365, L36
- Mattox et al. (1996) Mattox J. R., et al., 1996, ApJ, 461, 396
- Max-Moerbeck et al. (2014) Max-Moerbeck W., Richards J. L., Hovatta T., Pavlidou V., Pearson T. J., Readhead A. C. S., 2014, MNRAS, 445, 437
- McLoughlin et al. (2021a) McLoughlin D., Blundell K. M., Lee S., McCowage C., 2021a, MNRAS, 503, 704
- McLoughlin et al. (2021b) McLoughlin D., Blundell K. M., Lee S., McCowage C., 2021b, MNRAS, 505, 2518
- McNaught (2020) McNaught R. H., 2020, Central Bureau Electronic Telegrams, 4811, 1
- Metzger et al. (2014) Metzger B. D., Hascoët R., Vurm I., Beloborodov A. M., Chomiuk L., Sokoloski J. L., Nelson T., 2014, MNRAS, 442, 713
- Metzger et al. (2015) Metzger B. D., Finzell T., Vurm I., Hascoët R., Beloborodov A. M., Chomiuk L., 2015, MNRAS, 450, 2739
- Metzger et al. (2016) Metzger B. D., Caprioli D., Vurm I., Beloborodov A. M., Bartos I., Vlasov A., 2016, MNRAS, 457, 1786
- Miszalski et al. (2016) Miszalski B., et al., 2016, MNRAS, 456, 633
- Morii et al. (2013) Morii M., et al., 2013, ApJ, 779, 118
- Morii et al. (2016) Morii M., Yamaoka H., Mihara T., Matsuoka M., Kawai N., 2016, PASJ, 68, S11
- Mróz et al. (2015) Mróz P., et al., 2015, Acta Astron., 65, 313
- Mróz et al. (2016) Mróz P., et al., 2016, Nature, 537, 649
- Mukai (2017) Mukai K., 2017, PASP, 129, 062001
- Mukai & Orio (2005) Mukai K., Orio M., 2005, ApJ, 622, 602
- Mukai et al. (2014) Mukai K., et al., 2014, in Woudt P. A., Ribeiro V. A. R. M., eds, Astronomical Society of the Pacific Conference Series Vol. 490, Stellar Novae: Past and Future Decades. p. 327
- Munari et al. (2011) Munari U., et al., 2011, MNRAS, 410, L52
- Munari et al. (2017) Munari U., Hambsch F. J., Frigo A., 2017, MNRAS, 469, 4341
- Nasa High Energy Astrophysics Science Archive Research Center (Heasarc) (2014) Nasa High Energy Astrophysics Science Archive Research Center (Heasarc) 2014, HEAsoft: Unified Release of FTOOLS and XANADU (ascl:1408.004)
- Nelemans et al. (2016) Nelemans G., Siess L., Repetto S., Toonen S., Phinney E. S., 2016, ApJ, 817, 69
- Nelson et al. (2008) Nelson T., Orio M., Cassinelli J. P., Still M., Leibowitz E., Mucciarelli P., 2008, ApJ, 673, 1067
- Nelson et al. (2012) Nelson T., Donato D., Mukai K., Sokoloski J., Chomiuk L., 2012, ApJ, 748, 43
- Nelson et al. (2019) Nelson T., et al., 2019, ApJ, 872, 86
- Nelson et al. (2021) Nelson T., et al., 2021, MNRAS, 500, 2798
- Ness (2012) Ness J. U., 2012, Bulletin of the Astronomical Society of India, 40, 353
- Ness et al. (2003) Ness J. U., et al., 2003, ApJ, 594, L127
- Ness et al. (2005) Ness J.-U., Starrfield S., Jordan C., Krautter J., Schmitt J. H. M. M., 2005, MNRAS, 364, 1015
- Ness et al. (2007a) Ness J.-U., Schwarz G. J., Retter A., Starrfield S., Schmitt J. H. M. M., Gehrels N., Burrows D., Osborne J. P., 2007a, ApJ, 663, 505
- Ness et al. (2007b) Ness J. U., et al., 2007b, ApJ, 665, 1334
- Ness et al. (2009) Ness J. U., et al., 2009, AJ, 137, 3414
- Ness et al. (2011) Ness J. U., et al., 2011, ApJ, 733, 70
- Ness et al. (2012) Ness J. U., et al., 2012, ApJ, 745, 43
- Ness et al. (2013) Ness J. U., et al., 2013, A&A, 559, A50
- Ness et al. (2015) Ness J. U., et al., 2015, A&A, 578, A39
- Ness et al. (2022) Ness J. U., et al., 2022, A&A, 658, A169
- O’Brien & Cohen (1998) O’Brien T. J., Cohen J. G., 1998, ApJ, 498, L59
- Orio (2020) Orio M., 2020, Advances in Space Research, 66, 1193
- Orio et al. (2013) Orio M., et al., 2013, MNRAS, 429, 1342
- Orio et al. (2015) Orio M., Rana V., Page K. L., Sokoloski J., Harrison F., 2015, MNRAS, 448, L35
- Orio et al. (2018) Orio M., et al., 2018, ApJ, 862, 164
- Orio et al. (2020) Orio M., et al., 2020, ApJ, 895, 80
- Orio et al. (2021) Orio M., et al., 2021, MNRAS, 505, 3113
- Orlando et al. (2009) Orlando S., Drake J. J., Laming J. M., 2009, A&A, 493, 1049
- Orlando et al. (2017) Orlando S., Drake J. J., Miceli M., 2017, MNRAS, 464, 5003
- Osaki (2005) Osaki Y., 2005, Proceeding of the Japan Academy, Series B, 81, 291
- Page et al. (2014) Page K. L., Osborne J. P., Beardmore A. P., Evans P. A., Rosen S. R., Watson M. G., 2014, A&A, 570, A37
- Page et al. (2020) Page K. L., et al., 2020, MNRAS, 499, 4814
- Patterson (2011) Patterson J., 2011, MNRAS, 411, 2695
- Patterson et al. (2013) Patterson J., et al., 2013, MNRAS, 434, 1902
- Pei et al. (2020) Pei S., et al., 2020, The Astronomer’s Telegram, 14067, 1
- Peretz et al. (2016) Peretz U., Orio M., Behar E., Bianchini A., Gallagher J., Rauch T., Tofflemire B., Zemko P., 2016, ApJ, 829, 2
- Poggiani (2018) Poggiani R., 2018, arXiv e-prints, p. arXiv:1803.11529
- Pshirkov (2016) Pshirkov M. S., 2016, MNRAS, 457, L99
- Read et al. (2008) Read A. M., et al., 2008, A&A, 482, L1
- Romero et al. (2017) Romero G. E., Boettcher M., Markoff S., Tavecchio F., 2017, Space Sci. Rev., 207, 5
- Rudy et al. (2021) Rudy R. J., Russell R. W., Sitko M. L., 2021, Research Notes of the American Astronomical Society, 5, 48
- Rupen et al. (2008) Rupen M. P., Mioduszewski A. J., Sokoloski J. L., 2008, ApJ, 688, 559
- Salazar et al. (2017) Salazar I. V., LeBleu A., Schaefer B. E., Land olt A. U., Dvorak S., 2017, MNRAS, 469, 4116
- Samus’ et al. (2017) Samus’ N. N., Kazarovets E. V., Durlevich O. V., Kireeva N. N., Pastukhova E. N., 2017, Astronomy Reports, 61, 80
- Saxton & Gimeno (2011) Saxton R., Gimeno C. D. T., 2011, in Evans I. N., Accomazzi A., Mink D. J., Rots A. H., eds, Astronomical Society of the Pacific Conference Series Vol. 442, Astronomical Data Analysis Software and Systems XX. p. 567
- Saxton et al. (2008) Saxton R. D., Read A. M., Esquej P., Freyberg M. J., Altieri B., Bermejo D., 2008, A&A, 480, 611
- Schaefer (2010) Schaefer B. E., 2010, ApJS, 187, 275
- Schaefer (2018) Schaefer B. E., 2018, MNRAS, 481, 3033
- Schaefer (2021) Schaefer B. E., 2021, Research Notes of the American Astronomical Society, 5, 150
- Schenker et al. (1998) Schenker K., Kolb U., Ritter H., 1998, MNRAS, 297, 633
- Schmidtobreick et al. (2015) Schmidtobreick L., Shara M., Tappert C., Bayo A., Ederoclite A., 2015, MNRAS, 449, 2215
- Schure et al. (2012) Schure K. M., Bell A. R., O’C Drury L., Bykov A. M., 2012, Space Sci. Rev., 173, 491
- Schwarz et al. (2001) Schwarz G. J., Shore S. N., Starrfield S., Hauschildt P. H., Della Valle M., Baron E., 2001, MNRAS, 320, 103
- Schwarz et al. (2011) Schwarz G. J., et al., 2011, ApJS, 197, 31
- Shafter (2017) Shafter A. W., 2017, ApJ, 834, 196
- Shappee et al. (2014) Shappee B. J., et al., 2014, ApJ, 788, 48
- Shara (1989) Shara M. M., 1989, PASP, 101, 5
- Shara et al. (2007) Shara M. M., et al., 2007, Nature, 446, 159
- Shara et al. (2012) Shara M. M., Mizusawa T., Wehinger P., Zurek D., Martin C. D., Neill J. D., Forster K., Seibert M., 2012, ApJ, 758, 121
- Shara et al. (2017) Shara M. M., et al., 2017, Nature, 548, 558
- Shaviv (1998) Shaviv N. J., 1998, ApJ, 494, L193
- Shaviv (2001a) Shaviv N. J., 2001a, MNRAS, 326, 126
- Shaviv (2001b) Shaviv N. J., 2001b, ApJ, 549, 1093
- Siegert et al. (2018) Siegert T., et al., 2018, A&A, 615, A107
- Singh et al. (2021) Singh K. P., Girish V., Pavana M., Ness J.-U., Anupama G. C., Orio M., 2021, MNRAS, 501, 36
- Sitko et al. (2020) Sitko M. L., Rudy R. J., Russell R. W., 2020, The Astronomer’s Telegram, 14205, 1
- Sokoloski et al. (2006) Sokoloski J. L., et al., 2006, ApJ, 636, 1002
- Sokoloski et al. (2008) Sokoloski J. L., Rupen M. P., Mioduszewski A. J., 2008, ApJ, 685, L137
- Sokolovsky et al. (2017) Sokolovsky K. V., et al., 2017, MNRAS, 464, 274
- Sokolovsky et al. (2020a) Sokolovsky K. V., et al., 2020a, MNRAS, 497, 2569
- Sokolovsky et al. (2020b) Sokolovsky K. V., et al., 2020b, The Astronomer’s Telegram, 13900, 1
- Sokolovsky et al. (2020c) Sokolovsky K., et al., 2020c, The Astronomer’s Telegram, 14043, 1
- Starrfield et al. (1972) Starrfield S., Truran J. W., Sparks W. M., Kutter G. S., 1972, ApJ, 176, 169
- Starrfield et al. (2016) Starrfield S., Iliadis C., Hix W. R., 2016, PASP, 128, 051001
- Steinberg & Metzger (2018) Steinberg E., Metzger B. D., 2018, MNRAS, 479, 687
- Steinberg & Metzger (2020) Steinberg E., Metzger B. D., 2020, MNRAS, 491, 4232
- Strüder et al. (2001) Strüder L., et al., 2001, A&A, 365, L18
- Sun et al. (2020) Sun B., Orio M., Dobrotka A., Luna G. J. M., Shugarov S., Zemko P., 2020, MNRAS, 499, 3006
- Suzuki & Shigeyama (2010) Suzuki A., Shigeyama T., 2010, ApJ, 723, L84
- Taguchi et al. (2021) Taguchi K., Maehara H., Isogai K., Tampo Y., Kojiguchi N., Kato T., Nogami D., 2021, The Astronomer’s Telegram, 14472, 1
- Tamuz et al. (2006) Tamuz O., Mazeh T., North P., 2006, MNRAS, 367, 1521
- Tappert et al. (2016) Tappert C., Barria D., Fuentes Morales I., Vogt N., Ederoclite A., Schmidtobreick L., 2016, MNRAS, 462, 1371
- Tatischeff & Hernanz (2007) Tatischeff V., Hernanz M., 2007, ApJ, 663, L101
- Toalá et al. (2020) Toalá J. A., Guerrero M. A., Santamaría E., Ramos-Larios G., Sabin L., 2020, MNRAS, 495, 4372
- Truran & Livio (1986) Truran J. W., Livio M., 1986, ApJ, 308, 721
- Turner et al. (2001) Turner M. J. L., et al., 2001, A&A, 365, L27
- Vasilopoulos et al. (2020) Vasilopoulos G., Koliopanos F., Woods T. E., Haberl F., Soraisam M. D., Udalski A., 2020, MNRAS, 499, 2007
- Verbunt (1984) Verbunt F., 1984, MNRAS, 209, 227
- Vlasov et al. (2016) Vlasov A., Vurm I., Metzger B. D., 2016, MNRAS, 463, 394
- Vogt et al. (2018) Vogt N., Tappert C., Puebla E. C., Fuentes-Morales I., Ederoclite A., Schmidtobreick L., 2018, MNRAS, 478, 5427
- Vurm & Metzger (2018) Vurm I., Metzger B. D., 2018, ApJ, 852, 62
- Wada et al. (2021) Wada Y., et al., 2021, Geophys. Res. Lett., 48, e91910
- Warner (2003) Warner B., 2003, Cataclysmic Variable Stars, doi:10.1017/CBO9780511586491.
- Weston et al. (2016a) Weston J. H. S., et al., 2016a, MNRAS, 457, 887
- Weston et al. (2016b) Weston J. H. S., et al., 2016b, MNRAS, 460, 2687
- Whewell et al. (2015) Whewell M., et al., 2015, A&A, 581, A79
- Wiescher et al. (2010) Wiescher M., Görres J., Uberseder E., Imbriani G., Pignatari M., 2010, Annual Review of Nuclear and Particle Science, 60, 381
- Williams (1985) Williams R. E., 1985, in Danziger I. J., Matteucci F., Kjar K., eds, European Southern Observatory Conference and Workshop Proceedings Vol. 21, European Southern Observatory Conference and Workshop Proceedings. pp 225–232
- Williams (1992) Williams R. E., 1992, AJ, 104, 725
- Wolf et al. (2013) Wolf W. M., Bildsten L., Brooks J., Paxton B., 2013, ApJ, 777, 136
- Wolf et al. (2018) Wolf W. M., Townsend R. H. D., Bildsten L., 2018, ApJ, 855, 127
- Yaron et al. (2005) Yaron O., Prialnik D., Shara M. M., Kovetz A., 2005, ApJ, 623, 398
- Zel’dovich & Raizer (1967) Zel’dovich Y. B., Raizer Y. P., 1967, Physics of shock waves and high-temperature hydrodynamic phenomena
- Zemko et al. (2014) Zemko P., Orio M., Mukai K., Shugarov S., 2014, MNRAS, 445, 869
- de Diego (2010) de Diego J. A., 2010, AJ, 139, 1269
- de Jager & Büsching (2010) de Jager O. C., Büsching I., 2010, A&A, 517, L9
- de Jager et al. (1989) de Jager O. C., Raubenheimer B. C., Swanepoel J. W. H., 1989, A&A, 221, 180
- den Herder et al. (2001) den Herder J. W., et al., 2001, A&A, 365, L7
- Šimon (2018) Šimon V., 2018, A&A, 614, A141
- van den Bergh & Younger (1987) van den Bergh S., Younger P. F., 1987, A&AS, 70, 125