A month of monitoring the new magnetar Swift J1555.25402 during an X-ray outburst
Abstract
The soft gamma-ray repeater Swift J1555.25402 was discovered by means of a 12-ms duration short burst detected with Swift BAT on 2021 June 3. Then 1.6 hours after the first burst detection, NICER started daily monitoring of this X-ray source for a month. The absorbed 2–10 keV flux stays nearly constant at around erg s-1 cm-2 during the monitoring timespan, showing only a slight gradual decline. A 3.86-s periodicity is detected, and the time derivative of this period is measured to be s s-1. The soft X-ray pulse shows a single sinusoidal shape with a root-mean-square pulsed fraction that increases as a function of energy from 15% at 1.5 keV to 39% at 7 keV. The equatorial surface magnetic field, characteristic age, and spin-down luminosity are derived under the dipole field approximation to be G, 2.0 kyr, and erg s-1, respectively. An absorbed blackbody with a temperature of 1.1 keV approximates the soft X-ray spectrum. Assuming a source distance of 10 kpc, the peak X-ray luminosity is erg s-1 in the 2–10 keV band. We detect 5 and 37 short bursts with Swift/BAT and NICER, respectively. Based on these observational properties, this new source is classified as a magnetar. We also coordinated hard X-ray and radio observations with NuSTAR, DSN, and VERA. A hard X-ray power-law component that extends up to at least 40 keV is detected at 3 significance. The 10–60 keV flux, which is dominated by the power-law component, is erg s-1 cm-2 with a photon index of . The pulsed fraction has a sharp cutoff above 10 keV, down to 10% in the hard-tail component band. No radio pulsations were detected during the DSN nor VERA observations. We place 7 upper limits of 0.043 mJy and 0.026 mJy on the flux density at S-band and X-band, respectively.
1 Introduction
Magnetars are highly-magnetized neutron stars that are usually bright in X-rays as a result of the release of an enormous amount of magnetic energy stored in the stellar interior and the magnetosphere (Mereghetti, 2008; Kaspi & Beloborodov, 2017). Among them, sources emitting repetitive soft gamma-ray bursts are historically called soft gamma-ray repeaters (SGRs, e.g., Kouveliotou et al. 1998). In the last decade, systematic monitoring of magnetars in the X-rays, mainly with X-Ray Telescope (XRT) onboard the Neil Gehrels Swift Observatory, revealed that many transient magnetars spend most of their time in a quiescent state with low activity. However, they occasionally exhibit a sudden X-ray brightening where the X-ray flux reaches an initial plateau – erg s-1 cm-2 lasting a few weeks, followed by the gradual decay over a couple of months (Enoto et al., 2017; Coti Zelati et al., 2018). These magnetar outbursts are characterized by enhanced persistent X-ray emission, sporadic short bursts, pulsar timing anomalies, and, rarely, giant flares. Their origin has been attributed to various mechanisms, such as the relaxation process of twisted magnetic fields, starquakes, magnetothermal evolution, and magnetic field dissipation (Thompson & Duncan, 1995, 1996; Perna & Pons, 2011; Beloborodov & Li, 2016). Multi-wavelength observations of these outbursts are essential to address a wide range of astronomical topics, as demonstrated, for example, with the discovery of Fast Radio Bursts (FRBs) associated with a short hard X-ray burst from the Galactic magnetar SGR J1935+2154 in 2020 (CHIME/FRB Collaboration et al., 2020; Bochenek et al., 2020; Mereghetti et al., 2020; Ridnaia et al., 2021; Tavani et al., 2021; Li et al., 2021). Such a connection between magnetars and FRBs are also supported by the indication that extragalactic FRBs have statistical signature of magnetar short bursts (e.g.Wadiasingh & Timokhin 2019).
On 2021 June 3, a new SGR, Swift J1555.25402, was discovered through a short burst detection with the Burst Alert Telescope (BAT) onboard Swift (Palmer et al., 2021). Immediately after the notification of the burst from this source, several X-ray satellites started follow-up observations of this magnetar candidate. These observations were promptly used to measure the spin frequency and frequency derivative (Coti Zelati et al., 2021a; Ng et al., 2021; Israel et al., 2021) and detected several short bursts (Palmer, 2021). Based on the measured strong magnetic field and its distinctive magnetar characteristics, this new source was classified as a magnetar. In addition, several radio telescopes searched for radio emission and pulsations (Bansal et al., 2021; Burgay et al., 2021; Singh & Roy, 2021). In this Letter, we report on the X-ray temporal and spectral characteristics of this new magnetar observed with Swift, the Neutron star Interior Composition Explorer (NICER), and the Nuclear Spectroscopic Telescope Array (NuSTAR) during the initial 29 days of its X-ray outburst; our observations were also coordinated with radio monitoring. Here we adopt a fiducial distance of Swift J1555.25402 at 10 kpc and the normalization factor (see discussion §4.2).
2 Observation and Data Reduction
2.1 Swift
The Swift BAT (Gehrels et al., 2004) detected a burst from an unknown source at 09:45:46 UT on 2021 June 3 (trigger number 1053220), and immediately pointed to the source direction (Palmer et al., 2021). The Swift XRT (Burrows et al., 2005) obtained X-ray data in the WT mode for 62 s from 97 s after the BAT trigger and then in the PC mode for ks from 1.1 hr after the burst. The XRT observations determined the source position (J2000.0) to be R.A. and Decl. with an uncertainty of 2.2″ radius at 90% confidence level (Evans, 2021). We adopted this source position for all analyses presented in this Letter. The BAT detected another four short bursts from the same direction, as summarized in Appendix Table B1. We analyzed the BAT data using the standard HEASoft BAT pipelines (version 6.28), following the same procedure described in Lien et al. (2016); these results are present in §3.3.
We analyzed the XRT data obtained on June 3, 4, 5, and 7. The observation IDs (ObsIDs) used in this Letter are listed in Appendix Table A1. The observations on June 4, 5, and 7 were carried out in the WT mode for a total of 8.9 ks. We processed the data through the standard procedure of FTOOLS xrtpipeline with the default filtering criteria and extracted source photons from a circular region with a 20-pixel radius (1 pixel ) centered at the target, whereas we collected background spectra from a source-free region with a similar (20-pixel) radius, located far ( ) from the source. We used the latest available RMF file in CALDB version 20210504. We generated the ARF files with the xrtmkarf tool.
2.2 NICER
NICER (Gendreau et al. 2016) onboard the International Space Station (ISS) began X-ray observations of the source at 11:21:31 UT on 2021 June 3, 1.6 hours after the first short burst detected with Swift BAT. This initial NICER observation was 2.4 ks long in exposure (ObsID 4202190101), and it was followed by high-cadence monitoring (see Appendix Table A2) carried out almost daily for 29 days under an approved cycle 3 proposal. Each ObsID had roughly 2 ks exposure and was divided into several continuous good time intervals (GTIs) with exposures of a few hundred seconds for each.
The NICER’s X-ray Timing Instrument (XTI) has on-orbit 52 active modules, each of which consists of co-aligned X-ray concentrators and silicon drift detectors. The XTI has a time resolution of 100 ns, and the total effective area is about 1,800 cm2 at around 1.5 keV. We performed the standard analysis procedures using NICERDAS (version 2020-04-23_V007a) in HEASoft 6.27.2 and NICER calibration database (version 20200722).We generated level-2 cleaned events with the nicerl2 command. For the barycentric correction, we used barycorr with Jet Propulsion Laboratory Solar system development ephemeris DE405 for the source coordinates stated above (Standish, 1998). For timing analyses and burst searches, we utilized all active 52 modules. For spectral studies, we further excluded module numbers 14 and 34 to avoid potential contamination by instrumental noise in the soft energy band. The background spectral model is generated using the 3C50 background model with nibackgen3c50 command (Remillard et al., 2021)111https://heasarc.gsfc.nasa.gov/docs/nicer/tools/nicer_bkg_est_tools.html.
2.3 NuSTAR
NuSTAR (Harrison et al. 2013) observed Swift J1555.25402 on June 5–6 for 38.4 ks exposure and two additional contemporaneous observations with NICER on June 9 (25 ks exposure) and 21 (29 ks). We processed and filtered the NuSTAR data following the standard procedures with HEASoft version 6.28 and CALDB version 20210524, using the nupipline and nuproducts commands. We extracted on-source and background spectra from circular regions of 80′′-radius centered at the source position and in a source-free region, respectively. The background-subtracted source count rates of FPMA was about 1 count s-1 in the 3–79 keV band. For the spectral fitting, we grouped source spectra using the grppha tool of HEASoft, such that each spectral bin would have a minimum of 50 counts.
2.4 Deep Space Network (DSN)
We carried out radio observations of Swift J1555.25402 for a total exposure of roughly 10.8 hours at five epochs during 2021 June 4–12 using different Deep Space Network (DSN) radio telescopes (see Table A4). Simultaneous dual-frequency bands, with center frequencies at 2.2 GHz (S-band) and 8.4 GHz (X-band), were used for all observations. We used a single circular polarization mode for DSS-34 and DSS-36, whereas a dual circular polarization mode was used at each frequency band for DSS-43.
We recorded the data in filterbank mode with a time resolution of 512 s and frequency resolution of 1 MHz using the pulsar machine in Canberra. The data processing procedure follows similar steps to those presented in earlier studies of pulsars and magnetars with the DSN (e.g., Majid et al. 2017; Pearlman et al. 2018, 2019). After first flattening the bandpass response in each data set, we removed the low-frequency variations in the temporal baseline of each frequency channel by subtracting the moving average from each data point with a time constant of 10 seconds. The sample times were then corrected to the solar system barycenter.
We dedispersed the data of each epoch with trial DMs between 0 and 5000 and subsequently searched each resulting time series for both periodic and single pulse emission. We found no statistically significant periods with a signal-to-noise ratio (S/N) above 7.0 after folding individual dedispersed time series modulo period candidates from PRESTO’s accelsearch package. In addition, we folded the dedispersed time series at each DM trial using the timing model from NICER in Table 1, but found no evidence of radio pulsations at S-band or X-band during any of our observations. For each epoch, we place 7 upper limits on the magnetar’s flux density, assuming a duty cycle of 10% (see Table A4). Based on our longest observation with DSS-43, the 70 m radio telescope in Tidbinbilla, Australia, we obtain 7 upper limits on the magnetar’s flux of 0.043 mJy at S-band and 0.026 mJy at X-band.
We also searched the dedispersed time series at each frequency band for radio bursts using a matched filtering algorithm, where the time series was convolved with boxcar functions with logarithmically spaced widths between 512 s and 150 ms. Candidates with a detection S/N above 7.0 were saved and classified using the FETCH software package (Agarwal et al., 2020). The dynamic spectra of the candidates were also visually inspected for verification. We detected no radio bursts during the radio observations and place 7 upper limits on the fluence of individual bursts during each epoch at both S-band and X-band (see Table A4). On June 5, 2021, we detected an X-ray burst, with a width of 15.91 ms (see Table B2; burst #8), during an overlapping radio and X-ray observation. However, no prompt radio emission (within 10 s of the X-ray burst time) was detected above a 7 fluence detection threshold of 1.6 Jy ms and 0.61 Jy ms at S-band and X-band, respectively.
2.5 VERA (K-band)
The 20-m-diameter Ishigaki-jima station of VLBI Exploration of Radio Astrometry (VERA) conducted a ToO observation of this source at an observation frequency of 22 GHz (1.3 cm, K-band) with a bandwidth of 512 MHz. The acquired data for one hour at 14:40–15:40 UT on 2021 June 6 were processed and folded to explore radio pulsations both with and without assuming the rotation period. Because the data quality was limited due to a low elevation of the object and bad weather conditions, we could only set an upper limit of the peak flux density of 1.02 Jy (1).
3 Analysis and Results
3.1 X-ray timing analyses
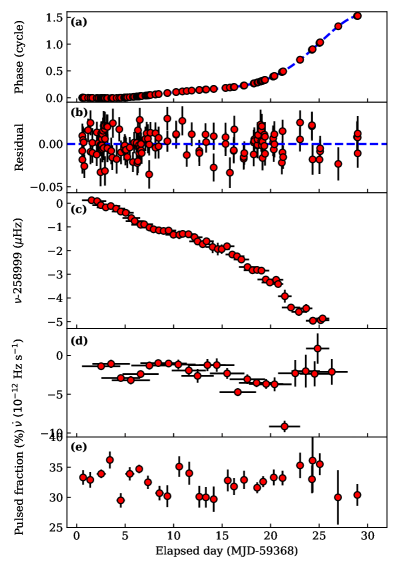
Figure 1 shows the time-series of physical parameters of Swift J1555.25402 during NICER monitoring for the 29 days from shortly after the onset of the outburst until July 1. In constructing the time-series, we first derived the pulsar spin ephemeris, for which we used a Gaussian pulse template and constructed pulse times of arrival (TOA) with an integration time of 300 s and a minimum exposure of 200 s contained in each bin, using the script photon_toa.py from NICERsoft222https://github.com/paulray/NICERsoft/. The timing analysis was carried out over 2–8 keV, where the energy range was determined from a search with to optimize the pulse significance (Buccheri et al., 1983). We used the Python-based package for high-precision timing analysis “PINT” (Luo et al., 2021, version 0.8.2) to compute the best timing model through a weighted least-squares fit to the TOAs. The TOAs were found to be well described by either a fifth-order polynomial model, as summarized in Table 1, or a glitch model with three glitch candidates (see Appendix C) for the spin evolution of Swift J1555.25402. The best-fit frequency and its derivatives are , Hz/s, and Hz/s2, Hz s-3, Hz s-4, and Hz s-5 at barycentric epoch . NICER’s sensitivity enables our measurement up to fifth-order in frequency with TOAs of only 300 s.
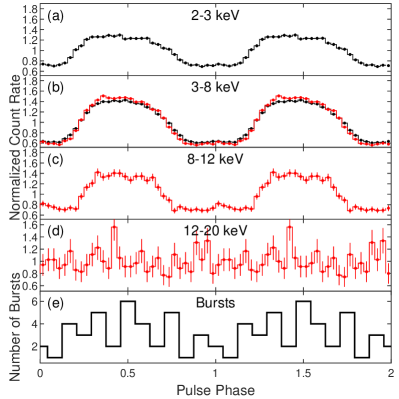
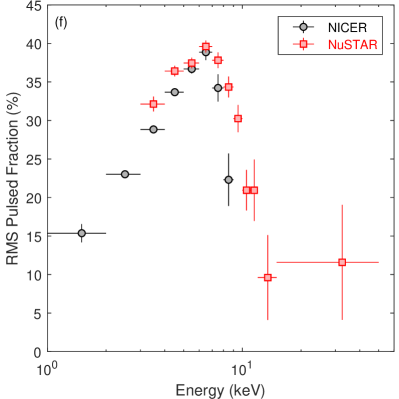
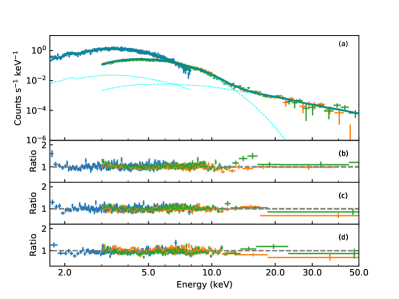
In Figure 2 a–d, we present the energy-resolved and background-subtracted pulse profiles of Swift J1555.25402 in the 2–3 keV and 3–8 keV bands with NICER and in the 3–8 keV, 8–12 keV, and 12–20 keV with NuSTAR, where estimates of the background rates were made with the nibackgen3C50 tool for the NICER data and were based on the measured rate in the background region for the NuSTAR data. The soft X-ray profile (2–12 keV) shows a single-peaked, nearly sinusoidal shape, while the pulsation in the hard X-ray band (12 keV) was hardly detected. We further divided the data into finer energy bands and calculated, in Figure 2f, the time-averaged root mean square (RMS) pulsed fraction (PF) as defined in Bildsten et al. (1997); Woods et al. (2004). Both the NICER and NuSTAR observations suggest that the RMS PF increases from in the softer band (3–4 keV) to the maximum of 40% at around 7 keV, and then decreases with energy to 20%. We also found that the PF in the 3–8 keV range remained almost constant during the observed period (Figure 1e).
3.2 X-ray spectral analyses
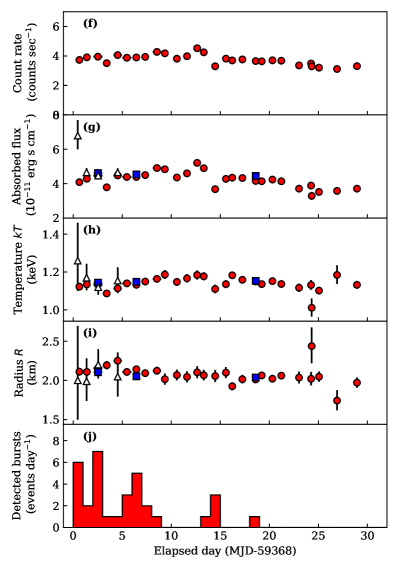
The right panels of Figure 1 show the long-term spectral properties of Swift J1555.25402 obtained with Swift, NICER, and NuSTAR data. Here we applied a single-temperature blackbody multiplied by the Tuebingen-Boulder interstellar absorption model (tbabs*bbodyrad in Xspec terminology) to derive the physical parameters at each epoch. The first data point in all right panels corresponds to the initial 1.7-ks Swift PC spectrum obtained 1.1 hours after the BAT trigger, which is well fitted with the model above (chi-square of 113 for 128 degrees of freedom; dof). We derived the best-fit hydrogen column density of cm-2 and blackbody temperature of keV. The absorbed 2–10 keV flux is erg cm-2 s-1. This flux is significantly higher than those in the following observations with the Swift/XRT in the WT mode and NICER monitoring.
The subsequent daily NICER spectra (1.7–10 keV) were systematically fitted with the same model with the hydrogen column density tied to be the same value among all NICER spectra at cm-2. Each observation has 4 counts sec-1 (Figure 1f). The reduced chi-square values were 0.9–1.2 for 100-400 dof. No spectral variation during the initial monitoring was found. The absorbed and unabsorbed 2–10 keV fluxes were erg cm-2 s-1 (Figure 1g) and erg cm-2 s-1, respectively. The derived temperature and emission radius were constant at 1.1 keV (Figure 1h) and km (Figure 1i), respectively (§4.2). These NICER parameters are consistent with those obtained with the WT mode data of Swift/XRT.
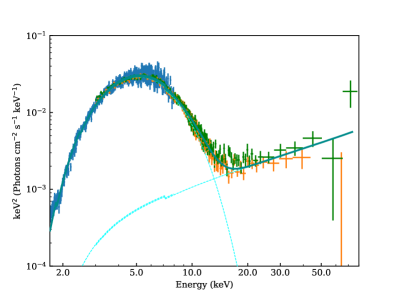
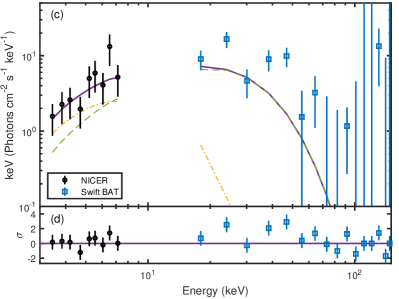
We performed joint spectral fits of three observations of NICER and NuSTAR on June 5–6, 9, and 21. Since the NICER spectra showed no significant time variation, we extracted the NICER spectra for the period on the same day as of NuSTAR and regarded them as simultaneous even if their observation periods were not fully simultaneous. The column density among the three epochs are tied to the same value. The best-fit spectral model is shown in Figure 3. In addition to the soft X-ray blackbody component, a hard X-ray component above 10 keV was detected with 3 significance extending up to at least 40 keV. The hard X-ray flux, when fitted by the power-law model, was erg cm-2 s-1 in the 10–60 keV band with a power-law photon index of –. We also performed a combined fit of all the three epochs, given that no significant spectral change was observed between them, except for the hard X-ray flux, which showed a slight decline. The resultant average is shown in the right panel of Figure 3 right and Table 1. The hard X-ray component is distinctive from the soft blackbody emission below 10 keV.
3.3 Short burst analyses
Swift BAT detected 5 short bursts, as summarized in Appendix Table B1. For the first detected burst on June 3 (an onboard trigger), we used the data from s to s, where is the burst detection time, whereas we used the -s interval events collected through sub-threshold triggers333These are also called failed triggers, which are detections that pass the rate trigger criteria but failed the image detection threshold. in our analyses of the other bursts. The BAT event data have time resolution of s (Barthelmy et al., 2005). The BAT temporal analysis utilizes light curves binned in 1, 2, and 4 ms. Our BAT spectral analysis was performed using spectra created with the duration of each burst, which is the duration that covers 90% of the burst emission. All the spectra were successfully fitted with a single blackbody model (bbodyrad model in Xspec) except for the one on June 7, the statistics of which were too poor to give meaningful constraints.
We also searched the 2–8 keV NICER event data for short bursts using the Bayesian block technique444https://docs.astropy.org/en/stable/api/astropy.stats.bayesian_blocks.html (Scargle et al., 2013). The blocks with high backgrounds and with durations longer than 1 s are further filtered out on the basis of comparison between the house-keeping data (mkf files), multiple blocks in one burst, and blocks close to the GTI boundaries. We used the Poisson probability to determine the significance of detecting a number of photons in a block, where the non-burst count rate was calculated from 1 s intervals close in time to the bursts. We identified 37 short bursts exceeding detection significance as summarized in Appendix Table B2. The average duration of the bursts was ms and 13 photons were detected in a burst on average. Note that burst 26-1 among the list occurred during the tail of burst 26 and we included it in burst 26 in the calculation.
We stacked the detected bursts to obtain an average spectrum and found it to be equally well fitted with both a single blackbody (tbabs * bbodyrad) and with a power-law (tbabs * pegpwrlw) with Cash statistics of and , respectively, with 309 dof. When fixing the absorption column density at cm-2 (Table 1), the former model gave a blackbody temperature of keV, whereas the latter gave a photon index of . Using the blackbody model, we find an average unabsorbed flux of ergs s-1 cm-2 in the 2–8 keV range. Assuming a distance of 10 kpc, the blackbody radius is estimated to be km. The fluences of detected bursts are calculated to be in the range of (1–13) ergs cm-2 with an assumed blackbody spectrum of keV using the WebPIMMs Appendix (Appendix Table B2). One of the NICER bursts was simultaneously detected with Swift BAT (Appendix Figure B2).
4 Discussion and Conclusion
4.1 Timing and spectral characteristics of the new magnetar
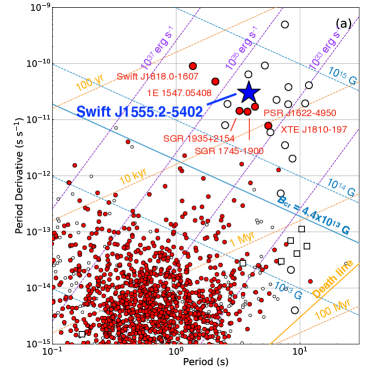
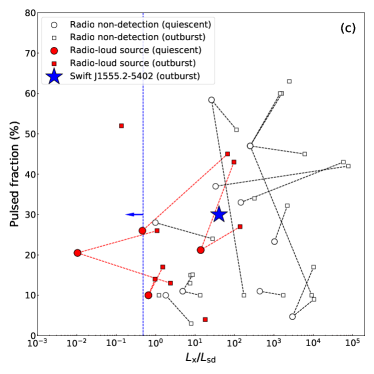
High-cadence monitoring with NICER over one month allows us to measure the spin ephemeris of the new source Swift J1555.25402 (Table 1). Refined from the initial reports in GCNs and ATels (Coti Zelati et al., 2021a; Ng et al., 2021), the period and its time derivative are measured to be 3.86104705(12) sec and s s-1, respectively. The combination of the two values falls within the distribution of known magnetars on the - diagram (Figure 4a). Assuming the standard rotating magnetic dipole model and a braking index of , these timing parameters correspond to a characteristic age of kyr, surface magnetic field strength of G, and spin-down luminosity of erg s-1. This source was classified as a magnetar based on the measured strong magnetic field. The derived characteristic age suggests that it is one of the youngest magnetars among the known ones. The suggestion is supported by the observed strong timing noise, which requires a model with high-order polynomials (§3.1), similar to that of the young magnetar Swift J1818.01607 (Hu et al., 2020). We caution that the derived pulsar parameters during the outburst may deviate from those in the quiescent state (e.g., Younes et al. 2017a; Archibald et al. 2020). Frequency derivatives are known to fluctuate during magnetar outbursts, with variations of a factor of 1–50 (see, e.g., Dib et al. 2012; Dib & Kaspi 2014; Levin et al. 2019). Thus, the accuracy of the inferred parameters , , and relative to the quiescent values still have uncertainties due to this variation.
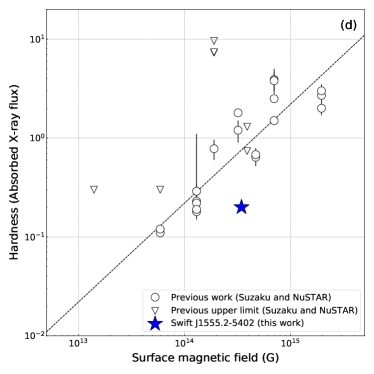
We detect a hard X-ray tail above 10 keV with NuSTAR, extending up to at least 40 keV with 3 significance. The spectral energy distribution shows that the hard X-ray component is distinguished from the blackbody component, which should originate from the stellar surface (Figure 3). The existence of the distinctive hard tail is further supported by the steep drop in the energy-dependent PF above 10 keV (Figure 2f). Two-component spectra of this kind are reported from other persistently-bright and transient magnetars (Kuiper et al., 2006; Enoto et al., 2010a; Younes et al., 2017b). The low PF (10%) of Swift J1555.25402 in the hard X-rays may suggest that the hard tail originates in magnetospheric emission that does not have much anisotropy and higher emission altitude than emission from the stellar surface. This may imply a low magnetic impact parameter (e.g., Wadiasingh et al., 2018) for the observer across the pulse for resonant Compton scattering. The 15–60 keV flux of Swift J1555.25402, erg s-1 cm-2, is lower than the absorbed 1–10 keV flux erg s-1 cm-2. Accordingly, the broadband hardness ratio of the magnetospheric to surface-thermal emissions is . The hardness ratio of known magnetars (–4) is suggested to be correlated with the surface magnetic field. Figure 4d plots values of known sources and Swift J1555.25402. It shows that of Swift J1555.25402 is not largely off, though apparently smaller than, the proposed correlation (see equation 3 of Enoto et al. 2017). We note that the measured has some systematic uncertainty. If the yet unknown long-term frequency derivative of Swift J1555.25402 is lower than the value measured during the current outburst, the magnetic field strength in the quiescent state is weaker than our estimate, which places of Swift J1555.25402 closer to the known correlation.
4.2 Search for a counterpart
We searched the Swift archival data for a serendipitous detection of Swift J1555.25402 in its quiescent state. Two observations in 2012 (OsbIDs 00042728001 and 00042729001) covered the location of this source as part of the Swift XRT Galactic plane survey program (Reynolds et al., 2013). The total exposure is 1055 seconds. We find no X-ray source at this position within a 30″ radius. The 3 upper limit of the count rate is estimated to be counts sec-1 within this radius. Then, the 3 upper limit of the 2–10 keV absorbed and absorption-corrected fluxes are calculated to be erg s cm-2 and erg s cm-2, respectively, on the assumption of an absorbed blackbody spectrum with cm-2 and keV, which correspond to an upper limit of the quiescent X-ray luminosity of erg s-1 at 10 kpc.
The characteristic age of Swift J1555.25402 is inferred to be 2.04 kyr (see Table 1). If we assume that its true age is comparable to its characteristic age, we expect to find a young supernova remnant (SNR) surrounding the neutron star. Detection of an associated SNR, combined with the proper-motion measurement, would be helpful and can be important for constraining the magnetar’s true age given that the characteristic age may be unreliable due to underlying assumptions about the neutron star rotation period at birth and braking index. Our search of archival radio, infrared, and X-ray data (e.g., Green 2019) for a SNR or pulsar-wind nebula coinciding at the position of Swift J1555.25402, (,)=(327.872,) in the galactic coordinates using SkyView555https://skyview.gsfc.nasa.gov fails to yield any convincing candidates.
The celestial position of Swift J1555.25402 is close to another magnetar 1E 1547.05408, with an angular separation of about 0.7 degrees. The distance to 1E 1547.05408 is estimated to be 4–4.5 kpc from a dust scattering halo (Tiengo et al., 2010) and a possible association with SNR G327.240.13 (Gelfand & Gaensler, 2007). By contrast, no definitive information is available about the distance to Swift J1555.25402. Taking into account the fact that the column density of Swift J1555.25402 ( cm-2) is larger than that of 1E 1547.05408 ( cm-2; Enoto et al. 2010b), we assume a fiducial distance of 10 kpc, which corresponds to the location on the Scutum–Centaurus Arm.
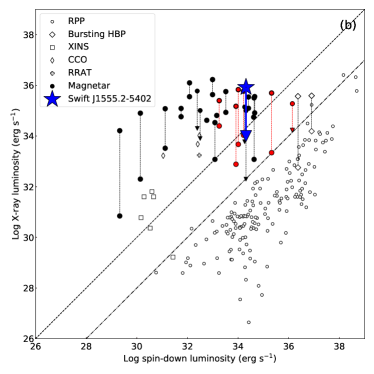
Figure 4b compares pulsar X-ray luminosity with spin-down luminosity . Immediately after the outburst, the surface emission (2–10 keV) and total (2–60 keV) luminosity of Swift J1555.25402 were erg s-1 and erg s-1, respectively. At the assumed distance of 10 kpc, these are respectively 40 and 46 times larger than its spin-down luminosity erg s-1. The observed X-ray luminosity is similar to those of past reported outbursts of transient magnetars. The upper limit on the quiescent X-ray luminosity of Swift J1555.25402 is , corresponding to , which is still up to 23 orders of magnitude higher than those of the rotation-powered pulsars (see Figure 4b and Figure 12 of Enoto et al. 2019). The upper limit on the quiescent luminosity also makes Swift J1555.25402 one of the coolest young magnetars (see, e.g., Potekhin et al. 2015) and is compatible with erg s-1 of PSR J11196127 (Gonzalez et al., 2005; Ng et al., 2012; Blumer et al., 2021).
4.3 Peculiarities of the slow decline outburst
The persistent X-ray flux of most transient magnetars remains in a bright plateau state for a few weeks immediately after the onset of outbursts and then starts to fade over the next several months (Coti Zelati et al., 2018). Typically, the plateau duration and decaying slope are 11–43 days and 0.7–2 (Enoto et al., 2017), respectively, when the X-ray flux is fitted with an empirical formula where , are the elapsed time and plateau flux, respectively. A peculiarity of Swift J1555.25402 is its long-lasting outburst. The absorbed X-ray flux stayed nearly stable at around erg s-1 cm-2 with only a slow decline over a month. There was no apparent rollover of the flux trend as of July 1. Such long-lasting outbursts are rare for magnetars with only a few exceptions ever recorded, e.g., the radio-loud magnetar 1E 1547.05408.
Another peculiarity of the Swift J1555.25402 outburst is the higher temperature (1.1 keV) of the blackbody component than the typical value of known magnetars, –0.7 keV (Enoto et al., 2017), despite the surface-emission radius km of Swift J1555.25402 being well within the typical range for a neutron star. During the one-month observation, the slow flux decline originated from the decreasing emission radius rather than the temperature decline. This fact suggests a situation where the hot spot on the neutron star surface responsible for the X-ray emission was shrinking, which is consistent with the twisted magnetosphere model (Kaspi & Beloborodov, 2017).
We detected 37 and 5 short bursts with NICER and Swift/BAT, respectively, during the initial two weeks since discovery of Swift J1555.25402 (Figure 1j). The burst-active periods of persistently bright magnetars (e.g., SGR 180620) are known to be longer (100 days) than those (10 days) of low-burst rate transient ones (e.g., SGR 05014516) (Göǧüş, 2014). The burst-active period of Swift J1555.25402 is close to the latter case. We conjecture that repeated bursts as observed in Swift J1555.25402 would provide impulsive heating of the surface to sustain the long-lasting decay. To investigate the potential relationship between the bursts and persistent emission on the pulse profile, we plot in Figure 2e the phase distribution of the observed bursts. An Anderson Darling (AD) test suggests that the burst phase distribution differs from a uniform distribution with an AD statistic of 0.63 and corresponding p-value of 0.61. Thus there is neither a statistical difference between the phase distribution of the bursts and uniform distribution nor a statistically significant correlation between the burst occurrence and the pulse profile so far.
4.4 Comparison with radio emitting magnetars
We did not detect any radio emission from this source. It has been long established theoretically that as far as ordinary pulsars are concerned, the occurrence of rotation-powered polar-cap radio emission requires a sufficiently large potential drop to generate electron-positron pairs near polar caps (Goldreich & Julian, 1969; Sturrock, 1971; Ruderman & Sutherland, 1975; Arons & Scharlemann, 1979); note that the conventional definition of implies that radio emission is equivalently related to (Ho, 2013). The observed radio luminosity of rotation-powered pulsars indeed follows the relation (e.g., Arzoumanian et al. 2002). In the absence of magnetically-induced non-potential fields, magnetars which satisfy this condition at their polar caps before crossing the death line should be in principle capable of producing coherent radio emission. However, as shown in Figure 4a-c and summarized in Appendix Table D1, pulsed radio emission has been only reported from 6 radio-loud magnetars and a high-B pulsar that exhibited a magnetar-like outburst. It is an open question under what conditions a magnetar becomes radio-loud. The new magnetar Swift J1555.25402 is located in the - parameter space close to radio-loud magnetars (Figure 4a). The DSN upper limits on the radio flux (0.043 mJy for S-band and 0.026 mJy for X-band) would be much lower than the flux densities of the known radio-loud magnetars if located at the same distance of Swift J1555.25402 (10 kpc assumed), mJy and mJy at S-band and X-band, respectively (Camilo et al., 2007a, b, 2008; Levin et al., 2010, 2012; Shannon & Johnston, 2013; Pennucci et al., 2015; Huang et al., 2021). Therefore, the lack of radio emission suggests the existence of some other physical factors than simply and that govern radio emission.
One crucial factor is the geometry among the pulsar rotation axis, magnetic axis, line of sight to the observer and the width of any putative radio beam. For example, an anisotropic radio beam aligned to the magnetic axis must cross the line of sight to be detected, and longer period rotation-powered pulsars tend to have narrower beams (e.g., Lyne & Manchester 1988; Rankin 1993). The radio non-detection of Swift J1555.25402 might suggest that this magnetar may not have a favorable geometry for detection (e.g., Lazarus et al. 2012). Some radio-loud magnetars have observational signatures that suggest aligned rotators (i.e., the angle between the magnetic axis and rotation axis is ; Camilo et al. 2008; Levin et al. 2012; Lower et al. 2020). As shown in Figure 4c, the PF both in quiescence and during X-ray outbursts of radio-loud magnetars is lower than that of the other magnetars. A low PF could be due to radio-loud magnetars being observed as near-aligned rotators. The same interpretation can be inferred from the systematic Fourier-decomposition study of X-ray profiles of magnetars in quiescence conducted by Hu et al. (2019); radio-loud magnetars have a more sinusoidal pulse profile with a pronounced first Fourier component accompanied with a weaker second component. Another factor for the radio emission is the effects of higher-order (and possibly not curl-free) magnetic field components other than the dipolar field inferred from -, which has been already taken into account. Quantum electrodynamic effects affect the conditions for pair cascades and radio emission when a magnetic field is sufficiently strong, above G. For example, if photon splitting occurs in a region above the critical magnetic field, the way the electron/positron cascade occurs is modified, it is perhaps quenched, and radio pulsation may be suppressed (e.g., Baring & Harding, 2001). Finally, magnetar magnetospheres are considered to be dynamic and radio flux, pulse profile, and polarization swing pattern can change significantly within a few days (e.g., Lower et al. 2021). Future monitoring of this new magnetar Swift J1555.25402 will be important for understanding the conditions for the magnetar radio emission.
| Parameter | Values | |||
|---|---|---|---|---|
| Timing properties (NICER monitoring) | ||||
| MJD range | 59368.58–59396.98 | |||
| Epoch (MJD) | 59382.7549 | |||
| Spin frequency (Hz) | 0.258997103(8) | |||
| Frequency derivative ( Hz s-1) | -2.04(5) | |||
| Second frequency derivative ( Hz s-2) | -4.50(13) | |||
| Third frequency derivative ( Hz s-3) | -1.10(10) | |||
| Fourth frequency derivative ( Hz s-4) | 3.59(15) | |||
| Fifth frequency derivative ( Hz s-5) | 1.59(14) | |||
| RMS residual (phase) | 0.014 | |||
| /d.o.f. | 117.863/126 | |||
| Period (sec) | 3.86104705(12) | |||
| Period derivative ( s s-1) | 3.05(7) | |||
| Second period derivative ( s s-2) | 6.7(2) | |||
| Third period derivative ( s s-3) | 1.63(15) | |||
| Fourth period derivative ( s s-4) | -5.3(2) | |||
| Fifth period derivative ( s s-5) | -2.4(2) | |||
| Characteristic age (kyr) | 2.01(5) | |||
| Surface magnetic field ( G) | 3.47(4) | |||
| Spin-down luminosity ( erg s-1) | 2.09(5) | |||
| Spectral properties (NICER+NuSTAR joint fit) | ||||
| Joint observation numbers | 1 | 2 | 3 | Average |
| Observation date (MJD) | 59370 | 59374 | 59386 | – |
| Column density ( cm-2) | 8.72(8) | 8.59(7) | ||
| Temperature (keV) | 1.144(4) | 1.148(4) | 1.153(4) | 1.153(3) |
| Radius (km) | 2.10(2) | 2.05(2) | 2.04(2) | 2.06(3) |
| Photon index | 1.27(12) | 1.68(17) | 1.15(0.16) | 1.20(9) |
| Absorbed 2–10 keV flux ( erg s cm-2) | 46.16 | 45.41 | 44.48 | 46.31 |
| Unabsorbed 2–10 keV flux ( erg s-1 cm-2) | 70.60(32) | 69.39(35) | 67.80(36) | 70.0(3) |
| 10–60 keV flux ( erg s cm-2) | 9.32 | 7.73 | 8.72 | 9.04 |
| 2–10 keV luminosity ( erg s-1) | 8.47 | 8.33 | 8.14 | 8.40 |
| 10–60 keV luminosity ( erg s-1) | 1.11 | 0.93 | 1.05 | 1.09 |
| Quiescent (Swift) | ||||
| Absorbed 2–10 keV flux ( erg s cm-2) | (3) | |||
| Unabsorbed 2–10 keV flux ( erg s cm-2) | (3) | |||
| 2–10 keV luminosity ( erg s-1) | (3) | |||
Note. —
The column density of the three joint NICER and NuSTAR spectral fitting is fixed to the same value. X-ray luminosity and radius are calculated on an assumption of a fiducial distance of 10 kpc. Quoted errors indicate the 68% confidence limit.
Appendix A List of observations
Tables A1, A2, A3, and A4 summarize the observations of Swift, NICER, NuSTAR, and DSN, respectively, conducted for this campaign as of July 1.
| # | ObsID | Mode | Start Time | End Time | MJD | Elapsed | Exposure | Rate |
|---|---|---|---|---|---|---|---|---|
| (UTC) | (UTC) | day | (sec) | (cps) | ||||
| 1 | 01053220000 | PC | 2021-06-03T09:46:24 | 2021-06-03T11:21:33 | 59368.463 | 0.06 | 1706 | |
| 2 | 00014352001 | WT | 2021-06-04T7:50:02 | 2021-06-04T9:37:00 | 59369.364 | 1.0 | 1965 | |
| 3 | 00014352002 | WT | 2021-06-05T10:40:43 | 2021-06-05T15:46:23 | 59370.551 | 2.1 | 4895 | |
| 4 | 00014352003 | WT | 2021-06-07T12:06:00 | 2021-06-07T13:49:00 | 59372.540 | 4.1 | 1940 |
Note. —
MJD: Middle of the start and end time of an observation.
Elapsed day: Elapsed days from the first short burst at MJD 59368.40678 detected with Swift/BAT.
Rate: Background subtracted 2–10 keV count rate of Swift.
| # | ObsID | Start Time | End Time | MJD | Elapsed | Exposure | Rate |
|---|---|---|---|---|---|---|---|
| (UTC) | (UTC) | day | (sec) | (cps) | |||
| 1 | 4202190101 | 2021-06-03T11:21:31 | 2021-06-03T18:52:20 | 59368.630 | 0.2 | 2367 | 3.74 |
| 2 | 4560010101 | 2021-06-04T04:00:20 | 2021-06-04T14:54:24 | 59369.394 | 1.0 | 2201 | 3.91 |
| 3 | 4560010102 | 2021-06-05T01:25:40 | 2021-06-05T23:32:00 | 59370.520 | 2.1 | 7235 | 3.96 |
| 4 | 4560010103 | 2021-06-06T02:31:20 | 2021-06-06T17:31:40 | 59371.418 | 3.0 | 2068 | 3.52 |
| 5 | 4560010104 | 2021-06-07T02:42:51 | 2021-06-07T23:00:40 | 59372.536 | 4.1 | 2199 | 4.07 |
| 6 | 4560010105 | 2021-06-08T00:24:27 | 2021-06-08T22:16:20 | 59373.472 | 5.1 | 2931 | 3.88 |
| 7 | 4560010201 | 2021-06-09T04:16:47 | 2021-06-09T16:53:20 | 59374.441 | 6.0 | 6070 | 3.9 |
| 8 | 4560010202 | 2021-06-10T01:56:20 | 2021-06-10T14:36:20 | 59375.345 | 6.9 | 2582 | 3.94 |
| 9 | 4560010301 | 2021-06-11T02:43:40 | 2021-06-11T23:10:00 | 59376.539 | 8.1 | 1852 | 4.28 |
| 10 | 4560010601 | 2021-06-12T08:11:19 | 2021-06-12T08:27:40 | 59377.347 | 8.9 | 910 | 4.18 |
| 11 | 4560010401 | 2021-06-13T05:52:25 | 2021-06-13T21:38:20 | 59378.573 | 10.2 | 988 | 3.82 |
| 12 | 4560010402 | 2021-06-14T08:12:26 | 2021-06-14T20:52:40 | 59379.606 | 11.2 | 915 | 3.99 |
| 13 | 4560010501 | 2021-06-15T15:11:28 | 2021-06-15T15:28:00 | 59380.639 | 12.2 | 909 | 4.53 |
| 14 | 4560010502 | 2021-06-16T06:41:09 | 2021-06-16T08:24:28 | 59381.314 | 12.9 | 1085 | 4.25 |
| 15 | 4560010602 | 2021-06-17T02:49:31 | 2021-06-17T20:08:40 | 59382.479 | 14.1 | 911 | 3.3 |
| 16 | 4560010603 | 2021-06-18T08:15:34 | 2021-06-18T19:22:40 | 59383.576 | 15.2 | 998 | 3.82 |
| 17 | 4560010701 | 2021-06-19T04:24:22 | 2021-06-19T06:09:08 | 59384.220 | 15.8 | 1575 | 3.7 |
| 18 | 4560010702 | 2021-06-20T05:10:51 | 2021-06-20T06:54:08 | 59385.252 | 16.8 | 1472 | 3.77 |
| 19 | 4560010801 | 2021-06-21T05:58:08 | 2021-06-21T23:17:20 | 59386.610 | 18.2 | 3756 | 3.66 |
| 20 | 4560010802 | 2021-06-22T00:33:27 | 2021-06-22T10:08:00 | 59387.223 | 18.8 | 4545 | 3.64 |
| 21 | 4560010901 | 2021-06-23T05:59:25 | 2021-06-23T09:17:56 | 59388.319 | 19.9 | 1979 | 3.71 |
| 22 | 4560010902 | 2021-06-24T03:41:05 | 2021-06-24T07:01:43 | 59389.223 | 20.8 | 2307 | 3.68 |
| 23 | 4560011001 | 2021-06-26T00:34:00 | 2021-06-26T00:53:20 | 59391.030 | 22.6 | 902 | 3.36 |
| 24 | 4560011002 | 2021-06-27T06:05:15 | 2021-06-27T06:19:40 | 59392.259 | 23.9 | 663 | 3.49 |
| 25 | 4560011101 | 2021-06-27T07:38:15 | 2021-06-27T07:44:28 | 59392.320 | 23.9 | 176 | 3.3 |
| 26 | 4560011102 | 2021-06-28T00:41:00 | 2021-06-28T02:28:20 | 59393.066 | 24.7 | 1271 | 3.21 |
| 27 | 4560011201 | 2021-06-29T20:04:42 | 2021-06-29T23:20:24 | 59394.905 | 26.5 | 367 | 3.12 |
| 28 | 4560011301 | 2021-07-01T21:35:48 | 2021-07-01T23:25:19 | 59396.938 | 28.5 | 1237 | 3.31 |
Note. —
MJD: Middle of the start and end time of an observation.
Elapsed day: Elapsed days from the first short burst at MJD 59368.40678 detected with Swift/BAT.
Rate: Background subtracted 2–10 keV count rate of NICER.
| # | ObsID | Start Time | End Time | MJD start | Exposure | Rate A | Rate B |
|---|---|---|---|---|---|---|---|
| (UTC) | (UTC) | (ks) | (cps) | (cps) | |||
| 1 | 90701319002 | 2021-06-05T10:20:48 | 2021-06-06T06:33:07 | 59370.43111111 | 38.4 | 1.12 | 1.03 |
| 2 | 80702313002 | 2021-06-09T05:39:00 | 2021-06-09T18:00:00 | 59374.23541667 | 25.0 | 1.09 | 1.025 |
| 3 | 80702313004 | 2021-06-21T14:05:11 | 2021-06-22T04:15:00 | 59386.58693287 | 28.9 | 0.99 | 0.94 |
Note. — Rate A and B are the 3–79 keV count rate of NuSTAR FPMA and FPMB, respectively.
| # | Instrument | Observation | Observation | Duration | Observing | Mean Flux Densityb | Radio Burst Fluencec |
|---|---|---|---|---|---|---|---|
| Start Time | Start Time | Frequency Banda | ( / ) | ( / ) | |||
| (UTC) | (MJD) | (Hours) | (mJy / mJy) | (Jy ms / Jy ms) | |||
| 1 | DSN (DSS-36) | 2021 June 04 06:59:02 | 59369.29099 | 1.3 | S-band / X-band | 0.27 / 0.10 | 1.7 / 0.7 |
| 2 | DSN (DSS-36) | 2021 June 05 11:46:10 | 59370.49039 | 2.4 | S-band / X-band | 0.18 / 0.07 | 1.6 / 0.61 |
| 3 | DSN (DSS-43) | 2021 June 06 04:49:06 | 59371.20076 | 2.2 | S-band / X-band | 0.042 / 0.025 | 0.35 / 0.21 |
| 4 | DSN (DSS-34) | 2021 June 10 11:31:12 | 59375.48000 | 2.4 | S-band / X-band | 0.20 / 0.11 | 1.7 / 0.9 |
| 5 | DSN (DSS-43) | 2021 June 12 04:08:52 | 59377.17282 | 2.5 | S-band / X-band | 0.043 / 0.026 | 0.39 / 0.24 |
Note. —
The first two observations (2021 June 4 and 5) and the fourth observation (2021 June 10) were carried out using DSS-36 and DSS-34, two 34 m diameter radio telescopes in Canberra, Australia, whereas the remaining observations (2021 June 6, 12, and 16) were carried out using DSS-43, the 70 m diameter dish in Canberra. a The center frequencies at S/X-band are 2.2/8.4 GHz, respectively.
b 7 upper limits on the mean flux density in each radio frequency band, assuming a 10% duty cycle. The uncertainties on the mean flux density upper limits are estimated at 15%, primarily due to the uncertainty in the system temperature.
c 7 upper limits on the radio burst fluence in each radio frequency band, assuming a burst width of 1 ms. The uncertainties on the fluence detection thresholds are estimated at 15%, primarily due to the uncertainty in the system temperature.
Appendix B Burst analyses
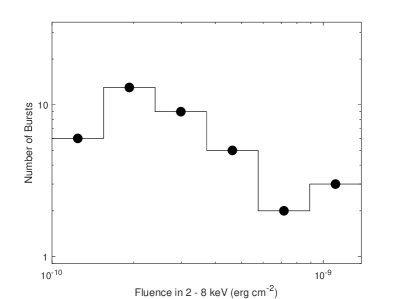
Tables B1 and B2 summarize the detected magnetar short bursts by Swift/BAT and NICER, respectively. The corresponding fluence distribution is shown in Figure B1.
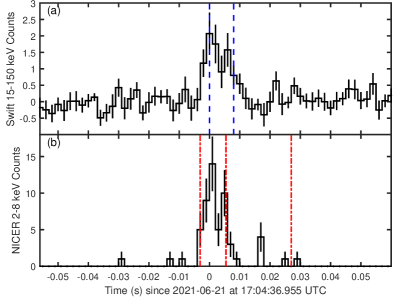
A burst (the burst number 5 in Table B1 and 26 in Table B2) is simultaneously detected with Swift BAT and NICER. The light curves of this simultaneous event are shown in Figure B2 (a) and (b). We extracted the broadband X-ray spectrum and fit it with an absorbed power law and set cm-2 (See Figure B2c and d). The spectrum can be fitted by two blackbodies although the normalization cannot be well constrained. The soft one has the temperature of keV, which is set to be 0.37 times the temperature of the hard component (Nakagawa et al., 2009). On the other hand, the spectrum can also be well fitted by an absorbed blackbody with keV and a radius of k at 10 kpc.
The fluence distribution is power-law like, but the index cannot be well constrained due to limited sample (Figure B1). We applies the Anderson Darling (AD) test to assess the observed fluence distribution against a power-law distribution with a index of . This yields an AD statistic of 2.3 with a corresponding p-value of 0.04. In comparison, we perform the same test against a uniform distribution and obtain an AD statistic of 78 with a p-value of . This suggest that the fluence is not uniformly distributed.
| # | Trigger ID | Time | Duration | SNR | fluence | ||
|---|---|---|---|---|---|---|---|
| (UTC) | (ms) | (keV) | |||||
| 1 | 1053220 | 2021-06-03T09:45:46.589 | 9.9 | ||||
| 2 | 1053653 | 2021-06-05T23:52:04.582 | 7.3 | 28.54 | |||
| 3 | 1053961 | 2021-06-07T12:33:40.020 | 5.0 | N/A⋆ | N/A⋆ | N/A⋆ | |
| 4 | 1056025 | 2021-06-16T14:44:30.489 | 6.9 | 31.20 | |||
| 5 | 1057131 | 2021-06-21T17:04:36.839 | 6.9 | 55.54 |
Note. —
Reported errors are 90% confidence for each parameter.
Time: Burst detection time (UTC) determined as the start time of .
SNR: Signal-to-noise ratio (SNR) of the BAT image in the 15–350 keV.
kT: Blackbody temperature (keV) when fitted by the single blackbody model.
fluence: Burst fluence in the 15–150 keV band ( erg cm-2).
: fitting chi-square values for 57 degree of freedom.
⋆Burst #3 is too weak to constrain spectral-fit parameters.
| # | ObsID | Time | Duration | Significance | Phase | Fluence |
|---|---|---|---|---|---|---|
| (UTC) | (ms) | |||||
| 1 | 4202190101 | 2021-06-03T13:51:09.341 | 14.94 | 8.80 | 0.085 | |
| 2 | 4202190101 | 2021-06-03T13:51:27.181 | 59.18 | 6.38 | 0.711 | |
| 3 | 4202190101 | 2021-06-03T13:54:40.275 | 19.79 | 15.47 | 0.717 | |
| 4 | 4202190101 | 2021-06-03T18:49:06.251 | 35.90 | 6.35 | 0.166 | |
| 5 | 4560010101 | 2021-06-04T14:37:30.785 | 18.43 | 6.91 | 0.874 | |
| 6 | 4560010101 | 2021-06-04T14:43:50.878 | 15.12 | 11.32 | 0.316 | |
| 7 | 4560010102 | 2021-06-05T05:57:03.457 | 49.87 | 6.19 | 0.449 | |
| 8⋆ | 4560010102 | 2021-06-05T13:55:42.156 | 15.91 | 5.67 | 0.504 | |
| 9 | 4560010102 | 2021-06-05T23:31:46.102 | 34.26 | 6.50 | 0.454 | |
| 10 | 4560010105 | 2021-06-08T11:19:42.895 | 9.55 | 7.63 | 0.285 | |
| 11 | 4560010105 | 2021-06-08T11:23:17.712 | 3.20 | 5.95 | 0.922 | |
| 12 | 4560010201 | 2021-06-09T05:51:19.191 | 19.64 | 10.85 | 0.299 | |
| 13 | 4560010201 | 2021-06-09T07:24:11.030 | 7.34 | 6.13 | 0.375 | |
| 14 | 4560010201 | 2021-06-09T10:34:21.954 | 7.21 | 6.50 | 0.747 | |
| 15 | 4560010201 | 2021-06-09T13:41:17.195 | 25.52 | 8.77 | 0.438 | |
| 16 | 4560010201 | 2021-06-09T13:42:48.797 | 19.87 | 6.18 | 0.162 | |
| 17 | 4560010202 | 2021-06-10T02:00:03.424 | 14.08 | 6.89 | 0.687 | |
| 18 | 4560010202 | 2021-06-10T05:05:18.924 | 21.26 | 6.24 | 0.540 | |
| 19 | 4560010301 | 2021-06-11T10:39:52.520 | 6.94 | 6.11 | 0.570 | |
| 20 | 4560010602 | 2021-06-17T02:51:59.547 | 6.71 | 16.58 | 0.542 | |
| 21 | 4560010602 | 2021-06-17T02:53:19.142 | 54.05 | 19.37 | 0.162 | |
| 22 | 4560010602 | 2021-06-17T02:59:19.487 | 72.30 | 7.00 | 0.493 | |
| 23 | 4560010701 | 2021-06-19T04:33:05.105 | 7.04 | 7.19 | 0.028 | |
| 24 | 4560010701 | 2021-06-19T04:40:15.346 | 7.71 | 7.19 | 0.457 | |
| 25 | 4560010701 | 2021-06-19T06:07:18.896 | 23.03 | 9.82 | 0.305 | |
| 26⋆⋆ | 4560010801 | 2021-06-21T17:04:36.952 | 8.54 | 20.58 | 0.664 | |
| 26-1† | 4560010801 | 2021-06-21T17:04:36.960 | 21.55 | 6.25 | 0.668 | |
| 27 | 4560010801 | 2021-06-21T23:05:26.979 | 17.84 | 6.39 | 0.767 | |
| 28 | 4560010801 | 2021-06-21T23:06:53.759 | 35.45 | 8.78 | 0.244 | |
| 29 | 4560010802 | 2021-06-22T00:35:18.974 | 12.50 | 8.94 | 0.228 | |
| 30 | 4560010802 | 2021-06-22T00:45:29.330 | 15.47 | 8.55 | 0.307 | |
| 31 | 4560010802 | 2021-06-22T02:20:44.171 | 32.71 | 8.16 | 0.385 | |
| 32 | 4560010802 | 2021-06-22T03:55:16.474 | 30.36 | 10.37 | 0.445 | |
| 33 | 4560010802 | 2021-06-22T08:26:59.567 | 6.15 | 12.71 | 0.746 | |
| 34 | 4560010802 | 2021-06-22T08:29:34.911 | 49.79 | 19.15 | 0.984 | |
| 35 | 4560010802 | 2021-06-22T10:00:07.220 | 15.05 | 8.79 | 0.882 | |
| 36 | 4560010902 | 2021-06-24T06:50:27.424 | 5.97 | 5.68 | 0.654 | |
| 37 | 4560011001 | 2021-06-26T00:52:34.199 | 12.48 | 9.24 | 0.167 | |
| 38 | 4560011301 | 2021-07-01 23:21:28.122 | 5.28 | 12.89 | 0.860 |
Note. —
Time: Burst detection time (UTC) determined as the start time of the Bayesian block.
Duration: duration between two consecutive Bayesian blocks.
Significance: Detection significance of the burst from Poisson-distributed noise.
Fluence: Burst fluence in the 2–8 keV band ( erg cm-2) estimated from the number of photons and assuming a blackbody spectrum with keV. The uncertainty is simply calculated from the Poisson noise, i.e., the square root of the number of photons.
⋆ This burst was simultaneously observed with the second observation of DSN (Table A4).
⋆⋆ This burst is simultaneously observed with Swift BAT (burst #5 in Table B1).
† This candidate is the tail of burst #26.
Appendix C Glitch model
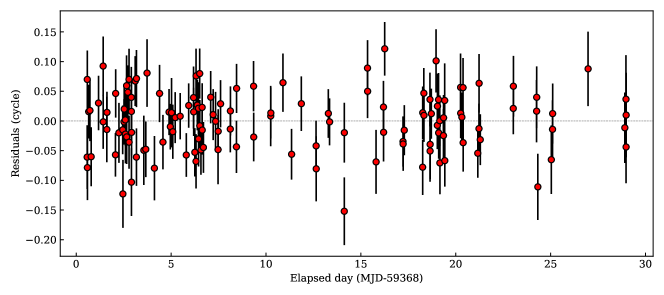
We find that the timing behavior of Swift J1555.25402 is also well-described by a glitch model with three glitch candidates at MJDs 59373.6412, 59382.9236, and 59390.1618. The best-fit timing parameters are Hz and Hz s-1 at barycentric epoch ; the timing parameters and the glitch parameters are summarized in Table C1. The pulse phase residuals are characterized by an rms residual of cycles, and they are plotted in Figure C1. While the data can be plausibly described with a glitch model, it is more likely that the source is exhibiting strong timing noise (see Section 4), similar to that of Swift J1818.0-1607 (Hu et al., 2020).
The glitch sizes exhibited by Swift J1555.25402 are well within the range of observed values in magnetars, whereas the values are among the highest values relative to observed values in magnetars (Hu & Ng, 2019). However, we are observing Swift J1555.25402 in outburst, and the high values associated with the three glitch candidates are similar to that observed in some magnetars in outbursts as well (Hu & Ng, 2019). We also note the short recurrence timescale of the glitches (on the order of days).
The timing features of Swift J1555.25402 show some similarities to that of Swift J1818.01607 - the two “timing anomalies”, were characterized as candidate glitches separated by 6 days, a traditional spin-up glitch of size Hz and an anti-glitch with Hz. We also observe a similar and unusual “sign-switching” behavior of the glitches for Swift J1555.25402, with an anti-glitch, a glitch, and another anti-glitch.
| Parameter | Values | ||
|---|---|---|---|
| MJD range | 59368.53–59396.98 | ||
| Epoch (MJD) | 59382.7549 | ||
| Spin frequency (Hz) | 0.25899725(18) | ||
| Frequency derivative (Hz s-1) | |||
| RMS residual (phase) | 0.012 | ||
| /d.o.f. | 133.196/121 | ||
| Glitch Candidate | 1 | 2 | 3 |
| Glitch Epoch (MJD) | 59373.6412 | 59382.9236 | 59390.1618 |
| (Hz) | |||
| (Hz s-1) | |||
| 1.33(16) | |||
Appendix D Comparison with previous magnetar outbursts
| Source | State | Distance | PF | Energy | References | ||
|---|---|---|---|---|---|---|---|
| (erg s-1) | (erg s-1) | (kpc) | (keV) | ||||
| 1E 1547.05408 | Quiescent | 4.5 | 0.205 | 0.5-2 | 1,2 | ||
| Outburst (2008) | 0.26 | 0.5-10 | 1,3 | ||||
| Outburst (2009) | 0.13 | 0.5-3 | 1,4 | ||||
| XTE J1810197 | Quiescent | 3.5 | 0.212 | 0.5-2 | 1,2 | ||
| Outburst (2003) | 0.43 | 1-1.5 | 1,5 | ||||
| Outburst (2018) | 0.27 | 0.5-2 | 6,7 | ||||
| PSR J16224950 | Quiescent | 9 | 8 | ||||
| Outburst (2017) | 0.04 | 0.3-6 | 8 | ||||
| SGR 17451900 | Quiescent | 8.3 | 0.26 | 0.5-7 | 9,2 | ||
| Outburst (2013) | 0.45 | 0.3-3.5 | 1,10 | ||||
| Swift J1818.01607 | Quiescent | 6.5 | 11 | ||||
| Outburst (2020) | 0.52 | 1-3 | 11,12 | ||||
| SGR 19352154 | Quiescent | 9 | 0.1 | 0.5-2 | 13,2 | ||
| Outburst (2014) | 0.17 | 0.5-1.5 | 1,14 | ||||
| Outburst (2020) | 0.14 | 0.7-3 | 13,15 | ||||
| PSR J11196127 | Quiescent | 8.4 | 0.74 | 0.5-2 | 1,16 | ||
| Outburst (2016) | 0.67 | 0.7-3 | 1,17 |
Note. —
: Observed X-ray Luminosity (0.3-10 keV) assuming the distance in the right column.
: Spin-down luminosity.
PF: X-ray pulsed fraction defined in the energy band in the right column.
References: 1. Coti Zelati et al. (2018); 2. Hu et al. (2019); 3. Israel et al. (2010); 4. Bernardini et al. (2011) 5. Gotthelf et al. (2004); 6. Pearlman et al. (2020); 7. Borghese et al. (2021); 8. Camilo et al. (2018); 9. Rea et al. (2020); 10. Coti Zelati et al. (2015); 11. Hu et al. (2020); 12. Esposito et al. (2020); 13. Borghese et al. (2020); 14. Israel et al. (2016); 15. Göğüş et al. (2020); 16. Gonzalez et al. (2005); 17. Archibald et al. (2018)
| Source | State | Distance | PF | Energy | References | ||
|---|---|---|---|---|---|---|---|
| (erg s-1) | (erg s-1) | (kpc) | (keV) | ||||
| Swift J1555.25402 | Outburst (2021) | XX | 10 | 0.15 | 1-2 | this work | |
| SGR 04185729 | Quiescent | 2 | 0.37 | 0.5-2 | 1,2 | ||
| Outburst (2009) | 0.42 | 1.5-2.5 | 1,3 | ||||
| SGR 05014516 | Quiescent | 1.5 | 0.28 | 0.5-2 | 1,2 | ||
| Outburst (2008) | 0.24 | 0.3-2 | 1,4 | ||||
| 1E 1048.15937 | Quiescent | 9 | 0.584 | 0.5-2 | 1,2 | ||
| Outburst (2011) | 0.10 | 1-10 | 1,5 | ||||
| Outburst (2016) | 0.51 | 3-7 | 1,6 | ||||
| CXOU J164710.2455216 | Quiescent | 4 | 0.47 | 0.5-2 | 1,2 | ||
| Outburst (2006) | 0.10 | 0.5-4 | 1,7 | ||||
| Outburst (2011) | 0.60 | 0.5-4 | 1,7 | ||||
| Outburst (2017) | 0.60 | 0.3-2.5 | 8 | ||||
| Outburst (2018) | 0.45 | 0.3-2.5 | 8 | ||||
| SGR 180620 | Quiescent | 8.7 | 0.1 | 0.5-4 | 1,2 | ||
| Outburst (2004) | 0.03 | 2-10 | 1,9 | ||||
| Swift J1822.31606 | Quiescent | 1.6 | 0.33 | 0.5-2 | 1,2 | ||
| Outburst (2011) | 0.43 | 2-8 | 1,10 | ||||
| 1E 2259586 | Quiescent | 3.2 | 0.233 | 0.5-2 | 1,2 | ||
| Outburst (2002) | 0.322 | 0.1-2 | 1,11 | ||||
| SGR 162741 | Quiescent | 11 | 1 | ||||
| Outburst (1998) | 0.10 | 0.1-10 | 1,12 | ||||
| Outburst (2008) | 0.13 | 2-10 | 1,13 | ||||
| SGR 18330832 | Quiescent | 10 | 1 | ||||
| Outburst (2010) | 0.34 | 0.2-4 | 1,14 | ||||
| Swift J1834.90846 | Quiescent | 4.2 | 1 | ||||
| Outburst (2011) | 0.85 | 2-10 | 1,15 | ||||
| SGR 18300645 | Quiescent | 10 | 16 | ||||
| Outburst (2020) | 0.63 | 0.3-2 | 16 | ||||
| SGR 190014 | Quiescent | 12.5 | 0.11 | 0.5-2 | 1,2 | ||
| Outburst (2001) | 0.10 | 0.8-6.5 | 1,17 | ||||
| Outburst (2006) | 0.151 | 0.8-4 | 1,18 | ||||
| 1E 1841045 | Quiescent | 8.5 | 0.11 | 0.5-2 | 1,2 | ||
| Outburst (2011) | 0.10 | 0.5-2 | 1,19 | ||||
| 4U 014261 | Quiescent | 3.6 | 0.047 | 0.5-2 | 1,2 | ||
| Outburst (2011) | 0.17 | 0.7-10 | 1,20 | ||||
| Outburst (2015) | 0.09 | 0.7-10 | 1,20 |
Note. —
Definitions of the columns are the same as Table D1.
References: 1.Coti Zelati et al. (2018); 2.Hu et al. (2019); 3.Esposito et al. (2010); 4.Göǧüş et al. (2010a); 5.Archibald et al. (2015); 6.Archibald et al. (2020); 7.Rodríguez Castillo et al. (2014); 8.Borghese et al. (2019); 9.Woods et al. (2007); 10.Livingstone et al. (2011); 11.Zhu et al. (2008); 12.Woods et al. (1999); 13.Esposito et al. (2009); 14.Göǧüş et al. (2010b); 15.Kargaltsev et al. (2012); 16.Coti Zelati et al. (2021b); 17.Göǧüş et al. (2011); 18.Mereghetti et al. (2006); 19.An et al. (2013); 20.Archibald et al. (2017)
References
- Agarwal et al. (2020) Agarwal, D., Aggarwal, K., Burke-Spolaor, S., Lorimer, D. R., & Garver-Daniels, N. 2020, MNRAS, 497, 1661, doi: 10.1093/mnras/staa1856
- An et al. (2013) An, H., Hascoët, R., Kaspi, V. M., et al. 2013, ApJ, 779, 163, doi: 10.1088/0004-637X/779/2/163
- Archibald et al. (2015) Archibald, R. F., Kaspi, V. M., Ng, C. Y., et al. 2015, ApJ, 800, 33, doi: 10.1088/0004-637X/800/1/33
- Archibald et al. (2017) Archibald, R. F., Kaspi, V. M., Scholz, P., et al. 2017, ApJ, 834, 163, doi: 10.3847/1538-4357/834/2/163
- Archibald et al. (2018) Archibald, R. F., Kaspi, V. M., Tendulkar, S. P., & Scholz, P. 2018, ApJ, 869, 180, doi: 10.3847/1538-4357/aaee73
- Archibald et al. (2020) Archibald, R. F., Scholz, P., Kaspi, V. M., Tendulkar, S. P., & Beardmore, A. P. 2020, ApJ, 889, 160, doi: 10.3847/1538-4357/ab660c
- Arons & Scharlemann (1979) Arons, J., & Scharlemann, E. T. 1979, ApJ, 231, 854, doi: 10.1086/157250
- Arzoumanian et al. (2002) Arzoumanian, Z., Chernoff, D. F., & Cordes, J. M. 2002, ApJ, 568, 289, doi: 10.1086/338805
- Bansal et al. (2021) Bansal, K., Pearlman, A. B., Majid, W. A., et al. 2021, The Astronomer’s Telegram, 14678, 1
- Baring & Harding (2001) Baring, M. G., & Harding, A. K. 2001, ApJ, 547, 929, doi: 10.1086/318390
- Barthelmy et al. (2005) Barthelmy, S. D., Barbier, L. M., Cummings, J. R., et al. 2005, Space Sci. Rev., 120, 143, doi: 10.1007/s11214-005-5096-3
- Beloborodov & Li (2016) Beloborodov, A. M., & Li, X. 2016, ApJ, 833, 261, doi: 10.3847/1538-4357/833/2/261
- Bernardini et al. (2011) Bernardini, F., Israel, G. L., Stella, L., et al. 2011, A&A, 529, A19, doi: 10.1051/0004-6361/201016197
- Bildsten et al. (1997) Bildsten, L., Chakrabarty, D., Chiu, J., et al. 1997, ApJS, 113, 367, doi: 10.1086/313060
- Blumer et al. (2021) Blumer, H., Safi-Harb, S., Borghese, A., et al. 2021, arXiv e-prints, arXiv:2106.12018. https://arxiv.org/abs/2106.12018
- Bochenek et al. (2020) Bochenek, C. D., Ravi, V., Belov, K. V., et al. 2020, Nature, 587, 59, doi: 10.1038/s41586-020-2872-x
- Borghese et al. (2020) Borghese, A., Coti Zelati, F., Rea, N., et al. 2020, ApJ, 902, L2, doi: 10.3847/2041-8213/aba82a
- Borghese et al. (2019) Borghese, A., Rea, N., Turolla, R., et al. 2019, MNRAS, 484, 2931, doi: 10.1093/mnras/stz084
- Borghese et al. (2021) —. 2021, MNRAS, 504, 5244, doi: 10.1093/mnras/stab1236
- Buccheri et al. (1983) Buccheri, R., Bennett, K., Bignami, G. F., et al. 1983, A&A, 128, 245
- Burgay et al. (2021) Burgay, M., Pilia, M., Possenti, A., et al. 2021, The Astronomer’s Telegram, 14680, 1
- Burrows et al. (2005) Burrows, D. N., Hill, J. E., Nousek, J. A., et al. 2005, Space Sci. Rev., 120, 165, doi: 10.1007/s11214-005-5097-2
- Camilo et al. (2007a) Camilo, F., Ransom, S. M., Halpern, J. P., & Reynolds, J. 2007a, ApJ, 666, L93, doi: 10.1086/521826
- Camilo et al. (2008) Camilo, F., Reynolds, J., Johnston, S., Halpern, J. P., & Ransom, S. M. 2008, ApJ, 679, 681, doi: 10.1086/587054
- Camilo et al. (2007b) Camilo, F., Ransom, S. M., Peñalver, J., et al. 2007b, ApJ, 669, 561, doi: 10.1086/521548
- Camilo et al. (2018) Camilo, F., Scholz, P., Serylak, M., et al. 2018, ApJ, 856, 180, doi: 10.3847/1538-4357/aab35a
- CHIME/FRB Collaboration et al. (2020) CHIME/FRB Collaboration, Andersen, B. C., Bandura, K. M., et al. 2020, Nature, 587, 54, doi: 10.1038/s41586-020-2863-y
- Coti Zelati et al. (2021a) Coti Zelati, F., Borghese, A., Rea, N., et al. 2021a, The Astronomer’s Telegram, 14674, 1
- Coti Zelati et al. (2018) Coti Zelati, F., Rea, N., Pons, J. A., Campana, S., & Esposito, P. 2018, MNRAS, 474, 961, doi: 10.1093/mnras/stx2679
- Coti Zelati et al. (2015) Coti Zelati, F., Rea, N., Papitto, A., et al. 2015, MNRAS, 449, 2685, doi: 10.1093/mnras/stv480
- Coti Zelati et al. (2021b) Coti Zelati, F., Borghese, A., Israel, G. L., et al. 2021b, ApJ, 907, L34, doi: 10.3847/2041-8213/abda52
- Dib & Kaspi (2014) Dib, R., & Kaspi, V. M. 2014, ApJ, 784, 37, doi: 10.1088/0004-637X/784/1/37
- Dib et al. (2012) Dib, R., Kaspi, V. M., Scholz, P., & Gavriil, F. P. 2012, ApJ, 748, 3, doi: 10.1088/0004-637X/748/1/3
- Enoto et al. (2019) Enoto, T., Kisaka, S., & Shibata, S. 2019, Reports on Progress in Physics, 82, 106901, doi: 10.1088/1361-6633/ab3def
- Enoto et al. (2010a) Enoto, T., Nakazawa, K., Makishima, K., et al. 2010a, ApJ, 722, L162, doi: 10.1088/2041-8205/722/2/L162
- Enoto et al. (2010b) —. 2010b, PASJ, 62, 475, doi: 10.1093/pasj/62.2.475
- Enoto et al. (2017) Enoto, T., Shibata, S., Kitaguchi, T., et al. 2017, ApJS, 231, 8, doi: 10.3847/1538-4365/aa6f0a
- Esposito et al. (2009) Esposito, P., Burgay, M., Possenti, A., et al. 2009, MNRAS, 399, L44, doi: 10.1111/j.1745-3933.2009.00723.x
- Esposito et al. (2010) Esposito, P., Israel, G. L., Turolla, R., et al. 2010, MNRAS, 405, 1787, doi: 10.1111/j.1365-2966.2010.16551.x
- Esposito et al. (2020) Esposito, P., Rea, N., Borghese, A., et al. 2020, ApJ, 896, L30, doi: 10.3847/2041-8213/ab9742
- Evans (2021) Evans, P. A. 2021, The Astronomer’s Telegram, 14675, 1
- Gehrels et al. (2004) Gehrels, N., Chincarini, G., Giommi, P., et al. 2004, ApJ, 611, 1005, doi: 10.1086/422091
- Gelfand & Gaensler (2007) Gelfand, J. D., & Gaensler, B. M. 2007, ApJ, 667, 1111, doi: 10.1086/520526
- Gendreau et al. (2016) Gendreau, K. C., Arzoumanian, Z., Adkins, P. W., et al. 2016, in Society of Photo-Optical Instrumentation Engineers (SPIE) Conference Series, Vol. 9905, Space Telescopes and Instrumentation 2016: Ultraviolet to Gamma Ray, ed. J.-W. A. den Herder, T. Takahashi, & M. Bautz, 99051H, doi: 10.1117/12.2231304
- Goldreich & Julian (1969) Goldreich, P., & Julian, W. H. 1969, ApJ, 157, 869, doi: 10.1086/150119
- Gonzalez et al. (2005) Gonzalez, M. E., Kaspi, V. M., Camilo, F., Gaensler, B. M., & Pivovaroff, M. J. 2005, ApJ, 630, 489, doi: 10.1086/432032
- Gotthelf et al. (2004) Gotthelf, E. V., Halpern, J. P., Buxton, M., & Bailyn, C. 2004, ApJ, 605, 368, doi: 10.1086/382232
- Göğüş et al. (2020) Göğüş, E., Baring, M. G., Kouveliotou, C., et al. 2020, ApJ, 905, L31, doi: 10.3847/2041-8213/abcfc8
- Göǧüş (2014) Göǧüş, E. 2014, Astronomische Nachrichten, 335, 296, doi: 10.1002/asna.201312035
- Göǧüş et al. (2011) Göǧüş, E., Güver, T., Özel, F., Eichler, D., & Kouveliotou, C. 2011, ApJ, 728, 160, doi: 10.1088/0004-637X/728/2/160
- Göǧüş et al. (2010a) Göǧüş, E., Woods, P. M., Kouveliotou, C., et al. 2010a, ApJ, 722, 899, doi: 10.1088/0004-637X/722/1/899
- Göǧüş et al. (2010b) Göǧüş, E., Cusumano, G., Levan, A. J., et al. 2010b, ApJ, 718, 331, doi: 10.1088/0004-637X/718/1/331
- Green (2019) Green, D. A. 2019, Journal of Astrophysics and Astronomy, 40, 36, doi: 10.1007/s12036-019-9601-6
- Harrison et al. (2013) Harrison, F. A., Craig, W. W., Christensen, F. E., et al. 2013, ApJ, 770, 103, doi: 10.1088/0004-637X/770/2/103
- Ho (2013) Ho, W. C. G. 2013, MNRAS, 429, 113, doi: 10.1093/mnras/sts317
- Hu & Ng (2019) Hu, C. P., & Ng, C. Y. 2019, Astronomische Nachrichten, 340, 340, doi: 10.1002/asna.201913621
- Hu et al. (2019) Hu, C.-P., Ng, C. Y., & Ho, W. C. G. 2019, MNRAS, 485, 4274, doi: 10.1093/mnras/stz513
- Hu et al. (2020) Hu, C.-P., Begiçarslan, B., Güver, T., et al. 2020, ApJ, 902, 1, doi: 10.3847/1538-4357/abb3c9
- Huang et al. (2021) Huang, Z.-P., Yan, Z., Shen, Z.-Q., et al. 2021, MNRAS, 505, 1311, doi: 10.1093/mnras/stab1362
- Israel et al. (2010) Israel, G. L., Esposito, P., Rea, N., et al. 2010, MNRAS, 408, 1387, doi: 10.1111/j.1365-2966.2010.17001.x
- Israel et al. (2016) —. 2016, MNRAS, 457, 3448, doi: 10.1093/mnras/stw008
- Israel et al. (2021) Israel, G. L., Zelati, F. C., Borghese, A., et al. 2021, The Astronomer’s Telegram, 14685, 1
- Kargaltsev et al. (2012) Kargaltsev, O., Kouveliotou, C., Pavlov, G. G., et al. 2012, ApJ, 748, 26, doi: 10.1088/0004-637X/748/1/26
- Kaspi & Beloborodov (2017) Kaspi, V. M., & Beloborodov, A. M. 2017, ARA&A, 55, 261, doi: 10.1146/annurev-astro-081915-023329
- Kouveliotou et al. (1998) Kouveliotou, C., Dieters, S., Strohmayer, T., et al. 1998, Nature, 393, 235, doi: 10.1038/30410
- Kuiper et al. (2006) Kuiper, L., Hermsen, W., den Hartog, P. R., & Collmar, W. 2006, ApJ, 645, 556, doi: 10.1086/504317
- Lazarus et al. (2012) Lazarus, P., Kaspi, V. M., Champion, D. J., Hessels, J. W. T., & Dib, R. 2012, ApJ, 744, 97, doi: 10.1088/0004-637X/744/2/97
- Levin et al. (2010) Levin, L., Bailes, M., Bates, S., et al. 2010, ApJ, 721, L33, doi: 10.1088/2041-8205/721/1/L33
- Levin et al. (2012) Levin, L., Bailes, M., Bates, S. D., et al. 2012, MNRAS, 422, 2489, doi: 10.1111/j.1365-2966.2012.20807.x
- Levin et al. (2019) Levin, L., Lyne, A. G., Desvignes, G., et al. 2019, MNRAS, 488, 5251, doi: 10.1093/mnras/stz2074
- Li et al. (2021) Li, C. K., Lin, L., Xiong, S. L., et al. 2021, Nature Astronomy, doi: 10.1038/s41550-021-01302-6
- Lien et al. (2016) Lien, A., Sakamoto, T., Barthelmy, S. D., et al. 2016, ApJ, 829, 7, doi: 10.3847/0004-637X/829/1/7
- Livingstone et al. (2011) Livingstone, M. A., Scholz, P., Kaspi, V. M., Ng, C. Y., & Gavriil, F. P. 2011, ApJ, 743, L38, doi: 10.1088/2041-8205/743/2/L38
- Lower et al. (2021) Lower, M. E., Johnston, S., Shannon, R. M., Bailes, M., & Camilo, F. 2021, MNRAS, 502, 127, doi: 10.1093/mnras/staa3789
- Lower et al. (2020) Lower, M. E., Shannon, R. M., Johnston, S., & Bailes, M. 2020, ApJ, 896, L37, doi: 10.3847/2041-8213/ab9898
- Luo et al. (2021) Luo, J., Ransom, S., Demorest, P., et al. 2021, ApJ, 911, 45, doi: 10.3847/1538-4357/abe62f
- Lyne & Manchester (1988) Lyne, A. G., & Manchester, R. N. 1988, MNRAS, 234, 477, doi: 10.1093/mnras/234.3.477
- Majid et al. (2017) Majid, W. A., Pearlman, A. B., Dobreva, T., et al. 2017, ApJ, 834, L2, doi: 10.3847/2041-8213/834/1/L2
- Manchester et al. (2005) Manchester, R. N., Hobbs, G. B., Teoh, A., & Hobbs, M. 2005, AJ, 129, 1993, doi: 10.1086/428488
- Mereghetti (2008) Mereghetti, S. 2008, A&A Rev., 15, 225, doi: 10.1007/s00159-008-0011-z
- Mereghetti et al. (2006) Mereghetti, S., Esposito, P., Tiengo, A., et al. 2006, ApJ, 653, 1423, doi: 10.1086/508682
- Mereghetti et al. (2020) Mereghetti, S., Savchenko, V., Ferrigno, C., et al. 2020, ApJ, 898, L29, doi: 10.3847/2041-8213/aba2cf
- Nakagawa et al. (2009) Nakagawa, Y. E., Yoshida, A., Yamaoka, K., & Shibazaki, N. 2009, PASJ, 61, 109, doi: 10.1093/pasj/61.1.109
- Ng et al. (2012) Ng, C. Y., Kaspi, V. M., Ho, W. C. G., et al. 2012, ApJ, 761, 65, doi: 10.1088/0004-637X/761/1/65
- Ng et al. (2021) Ng, M., Hu, C. P., Enoto, T., et al. 2021, The Astronomer’s Telegram, 14684, 1
- Olausen & Kaspi (2014) Olausen, S. A., & Kaspi, V. M. 2014, ApJS, 212, 6, doi: 10.1088/0067-0049/212/1/6
- Palmer (2021) Palmer, D. 2021, The Astronomer’s Telegram, 14690, 1
- Palmer et al. (2021) Palmer, D. M., Evans, P. A., Kuin, N. P. M., Page, K. L., & Swift Team. 2021, GRB Coordinates Network, 30120, 1
- Pearlman et al. (2019) Pearlman, A. B., Majid, W. A., & Prince, T. A. 2019, Advances in Astronomy, 2019, 6325183, doi: 10.1155/2019/6325183
- Pearlman et al. (2018) Pearlman, A. B., Majid, W. A., Prince, T. A., Kocz, J., & Horiuchi, S. 2018, ApJ, 866, 160, doi: 10.3847/1538-4357/aade4d
- Pearlman et al. (2020) Pearlman, A. B., Majid, W. A., Prince, T. A., et al. 2020, arXiv e-prints, arXiv:2005.08410. https://arxiv.org/abs/2005.08410
- Pennucci et al. (2015) Pennucci, T. T., Possenti, A., Esposito, P., et al. 2015, ApJ, 808, 81, doi: 10.1088/0004-637X/808/1/81
- Perna & Pons (2011) Perna, R., & Pons, J. A. 2011, ApJ, 727, L51, doi: 10.1088/2041-8205/727/2/L51
- Potekhin et al. (2015) Potekhin, A. Y., Pons, J. A., & Page, D. 2015, Space Sci. Rev., 191, 239, doi: 10.1007/s11214-015-0180-9
- Rankin (1993) Rankin, J. M. 1993, ApJ, 405, 285, doi: 10.1086/172361
- Rea et al. (2020) Rea, N., Coti Zelati, F., Viganò, D., et al. 2020, ApJ, 894, 159, doi: 10.3847/1538-4357/ab8387
- Remillard et al. (2021) Remillard, R. A., Loewenstein, M., Steiner, J. F., et al. 2021, arXiv e-prints, arXiv:2105.09901. https://arxiv.org/abs/2105.09901
- Reynolds et al. (2013) Reynolds, M. T., Miller, J. M., Maitra, D., et al. 2013, The Astronomer’s Telegram, 5200, 1
- Ridnaia et al. (2021) Ridnaia, A., Svinkin, D., Frederiks, D., et al. 2021, Nature Astronomy, 5, 372, doi: 10.1038/s41550-020-01265-0
- Rodríguez Castillo et al. (2014) Rodríguez Castillo, G. A., Israel, G. L., Esposito, P., et al. 2014, MNRAS, 441, 1305, doi: 10.1093/mnras/stu603
- Ruderman & Sutherland (1975) Ruderman, M. A., & Sutherland, P. G. 1975, ApJ, 196, 51, doi: 10.1086/153393
- Scargle et al. (2013) Scargle, J. D., Norris, J. P., Jackson, B., & Chiang, J. 2013, ApJ, 764, 167, doi: 10.1088/0004-637X/764/2/167
- Shannon & Johnston (2013) Shannon, R. M., & Johnston, S. 2013, MNRAS, 435, L29, doi: 10.1093/mnrasl/slt088
- Singh & Roy (2021) Singh, S., & Roy, J. 2021, The Astronomer’s Telegram, 14799, 1
- Standish (1998) Standish, E. M. 1998, JPL Planetary and Lunar Ephemerides, DE405/LE405, JPL Interoffice Memo 312.F-98-048 (Pasadena: NASA Jet Propulsion Laboratory)
- Sturrock (1971) Sturrock, P. A. 1971, ApJ, 164, 529, doi: 10.1086/150865
- Tavani et al. (2021) Tavani, M., Casentini, C., Ursi, A., et al. 2021, Nature Astronomy, 5, 401, doi: 10.1038/s41550-020-01276-x
- Thompson & Duncan (1995) Thompson, C., & Duncan, R. C. 1995, MNRAS, 275, 255, doi: 10.1093/mnras/275.2.255
- Thompson & Duncan (1996) —. 1996, ApJ, 473, 322, doi: 10.1086/178147
- Tiengo et al. (2010) Tiengo, A., Vianello, G., Esposito, P., et al. 2010, ApJ, 710, 227, doi: 10.1088/0004-637X/710/1/227
- Wadiasingh et al. (2018) Wadiasingh, Z., Baring, M. G., Gonthier, P. L., & Harding, A. K. 2018, ApJ, 854, 98, doi: 10.3847/1538-4357/aaa460
- Wadiasingh & Timokhin (2019) Wadiasingh, Z., & Timokhin, A. 2019, ApJ, 879, 4, doi: 10.3847/1538-4357/ab2240
- Woods et al. (2007) Woods, P. M., Kouveliotou, C., Finger, M. H., et al. 2007, ApJ, 654, 470, doi: 10.1086/507459
- Woods et al. (1999) Woods, P. M., Kouveliotou, C., van Paradijs, J., et al. 1999, ApJ, 519, L139, doi: 10.1086/312124
- Woods et al. (2004) Woods, P. M., Kaspi, V. M., Thompson, C., et al. 2004, ApJ, 605, 378, doi: 10.1086/382233
- Younes et al. (2017a) Younes, G., Baring, M. G., Kouveliotou, C., et al. 2017a, ApJ, 851, 17, doi: 10.3847/1538-4357/aa96fd
- Younes et al. (2017b) Younes, G., Kouveliotou, C., Jaodand, A., et al. 2017b, ApJ, 847, 85, doi: 10.3847/1538-4357/aa899a
- Zhu et al. (2008) Zhu, W., Kaspi, V. M., Dib, R., et al. 2008, ApJ, 686, 520, doi: 10.1086/591219