A Wide and Deep Exploration of Radio Galaxies with Subaru HSC (WERGS). IV. Rapidly Growing (Super-)Massive Black Holes in Extremely Radio-Loud Galaxies
Abstract
We present the optical and infrared properties of 39 extremely radio-loud galaxies discovered by cross-matching the Subaru/Hyper Suprime-Cam (HSC) deep optical imaging survey and VLA/FIRST 1.4 GHz radio survey. The recent Subaru/HSC strategic survey revealed optically-faint radio galaxies (RG) down to , opening a new parameter space of extremely radio-loud galaxies (ERGs) with radio-loudness parameter of . Because of their optical faintness and small number density of deg-2, such ERGs were difficult to find in the previous wide but shallow, or deep but small area optical surveys. ERGs show intriguing properties that are different from the conventional RGs: (1) most ERGs reside above or on the star-forming main-sequence, and some of them might be low-mass galaxies with . (2) ERGs exhibit a high specific black hole accretion rate, reaching the order of the Eddington limit. The intrinsic radio-loudness (), defined by the ratio of jet power over bolometric radiation luminosity, is one order of magnitude higher than that of radio quasars. This suggests that ERGs harbor a unique type of active galactic nuclei (AGN) that show both powerful radiations and jets. Therefore, ERGs are prominent candidates of very rapidly growing black holes reaching Eddington-limited accretion just before the onset of intensive AGN feedback.
1 Introduction
The formation of supermassive black holes (SMBHs) and their growth across the cosmic time are fundamental questions in modern astronomy. In the local universe at , the mass of SMBH () and their host properties show tight correlations for the SMBH mass range of with a scatter of dex (e.g., Magorrian et al., 1998; Gebhardt et al., 2000; Ferrarese & Merritt, 2000; Tremaine et al., 2002; Marconi & Hunt, 2003; Häring & Rix, 2004; Sani et al., 2011; Kormendy & Ho, 2013; McConnell & Ma, 2013). Such a tight correlation is considered to be established by a balance of feeding and feedback processes between the central SMBHs and the host galaxies.
Local Radio galaxies have been primary targets for investigating the effect of SMBHs on the host galaxies because powerful radio galaxies or radio-loud active galactic nuclei (AGN) mainly reside in massive galaxies whose star-formation is quenched, with the presence of strong jets dispersing the interstellar medium (e.g., Morganti et al., 2005; Holt et al., 2008; Nesvadba et al., 2017), or producing cavities in the host galaxies (e.g., Rafferty et al., 2006; McNamara & Nulsen, 2007; Bîrzan et al., 2008; Blandford et al., 2019). Those radio galaxies tend to show a low accretion rate, i.e., Eddington ratio of , suggesting that the energy release is dominated by the kinetic power by jet, not by the radiation from AGN accretion disk.
However, the situation may be different at . Using over radio AGN selected from the Very Large Array (VLA)-COSMOS 3 GHz large project (Smolčić et al., 2017a), Delvecchio et al. (2018) demonstrated that SMBH accretion in radio-bright () AGN becomes more radiatively efficient () at . They reside in star-forming galaxies, which contain plenty of cold gas. This picture of radio AGN is completely different from those seen in the local universe in the same radio luminosity range (e.g., Hickox et al., 2009). Still, the survey volume of VLA-COSMOS surveys is small so that they may be missing a rare, but radio-bright population. The FIRST survey is the best tool to explore such a radio bright end since it covers half the sky with the VLA at 1.4 GHz (e.g., Becker et al., 1995; Helfand et al., 2015). However, cross-matching the VLA/FIRST sources with the SDSS survey catalog identified optical counterparts in only 30% of the radio sources (Ivezić et al., 2002; Best & Heckman, 2012).
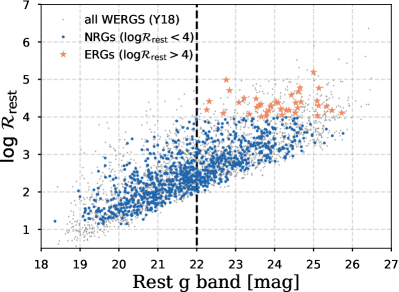
Recent Subaru/Hyper Suprime-Cam (HSC; Miyazaki et al., 2018) strategic survey shed light on such a situation. We have conducted a search for optically-faint radio-galaxies (RGs) using the Subaru HSC survey catalog (Aihara et al., 2018b) and the VLA/FIRST radio continuum catalog, and we have found a large number ( sources) of RGs at – (Yamashita et al., 2018, 2020). The project is called Wide and deep Exploration of Radio Galaxies with Subaru/HSC (WERGS; Yamashita et al., 2018). Yamashita et al. (2018) demonstrated that over 60% of populations now have reliable optical counterparts thanks to deep HSC/optical imaging. Figure 1 shows that the WERGS sample spans a wide range of optical magnitude and radio-loudness parameter of – (e.g., Ivezić et al., 2002).
Our particular interest is the new parameter space of optically faint RGs that are extremely radio-loud galaxies (ERGs) with . Previously known radio quasars have a peak of radio-loudness at –, and rarely contain any sources with (Ivezić et al., 2002; Inoue et al., 2017). Therefore, the optical emission of ERGs seems not originate from the AGN accretion disk anymore probably due to dust obscuration of the nuclei, but it traces the stellar-component of the host galaxies (e.g., Terashima & Wilson, 2003). Given that the optical band is very faint with median magnitudes of , ERGs might have smaller stellar mass than previously known radio sources. Considering the very small number density of ERGs ( source deg-2), it is not surprising that deep but smaller volume surveys (such as VLA-COSMOS Smolčić et al., 2017a, b) have rarely detected such ERGs, and the very wide SDSS survey (e.g., SDSS-selected radio galaxies Best & Heckman, 2012) could not detect ERGs either because of their shallow sensitivity down to only .
In this study, we will explore the physical properties of ERGs. Toba et al. (2019) already compiled multi-wavelength data covering the optical, IR, and radio band for the WERGS sample, and derived physical parameters of host galaxies such as stellar mass, star-formation rate as well as the AGN luminosity estimated from the mid-IR bands. By using this data set, we will explore the AGN and host galaxy properties of the ERGs. Thoroughout this paper, we adopt the same cosmological parameters as Yamashita et al. (2018) and Toba et al. (2019); km s-1 Mpc-1, , and .
2 Sample Selection and Properties
Our initial sample is based on the WERGS sample ( sources; Yamashita et al., 2018), which compiled the HSC Subaru Strategic Program (HSC-SSP) optical counterparts of the VLA/FIRST data. Here, we briefly summarize the WERGS sample and the reader should refer to Yamashita et al. (2018) for the WERGS catalog and Toba et al. (2019) for the IR catalog of the WERGS sample. We also describe further selection criteria imposed on the sample, which are suitable for this study. The number of WERGS sources after each sample selection cut is also summarized in Table 1.
2.1 WERGS Sample
2.1.1 VLA/FIRST
The VLA/FIRST survey contains radio imaging data at 1.4 GHz with a spatial resolution of 5.4 arcsec (Becker et al., 1995; White et al., 1997), which completely covers the footprint of the HSC-SSP Wide-layer (see the text below). Yamashita et al. (2018) utilized the final release catalog of FIRST (Helfand et al., 2015) with the flux limit of mJy, and extracted 7072 FIRST sources in the HSC-SSP footprint.
2.1.2 Subaru/HSC-SSP data
The HSC-SSP is an ongoing wide and deep imaging survey covering five broadband filters (-, -, -, -, and -band; Aihara et al., 2018b; Bosch et al., 2018; Furusawa et al., 2018; Kawanomoto et al., 2018; Komiyama et al., 2018; Huang et al., 2018), consisting of three layers (Wide, Deep, and UltraDeep). Yamashita et al. (2018) utilized the Wide-layer S16A data release, which contains observations from 2014 March to 2016 January with a field coverage of 154 deg2 (based on six fields; XMM-LSS, GAMA09H, WIDE12H, GAMA15H, HECTOMAP, and VVDS), and forced photometry of limiting magnitude down to and for and -band, respectively (Aihara et al., 2018a). The average seeing in the -band is arcsec, and the astrometric root mean squared uncertainty is about 40 mas. After removing spurious sources flagged by the pipeline, Yamashita et al. (2018) cross-matched the FIRST sources with a search radius of 1 arcsec. Yamashita et al. (2018) also required detections with in the -, -, and -bands to qualify as an optical counterpart. This initial sample of Yamashita et al. (2018) comprised 3579 sources.
We then applied additional cuts to this sample. To remove radio galaxies from the initial WERGS sample whose radio emission might be dominated by the star-formation of host galaxies, and not by the AGN, we set a lower-limit to radio-luminosity of , which is equivalent to the radio-emission from the host galaxies with a star-formation rate of yr-1 (Condon, 1992; Condon et al., 2013). This cut is also supported by a steep decline of radio luminosity function of starburst galaxies above (e.g., Kimball et al., 2011; Tadhunter, 2016; Padovani, 2016). This criterion reduces the sample size to 3147.
Next, we limit our sample to compact sources in the radio band. This is important in order to reduce false optical identification by mismatching the optical sources with the locations of spatially extended radio-lobe emission. Yamashita et al. (2018) discussed this and categorized radio compact sources using the ratio of the total integrated radio flux density to the peak radio flux density . They treated the source as compact if the ratio fulfills either of two following equations,
| (1) | ||||
| (2) |
where is the S/N, and rms is a local rms noise in the FIRST catalog, and the above two equations are obtained from the study by Schinnerer et al. (2007) (see also the original criterion: Ivezić et al., 2002). We set an additional conservative requirement that there shall be no FIRST source in the surrounding 1 arcmin (corresponding to kpc at ) to select the isolated radio core emission and avoid coincident matching with radio lobes of other nearby FIRST sources. This reduces the sample to 2583 sources.
A further ten sources were removed in crowded regions of the HSC footprint due to multiple HSC detections within arcsec of the HSC counterpart, bringing the sample down to 2573 sources.
Finally, we restricted the sample to sources with spectroscopic redshift
(spec-; ) or reliable photometric redshift (photo-; ) values.
The spec- were obtained
from SDSS DR12 (Alam et al., 2015),
the GAMA project DR2 (Driver et al., 2011; Liske et al., 2015),
and WiggleZ Dark Energy Survey project DR1
(Drinkwater et al., 2010).
In this study, we limit the sample to the spec- range to cover the same redshift range as
the photo- sample.
For the sources without spec-,
we utilized the photo- estimated using
the Mizuki SED-fitting code
which is one of the standard photo- packages for the HSC-SSP survey.
The method utilizes the photometries of the five HSC-SSP bands
(see Tanaka, 2015; Tanaka et al., 2018, for more details) for the SED fitting.
Yamashita et al. (2018) discussed that the HSC-SSP photo- derived by MIZUKI is reliable for based on comparison with spectroscopic redshift in
the COSMOS field.
In addition, the redshift of sources with
are sometimes erroneous because they lack
the Balmer break tracer in the HSC optical bands.
Therefore, we limit the sample to .
We further imposed requirements
based on the reliable photo- fitting quality (reduced , , and
),
following Toba et al. (2019).
The resulting WERGS sample contains
1770 sources.
Given that our sample largely relies on photo- results, we further discussed how possible erroneous photo- might affect our main results in Appendix A.
| (1) | (2) | (3) | |
|---|---|---|---|
| Selection | No. of WERGS sources | No. of ERGs | |
| Parent WERGS sample of Yamashita et al. (2018) | 3579 | 273 | |
| W Hz-1 | 3147 | 270 | |
| compact radio sources | 2792 | 208 | |
| No nearby multiple FIRST sources in arcmin | 2583 | 192 | |
| No nearby multiple HSC sources in arcsec | 2573 | 187 | |
| Redshift range at | 2286 | 145 | |
| Good photo- quality | 1770 | 79 | |
| IR available region by Toba et al. (2019) | 1055 | 39 | |
| (final sample) | 1026 | 39 |
2.2 WERGS IR catalog
To study the AGN and host galaxy properties in WERGS,
Toba et al. (2019) compiled optical,
near-IR, mid-IR, far-IR, and radio data for the WERGS sample.
Toba et al. (2019) performed spectral energy distribution (SED) fitting with CIGALE (Boquien et al., 2019),
and inferred physical properties,
including the IR luminosity contributed
from AGN (IR AGN luminosity; ),
dust extinction corrected stellar-mass (), and SFR estimated from the decomposed host galaxy IR emission111The catalog containing physical parameter of Toba et al. (2019) is available at
http://vizier.u-strasbg.fr/viz-bin/VizieR?-source=J/ApJS/243/15.
For the estimation of , Toba et al. (2019)
considered the contamination of Synchrotron radiation
in the IR bands by extrapolating the power-law from the radio bands. Thus, is obtained purely
from the dust emission heated by AGN.
The bolometric AGN luminosity is estimated by using the conversion
(Delvecchio et al., 2014; Inayoshi et al., 2018).
Because Toba et al. (2019) restricted themselves to objects
in an area of deg2, in which mutli-wavelength
information from -band to far-IR was available,
our sample is reduced to 1055 sources.
Some of the selected sources have intensive star formation rates, reaching yr-1, so we applied an additional cut to remove possible star-formation dominated radio galaxies using the ratio of IR and radio luminosity (; Helou et al., 1985; Ivison et al., 2010) defined by
| (3) |
where is the total IR luminosity in units of W derived from CIGALE and is the frequency in Hz corresponding to 80 m, which makes a dimensionless quantity. We set (Del Moro et al., 2013) to select radio excess (meaning jet-emission dominated) sources.
As a result, our final sample reduces to 1026 sources, and
the resulting final number of ERGs fulfilling is 39 sources, and they are shown in orange stars in Figure 1.
We refer to the remaining 987 WERGS sources with as “normal radio galaxies (NRGs)” (shown with blue circles in Figure 1) hereafter.
Table 1 shows the number of sources for the full WERGS sample and the ERGs after each selection cut. ERGs suffers the photo- quality cut more than the full WERGS sample because ERGs contain a relatively large fraction of optically faintest sources with , which sometimes makes the reliable photo- estimation difficult. The IR selection cut is another main factor in reducing the number of sources. This is mainly because the region available for the IR data is limited in the area of deg2 out of the 154 deg2 (Toba et al., 2019). Note that this IR selection reduces the similar fraction of sources for the full WERGS sample (60%) and ERGs (55%).
3 Results
We summarize the properties of the obtained 39 ERGs with IR detections. First, we show the basic differences between ERGs and NRGs. Then, we show the properties of ERGs on SMBHs and host galaxies.
3.1 Basic Sample Properties
3.1.1 vs. -band magnitude
Figure 1 shows the distribution of the radio-loudness parameter as a function of the rest-frame -band magnitude (). The vertical dashed-line at indicates the SDSS magnitude limit (e.g., Ivezić et al., 2002). Since most ERGs are fainter than the SDSS limit, Subaru/HSC has enabled us to investigate this unique population for the first time. Figure 1 also shows that most ERGs are very faint in the optical, with median magnitudes of . The current 8 m class telescopes are sufficiently sensitive to obtain spec- for the bright end of the ERGs sample down to , and with 30 m class telescopes, spec- can be obtained for sources down to .
3.1.2 – plane
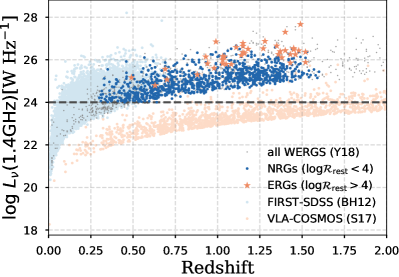
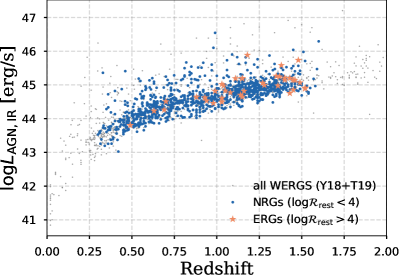
Figure 2 shows the radio and IR AGN luminosities of our sample as a function of redshift. The 1.4 GHz radio luminosity ( W Hz-1) is taken from Yamashita et al. (2018) or Toba et al. (2019), in which the integrated flux density () obtained by the VLA/FIRST final catalog (Helfand et al., 2015) is used, and -correction is applied by assuming a power-law radio spectrum with , where is estimated with for the objects having TGSS 150 MHz data (Intema et al., 2017), and for all others (e.g., Condon, 1992).
As shown in the left panel of Figure 2, ERGs show relatively high radio luminosities with a median of , which is one order of magnitude higher than that of the NRGs (). On the other hand, in terms of the IR AGN luminosity shown in the right panel, there is no clear difference between ERGs and the NRGs for ERGs and for the NRGs. We therefore assume ERGs to be intrinsically radio-louder sources than NRGs, and we will discuss this in Section 4.1.

3.2 Host Galaxy Properties
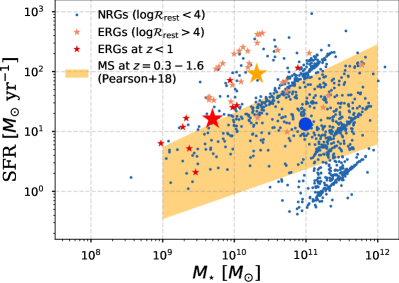
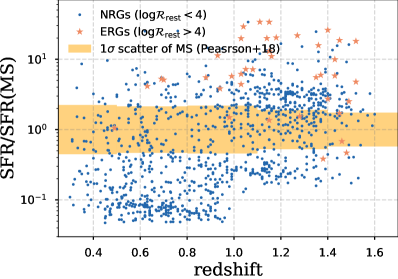
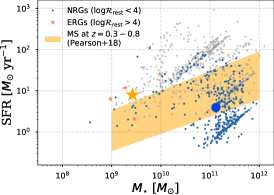
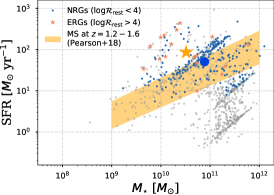
The left panel of Figure 3 shows the distribution of our RGs in the
SFR and plane, where both values are obtained from the optical+IR SED fitting with CIGALE (Toba et al., 2019).
It is known that most star-forming galaxies follow the main-sequence (MS)
whose normalization
moves upward with redshift, as galaxies are more gas-rich at higher
(e.g., Brinchmann et al., 2004; Noeske et al., 2007; Elbaz et al., 2011; Whitaker et al., 2012; Schreiber et al., 2015a).
Above the MS, galaxies are referred to as starburst galaxies, producing stars more efficiently than regular star-forming galaxies.
Pearson et al. (2018) measured the SFR and
using multi-wavelength data from UV to far-IR
employing the CIGALE code, and their
MS is delineated with the shaded area in Figure 3, whose bottom and top boundaries correspond to redshifts of and
with the scatter of at and at , respectively.
In this study, we define the sources as starburst galaxies if they are located above the yellow shaded MS area, which is roughly consistent with the criteria in previous studies (e.g., Elbaz et al., 2011).
Considering that our sample spans a wide redshift range in and their rapid redshift evolution of MS, redshift dependence is a key factor to understand the relation in the left panel of Figure 3. Therefore we also calculate the ratios between the observed SFRs and those predicted from the MS relations at a given stellar-mass, that is SFR/SFR(MS), and its redshift dependence is shown in the right panel of Figure 3. We also compile how the SFR and relation evolves with redshift in Appendix B and Figure 10 (top panels).
Figure 3 shows several sequences of sources, notably at around sSFR, , and yr-1, and the sources locate scarcely between the sequences. This does not originate from the properties of nature, but more mainly from the complications of the limited bin numbers of the SED fitting parameters of star-forming history (SFH). In our case, the most notable contribution is considered to be ; mass fraction of the burst population. Toba et al. (2019) set a limited parameter binning of , and , which is roughly corresponding to the bindings at sSFR and yr-1. This banding might disappear once we follow the same SFH parameter binning of Pearson et al. (2018), which was impossible for our studies because of the additional parameters of AGN and radio components which increase the computational time exponentially. Therefore instead we assume that SFRs in this study have large uncertainty of dex. Please see the more detailed discussion on the choice of the SFH parameters and their effects on the SFR estimations (e.g., Schreiber et al., 2015b; Ciesla et al., 2017; Pearson et al., 2018).
Although our SFR estimation by Toba et al. (2019) might harbor large uncertainties as discussed above, Figure 3 shows three important suggestions. One is that most ERGs are distributed above the MS by a factor of (see the right panel), suggesting that most ERGs are in starburst mode and they contain a copious amount of gas. This is indirect evidence for the availability of cold gas supply fueling both star-formation, and the central SMBHs. The specific star-formation rate defined by reaches yr-1 for ERGs, suggesting that ERGs are in a rapid stellar-mass assembly phase with mass doubling times of only Myr. This value is also comparable to one starburst duration (e.g., McQuinn et al., 2010) and thus most of the stellar component is expected to be dominated by a very young population.
Second, the onset of AGN feedback on the host galaxies has apparently not (yet) happened to most ERGs considering their location above the MS.
This indicates a different picture from the conventional local RGs, which show a preference of massive host galaxies
() and fall below the MS because their strong AGN feedback quenches star formation (e.g., Seymour et al., 2007).
Note that our sample requires IR detections for the CIGALE SED fitting to derive stellar-mass and SFR,
therefore the WERGS not detected in IR do not
appear in Figure 3.
In addition to that, our sample requires radio compact morphologies, which removes a large population of local, radio-extended RGs.
These two selection criteria may introduce a selection bias,
since it is possible that these
IR non-detection or radio extended sources are clustered below the SF main-sequence.
It is nonetheless intriguing that ERGs are located at the top edge of the distribution within the WERGS sample with IR detections.
The third point is that, if we limit ourselves to the sources with (red star points), most of these are clustered at the low- end, typically at . This suggests that the low- subsample of ERGs is potentially important with regard to the study of BH seeds. Considering that all of our sources fulfill (1) , that is, they lie above the threshold where their radio luminosity could be produced by star formation, as discussed in Section 2.1.2, and (2) the radio-excess selection with , their radio emission can only be achieved by the AGN jet, requiring the existence of a SMBH at the center. Therefore, ERGs contain massive BH candidates residing in low-mass galaxies.
Figure 4 shows the distribution of ERGs and NRGs in the and plane, and illustrates the third point above from a different aspect. ERGs populate regions of comparatively small stellar-mass and high , showing that higher sources tend to have smaller as well as higher . The combined results from above and from Figure 1 suggest that smaller sources tend to observed as optically fainter sources, and are therefore observed as high sources. We will discuss this point later in Section 4.1.
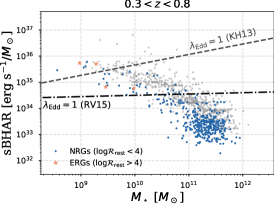
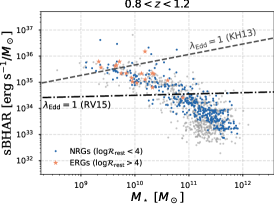
3.3 SMBH Properties: Relation between sBHAR and
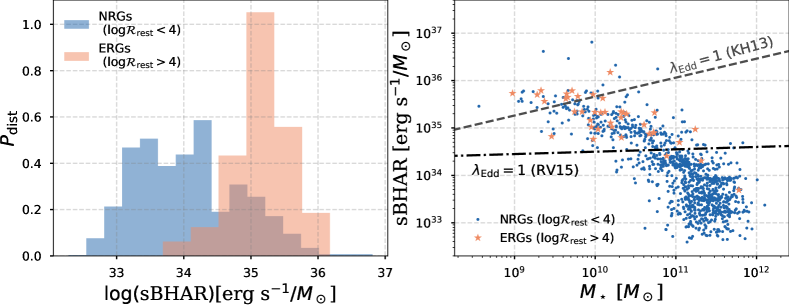
Considering that most ERGs are very faint () in optical, as shown in Figure 1 and Section 3.1.1, obtaining the BH virial mass from spectroscopy (e.g., McLure & Dunlop, 2004) is time-consuming and difficult even if they are type-1 AGN. This means that the direct measurement of the Eddington ratio (, where is Eddington luminosity erg s-1), is difficult at this stage. Instead, we investigate the SMBH properties through the specific black hole accretion rate (hereafter, sBHAR), which may be considered a proxy for the Eddington ratio. The sBHAR is conventionally defined as (e.g., Mullaney et al., 2012). The left panel of Figure 5 shows the distribution of sBHAR for ERGs and NRGs. The median sBHAR of ERGs is , which is an order of magnitude higher than that of the NRGs with . Based on Best & Heckman (2012), the boundary of radiatively inefficient and efficient AGN is at an Eddington ratio of , which corresponds to –. Thus, almost all of our sources are considered to be radiatively efficient AGN.
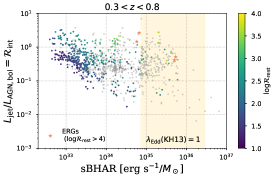
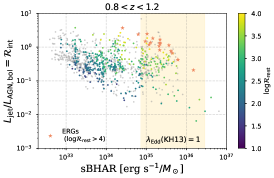
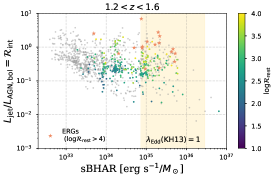
This difference in sBHAR between the two subgroups is more pronounced in the right panel of Figure 5, showing sBHAR as a function of . To illustrate the dependence of and on sBHAR more clearly, we use local scaling relations between and . Previous studies assumed a constant ratio of (Marconi & Hunt, 2003; Häring & Rix, 2004) and for simplicity (Aird et al., 2012; Mullaney et al., 2012; Delvecchio et al., 2018; Aird et al., 2019). In this study, we apply stellar-mass dependent values for with , where (KH13; Kormendy & Ho, 2013) and (RV15; Reines & Volonteri, 2015). With this relation, sBHAR can be written as a function of and by
| (4) | |||
| (5) |
The right panel of Figure 5 exhibits that ERGs are more clustered in the high Eddington ratio regime. The expected median Eddington ratio by using Eq. (4) is . Some sources appear to exceed the Eddington limit. NRGs cover a broader range in sBHAR, and some massive galaxies with fall into the radiatively in-efficient regime with .
We caution that the above discussion does not take into account the redshift evolution of the – relation, which has been suggested in some studies (e.g., Woo et al., 2008; Merloni et al., 2010; Ding et al., 2020). In this case, the estimated becomes larger at a given , and the resulting Eddington ratio becomes smaller. Assuming the evolutional trend of Merloni et al. (2010), with , and using a median redshift for the ERGs of , the normalization of sBHAR becomes slightly smaller by a factor of 1.6. As shown in Figure 5, this difference does not change our overall result. Although there are other significant uncertainties and possible systematics of the expected values, under the basic assumptions of Equations (4) or (5), our results suggest that higher sources have higher sBHAR, and ERGs might contain sources achieving super-Eddington accretion. We will discuss this point in Section 4.1.
In summary, our results indicate that ERGs exhibit high sBHAR with the expected Eddington ratio of , and some ERGs may be experiencing a super-Eddington phase. In addition, ERGs are likely starburst galaxies and their stellar-mass is relatively lower than NRGs. ERGs appear to be in a phase preceding the onset of AGN feedback. If we limit the sample to , most ERGs are low-mass galaxies with . Therefore, lower- ERGs are also candidates of massive, rapidly growing BHs.
4 Discussion

4.1 What Does High Mean?
Figures 1 and 2 indicate that ERGs or high sources tend to trace optically-faint, but radio-loud AGN. In addition, Figure 4 shows that higher tends to pick up relatively lower stellar-mass population. This means that the selection of ERGs using has a preference of selecting smaller and, therefore, using optical bands does not seem to trace AGN accretion disk emission in the optical band. This is not a new result, but it is a long-standing issue surrounding the use of the optical radio-loudness : it is strongly affected by host galaxy contamination and/or the nuclear obscuration around the SMBHs (Terashima & Wilson, 2003; Ho, 2008). This raises the question of whether ERGs are intrinsically radio-loud or not.
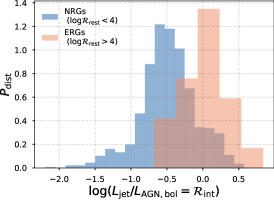
To investigate this, we estimate the “intrinsic” radio-loudness ; the energy balance between the jet and accretion-disk defined by , which is frequency-independent, and also free from the contamination of host galaxy component, unlike (e.g., Terashima & Wilson, 2003). For the accretion disk luminosity, we use the bolometric AGN luminosity obtained from the IR AGN luminosity (), since is derived from IR SED decomposition, which traces the re-radiation of the dust powered by AGN and is mostly insusceptible to absorption (Gandhi et al., 2009; Asmus et al., 2015; Ichikawa et al., 2012, 2017, 2019).
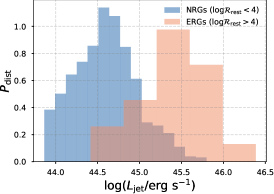
The total jet power of the AGN () can be estimated from the radio luminosity of the compact core or from the total radio emission (Willott et al., 1999; Cavagnolo et al., 2010; O’Sullivan et al., 2011). We adopt the relation between and of Cavagnolo et al. (2010),
| (6) |
Note that the above equation is derived with the assumption that most radio sources have a spectral index of . This value is almost consistent with the median value of our WERGS sample; for the sources with detections at both TGSS 150 MHz and VLA/FIRST 1.4 GHz, or the fiducial value of for the sources whose radio band detection is only in one band (i.e., VLA/FIRST 1.4 GHz only) (Condon, 1992). Shabala & Godfrey (2013) recently investigated the effect of the radio source size in the jet power estimation, and found the dependence on the source size to be , suggesting that the effect of the source size is small. Since our sample is selected only for radio-compact emission in VLA/FIRST with a spatial resolution of arcsec (or kpc at ) this again mitigates the size dependence; otherwise the sources are ultra-compact sources.
The left panel of Figure 6 shows the distribution of , spanning , and the median values are for ERGs and for NRGs, which is equivalent to the radio-loud quasar level (e.g., Best et al., 2005; Inoue et al., 2017). This is naturally expected since we apply the simple conversion relation (Eq. 6), all of our sources are selected based on VLA/FIRST detection with the mJy flux limit, and the radio luminosity range is similar to that of the FIRST-SDSS sample, although they are located in relatively higher- (see Figure 2).
This high is powerful enough to produce a radio jet with the size of kpc that can disperse the interstellar medium (e.g., Nesvadba et al., 2017) and create cavities in the galactic inster-stellar medium and larger scale intergalactic environment to possibly quench star-formation in host galaxies (e.g., McNamara & Nulsen, 2007). Given the compact radio sizes of the sources in our sample ( arcsec or kpc at ) and given the fact that the host galaxies are still in an active star-forming phase (Figure 3), ERGs and the WERGS sources above or on the SF main-sequence may still be in the phase before the onset of huge kinetic radio feedback.
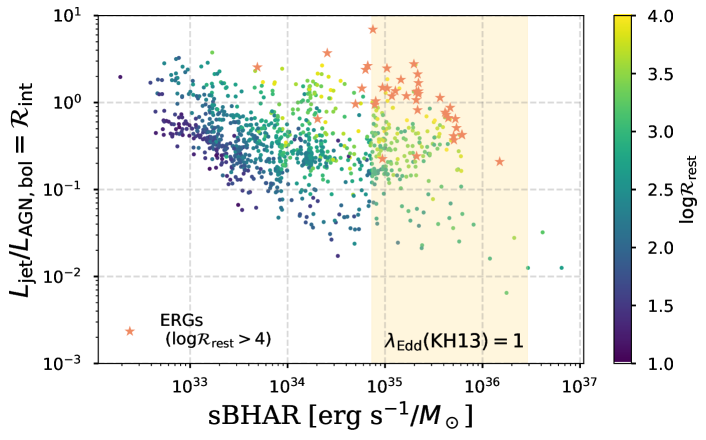
The middle panel of Figure 6 shows the distribution of , and the median values of the two populations are for ERGs, and for NRGs. For half of the ERGs, , that is, the jet kinetic power is higher than the radiation from the accretion disk. The physical properties of higher sources are more clearly illustrated in Figure 7, which shows the distribution of ERGs and other WERGS sources in the –sBHAR plane. The yellow shaded area is the region corresponding to assuming Equation (4) for the range of . The other WERGS sources are shown with a color gradation in , with higher lying toward the top right of the plot. This means that higher sources tend to have both higher and higher . It is well known that radio galaxies are more radio-loud as the Eddington-scaled accretion rate decreases, producing the sequence from the top left region toward the bottom right one in Figure 7 (Ho, 2002; Merloni & Heinz, 2007; Panessa et al., 2007; Sikora et al., 2007, 2013; Ho, 2008), and overall NRGs also follow this trend. However, ERGs are located in the top right part of the plane, suggesting that ERGs contain rapidly growing BH in the center, and at the same time harbor powerful, compact radio-jets.
These radio galaxies are different from the conventional radio galaxies in the local universe (Seymour et al., 2007). Delvecchio et al. (2018) recently found that high- () radio galaxies discovered in the VLA/COSMOS survey tend to have high Eddington ratios with and that they are also starforming or starburst galaxies. This is consistent with the properties of our overall WERGS sample (see also Toba et al., 2019), and thus ERGs occupy the extreme end of highly accreting BHs in radio galaxies.
4.2 and the Origin of Radio Emission in ERGs
Figure 7 indicates that ERGs are a very interesting population, showing both radiative (high ) and jet-efficient (high ) emission, which were missed in previous surveys. To investigate the jet properties in more detail, we here discuss the jet efficiency of ERGs and compare the obtained values with other radio sources. The jet production efficiency is defined as
| (7) |
where is the radiation efficiency of an AGN accretion disk, is the speed of light, and is the mass accretion rate onto the SMBH through the disk. In the following, we adopt a canonical value of based on the Soltan-Paczynski argument (Soltan, 1982).
The distribution of is shown in the right panel of Figure 6. The median values are for ERGs and for NRGs. These values are slightly higher or consistent with the nearby radio AGN population () whose host galaxies are massive (; Nemmen & Tchekhovskoy, 2015). However, the local radio AGN population generally has much smaller Eddington ratios of . This population would be located in the top left region in Figure 7, so they are clearly different from ERGs. The of ERGs is higher by a factor of compared to the SDSS radio quasar population, whose radio jet efficiency lies at (e.g., van Velzen & Falcke, 2013; Inoue et al., 2017). Considering that the SDSS radio quasars on average show , those radio quasars would be located at the bottom-center to bottom-right of Figure 7, which is again different to the distribution of ERGs. Therefore, the disk-jet connection may be fundamentally different from the standard disk model, which conventionally describes the quasar/AGN accretion disk emission.
One possible origin of this high production efficiency of radiation and jets is that the accretion disk of ERGs is actually in the “radiatively inefficient” state, but the physical origin of radiative inefficiency is different from the disks in the local radio galaxies. For example, the ERGs may be undergoing more rapid mass accretion (so called slim disk model; Abramowicz et al., 1988). Recent radiation hydrodynamical simulations suggest that when the mass accretion rate significantly exceeds the Eddington rate, radiation is effectively trapped within the accreting matter and advected to the central BH before escaping by radiative diffusion. As a result, the emergent radiation luminosity is saturated at the order of (i.e., at ) and the accretion flow turns into a radiatively inefficient state even with a super-Eddington accretion rate (e.g., Ohsuga et al., 2005, 2009; McKinney et al., 2014; Inayoshi et al., 2016; Takeo et al., 2020). This phase is considered to be a key process of the BH seed growth in the high- () universe to describe the already known massive high- SMBHs (e.g., Mortlock et al., 2011; Wu et al., 2015; Bañados et al., 2018; Onoue et al., 2019).
In the situation that the accretion rate is well above the Eddington rate, a relativistic jet can be launched by the Blandford-Znajek mechanism if large-scale magnetic fields exist in the innermost region (Blandford & Znajek, 1977; Tchekhovskoy et al., 2011). The jet behavior of these extreme cases has been investigated by several authors (Sadowski et al., 2014; Sadowski & Narayan, 2015) using a 3D general relativistic radiation magneto-hydrodynamical simulation (GRRMHD) code. They find that, in these (super-)Eddington accretion phase, BHs emit a significant amount of radiation and jet energy, and both the radiation and jet power approach around the Eddington limit, which appears to be the case for ERGs and the sources in the top right region in Figure 7 (see also Blandford et al., 2019). Thus, the study of ERGs at will be complementary to studies utilizing the next generation instruments capable of observing seed BHs in the early universe at (Haiman et al., 2019) in the investigations of the growth of seed BHs.
4.3 Alternative Scenarios: If ERGs Do Not Follow Local Scaling Relations between and
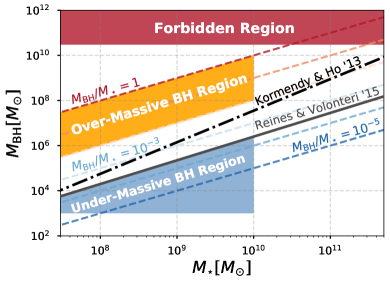
The discussion related to the Eddington ratio depends on the estimation, which in turn relies on the local scaling relation of Kormendy & Ho (2013). However, it is not obvious that this relation also holds in the low-mass end in which many ERGs probably reside. Although the current data cannot give any constraints on this issue and a more detailed study is beyond the scope of this paper, we discuss two alternative scenarios, in which our galaxies are above (case one) or below (case two) the correlation between and as shown in Figure 8.
Case one reflects the possibility that ERGs might host over-massive BHs compared to the relation by Kormendy & Ho (2013), with the BH-to-stellar-mass ratio (see the orange shaded area in Figure 8). In this case, concerns surrounding super-Eddington accretion discussed in Section 3.3 and 4.1 are alleviated: the median Eddington ratio for ERGs can be parametrized by .
In addition, the possible future growth path in the plane of and can be discussed by assuming the current BH/stellar mass assembly rate. Since the radiation efficiency is in the sub-Eddington regime, the BH accretion rate is estimated as , where the median Eddington ratio above is substituted (note that this equation is valid at ). Comparing the BH accretion rate to the sSFR of ERGs (sSFR; see Figure 3), we obtain , which is independent of the choice of . Therefore, the BH-galaxy mass ratio for ERGs is expected to approach a canonical value observed in the local universe (e.g., ; Kormendy & Ho, 2013). This evolutional path might be analogous to that of known high- luminous quasars whose SMBHs are likely over-massive compared to the local relation with (e.g., Wang et al., 2013, 2016; Trakhtenbrot et al., 2015; Decarli et al., 2018).
Case two considers the possibility that ERGs might host very under-massive BHs with – as shown in the blue shaded region in Figure 8. For instance, the overall normalization for late-type galaxies may be considerably lower than for the local relation of early-type galaxies (e.g., Reines & Volonteri, 2015; Läsker et al., 2016; Greene et al., 2019). This “galaxy grows first, BH come later” phase may occur because gas accretion onto the BHs is quite inefficient due to efficient stellar feedback, e.g., star formation-driven outflows, and the shallow halo potential until the stellar-mass reaches a critical value of (e.g., Bower et al., 2017; Habouzit et al., 2017). However, once the galaxy reaches the critical mass, above which star formation-driven outflows no longer prevent the gas accretion to the galactic nuclei, they abruptly switch to a rapid growth phase in the absence of feedback, and finally merge into the local relation. ERGs with might be in such a rapidly growing phase.
The scenario above looks promising but it is worth discussing the critical mass value because the stellar mass of most ERGs actually lies below the expected critical mass. Beside, Figure 5 shows that the median sBHAR (and therefore ) tends to be higher for less massive ERGs with the median Eddington ratio of , suggesting that the extreme BH growth is possible (at least temporally) even in lower mass galaxies. This discrepancy may reflect that there are missing understanding on the physics of AGN feedback and gas feeding in low mass galaxies.
Another interesting point in the second scenario is that the Eddington ratio for several ERGs becomes as high as . Recent numerical simulations suggest that for a highly magnetized accretion disk around a rapidly spinning BH, the disk transits into a magnetically arrested disk (MAD) state and produces high radiative luminosity (e.g., McKinney et al., 2014; Sadowski & Narayan, 2015). Through the emission process, the level of high luminosity could be achieved only when the BH mass accretion exceeds (Inayoshi et al. 2016; see also Figure 5 in Inayoshi et al. 2019). Therefore, if this scenario is true, future follow-up observations of those ERGs with such high Eddington ratios would reveal the properties of possibly hyper-Eddington accreting BHs (Takeo et al., 2020).
4.4 Prospects for AGN Feedback in Low-Mass Galaxies through ERGs
In recent years, the theoretical study of AGN feedback has been extended to low-mass galaxies (Silk, 2017). This was motivated mainly by the increasing number of intriguing observational results showing signs of AGN feedback in low-mass galaxies (Nyland et al., 2017; Penny et al., 2018; Kaviraj et al., 2019; Dickey et al., 2019; Mezcua et al., 2019). Our results show that the jet power of erg s-1 in ERGs is equivalent to that produced from radio quasars and local radio AGN residing in massive galaxies. This suggests the presence of a strong jet that can disperse or even expel the interstellar medium (e.g., Morganti et al., 2005; Holt et al., 2008; Nesvadba et al., 2017) or produce cavities in the host galaxies, which are often observed in the local massive counterparts (e.g., Rafferty et al., 2006; McNamara & Nulsen, 2007; Bîrzan et al., 2008; Blandford et al., 2019). On the other hand, low stellar-mass ERGs are still in a starburst phase, indicative of a substantial gas reservoir, and lacking clear signatures of negative AGN feedback222Numerical simulations suggest that mechanical feedbacks associated with jets would impact upon their host galaxies with a significant delay time, which might be marginally longer than the typical AGN lifetime (Costa et al., 2018).
To investigate whether such a negative feedback from the jet is effective in the host galaxies, it is necessary to obtain high spatial resolution radio images that resolve the host galaxy down to scales of kpc (Reines et al., 2020). Our sample of compact radio sources from VLA/FIRST with a spatial resolution of arcsec only provide poor upper-bounds of the radio jet size of kpc at . Future higher quality observations with sub-arcsecond resolution will provide more insight into the effect of the jet on the host galaxy.
Given that the BH mass of ERGs might reach the massive BH range below , studying the properties of ERGs gives a window into understanding seed BH growth in the high- universe. Some observational studies recently suggested that AGN feedback might also have positive effect on the host galaxies, and intensive in situ star formation is ignited in the outflowing gas launched by the AGN (Maiolino et al., 2017). Recent numerical simulations of jet-driven feedback also predict star-formation triggered on galaxy scales by the overpressure of the jet during the first few Myrs of strong interaction between the jet and the interstellar medium (Wagner & Bicknell, 2011; Wagner et al., 2016; Gaibler et al., 2012; Mukherjee et al., 2018). If the radio jets in low-mass galaxies have a positive impact on both star formation and BH growth, then radio-selected AGN in low-mass galaxies are an intriguing population for understanding the BH and stellar mass assembly in the environment of shallow potential low-mass galaxies.
4.5 Wide Area Radio and Optical Surveys; Potential for Discovering Previously Missed Populations
The small number density of ERGs ( source deg-2) and their optical faintness of suggest that ERGs were easily missed in previous optical surveys of radio sources. Our work shows that ERGs can be discovered with wide ( deg2) and deep () optical follow-up observations of radio sources. The number of known ERGs will increase in near future, once the Subaru/SSP survey is complete, covering an area of deg2. The upcoming Subaru/Prime Focus Spectrograph (PSF; Takada et al., 2014) will conduct extensive optical and near-IR spectroscopic follow-up observations in the footprint of the HSC-SSP field, providing spec- information of ERGs with . The forthcoming LSST survey (Ivezić et al., 2019) will cover half of the sky, and it will also increase the number of sources by another order of magnitude, resulting in sources. A significant fraction of these ERGs will also be expected to reside in low-mass galaxies. Therefore, the combination of wide area (either shallow or deep) radio and deep optical imaging and spectroscopic surveys will give us a statistically large number of massive BH candidates in the coming years.
Massive BH searches have been conducted with multi-wavelength data; optical spectroscopy using broad H emission (Greene & Ho, 2004, 2007; Xiao et al., 2011) or narrow emission line ratios (e.g., Barth et al., 2008; Reines et al., 2013), mid-IR () colors in WISE (Satyapal et al., 2014; Sartori et al., 2015; Secrest et al., 2015; Kaviraj et al., 2019), X-ray observations (e.g., Schramm et al., 2013; Baldassare et al., 2015; Mezcua et al., 2016; Chen et al., 2017; Kawamuro et al., 2019), as well as through studies of the AGN flux variability based on the properties that lower luminosity AGN have stronger variability amplitude (Morokuma et al., 2016; Baldassare et al., 2018, 2019; Elmer et al., 2020; Kimura et al., 2020). On the other hand, radio surveys have rarely been used for searching massive BHs in low-mass galaxies.
Recently, Reines et al. (2020) employed the radio-survey approach to search for massive BHs by using VLA/FIRST and conducting VLA high spatial resolution follow-up observations of local dwarf galaxies at , and found more than 10 candidates. One remarkable result was that most radio cores were not located at the center of the host, but off-nucleus, a possible signature of a previous merger. If the detection of an off-nucleus core is indeed the consequence of a galaxy merger, it indicates that the orbital decay of a black hole through dynamical friction is inefficient in this BH mass range, resulting in a population of BHs that fail to reach the galactic center within a Hubble time, since major mergers in dwarf galaxies becomes rare at (Fitts et al., 2018). Currently there are many theoretical implication regarding wandering BHs (Comerford & Greene, 2014; Blecha et al., 2016; Tremmel et al., 2018; De Rosa et al., 2020; Guo et al., 2020; Ricarte et al., 2021b, a). High spatial resolution radio imaging can pin down the locations of such wandering BHs, and large-scale statistical studies may provide insights into the frequency and environment of wandering BHs through the combination of LSST and VLA/FIRST or the ongoing VLASS (Lacy et al., 2020), which will achieve a sensitivity down to mJy at 2–4 GHz, giving an order of magnitude deeper radio observations than VLA/FIRST.
4.6 Do Blazars Contaminate ERGs?
It could be argued that blazars might contaminate the sample of ERGs, and that therefore the optical emission is dominated by the jet component. Based on the known blazar sequence in the radio and optical bands (Fossati et al., 1998; Donato et al., 2001; Inoue & Totani, 2009; Ghisellini et al., 2017), the observed radio-loudness of blazars is in the range of . This range is obtained by using the luminosity range of erg s-1 and shifting redshift to the range of –. Therefore, blazars cannot reproduce extreme radio-loudness reaching . Blazar contamination is unlikely also from the point of the observed optical magnitude. Considering that all ERGs are VLA/FIRST selected with a flux limit of mJy, the expected observed magnitude of blazars based on the blazar sequence is high with a peak around , and all cases are at even when changing the luminosity range of the blazar SEDs and also shifting the redshift range to –. Based on these arguments, the contamination of blazars to ERGs is unlikely.
5 Conclusion
The long-missing optical counterparts of radio-bright ( mJy at 1.4 GHz) VLA/FIRST population have been constructed by Yamashita et al. (2018) by utilizing the wide ( deg2) and deep () Subaru/HSC SSP survey (named WERGS). The WERGS catalog contains a unique radio galaxy population with , or extremely radio-loud galaxies (ERGs). The number density of ERGs indicates that they are a very rare population ( source deg-2), and therefore it is not surprising that ERGs were missed in previous optical counterpart surveys of the radio sources. Combining multi-wavelength data in optical, IR, and radio bands (Toba et al., 2019), we have compiled a sample of 39 ERGs and 987 NRGs with radio-loudness is .
We have investigated the properties of these unique ERGs and found the following key results:
-
1.
Although the estimated SFRs are sensitive to assumed SFHs, and they might have large uncertainties with dex, all ERGs are likely in the star-forming or starburst phase reaching specific star-formation rate of yr-1, suggesting that ERGs might be in a rapid stellar-mass assembly phase with mass doubling times of Myr. Besides, their stellar mass is relatively small, including the low-mass galaxies with .
-
2.
IR detected ERGs are in a rapid BH accretion phase with high specific black hole accretion rate (sBHAR) with the expected Eddington ratio , and some ERGs may be experiencing a super-Eddington phase.
-
3.
Sources with higher tend to have both higher sBHAR (and thus higher ) and higher intrinsic radio-loudness . This paints a different picture of radio galaxies compared to conventionally known local radio galaxies with low . ERGs represent a population of unique radio galaxies characterized by both high and high radio power.
-
4.
The jet efficiencies of ERGs are typically , which is similar to local radio AGN residing in massive galaxies, whereas it is an order of magnitude higher than the values estimated for SDSS radio-loud quasars. This indicates that, although the accretion disk is reaching super-Eddington accretion, it is in a radiatively inefficient phase (possibly in a slim disk configuration) due to rapid mass accretion onto the central BH.
Appendix A How Much Do Wrong Photo- Affect Our Results?
Our results on ERGs rely on photo- estimates, which affect physical values calculated using luminosity distance, e.g., stellar-mass and luminosities. Unfortunately, because most of our sources are optically faint, there are no spec- confirmed ERGs in our sample. A concern is how erroneous photo- estimates may affect our results.
If our photo- values are severely under-estimated, it is clear that the absolute physical values such as stellar-mass, with the dependence of luminosity distance of , have been underestimated, and therefore the results on low-mass BH mass and low-mass galaxy arguments discussed in Section 4.4 are no longer valid. One situation this might happen is that our photo- estimation at – is not tracing the Balmer break at Å, but actually the Lyman break at – (e.g., Tanaka et al., 2018).
On the other hand, physical quantities obtained from the ratios of two physical quantities have weaker redshift dependences. For both and sBHAR, the luminosity distance dependence is canceled out. The remaining -dependent factor is the -correction between the observed flux and the rest frame flux. The physical quantities , (and therefore ), and , can be mainly traced by one-band flux (densities) of FIRST 1.5 GHz tracing radio Synchrotron emission (), WISE MIR band(s) tracing the peak of AGN dust emission (), and -band tracing stellar emission (). Therefore, each physical quantity can be written as and sBHAR. We checked and confirmed the proportionality of these ratios in our sample.
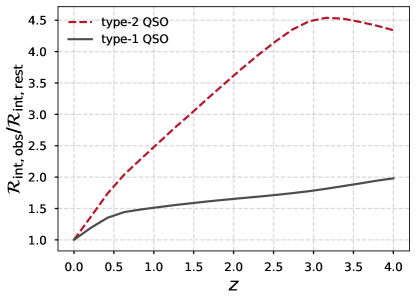
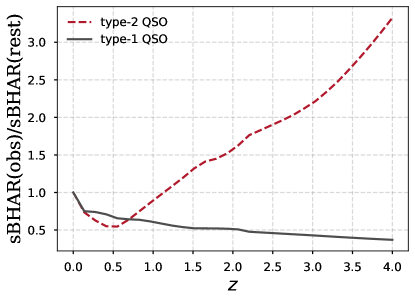
We then investigated the -correction by seeeing how much these observed values change as a function of redshift. In the radio-band, we assumed the same power-law with . In the optical and IR band, we used the quasar SED templates obtained by Hickox et al. (2017), which contain two templates of type-1 and type-2 quasars, whose optical band is dominated by accretion disk and stellar-component, respectively. Since the SED extends only down to 2000 Å, we extrapolated the SED with for type-1 QSOs and for type-2 QSOs in order to smoothly connect the SED template (eg., see also Richards et al., 2006; Polletta et al., 2007, for other SED templates). Given their high radio-loudness and as we discussed in Section 3, the SED of ERGs is likely similar to type-2 QSOs, whose optical emission is dominated by the stellar-component.
Figure 9 shows the -correction of each physical value as a function of redshift. The -correction changes by a factor of up to 4.5 for and factor of for sBHAR even when the targets are shifted at . This suggests that an erroneous photo- does not strongly affect our overall results for and sBHAR.
Appendix B Redshift dependence of our results


The physical properties between ERGs and NRGs are explored in Section 3 and discussed in Section 4. As shown in Figure 2, NRGs distribute smoothly in a wide redshift range at , while ERGs are slightly clustered at . Thus, one might wonder whether the difference in physical parameters between ERGs and NRGs is caused by the redshift difference. We here split the sample into the three redshift bins (–, –, and –) for mitigating such redshift dependence and then compare the key parameters of the two populations.
The top panels show the relations between SFR and , which are similar to ones with Figure 3. Most of the NRGs reside below the MS in the , then the fraction of sources on and above the MS increases as a function of redshift. On the other hand, ERGs always locate the lower range in each redshift bin and most of them are above the MS (except several sources on and below the MS). Considering that the stellar-mass is estimated from the photometries mainly in the optical or near-IR bands, the deeper Subaru/HSC photometreis enable us to find this smaller stellar-mass population as shown in Figure 4.
The middle panels show the relations between sBHAR and , which are the redshift-divided version of Figure 5. At , most of the NRGs are located at low sBHAR and high cluster region where and , and then they move to higher sBHAR sequence with redshift. On the other hand, ERGs always locate at the top edge of the sequence, keeping high sBHAR values and sometimes reaching the sBHAR equivalent to .
Finally, the bottom panels show the relation between and sBHAR, which are the redshift-divided ones of Figure 7. Most of the NRGs are located at the top left region at , and then the population moves to higher sBHAR and smaller sequence, moving to bottom-center or bottom-right of the panel. This is a consistent view of local radio galaxies at lower- and radio quasar population at higher- as discussed in Section 4.2. On the other hand, ERGs reside in the top right part of the plane, and does not show a redshift evolution, because of its extreme selection cut of , limiting the sample only in the top right area of the panel.
References
- Abramowicz et al. (1988) Abramowicz, M. A., Czerny, B., Lasota, J. P., & Szuszkiewicz, E. 1988, ApJ, 332, 646
- Aihara et al. (2018a) Aihara, H., Armstrong, R., Bickerton, S., et al. 2018a, PASJ, 70, S8
- Aihara et al. (2018b) Aihara, H., Arimoto, N., Armstrong, R., et al. 2018b, PASJ, 70, S4
- Aird et al. (2019) Aird, J., Coil, A. L., & Georgakakis, A. 2019, MNRAS, 484, 4360
- Aird et al. (2012) Aird, J., Coil, A. L., Moustakas, J., et al. 2012, ApJ, 746, 90
- Alam et al. (2015) Alam, S., Albareti, F. D., Allende Prieto, C., et al. 2015, ApJS, 219, 12
- Asmus et al. (2015) Asmus, D., Gandhi, P., Hönig, S. F., Smette, A., & Duschl, W. J. 2015, MNRAS, 454, 766
- Astropy Collaboration et al. (2013) Astropy Collaboration, Robitaille, T. P., Tollerud, E. J., et al. 2013, A&A, 558, A33
- Bañados et al. (2018) Bañados, E., Venemans, B. P., Mazzucchelli, C., et al. 2018, Nature, 553, 473
- Baldassare et al. (2018) Baldassare, V. F., Geha, M., & Greene, J. 2018, ApJ, 868, 152
- Baldassare et al. (2019) —. 2019, arXiv e-prints, arXiv:1910.06342
- Baldassare et al. (2015) Baldassare, V. F., Reines, A. E., Gallo, E., & Greene, J. E. 2015, ApJ, 809, L14
- Barth et al. (2008) Barth, A. J., Greene, J. E., & Ho, L. C. 2008, AJ, 136, 1179
- Becker et al. (1995) Becker, R. H., White, R. L., & Helfand, D. J. 1995, ApJ, 450, 559
- Best & Heckman (2012) Best, P. N., & Heckman, T. M. 2012, MNRAS, 421, 1569
- Best et al. (2005) Best, P. N., Kauffmann, G., Heckman, T. M., & Ivezić, Ž. 2005, MNRAS, 362, 9
- Bîrzan et al. (2008) Bîrzan, L., McNamara, B. R., Nulsen, P. E. J., Carilli, C. L., & Wise, M. W. 2008, ApJ, 686, 859
- Blandford et al. (2019) Blandford, R., Meier, D., & Readhead, A. 2019, ARA&A, 57, 467
- Blandford & Znajek (1977) Blandford, R. D., & Znajek, R. L. 1977, MNRAS, 179, 433
- Blecha et al. (2016) Blecha, L., Sijacki, D., Kelley, L. Z., et al. 2016, MNRAS, 456, 961
- Boquien et al. (2019) Boquien, M., Burgarella, D., Roehlly, Y., et al. 2019, A&A, 622, A103
- Bosch et al. (2018) Bosch, J., Armstrong, R., Bickerton, S., et al. 2018, PASJ, 70, S5
- Bower et al. (2017) Bower, R. G., Schaye, J., Frenk, C. S., et al. 2017, MNRAS, 465, 32
- Brinchmann et al. (2004) Brinchmann, J., Charlot, S., White, S. D. M., et al. 2004, MNRAS, 351, 1151
- Cavagnolo et al. (2010) Cavagnolo, K. W., McNamara, B. R., Nulsen, P. E. J., et al. 2010, ApJ, 720, 1066
- Chen et al. (2017) Chen, C. T. J., Brandt, W. N., Reines, A. E., et al. 2017, ApJ, 837, 48
- Ciesla et al. (2017) Ciesla, L., Elbaz, D., & Fensch, J. 2017, A&A, 608, A41
- Comerford & Greene (2014) Comerford, J. M., & Greene, J. E. 2014, ApJ, 789, 112
- Condon (1992) Condon, J. J. 1992, ARA&A, 30, 575
- Condon et al. (2013) Condon, J. J., Kellermann, K. I., Kimball, A. E., Ivezić, Ž., & Perley, R. A. 2013, ApJ, 768, 37
- Costa et al. (2018) Costa, T., Rosdahl, J., Sijacki, D., & Haehnelt, M. G. 2018, MNRAS, 479, 2079
- De Rosa et al. (2020) De Rosa, A., Vignali, C., Bogdanović, T., et al. 2020, arXiv e-prints, arXiv:2001.06293
- Decarli et al. (2018) Decarli, R., Walter, F., Venemans, B. P., et al. 2018, ApJ, 854, 97
- Del Moro et al. (2013) Del Moro, A., Alexander, D. M., Mullaney, J. R., et al. 2013, A&A, 549, A59
- Delvecchio et al. (2014) Delvecchio, I., Gruppioni, C., Pozzi, F., et al. 2014, MNRAS, 439, 2736
- Delvecchio et al. (2018) Delvecchio, I., Smolčić, V., Zamorani, G., et al. 2018, MNRAS, 481, 4971
- Dickey et al. (2019) Dickey, C., Geha, M., Wetzel, A., & El-Badry, K. 2019, arXiv e-prints, arXiv:1902.01401
- Ding et al. (2020) Ding, X., Silverman, J., Treu, T., et al. 2020, ApJ, 888, 37
- Donato et al. (2001) Donato, D., Ghisellini, G., Tagliaferri, G., & Fossati, G. 2001, A&A, 375, 739
- Drinkwater et al. (2010) Drinkwater, M. J., Jurek, R. J., Blake, C., et al. 2010, MNRAS, 401, 1429
- Driver et al. (2011) Driver, S. P., Hill, D. T., Kelvin, L. S., et al. 2011, MNRAS, 413, 971
- Elbaz et al. (2011) Elbaz, D., Dickinson, M., Hwang, H. S., et al. 2011, A&A, 533, A119
- Elmer et al. (2020) Elmer, E., Almaini, O., Merrifield, M., et al. 2020, MNRAS, arXiv:2002.02468
- Ferrarese & Merritt (2000) Ferrarese, L., & Merritt, D. 2000, ApJ, 539, L9
- Fitts et al. (2018) Fitts, A., Boylan-Kolchin, M., Bullock, J. S., et al. 2018, MNRAS, 479, 319
- Fossati et al. (1998) Fossati, G., Maraschi, L., Celotti, A., Comastri, A., & Ghisellini, G. 1998, MNRAS, 299, 433
- Furusawa et al. (2018) Furusawa, H., Koike, M., Takata, T., et al. 2018, PASJ, 70, S3
- Gaibler et al. (2012) Gaibler, V., Khochfar, S., Krause, M., & Silk, J. 2012, Mon. Not. R. Astron. Soc., 425, 438
- Gandhi et al. (2009) Gandhi, P., Horst, H., Smette, A., et al. 2009, A&A, 502, 457
- Gebhardt et al. (2000) Gebhardt, K., Bender, R., Bower, G., et al. 2000, ApJ, 539, L13
- Ghisellini et al. (2017) Ghisellini, G., Righi, C., Costamante, L., & Tavecchio, F. 2017, MNRAS, 469, 255
- Greene & Ho (2004) Greene, J. E., & Ho, L. C. 2004, ApJ, 610, 722
- Greene & Ho (2007) —. 2007, ApJ, 667, 131
- Greene et al. (2019) Greene, J. E., Strader, J., & Ho, L. C. 2019, arXiv e-prints, arXiv:1911.09678
- Guo et al. (2020) Guo, M., Inayoshi, K., Michiyama, T., & Ho, L. C. 2020, ApJ, 901, 39
- Habouzit et al. (2017) Habouzit, M., Volonteri, M., & Dubois, Y. 2017, MNRAS, 468, 3935
- Haiman et al. (2019) Haiman, Z., Brandt, W. N., Vikhlinin, A., et al. 2019, BAAS, 51, 557
- Häring & Rix (2004) Häring, N., & Rix, H.-W. 2004, ApJ, 604, L89
- Helfand et al. (2015) Helfand, D. J., White, R. L., & Becker, R. H. 2015, ApJ, 801, 26
- Helou et al. (1985) Helou, G., Soifer, B. T., & Rowan-Robinson, M. 1985, ApJ, 298, L7
- Hickox et al. (2017) Hickox, R. C., Myers, A. D., Greene, J. E., et al. 2017, ApJ, 849, 53
- Hickox et al. (2009) Hickox, R. C., Jones, C., Forman, W. R., et al. 2009, ApJ, 696, 891
- Ho (2002) Ho, L. C. 2002, ApJ, 564, 120
- Ho (2008) —. 2008, ARA&A, 46, 475
- Holt et al. (2008) Holt, J., Tadhunter, C. N., & Morganti, R. 2008, Mon. Not. R. Astron. Soc., 387, 639
- Huang et al. (2018) Huang, S., Leauthaud, A., Murata, R., et al. 2018, PASJ, 70, S6
- Hunter (2007) Hunter, J. D. 2007, Computing In Science & Engineering, 9, 90
- Ichikawa & Inayoshi (2017) Ichikawa, K., & Inayoshi, K. 2017, ApJ, 840, L9
- Ichikawa et al. (2017) Ichikawa, K., Ricci, C., Ueda, Y., et al. 2017, ApJ, 835, 74
- Ichikawa et al. (2012) Ichikawa, K., Ueda, Y., Terashima, Y., et al. 2012, ApJ, 754, 45
- Ichikawa et al. (2019) Ichikawa, K., Ricci, C., Ueda, Y., et al. 2019, ApJ, 870, 31
- Inayoshi & Haiman (2016) Inayoshi, K., & Haiman, Z. 2016, ApJ, 828, 110
- Inayoshi et al. (2016) Inayoshi, K., Haiman, Z., & Ostriker, J. P. 2016, MNRAS, 459, 3738
- Inayoshi et al. (2018) Inayoshi, K., Ichikawa, K., & Haiman, Z. 2018, ApJ, 863, L36
- Inayoshi et al. (2019) Inayoshi, K., Visbal, E., & Haiman, Z. 2019, arXiv e-prints, arXiv:1911.05791
- Inoue et al. (2017) Inoue, Y., Doi, A., Tanaka, Y. T., Sikora, M., & Madejski, G. M. 2017, ApJ, 840, 46
- Inoue & Totani (2009) Inoue, Y., & Totani, T. 2009, ApJ, 702, 523
- Intema et al. (2017) Intema, H. T., Jagannathan, P., Mooley, K. P., & Frail, D. A. 2017, A&A, 598, A78
- Ivezić et al. (2002) Ivezić, Ž., Menou, K., Knapp, G. R., et al. 2002, AJ, 124, 2364
- Ivezić et al. (2019) Ivezić, Ž., Kahn, S. M., Tyson, J. A., et al. 2019, ApJ, 873, 111
- Ivison et al. (2010) Ivison, R. J., Magnelli, B., Ibar, E., et al. 2010, A&A, 518, L31
- Kaviraj et al. (2019) Kaviraj, S., Martin, G., & Silk, J. 2019, MNRAS, 489, L12
- Kawamuro et al. (2019) Kawamuro, T., Ueda, Y., Ichikawa, K., et al. 2019, ApJ, 881, 48
- Kawanomoto et al. (2018) Kawanomoto, S., Uraguchi, F., Komiyama, Y., et al. 2018, PASJ, 70, 66
- Kimball et al. (2011) Kimball, A. E., Kellermann, K. I., Condon, J. J., Ivezić, Ž., & Perley, R. A. 2011, ApJ, 739, L29
- Kimura et al. (2020) Kimura, Y., Yamada, T., Kokubo, M., et al. 2020, arXiv e-prints, arXiv:2004.08835
- Komiyama et al. (2018) Komiyama, Y., Obuchi, Y., Nakaya, H., et al. 2018, PASJ, 70, S2
- Kormendy & Ho (2013) Kormendy, J., & Ho, L. C. 2013, ARA&A, 51, 511
- Lacy et al. (2020) Lacy, M., Baum, S. A., Chandler, C. J., et al. 2020, PASP, 132, 035001
- Läsker et al. (2016) Läsker, R., Greene, J. E., Seth, A., et al. 2016, ApJ, 825, 3
- Liske et al. (2015) Liske, J., Baldry, I. K., Driver, S. P., et al. 2015, MNRAS, 452, 2087
- Magorrian et al. (1998) Magorrian, J., Tremaine, S., Richstone, D., et al. 1998, AJ, 115, 2285
- Maiolino et al. (2017) Maiolino, R., Russell, H. R., Fabian, A. C., et al. 2017, Nature, 544, 202
- Marconi & Hunt (2003) Marconi, A., & Hunt, L. K. 2003, ApJ, 589, L21
- McConnell & Ma (2013) McConnell, N. J., & Ma, C.-P. 2013, ApJ, 764, 184
- McKinney et al. (2014) McKinney, J. C., Tchekhovskoy, A., Sadowski, A., & Narayan, R. 2014, MNRAS, 441, 3177
- McKinney (2010) McKinney, W. 2010, in Proceedings of the 9th Python in Science Conference, ed. S. van der Walt & J. Millman, 51 – 56
- McLure & Dunlop (2004) McLure, R. J., & Dunlop, J. S. 2004, MNRAS, 352, 1390
- McNamara & Nulsen (2007) McNamara, B. R., & Nulsen, P. E. J. 2007, ARA&A, 45, 117
- McQuinn et al. (2010) McQuinn, K. B. W., Skillman, E. D., Cannon, J. M., et al. 2010, ApJ, 724, 49
- Merloni & Heinz (2007) Merloni, A., & Heinz, S. 2007, MNRAS, 381, 589
- Merloni et al. (2010) Merloni, A., Bongiorno, A., Bolzonella, M., et al. 2010, ApJ, 708, 137
- Mezcua et al. (2016) Mezcua, M., Civano, F., Fabbiano, G., Miyaji, T., & Marchesi, S. 2016, ApJ, 817, 20
- Mezcua et al. (2019) Mezcua, M., Suh, H., & Civano, F. 2019, MNRAS, 488, 685
- Miyazaki et al. (2018) Miyazaki, S., Komiyama, Y., Kawanomoto, S., et al. 2018, PASJ, 70, S1
- Morganti et al. (2005) Morganti, R., Tadhunter, C. N., & Oosterloo, T. a. 2005, Astron. Astrophys., 444, L9
- Morokuma et al. (2016) Morokuma, T., Tominaga, N., Tanaka, M., et al. 2016, PASJ, 68, 40
- Mortlock et al. (2011) Mortlock, D. J., Warren, S. J., Venemans, B. P., et al. 2011, Nature, 474, 616
- Mukherjee et al. (2018) Mukherjee, D., Bicknell, G. V., Wagner, A. Y., Sutherland, R. S., & Silk, J. 2018, Mon. Not. R. Astron. Soc., 479, 5544
- Mullaney et al. (2012) Mullaney, J. R., Daddi, E., Béthermin, M., et al. 2012, ApJ, 753, L30
- Nemmen & Tchekhovskoy (2015) Nemmen, R. S., & Tchekhovskoy, A. 2015, MNRAS, 449, 316
- Nesvadba et al. (2017) Nesvadba, N. P. H., De Breuck, C., Lehnert, M. D., Best, P. N., & Collet, C. 2017, Astron. Astrophys. Suppl. Ser., 599, A123
- Noeske et al. (2007) Noeske, K. G., Weiner, B. J., Faber, S. M., et al. 2007, ApJ, 660, L43
- Nyland et al. (2017) Nyland, K., Davis, T. A., Nguyen, D. D., et al. 2017, ApJ, 845, 50
- Ohsuga et al. (2009) Ohsuga, K., Mineshige, S., Mori, M., & Kato, Y. 2009, PASJ, 61, L7
- Ohsuga et al. (2005) Ohsuga, K., Mori, M., Nakamoto, T., & Mineshige, S. 2005, ApJ, 628, 368
- Onoue et al. (2019) Onoue, M., Kashikawa, N., Matsuoka, Y., et al. 2019, ApJ, 880, 77
- O’Sullivan et al. (2011) O’Sullivan, E., Giacintucci, S., David, L. P., et al. 2011, ApJ, 735, 11
- Padovani (2016) Padovani, P. 2016, A&A Rev., 24, 13
- Panessa et al. (2007) Panessa, F., Barcons, X., Bassani, L., et al. 2007, A&A, 467, 519
- Pearson et al. (2018) Pearson, W. J., Wang, L., Hurley, P. D., et al. 2018, A&A, 615, A146
- Penny et al. (2018) Penny, S. J., Masters, K. L., Smethurst, R., et al. 2018, MNRAS, 476, 979
- Polletta et al. (2007) Polletta, M., Tajer, M., Maraschi, L., et al. 2007, ApJ, 663, 81
- Rafferty et al. (2006) Rafferty, D. A., McNamara, B. R., Nulsen, P. E. J., & Wise, M. W. 2006, ApJ, 652, 216
- Reines et al. (2020) Reines, A. E., Condon, J. J., Darling, J., & Greene, J. E. 2020, ApJ, 888, 36
- Reines et al. (2013) Reines, A. E., Greene, J. E., & Geha, M. 2013, ApJ, 775, 116
- Reines & Volonteri (2015) Reines, A. E., & Volonteri, M. 2015, ApJ, 813, 82
- Ricarte et al. (2021a) Ricarte, A., Tremmel, M., Natarajan, P., & Quinn, T. 2021a, arXiv e-prints, arXiv:2107.02132
- Ricarte et al. (2021b) Ricarte, A., Tremmel, M., Natarajan, P., Zimmer, C., & Quinn, T. 2021b, MNRAS, 503, 6098
- Richards et al. (2006) Richards, G. T., Lacy, M., Storrie-Lombardi, L. J., et al. 2006, ApJS, 166, 470
- Sadowski & Narayan (2015) Sadowski, A., & Narayan, R. 2015, MNRAS, 453, 3213
- Sadowski et al. (2014) Sadowski, A., Narayan, R., McKinney, J. C., & Tchekhovskoy, A. 2014, MNRAS, 439, 503
- Sani et al. (2011) Sani, E., Marconi, A., Hunt, L. K., & Risaliti, G. 2011, MNRAS, 413, 1479
- Sartori et al. (2015) Sartori, L. F., Schawinski, K., Treister, E., et al. 2015, MNRAS, 454, 3722
- Satyapal et al. (2014) Satyapal, S., Secrest, N. J., McAlpine, W., et al. 2014, ApJ, 784, 113
- Schinnerer et al. (2007) Schinnerer, E., Smolčić, V., Carilli, C. L., et al. 2007, ApJS, 172, 46
- Schramm et al. (2013) Schramm, M., Silverman, J. D., Greene, J. E., et al. 2013, ApJ, 773, 150
- Schreiber et al. (2015a) Schreiber, C., Pannella, M., Elbaz, D., et al. 2015a, A&A, 575, A74
- Schreiber et al. (2015b) —. 2015b, A&A, 575, A74
- Secrest et al. (2015) Secrest, N. J., Satyapal, S., Gliozzi, M., et al. 2015, ApJ, 798, 38
- Seymour et al. (2007) Seymour, N., Stern, D., De Breuck, C., et al. 2007, ApJS, 171, 353
- Shabala & Godfrey (2013) Shabala, S. S., & Godfrey, L. E. H. 2013, ApJ, 769, 129
- Sikora et al. (2013) Sikora, M., Stasińska, G., Kozieł-Wierzbowska, D., Madejski, G. M., & Asari, N. V. 2013, ApJ, 765, 62
- Sikora et al. (2007) Sikora, M., Stawarz, Ł., & Lasota, J.-P. 2007, ApJ, 658, 815
- Silk (2017) Silk, J. 2017, ApJ, 839, L13
- Smolčić et al. (2017a) Smolčić, V., Novak, M., Bondi, M., et al. 2017a, A&A, 602, A1
- Smolčić et al. (2017b) Smolčić, V., Delvecchio, I., Zamorani, G., et al. 2017b, A&A, 602, A2
- Soltan (1982) Soltan, A. 1982, MNRAS, 200, 115
- Tadhunter (2016) Tadhunter, C. 2016, A&A Rev., 24, 10
- Takada et al. (2014) Takada, M., Ellis, R. S., Chiba, M., et al. 2014, PASJ, 66, R1
- Takeo et al. (2020) Takeo, E., Inayoshi, K., & Mineshige, S. 2020, arXiv e-prints, arXiv:2002.07187
- Tanaka (2015) Tanaka, M. 2015, ApJ, 801, 20
- Tanaka et al. (2018) Tanaka, M., Coupon, J., Hsieh, B.-C., et al. 2018, PASJ, 70, S9
- Tchekhovskoy et al. (2011) Tchekhovskoy, A., Narayan, R., & McKinney, J. C. 2011, MNRAS, 418, L79
- Terashima & Wilson (2003) Terashima, Y., & Wilson, A. S. 2003, ApJ, 583, 145
- Toba et al. (2019) Toba, Y., Yamashita, T., Nagao, T., et al. 2019, ApJS, 243, 15
- Trakhtenbrot et al. (2015) Trakhtenbrot, B., Urry, C. M., Civano, F., et al. 2015, Science, 349, 168
- Tremaine et al. (2002) Tremaine, S., Gebhardt, K., Bender, R., et al. 2002, ApJ, 574, 740
- Tremmel et al. (2018) Tremmel, M., Governato, F., Volonteri, M., Pontzen, A., & Quinn, T. R. 2018, ApJ, 857, L22
- van Velzen & Falcke (2013) van Velzen, S., & Falcke, H. 2013, A&A, 557, L7
- Wagner & Bicknell (2011) Wagner, A. Y., & Bicknell, G. V. 2011, Astrophys. J., 728, 29
- Wagner et al. (2016) Wagner, A. Y., Bicknell, G. V., Umemura, M., Sutherland, R. S., & Silk, J. 2016, Astron. Nachr., 337, 167
- Wang et al. (2013) Wang, R., Wagg, J., Carilli, C. L., et al. 2013, ApJ, 773, 44
- Wang et al. (2016) Wang, R., Wu, X.-B., Neri, R., et al. 2016, ApJ, 830, 53
- Whitaker et al. (2012) Whitaker, K. E., van Dokkum, P. G., Brammer, G., & Franx, M. 2012, ApJ, 754, L29
- White et al. (1997) White, R. L., Becker, R. H., Helfand, D. J., & Gregg, M. D. 1997, ApJ, 475, 479
- Willott et al. (1999) Willott, C. J., Rawlings, S., Blundell, K. M., & Lacy, M. 1999, MNRAS, 309, 1017
- Woo et al. (2008) Woo, J.-H., Treu, T., Malkan, M. A., & Bland ford, R. D. 2008, ApJ, 681, 925
- Wu et al. (2015) Wu, X.-B., Wang, F., Fan, X., et al. 2015, Nature, 518, 512
- Xiao et al. (2011) Xiao, T., Barth, A. J., Greene, J. E., et al. 2011, ApJ, 739, 28
- Yamashita et al. (2020) Yamashita, T., Nagao, T., & Ikeda, H. 2020, ApJ submitted
- Yamashita et al. (2018) Yamashita, T., Nagao, T., Akiyama, M., et al. 2018, ApJ, 866, 140