Spin-valley relaxation dynamics of Landau-quantized electrons in MoSe2 monolayer
Abstract
Non-equilibrium dynamics of strongly correlated systems constitutes a fascinating problem of condensed matter physics with many open questions. Here we investigate the relaxation dynamics of Landau-quantized electron system into spin-valley polarized ground state in a gate-tunable MoSe2 monolayer subjected to a strong magnetic field. The system is driven out of equilibrium with optically injected excitons that depolarize the electron spins and the subsequent electron spin-valley relaxation is probed in time-resolved experiments. We demonstrate that the relaxation rate at millikelvin temperatures sensitively depends on the Landau level filling factor: it becomes faster whenever the electrons form an integer quantum Hall liquid and slows down appreciably at non-integer fillings. Our findings evidence that valley relaxation dynamics may be used as a tool to investigate the interplay between the effects of disorder and strong interactions in the electronic ground state.
Over the last decade, there has been an explosive growth of research investigating two-dimensional (2D) semiconductors such as transition metal dichalcogenide (TMD) monolayers and their van der Waals heterostructures Mak et al. (2010); Xu et al. (2014). This system features unique optical properties owing to ultralarge exciton binding energy Berkelbach et al. (2013); Chernikov et al. (2014) as well as the existence of valley pseudospin degree of freedom Xiao et al. (2012); Cao et al. (2012); Zeng et al. (2012); Mak et al. (2012) that is locked to the spin by a strong spin-orbit coupling. In parallel, TMD heterostructures offer a fertile ground for investigations of correlated electronic states that arise due to strong Coulomb interactions. This has been recently demonstrated by several breakthrough experiments Tang et al. (2020); Regan et al. (2020); Shimazaki et al. (2020); Wang et al. (2020); Shimazaki et al. (2021) evidencing the formation of Mott-like correlated insulating (CI) states in twisted TMD hetero- and homo-bilayers. Unlike magic-angle twisted bilayer graphene (MATBG) Cao et al. (2018a, b); Lu et al. (2019a), even fractional fillings of the TMD moiré superlattices show a CI behavior, providing a direct evidence for the dominant role played by long-range interactions that break discrete translation symmetry Regan et al. (2020); Xu et al. (2020). Remarkably, even in TMD monolayers the Coulomb interactions between the itinerant electrons at densities not exceeding a few turn out to be strong enough to allow the electrons to spontaneously break continuous translational symmetry and form a Wigner crystal (WC), as recently discovered by Refs Smoleński et al. (2021); Zhou et al. (2021). In parallel, the formation of fractional quantum Hall states in a TMD monolayer has also been evidenced under the influence of a strong magnetic field Shi et al. (2020).
Despite a rapid progress in exploration of strong electronic correlations in MATBG and TMD heterostructures, the prior research focused primarily on the ground-state properties. Many of the interesting open questions in condensed matter physics, however, concern the non-equilibrium dynamics of strongly correlated systems. In the context of TMD systems, a key question that would determine the utility of the valley degree-of-freedom is the relaxation dynamics of an electron or hole system following an inter-valley excitation. For WSe2/WS2 hetero-bilayer, such a hole spin-valley relaxation was shown to slow down upon the formation of a CI state at an integer filling of the moiré superlattice Regan et al. (2020). In case of TMD monolayers, even though the spin-valley relaxation dynamics has been investigated in several prior experiments Yang et al. (2015); Hsu et al. (2015); Yan et al. (2017); McCormick et al. (2017); Song et al. (2016); Dey et al. (2017); Goryca et al. (2019a); Li et al. (2021), the effects of ground-state electronic correlations on this relaxation remained elusive.
Here we study the temporal dynamics of an excited state of Landau-quantized electron system in a charge-tunable MoSe2 monolayer under high external magnetic fields ( T). This state is prepared optically by means of a resonant injection of excitons that interact with itinerant electrons and lead to sizable depolarization of their spins. Our time-resolved pump-probe experiments reveal that the electronic spin relaxation rate exhibits striking, periodic oscillations with the Landau level (LL) filling factor at mK temperatures. The fast relaxation for integer quantum Hall (IQH) states together with its striking slowing down for a WC at Smoleński et al. (2021) suggest that -dependent correlations in the electronic ground state may be responsible for the observed effects.
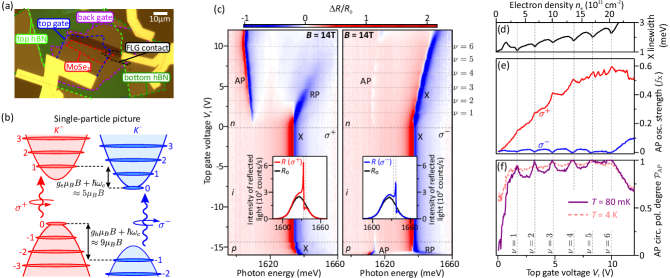
The analyzed device consists of a charge-tunable MoSe2 monolayer that is encapsulated between two hBN layers and two few-layer-graphene flakes serving as top and back gate electrodes (see Fig. 1(a) and Ref. Smoleński et al. (2021) for details). For the experiments, the device was mounted in a dilution refrigerator with a monomode-fiber-based optical access allowing to perform polarization-resolved, magneto-optical experiments at a base temperature of either 80 mK or 4 K Smoleński et al. (2021). In case of the reflectance measurements, the sample was illuminated with a light emitting diode (LED) featuring a center wavelength of 760 nm and 20-nm linewidth. The resonant fluorescence (RF) and photoluminescence excitation (PLE) experiments were in turn performed with the use of a single-frequency, continuous-wave (CW) Ti-sapphire that was spectrally-broadened using an electro-optic phase modulator with a 20 GHz drive (to reduce the coherence length and the related etaloning, while retaining narrow linewidth meV). All of the results presented in the main text were obtained at T (see Supplemental Material (SM) SM for complementary datasets acquired on a different device).
Fig. 1(c) shows a representative top-gate-voltage () evolution of the circular-polarization-resolved reflectance contrast spectra taken at mK. In the charge-neutral regime (at ), the spectra display a single, bare exciton resonance (X) that is split between the two circular polarizations by due to the valley-Zeeman effect with Li et al. (2014); Aivazian et al. (2015); Srivastava et al. (2015). Similarly, the valley degeneracy of both conduction and valence bands is lifted for . In a single-particle approximation [see Fig. 1(b)], the resulting splitting of the lowest electron (hole) LLs is meV ( meV) at T, assuming an effective -factor of () Xu et al. (2014); Aivazian et al. (2015); MacNeill et al. (2015); Koperski et al. (2018). Therefore, the spin-valley splitting exceeds the thermal energy by more than an order of magnitude even at K. Consequently, at low doping densities the itinerant electrons (holes) are expected to be fully spin-polarized and fill the states in () valley for . Under such conditions only the excitons in the opposite () valley can get dressed into attractive (AP) and repulsive (RP) Fermi polarons Sidler et al. (2017); Efimkin and MacDonald (2017), leading to the emergence of a red-shifted AP resonance exclusively in () polarization.
While the above picture remains in perfect agreement with the optical response measured on the hole side (at V), in case of the electron-doping (at V) we clearly observe the AP resonances in both polarizations. Although the -polarized resonance (AP+) is much stronger than its -polarized counterpart (AP-), the latter exhibits pronounced intensity oscillations as the electron density is varied, indicating that spin-valley polarization depends on the LL filling factor . To quantitatively analyze this effect, we fit the lineshapes of both resonances with a transfer-matrix approach (see SM SM for details), which allows us to extract their oscillator strengths being directly proportional to the densities of electrons residing in valleys Sidler et al. (2017); Glazov (2020); Imamoglu et al. (2021). Figs 1(e,f) display gate-voltage dependencies of the determined along with the corresponding polarization degree . The AP intensity oscillations are directly correlated with the LL filling factor, as revealed by their coincidence with Shubnikov-de Haas oscillations of the exciton linewidth [Fig. 1(d)] 111We use the minima of the exciton linewidth, which occur precisely at integer Smoleński et al. (2019), to calibrate the electron density , see SM SM for details.. Specifically, the AP- resonance is stronger around half-integer , and becomes barely discernible for integer (until , beyond which the Fermi energy exceeds the effective valley-Zeeman splitting of the conduction band). These changes coincide with the periodic variations of the slope of the AP+ intensity increase, demonstrating that the electrons become partially spin-valley depolarized each time the highest-energy LL is partially occupied. Such depolarization turns out to be particularly prominent at , where steeply decreases for lower , reaching almost zero in the zero-density limit. Interestingly, this initial drop of the polarization degree becomes suppressed upon rising the temperature to K. This observation is in stark contrast to naive expectation that electronic spin depolarization would be enhanced by thermal fluctuations. At elevated the density-dependent polarization variation also becomes clearly less pronounced [see Fig. 1(f)].
This unusual temperature-dependence suggests that the observed valley depolarization does not occur in the ground state of the electron system. To verify this claim, we repeat the polarization-resolved reflectance contrast measurements at mK for different powers of the white-light excitation. As shown in Figs 2(a,b), the amplitude of -dependent oscillations of and markedly increases for larger powers. Concurrently, the oscillations become indiscernible for powers lower than a few nW, but the initial drop of at low remains pronounced even below 1 nW. Given that all of the utilized excitation powers are significantly lower than the cooling power of our dilution unit (of a few W Haupt et al. (2014)), these observations indicate that the loss of electron spin-valley polarization arises due to exciton-mediated spin-valley-flip of electrons.
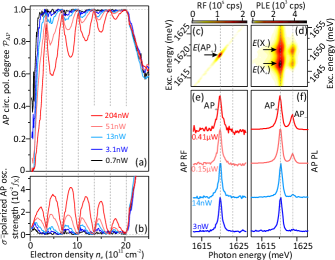
In order to support this conclusion and further exclude any heating-related origin of the investigated effect, we perform RF measurements of the AP resonance using a spectrally-narrow tunable laser. In these experiments the gate voltage is fixed at a value corresponding to . Moreover, the reflected light is collected in cross-linear-polarization with respect to the laser, which enables us to suppress the laser background and to address the AP+ and AP- transitions with equal probabilities. In such a resonant scheme, each of the AP± resonances may be exited only if there are electrons residing in valley in the absence of the excitons. Fig. 2(c) displays an example RF spectrum acquired under such conditions. It features only one, lower-energy AP+ resonance, which evidences complete polarization of the electrons in their ground state. This finding remains valid independently of the utilized laser power [Fig. 2(e)], including the powers for which the electrons are already sizably depolarized under broadband white-light excitation [cf. Fig. 2(a)]. Furthermore, the electronic depolarization is also induced by the resonant laser when its energy is tuned to either of the two Zeeman-split exciton states (X±). This is revealed by Figs 2(d,f) presenting the corresponding AP PL spectra obtained under such excitation conditions, where we observe both AP± peaks with their intensity ratio increasing with the laser power.
The above results unequivocally demonstrate that—otherwise fully spin-polarized—itinerant electrons undergo spin-valley-flips in the presence of optically injected excitons. After each spin-flip event, an electron remains in the valley until it relaxes back to the one, which gives rise to a finite electron spin-depolarization probed in our time-integrated studies. The corresponding depolarization degree is naturally expected to increase for low electron densities (when the electrons with flipped spins constitute a larger fraction of the total ), partially explaining why exhibits a sharp decrease around low . At the same time, the depolarization efficiency is also proportional to both the exciton injection rate (i.e., excitation power) and the valley relaxation time. Since the latter has been previously demonstrated to be longer for the holes (presumably owing to their larger spin-orbit splitting) Dey et al. (2017); Goryca et al. (2019a), one may expect the depolarization in this case to be more efficient than for the electrons. This conjecture remains in stark contrast with our experimental results [cf. Fig. 1(c)], indicating that it is a difference in the exciton-induced carrier spin-flip rates that is a dominant factor responsible for more prominent electron spin depolarization. We speculate that the larger electron spin-flip probability stems from a very small splitting between the bright and dark intra-valley excitons with the opposite electron spin orientation Lu et al. (2019b); Robert et al. (2020): if these states had the same energy, spin-orbit interaction could turn a bright exciton into an intra-valley dark one, and upon spin-preserving valley relaxation of the electron, an inter-valley dark exciton may be formed. Upon subsequent recombination of the hole with a same-valley Fermi-see electron, a net valley-flip excitation would be generated.
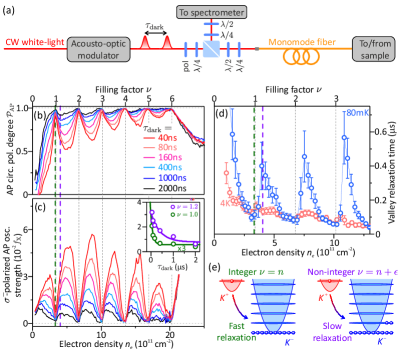
Taking advantage of the opportunity to drive the electrons out of equilibrium, we analyze their spin-valley relaxation dynamics. To this end we perform a time-resolved experiment [Fig. 3(a)], in which we monitor the steady-state reflectance contrast of the sample excited with a train of equidistant, 15-ns-long white-light pulses separated by a dark period , which are produced by an acousto-optic modulator. Figs 3(b,c) present the -evolution of and obtained at mK for a fixed pulse intensity but different . As expected, the -dependent oscillations of both quantities become less prominent for longer . Interestingly, however, for such the profile of evolution between subsequent integer and acquires clearly asymmetric shape: while at short the local maximum of occurs around half-integer , for longer the exhibits a sharp rise followed by a smoother decrease, resulting in a shift of the local maximum towards . This observation implies that the dependence of on is distinct for various [as seen in the inset to Fig. 3(c)], demonstrating that the electron relaxation time must change with .
Fig. 3(d) displays the determined by fitting the exponential decay profiles to measured at different . The extracted exhibits prominent oscillations with : it is the shortest when the highest-energy th LL is completely filled, then steeply increases by a factor of (to about 400–600 ns) when the next th LL starts to be occupied, before it slowly decreases again reaching approximately the initial value when th LL gets almost full [Fig. 3(e)]. These periodic fluctuations of entail larger (smaller) electron steady-state spin polarization around integer (half-integer) , which is the underlying reason for the oscillating electron depolarization degree observed in our 80-mK CW experiments (cf. Figs 1 and 2). Importantly, the -dependent variation of is found to be almost fully suppressed at K for [Fig. 3(d)], where exhibits a decreasing tendency with yielding 50–200 ns in the analyzed range. The values we find for in this regime are in agreement with the electron spin relaxation times determined for various TMD monolayers in some of the previous reports Song et al. (2016); Dey et al. (2017); Goryca et al. (2019a).
Owing to spin-valley locking, phonon-mediated relaxation of the excited states in TMD monolayers is strongly suppressed at low temperatures by energy-momentum conservation. Even though we cannot experimentally rule out the influence of coupling to a phonon reservoir on the spin relaxation dynamics, its marked ground-state dependence hints at a central role played by electronic correlations induced by strong Coulomb interactions. Such correlations are suppressed when the electrons form an IQH state at , but may become pronounced whenever the system gets occupied by excess electrons () or excess holes () Koulakov et al. (1996); Fogler et al. (1996); Fogler (2002). We speculate that this gives rise to substantially longer revealed by our mK-experiments at (presumably with an electron/hole asymmetry being responsible for the absence of an analogous effect at ). This speculation is consistent with a similar slow-down of the relaxation dynamics demonstrated previously for WSe2/WS2 hetero-bilayer hosting a Mott-like CI state Regan et al. (2020). Our conjecture is further supported by recent experiments Smoleński et al. (2021) evidencing the formation of the WC ground state in a monolayer system at T for , which is the -range where the prolongation of is clearly the most prominent. The reported WC melting temperature exceeds 4 K, which may explain why the increase of is observed in this regime not only at mK, but also at K [cf. Fig. 3(d)]. The lack of a similar increase at for K may be a consequence of a more fragile nature of the corresponding correlated states, which might melt for K.
The strong filling-factor dependence of spin-valley relaxation uncovered by our work paves the way towards future explorations of non-equilibrium dynamics of electrons in atomically thin semiconductors. In parallel, large efficiency of light-induced electron spin depolarization mechanism utilized in our experiments indicates that excitons might not constitute a non-destructive probe of the electronic system in TMD monolayers even when the electron density is orders of magnitude larger than that of the excitons.
Acknowledgements.
We thank P. Back and A. Popert for fabricating the investigated devices. This work was supported by the Swiss National Science Foundation (SNSF) under Grant No. 200021-178909/1. K.W. and T.T. acknowledge support from the Elemental Strategy Initiative conducted by the MEXT, Japan (Grant Number JPMXP0112101001) and JSPS KAKENHI (Grant Numbers 19H05790 and JP20H00354).References
- Mak et al. (2010) K. F. Mak, C. Lee, J. Hone, J. Shan, and T. F. Heinz, Phys. Rev. Lett. 105, 136805 (2010).
- Xu et al. (2014) X. Xu, W. Yao, D. Xiao, and T. F. Heinz, Nat. Phys. 10, 343 (2014).
- Berkelbach et al. (2013) T. C. Berkelbach, M. S. Hybertsen, and D. R. Reichman, Phys. Rev. B 88, 045318 (2013).
- Chernikov et al. (2014) A. Chernikov, T. C. Berkelbach, H. M. Hill, A. Rigosi, Y. Li, O. B. Aslan, D. R. Reichman, M. S. Hybertsen, and T. F. Heinz, Phys. Rev. Lett. 113, 076802 (2014).
- Xiao et al. (2012) D. Xiao, G.-B. Liu, W. Feng, X. Xu, and W. Yao, Phys. Rev. Lett. 108, 196802 (2012).
- Cao et al. (2012) T. Cao, G. Wang, W. Han, H. Ye, C. Zhu, J. Shi, Q. Niu, P. Tan, E. Wang, B. Liu, and J. Feng, Nat. Commun. 3, 887 (2012).
- Zeng et al. (2012) H. Zeng, D. Junfeng, W. Yao, D. Xiao, and X. Cui, Nat. Nanotech. 7, 490 (2012).
- Mak et al. (2012) K. Mak, K. He, J. Shan, and T. F. Heinz, Nat. Nanotech. 7, 494 (2012).
- Tang et al. (2020) Y. Tang, L. Li, T. Li, Y. Xu, S. Liu, K. Barmak, K. Watanabe, T. Taniguchi, A. H. MacDonald, J. Shan, and K. F. Mak, Nature 579, 353 (2020).
- Regan et al. (2020) E. C. Regan, D. Wang, C. Jin, M. I. Bakti Utama, B. Gao, X. Wei, S. Zhao, W. Zhao, Z. Zhang, K. Yumigeta, M. Blei, J. D. Carlström, K. Watanabe, T. Taniguchi, S. Tongay, M. Crommie, A. Zettl, and F. Wang, Nature 579, 359 (2020).
- Shimazaki et al. (2020) Y. Shimazaki, I. Schwartz, K. Watanabe, T. Taniguchi, M. Kroner, and A. Imamoglu, Nature 580, 472 (2020).
- Wang et al. (2020) L. Wang, E.-M. Shih, A. Ghiotto, L. Xian, D. A. Rhodes, C. Tan, M. Claassen, D. M. Kennes, Y. Bai, B. Kim, K. Watanabe, T. Taniguchi, X. Zhu, J. Hone, A. Rubio, A. N. Pasupathy, and C. R. Dean, Nat. Mater. 19, 861 (2020).
- Shimazaki et al. (2021) Y. Shimazaki, C. Kuhlenkamp, I. Schwartz, T. Smoleński, K. Watanabe, T. Taniguchi, M. Kroner, R. Schmidt, M. Knap, and A. Imamoğlu, Phys. Rev. X 11, 021027 (2021).
- Cao et al. (2018a) Y. Cao, V. Fatemi, S. Fang, K. Watanabe, T. Taniguchi, E. Kaxiras, and P. Jarillo-Herrero, Nature 556, 43 (2018a).
- Cao et al. (2018b) Y. Cao, V. Fatemi, A. Demir, S. Fang, S. L. Tomarken, J. Y. Luo, J. D. Sanchez-Yamagishi, K. Watanabe, T. Taniguchi, E. Kaxiras, R. C. Ashoori, and P. Jarillo-Herrero, Nature 556, 80 (2018b).
- Lu et al. (2019a) X. Lu, P. Stepanov, W. Yang, M. Xie, M. A. Aamir, I. Das, C. Urgell, K. Watanabe, T. Taniguchi, G. Zhang, A. Bachtold, A. H. MacDonald, and D. K. Efetov, Nature 574, 653 (2019a).
- Xu et al. (2020) Y. Xu, S. Liu, D. A. Rhodes, K. Watanabe, T. Taniguchi, J. Hone, V. Elser, K. F. Mak, and J. Shan, Nature 587, 214 (2020).
- Smoleński et al. (2021) T. Smoleński, P. E. Dolgirev, C. Kuhlenkamp, A. Popert, Y. Shimazaki, P. Back, X. Lu, M. Kroner, K. Watanabe, T. Taniguchi, I. Esterlis, E. Demler, and A. Imamoglu, Nature 595, 53 (2021).
- Zhou et al. (2021) Y. Zhou, J. Sung, E. Brutschea, I. Esterlis, Y. Wang, G. Scuri, R. J. Gelly, H. Heo, T. Taniguchi, K. Watanabe, G. Zarand, M. D. Lukin, P. Kim, E. Demler, and H. Park, Nature 595, 48 (2021).
- Shi et al. (2020) Q. Shi, E.-M. Shih, M. V. Gustafsson, D. A. Rhodes, B. Kim, K. Watanabe, T. Taniguchi, Z. Papić, J. Hone, and C. R. Dean, Nat. Nanotech. 15, 569 (2020).
- Yang et al. (2015) L. Yang, N. A. Sinitsyn, W. Chen, J. Yuan, J. Zhang, J. Lou, and S. A. Crooker, Nat. Phys. 11, 830 (2015).
- Hsu et al. (2015) W.-T. Hsu, Y.-L. Chen, C.-H. Chen, P.-S. Liu, T.-H. Hou, L.-J. Li, and W.-H. Chang, Nat. Commun. 6, 8963 (2015).
- Yan et al. (2017) T. Yan, S. Yang, D. Li, and X. Cui, Phys. Rev. B 95, 241406(R) (2017).
- McCormick et al. (2017) E. J. McCormick, M. J. Newburger, Y. K. Luo, K. M. McCreary, S. Singh, I. B. Martin, E. J. Cichewicz, B. T. Jonker, and R. K. Kawakami, 2D Mater. 5, 011010 (2017).
- Song et al. (2016) X. Song, S. Xie, K. Kang, J. Park, and V. Sih, Nano Lett. 16, 5010 (2016).
- Dey et al. (2017) P. Dey, L. Yang, C. Robert, G. Wang, B. Urbaszek, X. Marie, and S. A. Crooker, Phys. Rev. Lett. 119, 137401 (2017).
- Goryca et al. (2019a) M. Goryca, N. P. Wilson, P. Dey, X. Xu, and S. A. Crooker, Sci. Adv. 5, eaau4899 (2019a).
- Li et al. (2021) J. Li, M. Goryca, K. Yumigeta, H. Li, S. Tongay, and S. A. Crooker, Phys. Rev. Materials 5, 044001 (2021).
- Aivazian et al. (2015) G. Aivazian, Z. Gong, A. M. Jones, R.-L. Chu, J. Yan, D. G. Mandrus, C. Zhang, D. Cobden, W. Yao, and X. Xu, Nat. Phys. 11, 148 (2015).
- MacNeill et al. (2015) D. MacNeill, C. Heikes, K. F. Mak, Z. Anderson, A. Kormányos, V. Zólyomi, J. Park, and D. C. Ralph, Phys. Rev. Lett. 114, 037401 (2015).
- Koperski et al. (2018) M. Koperski, M. R. Molas, A. Arora, K. Nogajewski, M. Bartos, J. Wyzula, D. Vaclavkova, P. Kossacki, and M. Potemski, 2D Mater. 6, 015001 (2018).
- Larentis et al. (2018) S. Larentis, H. C. P. Movva, B. Fallahazad, K. Kim, A. Behroozi, T. Taniguchi, K. Watanabe, S. K. Banerjee, and E. Tutuc, Phys. Rev. B 97, 201407(R) (2018).
- Zhang et al. (2014) Y. Zhang, T.-R. Chang, B. Zhou, Y.-t. Cui, H. Yan, Z. Liu, F. Schmitt, J. Lee, R. Moore, Y. Chen, H. Lin, H.-T. Jeng, S.-K. Mo, Z. Hussain, A. Bansil, and Z.-X. Shen, Nat. Nanotech. 9, 111 (2014).
- Goryca et al. (2019b) M. Goryca, J. Li, A. V. Stier, T. Taniguchi, K. Watanabe, E. Courtade, S. Shree, C. Robert, B. Urbaszek, X. Marie, and S. A. Crooker, Nat. Commun. 10, 4172 (2019b).
- (35) See Supplemental Material at [URL will be inserted by publisher] for further information concerning data analysis, calibration of the electron doping density as well as complementary datasets obtained on a different device.
- Li et al. (2014) Y. Li, J. Ludwig, T. Low, A. Chernikov, X. Cui, G. Arefe, Y. D. Kim, A. M. van der Zande, A. Rigosi, H. M. Hill, S. H. Kim, J. Hone, Z. Li, D. Smirnov, and T. F. Heinz, Phys. Rev. Lett. 113, 266804 (2014).
- Srivastava et al. (2015) A. Srivastava, M. Sidler, A. V. Allain, D. S. Lembke, A. Kis, and A. Imamoglu, Nat. Phys. 11, 141 (2015).
- Sidler et al. (2017) M. Sidler, P. Back, O. Cotlet, A. Srivastava, T. Fink, M. Kroner, E. Demler, and A. Imamoglu, Nat. Phys. 13, 255 (2017).
- Efimkin and MacDonald (2017) D. K. Efimkin and A. H. MacDonald, Phys. Rev. B 95, 035417 (2017).
- Glazov (2020) M. M. Glazov, J. Chem. Phys. 153, 034703 (2020).
- Imamoglu et al. (2021) A. Imamoglu, O. Cotlet, and R. Schmidt, C. R. Phys. 22, 1 (2021).
- Note (1) We use the minima of the exciton linewidth, which occur precisely at integer Smoleński et al. (2019), to calibrate the electron density , see SM SM for details.
- Haupt et al. (2014) F. Haupt, A. Imamoglu, and M. Kroner, Phys. Rev. Applied 2, 024001 (2014).
- Lu et al. (2019b) Z. Lu, D. Rhodes, Z. Li, D. Van Tuan, Y. Jiang, J. Ludwig, Z. Jiang, Z. Lian, S.-F. Shi, J. Hone, H. Dery, and D. Smirnov, 2D Mater. 7, 015017 (2019b).
- Robert et al. (2020) C. Robert, B. Han, P. Kapuscinski, A. Delhomme, C. Faugeras, T. Amand, M. R. Molas, M. Bartos, K. Watanabe, T. Taniguchi, B. Urbaszek, M. Potemski, and X. Marie, Nat. Commun. 11, 4037 (2020).
- Koulakov et al. (1996) A. A. Koulakov, M. M. Fogler, and B. I. Shklovskii, Phys. Rev. Lett. 76, 499 (1996).
- Fogler et al. (1996) M. M. Fogler, A. A. Koulakov, and B. I. Shklovskii, Phys. Rev. B 54, 1853 (1996).
- Fogler (2002) M. M. Fogler, in High Magnetic Fields, Vol. 595 (Springer, Berlin, Heidelberg, 2002) pp. 98–138.
- Smoleński et al. (2019) T. Smoleński, O. Cotlet, A. Popert, P. Back, Y. Shimazaki, P. Knüppel, N. Dietler, T. Taniguchi, K. Watanabe, M. Kroner, and A. Imamoglu, Phys. Rev. Lett. 123, 097403 (2019).