An investigation of radiative proton–capture reactions in the Cd–In mass region
Abstract
The reaction network in the neutron–deficient part of the nuclear chart around contains several nuclei of importance to astrophysical processes, such as the p–process. This work reports on the results from recent experimental studies of the radiative proton-capture reactions \isotope[112,114]Cd\isotope[113,115]In. Experimental cross sections for the reactions have been measured for proton beam energies residing inside the respective Gamow windows for each reaction, using isotopically enriched \isotope[112]Cd and \isotope[114]Cd targets. Two different techniques, the in–beam –ray spectroscopy and the activation method have been employed, with the latter considered necessary to account for the presence of low–lying isomers in \isotope[113]In ( keV, min), and \isotope[115]In ( keV, h). Following the measurement of the total reaction cross sections, the astrophysical S factors have been additionally deduced. The experimental results are compared with Hauser–Feshbach theoretical calculations carried out with the most recent version of TALYS. The results are discussed in terms of their significance to the various parameters entering the models.
keywords:
\isotope[112,114]Cd , cross sections , activation , in-beam -spectroscopy , p-process , Hauser-FeshbachPACS:
26.50.+x , 27.60.+j , 25.40.LwMSC:
0000 , 1111[inst1]organization=National & Kapodistrian University of Athens,addressline=Zografou Campus, city=Athens, postcode=GR-15784, country=Greece
[inst2]organization=Institute of Nuclear and Particle Physics, NCSR ”Demokritos”,city=Aghia Paraskevi, postcode=GR-15310, country=Greece
1 Introduction
The neutron–deficient stable nuclides with mass are bypassed by the s– and r–process nucleosynthetic mechanisms222s stands for slow and r for rapid neutron capture process, respectively.. This mass region, ranging from \isotope[74]Se to \isotope[196]Hg contains about 35 such species of nuclei, commonly referred to as p–nuclei, with the letter p corresponding to their lower neutron–to–proton ratio , relative to other stable isotopes of the same element. The origin of this particular group of nuclei, which is the rarest among the stable species, with solar abundances typically of a factor of times lower compared to the adjacent s and r nuclides [1, 2], has been a long standing puzzle in nuclear astrophysics [3, 4].
It is generally accepted that the more abundant s and r nuclei serve as seeds for the p–process, leading to the production of neutron-deficient nuclei through a network of radiative proton–capture reactions, decays, electron captures (EC), , and photodisintegrations. The p–process mechanism dominated by photodisintegrations is often referred to as process [5].
The p–process is assumed to take place in different zones inside a core collapse supernova, placing the peak temperature for this process in the range – GK [2]. A single-degenerate type-Ia supernova scenario is also suitable for the p–process to occur [6]. Additional contributions to the production of p–nuclei arise from several explosive nucleosynthesis scenarios, such as the rp–process [7, 8], the np–process [9], and the p–process [10].
The p–process spans among roughly 2 000 nuclei, forming a vast reaction network of about 20 000 reactions [1, 2]. Thus, within that framework, the majority of the reaction rates need to be estimated, a task often performed by means of the Hauser–Feshbach statistical model [11].
In the effort to constrain the model parameters, experimental input is invaluable. Among others, cross–section measurements of radiative proton–capture reactions can have an essential contribution towards understanding the – and p–process (and other reaction mechanisms, such as the r or s process [12, 13, 14]), serving to constrain the various model parameters, thus improving predictions for currently unmeasured reactions, while enabling the calculation of various important photodisintegration constants [15]. Radiative proton-capture reactions can offer data to determine reaction rates in areas of the nuclear chart, which may cross the pathways of the s and r processes. As an example, the odd-even \isotope[113]In nucleus, which is studied in the present work, is nowadays widely accepted that it is not a “pure” p nucleus, but has non–negligible contributions from the s and r processes (see discussions in refs. [16, 17]).
Recent works by our group focusing on \isotope[107,109]Ag [18] and \isotope[112]Cd [16, 19, 20] proton–capture reactions have provided experimental input in this mass regime for both ground and isomeric states populated via the in–beam [21] and activation methods [22]. Precise measurements of cross sections in reactions of Ag, Cd and In isotopes, as well as other neighboring nuclei, around mass 100–120, using charged particle or photon probes, are necessary for reducing the experimental uncertainties and constraining the various pathways of p, r and s processes in this area of the nuclear chart [12, 13, 14].
[110]Cd, which is populated in the \isotope[109]Ag\isotope[110]Cd reaction, is considered an important p–nucleus [12], while the role of \isotope[113]In populated in the \isotope[112]Cd\isotope[113]In reaction is important for understanding any potential linking of the r– and s–processes with the reactions rate affecting the p–process in this mass regime [23]. In addition, the slightly heavier \isotope[114]Cd nucleus is involved in the s–process [13] and to the best of our knowledge, no experimental data of proton–capture total cross sections are available at low energies (around 3 MeV) for this nucleus [24].
The present work focuses on radiative proton–capture reactions in the Cd/In region, through measurements of the proton–induced reaction cross sections in \isotope[112,114]Cd isotopes at astrophysically relevant energies; that is, energies lying within the corresponding Gamow windows for the particular reactions ( MeV). Earlier work of our group had focused on the reaction \isotope[112]Cd\isotope[113]In at proton beam energies below the energy threshold [16]. This work extends the cross–section measurements to the energy region above the reaction threshold, while still inside the Gamow window, for the first time, thus enabling the extraction of important information regarding the optical model potentials (OMP), nuclear level densities (NLD) and gamma strength functions (SF) entering the theoretical models.
An additional focus is the study of the radiative proton–capture reaction \isotope[114]Cd\isotope[115]In, including the known isomeric state at 336 keV. For this case, an older set of experimental cross sections is reported in Ref. [25], while in a more recent work [26] the focus has been on the production of the unstable isotope \isotope[115m]In for medical applications. In both cases, the isomeric transition in \isotope[115]In was examined, exclusively. The present results on \isotope[115]In are compared with the overall scarce experimental data existing in the energy range of interest [26, 25]. Furthermore, cross–section measurements in the reaction channel are reported, extending the experimental information to lower energies than those existing in literature [27, 28, 29, 26, 30, 31, 32].
Overall, the experimental cross section results presented in this work can serve as constraints to model parameters entering the theoretical calculations. The predictions of the Hauser–Feshbach statistical model have been deduced using the latest version (v1.95) of TALYS code [33], in a systematic way, exploring the sensitivity on various parameters entering the theoretical calculations. After performing calculations with all possible OMP+NLD+SF model combinations, using the default input parameters in TALYS, “best-fit” choices are presented for comparison with the experimental data.
2 Experimental Details
Measurements for the study of the radiative proton-capture reactions in \isotope[112,114]Cd were carried out at the 5.5 MV T11 Tandem Van de Graaff accelerator of NCSR “Demokritos”, Greece. Both the in-beam [16, 18] and the activation [16, 22] methods were employed to account for the presence of low-lying isomeric states in the populated nuclei \isotope[113,115]In.
2.1 The reactions with proton beams
The reaction \isotope[112]Cd()\isotope[113]In (=6081.2(2) keV) and the \isotope[114]Cd\isotope[115]In (=6810.4(3) keV) [34] were both studied at three proton laboratory energies in total, 3.4, 3.5 and 3.6 MeV, and 3.0, 3.5 and 4.0 MeV, respectively. All energies lie inside the corresponding Gamow windows for the reactions (– MeV, in both cases), calculated for the temperature range – GK [2]. During the experiments the targets were irradiated with proton beam currents ranging from 60–90 enA, which were kept at a steady value throughout each beam energy run, so as to minimize uncertainties resulting from current fluctuations.
2.2 The targets
2.2.1 The \isotope[112]Cd target
A multi-layer target was irradiated during the experiments comprising a front layer of % enriched \isotope[112]Cd evaporated on a \isotope[nat]Bi layer, backed by an \isotope[nat]In layer, and a thick \isotope[nat]Cu layer. The thickness of the \isotope[112]Cd layer had been earlier measured [16] and found equal to mg/cm2. The target was mounted at the center of the scattering chamber and was oriented at a angle with respect to the beam direction, to prevent any masking effects from the aluminum target holder that could have resulted in attenuation of gamma rays recorded in the surrounding high-purity Germanium (HPGe) detectors, particularly, the one positioned at (see also Refs. [16, 18]). The resulted effective thickness of the target due to this rotation, was mg/cm2.
Proton-beam energy losses inside the target were calculated using SRIM2013 [35], and were found to be in the range – keV for the proton-beam energies of 3.4–3.6 MeV, in the laboratory frame, respectively. Assuming that the reactions occur in the middle of the \isotope[112]Cd layer, the effective energy in the lab frame is found as (see also Table 1):
| (1) |
2.2.2 The \isotope[114]Cd target
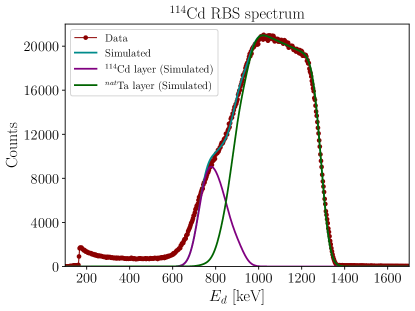
The \isotope[114]Cd target used in the experiments comprised of a thin front layer of 99.7% enriched \isotope[114]Cd evaporated on a \isotope[nat]Ta layer. The use of an enriched target, as in the case of \isotope[112]Cd, was imperative due to the very low cross sections of the reaction.
The \isotope[114]Cd layer thickness was measured via the Rutherford Backscattering technique, resulting in a thickness value of mg/cm2 (see Fig. 1). For the same reasons described in 2.2.1, the target was rotated inside the chamber at with respect to the beam, resulting in an effective thickness of mg/cm2.
Proton beam energy losses were found to be – keV, for beam energies in the range 3.0–4.0 MeV in the laboratory frame.
2.3 Detection apparatus and experimental methods
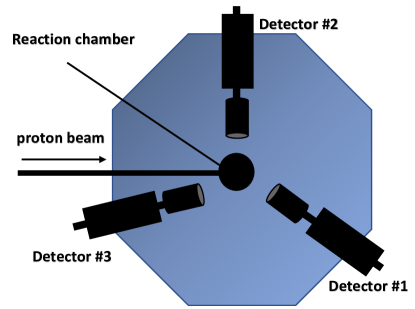
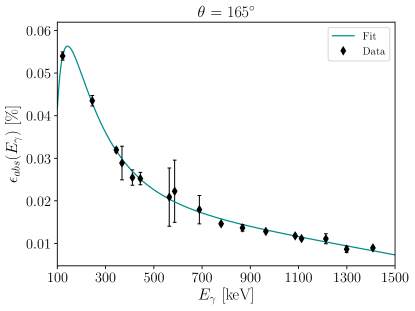
An array of three HPGe detectors were mounted on an octagonal turntable having a maximum radius of 2.4 m (see sketch in Fig. 2). Detectors 1, 2 and 3 were positioned at , and , respectively, with reference to the beam direction. Their distances from the target were 34.5, 27.7 and 33.0 cm, respectively. Energy calibrations and absolute efficiency measurements (Fig. 3) were performed using a standard \isotope[152]Eu point source, placed at the exact target position. The nuclear electronics setup described in Ref. [18] was employed in order to record the 8k–channel spectra in singles mode (i.e. without the use of –particle or – coincidence techniques).
3 Data Analysis and Results
Due to the structural properties of the nuclei \isotope[113,115]In, two different methods were employed for the study of the cross sections of the radiative proton-capture reactions: in-beam -ray spectroscopy to study prompt de–excitations, and the activation technique to study longer–lived isomeric states populated in the reactions.
3.1 The reaction \isotope[112]Cd\isotope[113]In
3.1.1 In-beam measurements
The cross section for the reaction \isotope[112]Cd\isotope[113]Ings can be estimated from the relation [37]:
| (2) |
where is the atomic mass of the target in atomic mass units (a.m.u.), is Avogadro’s constant, is the actual target thickness, as deduced experimentally by independent dedicated measurements (e.g. RBS for the \isotope[114]Cd target), and is the absolute yield of the reaction. The latter can be deduced as:
| (3) |
where is the absolute yield of the transition , averaged over angles , and calculated as:
| (4) |
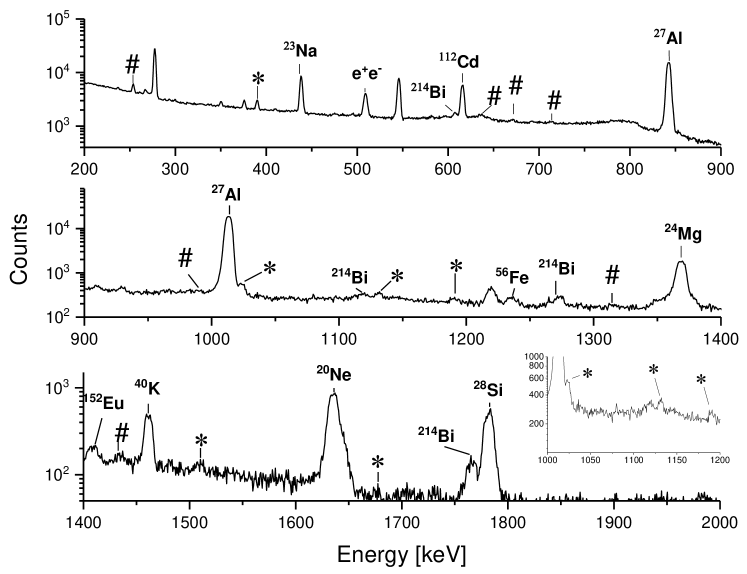
where, at a measuring angle , is the dead-time-corrected intensity of a photopeak of interest, is the absolute efficiency of the detector, and is the number of incident protons on the target. From the level scheme of the residual nucleus \isotope[113]In, the following five transitions feeding the ground state were observed in the in–beam spectra (Fig. 4), having statistics above the background (see Ref. [16] for a partial level scheme and Ref. [34] for the data):
| keV | |
| keV | |
| keV | |
| ( | keV |
| unknown | keV |
3.1.2 Activation measurements
The isomeric transition ( keV) in \isotope[113]In is characterized by a half–life, min [34]. Due to the particular lifetime of this transition, the activation method was employed for the measurement of its absolute yield. It has to be noted that the isomeric transition is associated with a large spin difference () and a parity flip. An additional measurement of the cross section of the isomeric state was performed using the in beam method discussed in 3.1.1.
At each beam energy, the target was irradiated sufficiently long for the process to reach saturation (approximately about 5 half-lives). In our case, the irradiation lasted approximately . The isomeric cross section was evaluated using the standard relation [16, 22],
| (5) |
where is the number of events under the photopeak corresponding to the isomeric transition, the probability of ray emission, the decay constant of the particular transition, the surface number density of target nuclei, the absolute efficiency of the detector, the incident proton flux during irradiation, and , and are the waiting (or cooling) time of the sample, the counting time, and the irradiation time of the sample, respectively. For the case of \isotope[113]In, , s-1 [38, 39].
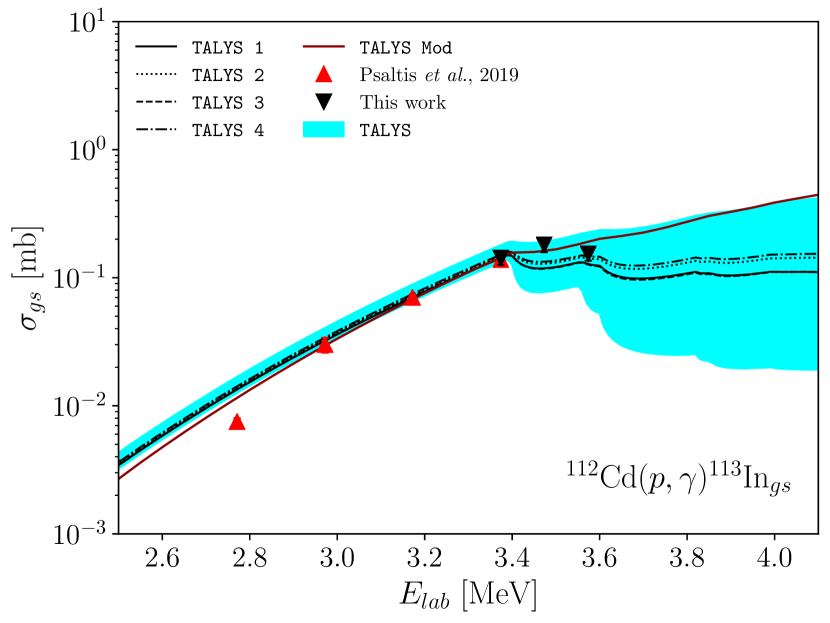
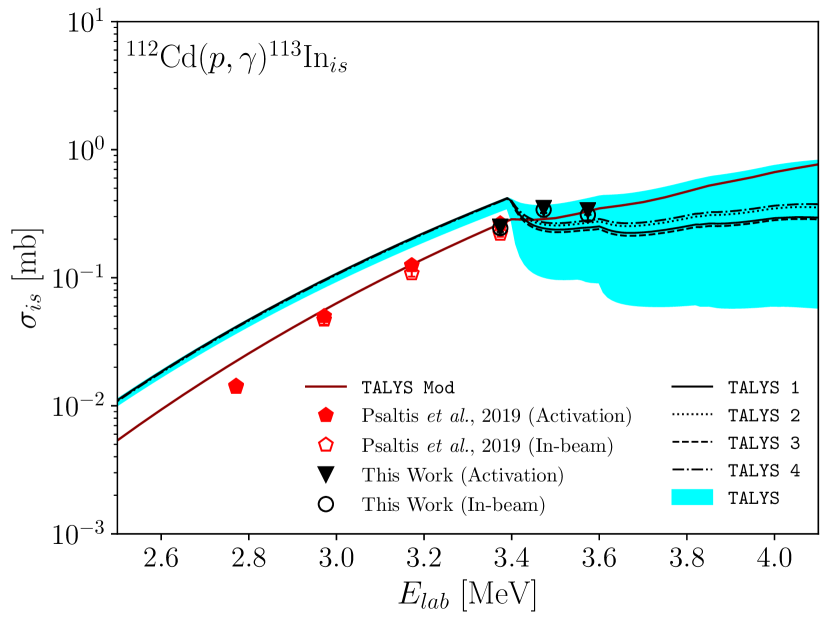
The results for the isomeric cross sections, deduced with the activation method are plotted with black upside–down triangles in Fig. 5(b). Errors were evaluated taking into consideration the uncertainties from photopeak integration, the detector efficiencies, and the charge deposition on the target during the irradiation of the sample. Cross-section results for the isomeric state deduced with the in-beam method, by measuring all transitions populating the isomeric state, are plotted in the same figure (empty circles with black outline). The results for the isomeric cross sections are tabulated in Table 1. The two datasets corresponding to each energy value, along with the percentage absolute deviation of the cross sections, as those have been deduced with the in–beam and activation methods, are listed in Table 8. The maximum value (8%) was recorded for 3.6 MeV, proving the reliability of using both methods in combination. It has to be noted that due to their different nature, the two techniques have different systematical uncertainties.
The main contributions to the cross section uncertainty are common for both techniques, and arise from:
-
1.
The target thickness, with a relative uncertainty of and for \isotope[112]Cd and \isotope[114]Cd, respectively.
-
2.
The detection efficiency, which varies with the energy of the photopeak considered, therefore it is not a fixed value. The maximum relative uncertainty due to the detection efficiency does not exceed in any case.
- 3.
-
4.
For the activation technique, contributions to the cross section also arise from the uncertainties in the irradiation time , counting time , and waiting time . However, we took special care to minimize these contributions, resulting in relative uncertainties .
3.1.3 Total cross sections and astrophysical factors
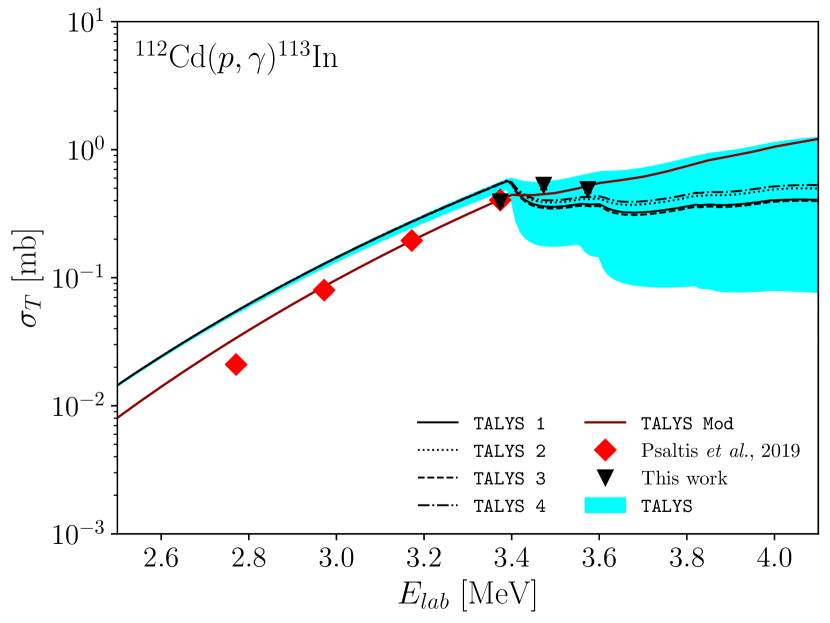
The total cross sections, , of the reaction \isotope[112]Cd\isotope[113]In have been evaluated by adding the cross sections of all transitions feeding the ground state of \isotope[113]In (summing to the in-beam cross-section ), and the cross sections of the isomeric state, , as deduced with the activation technique (described in 3.1.2), thus
| (6) |
The results for the total cross sections for the reaction are tabulated in Table 1 and plotted in Fig. 5(c).
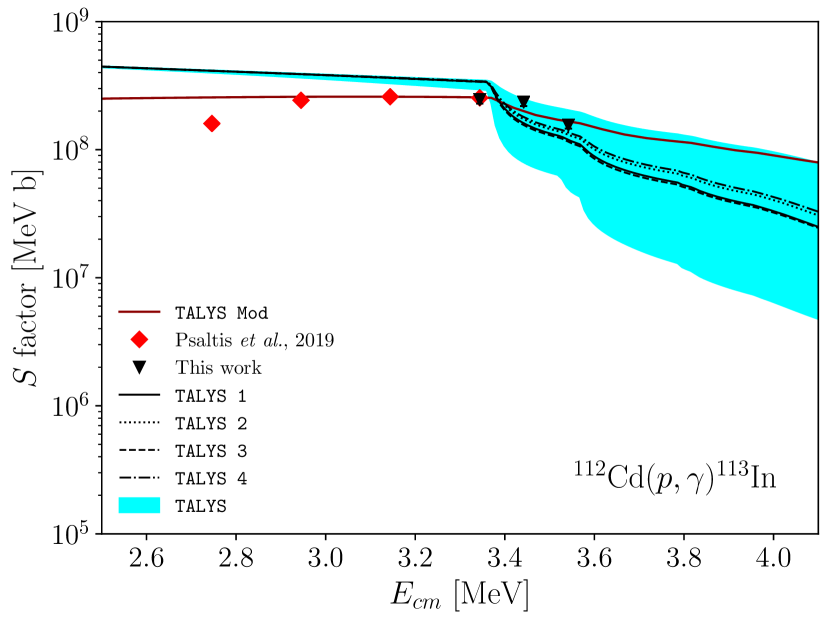
After measuring the total cross sections, the astrophysical factors can be determined through the relation
| (7) |
where is the Sommerfeld parameter [40]. The factor is a quantity of special importance for astrophysical applications, due to its smooth variation with energy, as compared to the cross section, allowing for safer extrapolations to experimentally inaccessible energies, while also serving as a useful quantity for reaction network calculations [16]. The results for the astrophysical factor are also tabulated in Table 1 and plotted in Fig. 5(d).
| (lab) | (lab) | (c.m.) | factor | |||
|---|---|---|---|---|---|---|
| [MeV] | [MeV] | [MeV] | [mb] | [mb] | [mb] | [ MeV b] |
| 3.400 | 3.374 | 3.344 | 0.143(17) | 0.250(23) | 0.393(29) | 2.47(18) |
| 3.500 | 3.473 | 3.442 | 0.181(23) | 0.35(3) | 0.53(4) | 2.36(17) |
| 3.600 | 3.574 | 3.542 | 0.154(18) | 0.336(26) | 0.49(3) | 1.56(10) |
All energies selected for the experiment reside inside the Gamow window for the reaction (see Table 1 for details).
3.2 The reaction \isotope[114]Cd\isotope[115]In
3.2.1 In-beam measurements
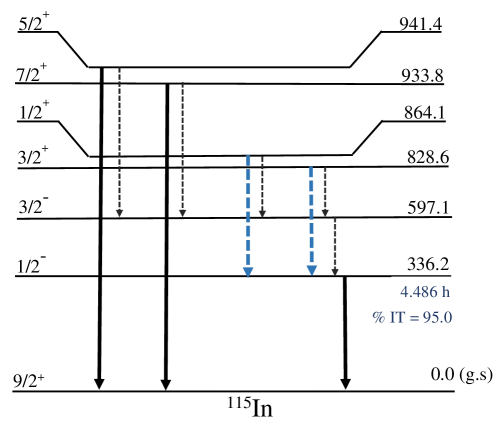
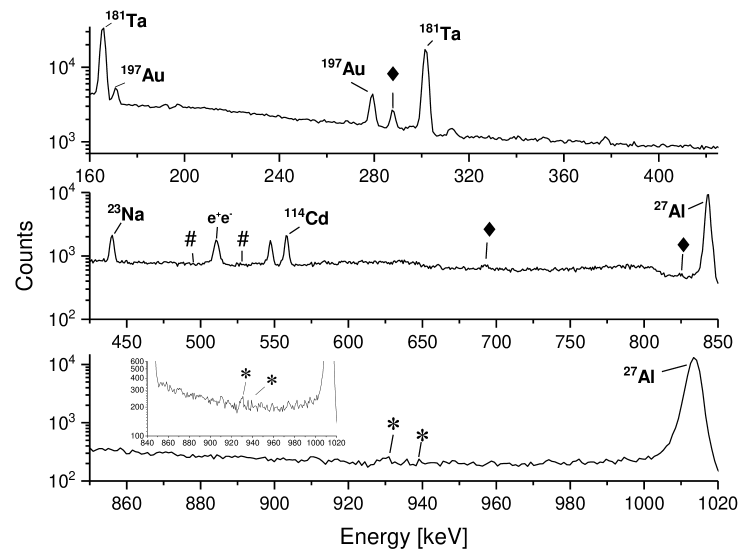
Following a similar analysis as in the case of the ground state transition in \isotope[113]In, the cross section for the reaction \isotope[114]Cd\isotope[115]Ings was evaluated in-beam, with the use of Eqs. (3) and (4). From the level scheme of \isotope[115]In (see Fig. 6 for a partial level scheme of \isotope[115]In, adapted from [34]), two transitions to the ground state of \isotope[115]In were observed in our experiments with statistics above the background (denoted with asterisks in Fig. 7):
| keV | |
| keV |
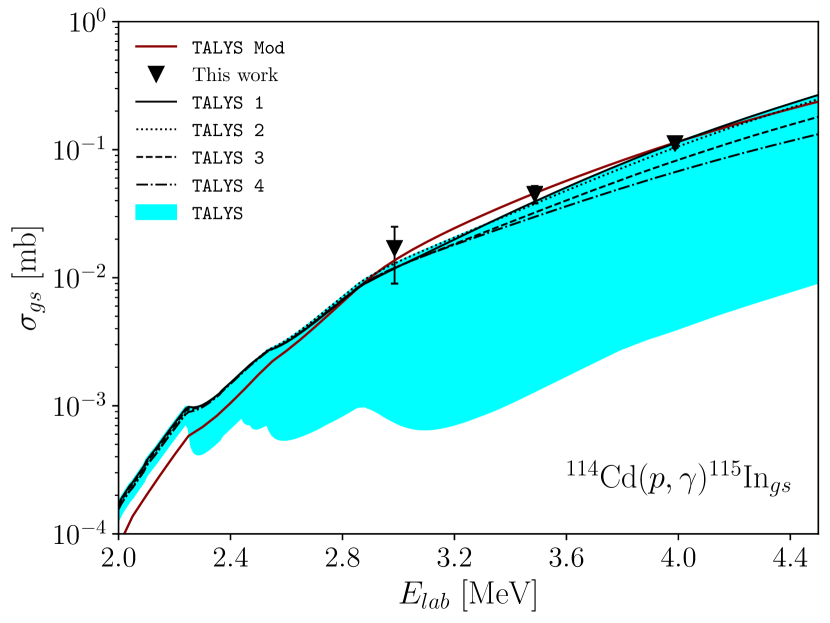
The results for the ground state cross sections are tabulated in Table 2 and plotted in Fig. 8(a).
3.2.2 Activation measurements
The study of the isomeric transition in \isotope[115]In presented additional difficulties, compared to the case of \isotope[113]In, due to its particular lifetime of h [[34]].
The \isotope[114]Cd target was irradiated for approximately 1.5–2 half-lives, and thus, the population of the isomeric state in the produced \isotope[115]In was significantly lower compared to the case of \isotope[113]In, resulting in increased statistical uncertainties regarding photopeak integration for the isomeric transition.
For \isotope[115]In, and s-1.
3.2.3 Total cross sections and astrophysical factors
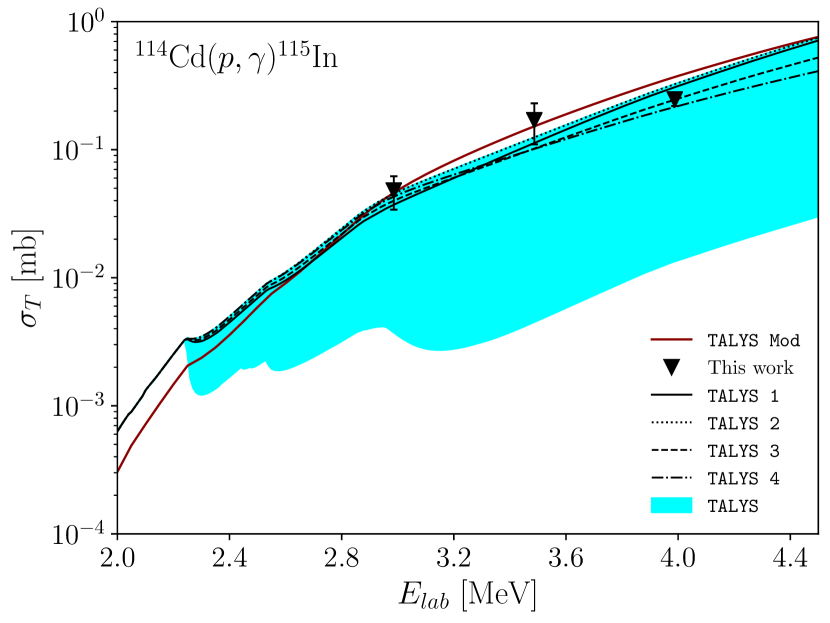
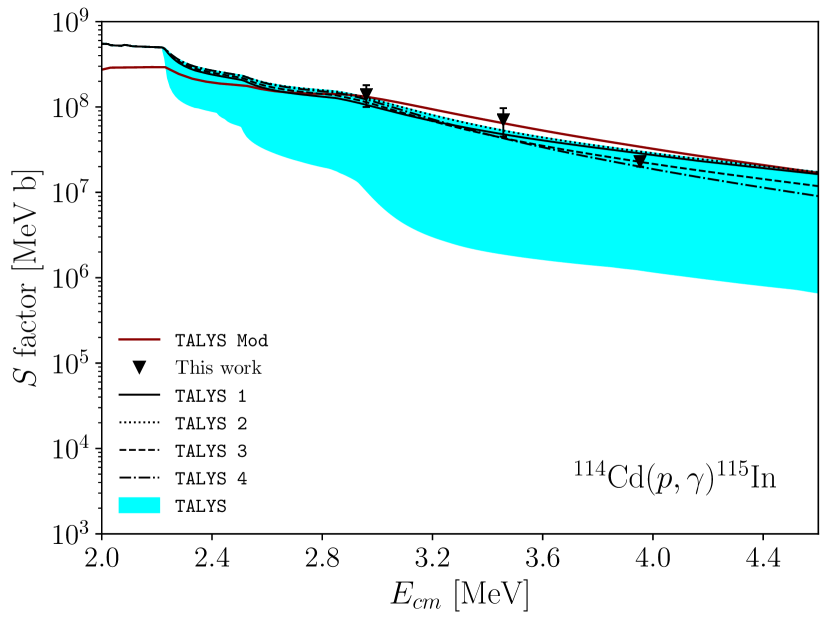
Using Eq. (6) the total cross sections for the channel were evaluated. For the isomeric transition at beam energy of 3.0 MeV the value of used in the calculation of was the one resulting from in-beam measurement (see also Table 2). This was due to a faulty sensor which results in warming up of the HPGe detectors during the activation measurements, which prevented the extraction of an activation cross section value for the 3.0 MeV energy point. Given the very good agreement between vs obtained for the rest of our measurements (see also Sec. 4), we consider this choice not to have a significant impact on the resulting total cross section value, albeit possibly accompanied by some small missing yield.
Following the calculation of the total cross sections, the astrophysical factors were evaluated from Eq. (7). The results are tabulated in Table 2 and plotted in Figs. 8(c), 8(d).
| (lab) | (lab) | (c.m.) | factor | |||
|---|---|---|---|---|---|---|
| [MeV] | [MeV] | [MeV] | [mb] | [mb] | [mb] | [ MeV b] |
| 3.000 | 2.986 | 2.960 | 0.017(8) | 0.031(11) | 0.048(14) | 1.4(4) |
| 3.500 | 3.487 | 3.457 | 0.045(7) | 0.12(6) | 0.17(6) | 0.71(26) |
| 4.000 | 3.988 | 3.953 | 0.112(9) | 0.135(26) | 0.247(28) | 0.23(3) |
All energies selected for the experiment reside inside the Gamow window for the reaction (see Table 2 for details).
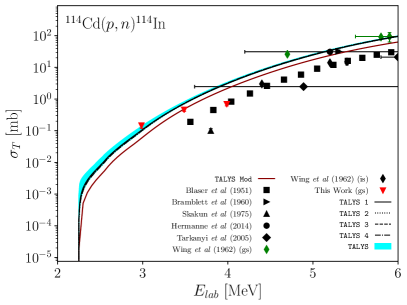
3.3 The reaction \isotope[114]Cd\isotope[114]In
The cross section for the reaction \isotope[114]Cd\isotope[114]In was determined by means of the in–beam method, using Eqs. (3) and (4). The following transitions to the ground state were observed in the in–beam spectra with statistics above the background, and thus, were used for the determination of the cross section (see Ref. [34] for data):
| keV | |
| keV | |
| keV |
The cross sections for the channel in \isotope[114]In are tabulated in Table 3 and plotted in Fig. 9.
| (lab) | (lab) | (c.m.) | |
|---|---|---|---|
| [MeV] | [MeV] | [MeV] | [mb] |
| 3.000 | 2.986 | 2.960 | 0.146(26) |
| 3.500 | 3.487 | 3.457 | 0.46(5) |
| 4.000 | 3.988 | 3.953 | 0.69(8) |
3.4 Hauser-Feshbach calculations with TALYS
Theoretical calculations using the Hauser-Feshbach statistical model have been performed with the latest TALYS v1.95 code [33]. A total of 96 different combinations of the main components of the model, i.e. the optical potential (OMP) (two default options), the nuclear level density (NLD) (six default options) and the -ray strength function (SF) (eight default options) have been used. The models used in the calculations are listed in Table 4. The calculations have bee performed with a 10 keV energy step, from 2–6 MeV.
Both microscopic and phenomenological models have been employed in the calculations, using the default parameters provided by TALYS. For the OMP, the phenomenological model of Koning-Delaroche [41] and the semimicroscopic model of Bauge-Delaroche-Girod [42] have been used. Note that for the studied energy ranges, lying below the respective Coulomb barriers for each reaction, the OMP, and in particular, its imaginary component, is known to have a strong energy dependence [1].
For the NLD, all six available models have been employed in the calculations, namely, the phenomenological CTM model [43], the back-shifted Fermi gas model [44], the generalized superfluid model [45], the semi-microscopic level density tables of Goriely [46] and Goriely et al. [47], and the time-dependent Hartree-Fock-Bogolyubov method combined with the Gogny force [48].
Regarding the SF, the Kopecky-Uhl [49] and Brink-Axel [50, 51] generalized lorentzians were used, as well as values calculated with the implementation of the Hartree-Fock-BCS and the Hartree-Fock-Bogolyubov methods [52]. The hybrid model of Goriely [53], as well as Goriely’s tables using the TDHFB method [48] were also employed. Last, models using the temperature-dependent relativistic mean-field method [54] and the Hartree-Fock-Bogolyubov method combined with the quasi-random phase approximation using the Gogny D1M interaction [55] were implemented.
After performing calculations with all of the possible combinations of the above models, the maximum and minimum for each energy was determined, thus defining the borders of the light blue area shown in Figs. 5(a)–5(d), 8(a)–8(d).
The calculations best describing the experimental data have also been included in the plots (labeled TALYS 1–4) and are listed in Table 5 for the reaction \isotope[112]Cd\isotope[113]In, and Table 6 for the reaction \isotope[114]Cd\isotope[115]In.
| Optical Model Potential (OMP) |
| 1. Koning–Delaroche (KD) [41] |
| 2. Bauge–Delaroche–Girod (BDG) [42] |
| Nuclear Level Density (NLD) |
| 1. Constant–temperature model (CTM) [43] |
| 2. Back–shifted Fermi gas model (BSFG) [44] |
| 3. Generalized superfluid model (GSM) [45] |
| 4. Goriely of Goriely et al. [46] |
| 5. Tables of Goriely et al. [47] |
| 6. T–dependent HFB, Gogny force (TDHFB) [48] |
| Strength Function (SF) |
| 1. Kopecky–Uhl [49] |
| 2. Brink [50] and Axel [51] |
| 3. Hartree–Fock BCS (HFBCS) [52] |
| 4. Hartree–Fock–Bogolyubov (HFB) [52] |
| 5. Goriely’s hybrid model [53] |
| 6. Goriely TDHFB [54] |
| 7. T–dependent relativistic mean field (RMF) [55] |
| 8. Gogny D1M HFBquasi-random-phase approximation (QRPA) [55] |
| Model | OMP | NLD | SF |
|---|---|---|---|
| TALYS 1 | KD | BSFG | Goriely TDHFB |
| TALYS 2 | KD | GSM | Brink–Axel |
| TALYS 3 | KD | GSM | Goriely’s hybrid |
| TALYS 4 | KD | TDHFB | Goriely TDHFB |
| Model | OMP | NLD | SF |
|---|---|---|---|
| TALYS 1 | KD | Goriely of Goriely et al. | HFB |
| TALYS 2 | KD | Goriely of Goriely et al. | Goriely’s hybrid |
| TALYS 3 | KD | Goriely of Goriely et al. | Brink-Axel |
| TALYS 4 | KD | GSM | Goriely TDHFB |
| Model | Adjusted | TALYS | Value |
|---|---|---|---|
| (TALYS input) | Parameter | input | |
| KD OMP (jlmomp n) | [MeV] | v1adjust p | 0.5 |
| [fm] | rcadjust p | 2.1 | |
| [fm] | avadjust p | 0.74 | |
| [fm] | awdadjust p | 0.5 | |
| GSM NLD (ldmodel 3) | Rspincut | 0.1 | |
| Brink-Axel SF (strength 2) | Default | Default | Default |
| (lab) | (activation) | (in-beam) | Deviation |
|---|---|---|---|
| [MeV] | [mb] | [mb] | [%] |
| 3.374 | 0.250(23) | 0.244(26) | 2 |
| 3.473 | 0.35(3) | 0.34(4) | 3 |
| 3.574 | 0.336(26) | 0.31(3) | 8 |
4 Discussion and Conclusions
An experimental attempt to measure the total reaction cross sections and the factors for the \isotope[114]Cd\isotope[115]In reaction has been carried out for the first time, inside the astrophysically important energy regime (at beam energies of 3.0, 3.5 and 4.0 MeV). An extension of a recent experimental effort in \isotope[112]Cd to higher energies than before (3.4, 3.5 and 3.6 MeV) has additionally been carried out. Both reactions exhibit very low cross sections, in the order of tens to hundreds of b in the energy range studied in the present work. An additional level of complexity in the present work has been related to the lifetimes of the isomeric states being present in both nuclei, making the use of two methods to obtain the experimental results imperative.
For the case of populated \isotope[115]In, the in–beam spectroscopy focused on all prompt transitions feeding its ground state directly. All visible transitions in the spectra populating the isomeric state were also included in the calculation of the cross section. The activation technique was additionally implemented [22, 37], in order to fully account for the contribution of the significantly longer–lived isomeric state in \isotope[115]In.
A general setback of the in-beam method, is its high dependency on the detection limit of the experimental setup. It has been observed [56, 18, 16] that with this particular technique some weak transitions may be absent from the spectra, resulting in some missing strengths, especially when singles–mode is involved. Regarding the isomeric transition, a comparison between the in–beam and activation cross sections shows that no major contributions to the cross section arise due to the missing higher level transitions. Given the fact that the cross sections reported in this work are very small (of the order of tens to hundreds of microbarns) we consider the last argument to hold true also for the ground state cross sections, with the more strongly observed transitions in the in–beam spectra carrying the largest fraction of the cross section, while higher level transitions, which do not show up in the spectra, amount to negligible contributions to the corresponding cross section.
An alternative experimental approach to remedy all that could possibly be the application of the 4 detection method. Implementation of this method reduces the data analysis to that of the produced single summing peak, instead of a complex –ray spectrum. The aforementioned method has been applied successfully for studies in reactions relevant to the p–process [57, 58] despite its own constraints, such as the summing peak detection efficiency, which depends on the –decay scheme.
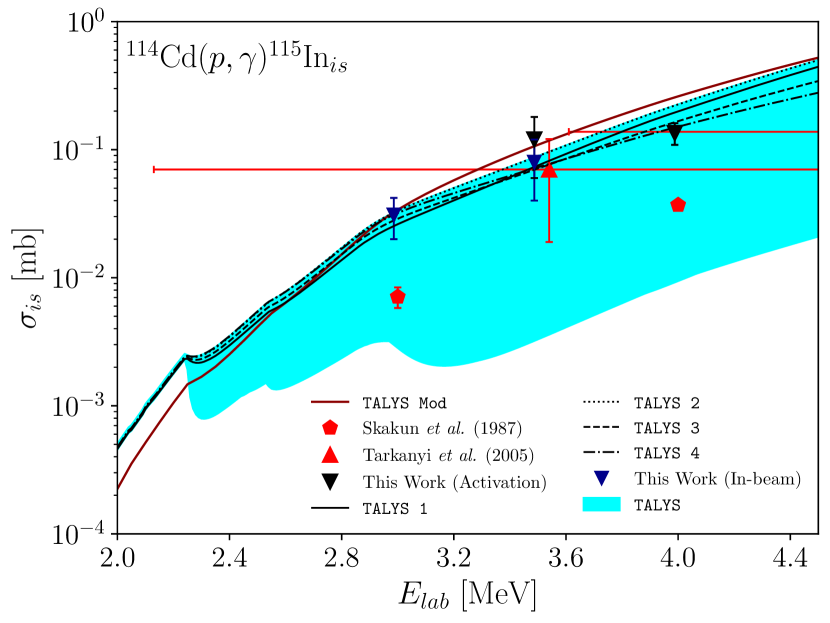
The results for the isomeric state populated during the reaction \isotope[114]Cd\isotope[115]In are compared to existing experimental datasets retrieved from the literature. A better agreement exists with the published dataset by Tárkányi et al. [26], rather than that by Skakun et al. [25]. It has to be noted that large uncertainties in the energy exist in the former, possibly due to the stack–foil technique employed, on which the current work seems to improve significantly. None of the earlier works report on experimental data regarding the ground state cross sections for the radiative ) reaction with \isotope[114]Cd, thus making the present dataset on the ground state and total reaction cross sections the first one to be reported for energies inside the Gamow window.
In addition, this work further extends the data for the \isotope[112]Cd\isotope[113]In reaction at energies slightly above the energy threshold, but still inside the Gamow window. A measurement at proton beam energy of 3.4 MeV, which was also performed in the previous work [16], was revisited in this experiment, aiming to confirm the validity of our experimental methodology in an independent measurement and analysis, before moving to higher energies or another nucleus. The present results at this energy show excellent agreement with the previously published values, as illustrated in Figs. 5(a)-5(d), without any normalization considered. Two more energy points have been measured at energies 3.5 and 3.6 MeV, respectively. As it is evident in Figs. 5(a)-5(d), the existence of the neutron threshold has a clear effect –as expected– on the trend of the cross sections. While, below the threshold, the cross sections seem to follow a smooth trend affected largely by the OMP, the wider phase space above the threshold shows the important role of NLD at this energy regime. The total reaction cross sections and the corresponding factors show a clear deviation from the trend of the data at lower energies. As the neutron threshold for the \isotope[114]Cd\isotope[114]In reaction is at lower energies (2.247 MeV) [34], no observation similar to the case of \isotope[112]Cd is observed; rather a smooth, monotonous trend is exhibited in the studied energy range (see Figs. 8(a)-8(d)).
In order to gain further insight on the OMP, NLD and SF parameters involved in the theoretical calculations, the \isotope[114]Cd\isotope[114]In reaction was additionally studied during the same experiment. The deduced experimental cross sections for this reaction channel are shown in Table 3, and plotted with red upside–down triangles in Fig. 9. At this point, we should note that our measurements are accompanied by some missing yield, resulting from the long–lived isomer in \isotope[114]In ( d [34]), and the partial cross section pertaining to the formation of the daughter \isotope[114]In nucleus in its ground state (i.e. without the involvement of –ray emission). However, this fact does not affect our conclusions, which are corroborated by comparison of the results with the datasets existing in the literature (Refs. [27, 28, 29, 26, 30, 31, 32]), along with those pertaining to the corresponding channel for \isotope[112]Cd. The results seem to follow the general trend formed by earlier datasets retrieved from the literature, despite there is a divergence between the absolute experimental data and the theoretical calculations in the energy range below – MeV, down to the energy threshold. A similar behavior is observed for the corresponding channel in \isotope[112]Cd, which could possibly be attributed to the fact that the incorporated phenomenological and semi–microscopic OMPs have been optimized at a significantly higher energy range than the one the present paper focuses on. TALYS 1–4 combinations included in Table 6, which best describe the ground–state cross sections of the \isotope[114]Cd channel, seem to also best describe the experimental data reported in this work, along with the data obtained by Hermanne et al. (black circles in Fig. 9) and Wing et al. (g.s.) (green triangles in Fig. 9). However, the choice of this default set of parameters overestimates the \isotope[113]In isomeric state cross sections significantly, as was also reported earlier [16].
Based on the new experimental data reported in this paper for every channel studied, as well as the respective data sets from the previous work from our group [16], a systematic attempt to determine the best set of parameters of OMP+NLD+SF entering the TALYS theoretical models was undertaken [59]. The goal was to achieve a good description of the experimental data for each reaction channel studied in a simultaneous fashion. Due to the very large number of parameters tested in this step, the full results from the parameter sensitivity analysis are not included in here; rather the predictions with the “best–fit” values are presented, exclusively, i.e. those providing the best simultaneous fit to all experimental data. It has to be stressed that these parameters have been used for both reactions without any further modifications.
Initially, every parameter of the KD OMP [41] was individually tested, by modifying its corresponding TALYS input variable in small steps with respect to the default value, and observing the resulting effect on the theoretical predictions for the ground state and isomeric cross sections in both scale and trend, for the full energy range examined in this work. Having extracted the “best–fit” values for all OMP parameters, the same procedure was followed for the NLD model parameters, finally arriving at the values tabulated in Table 7. The Brink–Axel generalized Lorentzian [50, 51], with its default parameter values already led to a good description of the experimental data, and was chosen as the SF of choice throughout.
For the KD OMP, the modified parameters are: the coefficient of the real component of the volume–central potential of the energy dependent well depth , ; the diffuseness parameter of the real and imaginary components of the volume–central potential of the energy–independent radial part, ; the diffuseness parameter of the imaginary component of the surface–central potential of the energy–independent radial part, ; and the Coulomb radius constant of the energy–independent radial part of the Coulomb term, . These parameters have been adjusted by constant multiplication factors, set via the corresponding TALYS input variables listed in Table 7. For the GSM NLD, the spin cut–off, , of the nuclear level density model was multiplied by a constant value, set through the TALYS input variable “Rspincut” (we have denoted this parameter with in Table 7). All other parameters, were used with their default values.
The predictions of the final theoretical TALYS model arising from the use of the modified parameters, as listed in 7 is plotted for each reaction channel studied in the present paper. The corresponding dark red solid line, labelled “TALYS Mod” in these plots, leads to a significantly improved agreement for both reaction channels in a simultaneous fashion. Especially for the isomeric state, the improvement over any of the default combinations is self–evident.
In conclusion, the set of experimentally deduced cross sections and astrophysical S factors reported in the present paper for the proton–induced reactions with \isotope[112,114]Cd provide new information that can support the improvement of reaction network calculations around the studied mass region. It is certainly necessary to stress that the tailor–made model described above can not be considered a global description for the nuclei under scrutiny. As the experimental data are located in a limited energy range, the validity of the tailored description can only be considered safe inside it. However, the success in achieving a good simultaneous fit for both ground and isomeric states in \isotope[113,115]In produced in the studied reactions lays the ground for further investigation. Both experimental and theoretical studies are required to acquire firm insight at the driving mechanisms behind the p–process nucleosynthesis and restrict the parameters of the theoretical models in an energy region where a scarcity of experimental data, even for stable nuclei, still persists.
Acknowledgements
We are grateful to M. Andrianis, A. Laoutaris, and S. Nanos for providing beams
during the experiments, and Dr. E. Ntemou for technical assistance with the target
measurement.
AZ and AC acknowledge support
by the Hellenic Foundation for Research and Innovation (HFRI)
and the General Secretariat for Research and Technology (GSRT)
under the HFRI PhD Fellowship grant
(GA. No. 101742/2019 and 74117/2017, respectively).
![]()
References
- [1] M. Arnould, S. Goriely, The p-process of stellar nucleosynthesis: astrophysics and nuclear physics status, Phys. Rep. 384 (2003) 1–84.
- [2] C. Iliadis, Nuclear Physics of Stars, John Wiley & Sons, 2015.
- [3] E. Burbidge, G. Burbidge, W. Fowler, F. Hoyle, Synthesis of the elements in stars, Rev. Mod. Phys. 29 (1957) 547.
-
[4]
A. Cameron, Stellar
evolution, nuclear astrophysics, and nucleogenesis, Atomic Energy of Canada
Ltd. CRL-41 (1957).
URL https://www.osti.gov/servlets/purl/4709881 - [5] S. Woosley, W. Howard, The p process in supernovae, Astrophys. J. Suppl. Ser. 36 (1978) 285–304.
- [6] C. Travaglio, F. Röpke, R. Gallino, W. Hillebrandt, Type Ia Supernovae as Sites of the p-Process: Two Dimensional Models Coupled to Nucleosynthesis, Astrophys. J. 739 (2011) 93. doi:10.1088/0004-637X/739/2/93.
- [7] H. Schatz, L. Bildsten, A. Cumming, The Rapid Proton Process Ashes From Stable Nuclear Burning on an Accreting Neutron Star, Astrophys. J. 524 (1999) 1014–1029.
- [8] S. Wanajo, The rp-Process in Neutrino-Driven Winds, Astrophys. J. 647 (2006) 1323–1340.
- [9] S. Goriely, J. José, M. Hernanz, M. Rayet, M. Arnould, p-Process nucleosynthesis during He-detonation in sub-Chandrasekhar CO white dwarfs, Nucl. Phys. A 718 (2003) 596c–598c. doi:10.1016/S0375-9474(03)00879-0.
- [10] C. Fröhlich, G. Martínez-Pinedo, M. Liebendörfer, F.-K. Thielemann, E. Bravo, W. Hix, K. Langanke, N. Zinner, Neutrino-Induced Nucleosynthesis of nuclei: The Process, Phys. Rev. Lett. 96 (2006) 142502. doi:10.1103/PhysRevLett.96.142502.
- [11] W. Hauser, H. Feshbach, The inelastic scattering of neutrons, Phys. Rev. 87 (1952) 366.
- [12] T. Rauscher, N. Dauphas, I. Dillmann, C. Fröhlich, Z. Fülöp, G. Gyürky, Constraining the astrophysical origin of the p-nuclei through nuclear physics and meteoritic data, Rep. Prog. Phys. 76 (2013) 066201. doi:10.1088/0034-4885/76/6/066201.
- [13] K. Wisshak, F. Voss, F. Käppeler, L. Kazakov, Neutron capture cross sections for stellar Cd production, Phys. Rev. C 66 (2002) 025801. doi:10.1103/PhysRevC.66.025801.
- [14] G. Gyürky, G. G. Kiss, Z. Elekes, Z. Fülöp, E. Somorjai, A. Palumbo, J. Görres, H. Y. Lee, W. Rapp, M. Wiescher, N. Özkan, R. T. Güray, G. Efe, T. Rauscher, -induced cross sections of for the astrophysical process, Phys. Rev. C 74 (2006) 025805. doi:10.1103/PhysRevC.74.025805.
- [15] J. José, C. Iliadis, Nuclear astrophysics: the unfinished quest for the origin of the elements, Rep. Prog. Phys. 74 (2011) 096901. doi:10.1088/0034-4885/74/9/096901.
- [16] A. Psaltis, A. Khaliel, E.-M. Assimakopoulou, A. Kanellakopoulos, V. Lagaki, M. Lykiardopoulou, E. Malami, P. Tsavalas, A. Zyriliou, T. J. Mertzimekis, Cross-section measurements of radiative proton-capture reactions in \isotope[112]Cd at energies of astrophysical interest, Phys. Rev. C 99 (2019) 065807. doi:10.1103/PhysRevC.99.065807.
- [17] M. Pignatari, K. Göbel, R. Reifarth, C. Travaglio, The production of proton-rich isotopes beyond iron: The -process in stars, International Journal of Modern Physics E 25 (04) (2016) 1630003. doi:10.1142/S0218301316300034.
- [18] A. Khaliel, T. J. Mertzimekis, E.-M. Asimakopoulou, A. Kanellakopoulos, V. Lagaki, A. Psaltis, I. Psyrra, E. Mavrommatis, First cross-section measurements of the reactions \isotope[107,109]Ag\isotope[108,110]Cd at energies relevant to the p process, Phys. Rev. C 96 (2017) 035806.
- [19] A. Khaliel, T. J. Mertzimekis, A. Psaltis, I. Psyrra, A. Kanellakopoulos, V. Lagaki, V. Foteinou, M. Axiotis, S. Harrisopulos, Experimental investigation of radiative proton-capture reactions relevant to nucleosynthesis, HNPS Adv. Nucl. Phys. 24 (2019) 168–173. doi:10.12681/hnps.1861.
- [20] A. Zyriliou, A. Khaliel, T. J. Mertzimekis, On the experimental investigation of the angular distributions in the reaction , HNPS Adv. Nucl, Phys. 26 (2019) 189–192. doi:10.12681/hnps.1818.
- [21] C. Rolfs, Spectroscopic factors from radiative capture reactions, Nucl. Phys. A 217 (1973) 29 – 70. doi:/10.1016/0375-9474(73)90622-2.
- [22] G. Gyürky, Z. Fülöp, F. Käppeler, G. Kiss, A. Wallner, The activation method for cross section measurements in nuclear astrophysics, Eur. Phys. J. A 55 (2019) 41.
- [23] I. Dillmann, T. Rauscher, M. Heil, F. Käppeler, W. Rapp, F.-K. Thielemann, p-Process simulations with a modified reaction library, Journal of Physics G: Nuclear and Particle Physics 35 (1) (2007) 014029. doi:10.1088/0954-3899/35/1/014029.
- [24] N. Otuka, E. Dupont, V. Semkova, B. Pritychenko, A. Blokhin, M. Aikawa, S. Babykina, M. Bossant, G. Chen, S. Dunaeva, R. Forrest, T. Fukahori, N. Furutachi, S. Ganesan, Z. Ge, O. Gritzay, M. Herman, S. Hlavač, K. Katō, B. Lalremruata, Y. Lee, A. Makinaga, K. Matsumoto, M. Mikhaylyukova, G. Pikulina, V. Pronyaev, A. Saxena, O. Schwerer, S. Simakov, N. Soppera, R. Suzuki, S. Takács, X. Tao, S. Taova, F. Tárkányi, V. Varlamov, J. Wang, S. Yang, V. Zerkin, Y. Zhuang, Towards a More Complete and Accurate Experimental Nuclear Reaction Data Library (EXFOR: International Collaboration Between Nuclear Reaction Data Centres (NRDC), Nuclear Data Sheets 120 (2014) 272 – 276. doi:10.1016/j.nds.2014.07.065.
- [25] E. Skakun, V. Batij, Y. Rakivnenko, O. Rastrepin, Cross sections of the reactions on \isotope[54]Fe, \isotope[112]Sn and \isotope[114]Cd isotopes at proton energies up to 9 MeV, Yad. Fiz. 45 (1987) 614–618.
- [26] F. Tárkányi, S. Takács, A. Hermanne, P. Van den Winkel, R. Van der Zwart, Y. Skakun, Y. Shubin, S. Kovalev, Investigation of the production of the therapeutic radioisotope \isotope[114m]In through proton and deuteron induced nuclear reactions on cadmium, Radiochim. Acta 93 (2005) 561–569.
- [27] J. Wing, J. Huizenga, Cross Sections of \isotope[51]V, \isotope[52]Cr, \isotope[63]Cu, \isotope[65]Cu, \isotope[107]Ag, \isotope[109]Ag, \isotope[111]Cd, \isotope[114]Cd, and \isotope[139]La from 5 to 10.5 MeV, Phys. Rev. 128 (1962) 280.
- [28] A. Hermanne, R. Adam-Rebeles, P. v. d. Winkel, F. Tárkányi, S. Takács, Production of \isotope[111]In and \isotope[114m]In by proton induced reactions. An update on excitation functions, chemical separation-purification and recovery of target material, Radiochim. Acta 102 (2014) 1111 – 1126. doi:10.1515/ract-2013-2233.
- [29] R. Bramblett, T. Bonner, Neutron evaporation spectra from reactions, Nucl. Phys. 20 (1960) 395 – 407. doi:10.1016/0029-5582(60)90182-6.
- [30] J.-P. Blaser, F. Boehm, P. Marmier, D. Peaslee, Excitation functions of the reaction i, Helv. Phys. Acta (Switzerland) 24 (1951).
- [31] E. Skakun, A. Klyucharev, Y. Rakivnenko, I. Romanij, Excitation functions of the and reactions on Cd isotopes, Iz. Akad. Nauk SSSR, Seriya Fizicheskaya 39 (1975) 24–30.
- [32] F. Tárkányi, B. Király, F. Ditrói, S. Takács, J. Csikai, A. Hermanne, M. Uddin, M. Hagiwara, M. Baba, T. Ido, et al., Activation cross-sections on cadmium: proton induced nuclear reactions up to 80 MeV, Nucl. Instrum. Meth. Phys. Res. B 245 (2006) 379–394.
- [33] A. Koning, S. Hilaire, M. Duijvestijn, Talys-1.0, in: International Conference on Nuclear Data for Science and Technology, EDP Sciences, 2007, pp. 211–214.
- [34] B. N. L. National Nuclear Data Center, Nudat2 (nuclear structure and decay data), https://www.nndc.bnl.gov (2008).
- [35] J. Ziegler, M. Ziegler, J. Biersack, SRIM–The stopping and range of ions in matter, Nucl. Instrum. Meth. Phys. Res. B 268 (2010) 1818–1823.
- [36] M. Mayer, SIMNRA, a simulation program for the analysis of NRA, RBS and ERDA, AIP Conference Proceedings 475 (1) (1999) 541–544, https://aip.scitation.org/doi/abs/10.1063/1.59188. arXiv:https://aip.scitation.org/doi/pdf/10.1063/1.59188, doi:10.1063/1.59188.
- [37] C. Rolfs, W. Rodney, Cauldrons in the Cosmos, The University of Chicago Press, 1988.
- [38] M. Bhat, Evaluated Nuclear Structure Data File (ENSDF), in: S. M. Qaim (Ed.), Nuclear Data for Science and Technology, Springer Berlin Heidelberg, Berlin, Heidelberg, 1992, pp. 817–821. doi:10.1007/978-3-642-58113-7\_227.
- [39] J. Blachot, Nuclear data sheets for A=113, Nucl. Data Sheets 111 (2010) 1471–1618.
- [40] D. Yakovlev, M. Beard, L. Gasques, M. Wiescher, Simple analytic model for astrophysical S factors, Phys. Rev. C 82 (2010) 044609. doi:10.1103/PhysRevC.82.044609.
- [41] A. Koning, J. Delaroche, Local and global nucleon optical models from 1 keV to 200 MeV, Nucl. Phys. A 713 (2003) 231–310.
- [42] E. Bauge, J. Delaroche, M. Girod, Lane-consistent, semimicroscopic nucleon-nucleus optical model, Phys. Rev. C 63 (2001) 024607.
- [43] A. Gilbert, A. Cameron, A composite nuclear-level density formula with shell corrections, Can. J. Phys. 43 (1965) 1446–1496.
- [44] W. Dilg, W. Schantl, H. Vonach, M. Uhl, Level density parameters for the back-shifted fermi gas model in the mass range , Nucl. Phys. A 217 (1973) 269–298.
- [45] A. Ignatyuk, J. Weil, S. Raman, S. Kahane, Density of discrete levels in \isotope[116]Sn, Phys. Rev. C 47 (1993) 1504.
- [46] S. Goriely, F. Tondeur, J. Pearson, A Hartree–Fock nuclear mass table, At. Data Nucl. Data Tables 77 (2001) 311–381. doi:10.1006/adnd.2000.0857.
- [47] S. Goriely, S. Hilaire, A. Koning, Improved microscopic nuclear level densities within the Hartree-Fock-Bogoliubov plus combinatorial method, Phys. Rev. C 78 (2008) 064307.
- [48] S. Hilaire, M. Girod, S. Goriely, A. Koning, Temperature-dependent combinatorial level densities with the D1M Gogny force, Phys. Rev. C 86 (2012) 064317.
- [49] J. Kopecky, M. Uhl, Test of gamma-ray strength functions in nuclear reaction model calculations, Phys. Rev. C 41 (1990) 1941.
- [50] D. Brink, Individual particle and collective aspects of the nuclear photoeffect, Nucl. Phys. 4 (1957) 215–220.
- [51] P. Axel, Electric dipole ground-state transition width strength function and 7-MeV photon interactions, Phys. Rev. 126 (1962) 671.
- [52] R. Capote, M. Herman, P. Obložinskỳ, P. Young, S. Goriely, T. Belgya, A. Ignatyuk, A. Koning, S. Hilaire, V. Plujko, et al., RIPL–reference input parameter library for calculation of nuclear reactions and nuclear data evaluations, Nucl. Data Sheets 110 (2009) 3107–3214.
- [53] S. Goriely, Radiative neutron captures by neutron-rich nuclei and the r-process nucleosynthesis, Phys. Lett. B 436 (1998) 10–18.
- [54] D. Arteaga, P. Ring, Relativistic random-phase approximation in axial symmetry, Phys. Rev. C 77 (2008) 034317. doi:10.1103/PhysRevC.77.034317.
- [55] M. Martini, S. Hilaire, S. Goriely, A. Koning, S. Péru, Improved nuclear inputs for nuclear model codes based on the Gogny interaction, Nucl. Data Sheets 118 (2014) 273–275.
- [56] Sotirios V. Harissopulos, Cross-section measurements of capture reactions relevant to p-process nucleosynthesis, Eur. Phys. J. Plus 133 (2018) 332.
- [57] A. Spyrou, A. Lagoyannis, P. Demetriou, A. Kanellakopoulos, S. Harissopullos, Cross-section measurements of reactions on Pd isotopes relevant to the p process, Phys. Rev. C 77 (2008) 065801.
- [58] V. Foteinou, M. Axiotis, S. Harissopulos, P. Dimitriou, G. Provatas, A. Lagoyannis, H.-W. Becker, D. Rogalla, A. Zilges, A. Schreckling, A. Endres, Cross section measurements of proton capture reactions on Mo isotopes relevant to the astrophysical p process, Eur. Phys. J. A 55 (2019) 67.
-
[59]
A. Koning, D. Rochman, J. Sublet, TALYS manual,
v1.95 Edition (2020).
URL https://www.talys.eu