Hidden charge order in an iron oxide square-lattice compound
Abstract
Since the discovery of charge disproportionation in the FeO2 square-lattice compound Sr3Fe2O7 by Mössbauer spectroscopy more than fifty years ago, the spatial ordering pattern of the disproportionated charges has remained “hidden” to conventional diffraction probes, despite numerous x-ray and neutron scattering studies. We have used neutron Larmor diffraction and Fe -edge resonant x-ray scattering to demonstrate checkerboard charge order in the FeO2 planes that vanishes at a sharp second-order phase transition upon heating above 332 K. Stacking disorder of the checkerboard pattern due to frustrated interlayer interactions broadens the corresponding superstructure reflections and greatly reduces their amplitude, thus explaining the difficulty to detect them by conventional probes. We discuss implications of these findings for research on “hidden order” in other materials.
The term “hidden order” was coined for - and -electron compounds that undergo a thermodynamic phase transition whose order parameter cannot be identified using conventional experimental methods [1, 2, 3, 4]. The most prominent example is URu2Si2 whose hidden-order phase has confounded researchers for decades, despite numerous experimental and theoretical studies [1, 2]. A lesser known, but equally puzzling case of hidden order has been found in the FeO2 square-lattice compound Sr3Fe2O7, whose electronically active Fe sites are accessible to Mössbauer spectroscopy. As early as 1966, [5, 6] Mössbauer experiments on slightly oxygen deficient Sr3Fe2O7 revealed a disproportionation of the Fe4+ ions into nominal Fe3+ and Fe5+ valence states around room temperature. Numerous studies since then have confirmed a sharp phase transition at K in stoichiometric Sr3Fe2O7, but no hints of a charge-ordering transition (such as a symmetry reduction or crystallographic site splitting) have ever been identified in diffraction data [6, 7, 8, 9, 10, 11, 12]. We have combined two advanced experimental methods, neutron Larmor diffraction (NLD) [13, 14] and resonant elastic x-ray scattering (REXS) [15, 16] at the Fe -absorption edge, to resolve this long-standing conundrum. Specifically, we demonstrate checkerboard charge order in the FeO2 layers and show that the “invisibility” of charge ordering in Sr3Fe2O7 originates from frustration of the interactions between neighboring layers.
The impact of geometrical frustration on charge order has been widely investigated, beginning with the classical Verwey transition in magnetite (Fe3O4) [17, 18], and has recently been discussed for widely different solids ranging from metal oxides [19, 20, 21] to organic conductors [22, 23], and in diverse contexts such as electronic ferroelectricity [19, 20], superconductivity [21], quantum criticality [22], and phase-change memory applications [23].
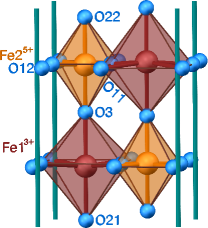
Sr3Fe2O7 can serve as a model compound for frustrated charge order, because it is chemically stoichiometric and crystallizes in a body-centered tetragonal structure with FeO2 square-lattice bilayers (Fig. 1a). This lattice architecture is common to many materials including Sr3Ru2O7, La2-2xSr1+2xMn2O7, and La2-xSrxCaCu2O6+δ, which have been intensely studied in relation to quantum criticality [24], magnetoresistance [25], and superconductivity [26]. Helical magnetic order due to competing exchange interactions between the Fe ions sets in at a much lower temperature ( K) and does not affect [27]. Our crystallographic data imply that the cooperative Jahn-Teller effect is inactive and orbital order is absent in Sr3Fe2O7, in contrast to isoelectronic manganates such as LaMnO3, but similar to several rare-earth nickelates NiO3 [28].
Frustration of the Coulomb interactions among valence electrons in Sr3Fe2O7 is caused by the body-centered stacking of FeO2 bilayers, with each Fe located directly above or below the center of a square iron-oxide plaquette in the adjacent bilayer (Fig. 1b and e (inset)). We have found superstructure reflections indicative of checkerboard charge order in the FeO2 layers and demonstrate that stacking disorder due to frustrated interlayer coupling suppresses their amplitude below the detection limit of standard crystalllographic probes. Interlayer frustration thus holds the key to the hidden-order conundrum in Sr3Fe2O7. Possible implications for other hidden-order materials are discussed.
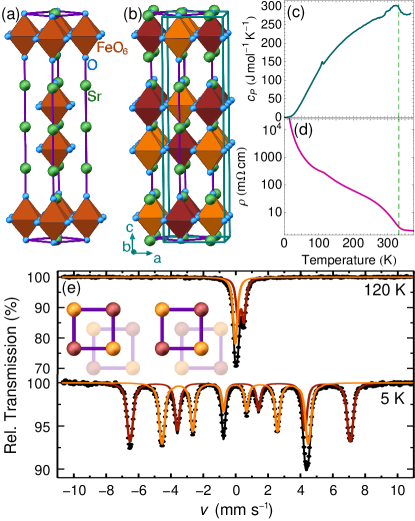
High-quality single crystals of Sr3Fe2O7 were grown by the floating-zone technique [12, 30]. In order to obtain full oxygen stoichiometry, single-crystalline rods were annealed under 5-6 kbar of oxygen pressure [29]. Specific heat data (Fig. 1c) demonstrate a second-order phase transition with a sizeable entropy release of 2.7 J/mol K at K. The transition is associated with a strong upturn in the in-plane resistivity (Fig. 1d), in agreement with previous reports [11, 12]. To confirm charge ordering in our Sr3Fe2O7 samples, we conducted Mössbauer experiments on powdered crystals. The resulting spectra (Fig. 1e) reveal two components in the paramagnetic as well as in the magnetically-ordered phases, indicating charge disproportionation of Fe4+ into Fe3+- and Fe5+-like sites below . (Note, however, that the high formal charge in Fe4+ compounds has to be understood in terms of negative charge transfer energy states, in which the excess holes and the electronic density modulation reside predominantly on the oxygen ligands [31, 32].) The area ratio of 1:1 between the two subspectra confirms full oxidation of the sample and also indicates that the single iron site in the space group has split into two distinct sites with equal population, in agreement with prior work [5, 6, 7, 8, 9, 11].
Before addressing the charge-ordered phase, we used single-crystal neutron diffraction to verify the high-temperature crystal structure from which this order develops. Refinements [29] in the space group (Fig. 1a) showed no indications of any reduction in symmetry, in agreement with previous work [6, 10]. The oxygen site bridging two adjacent FeO2 layers refined to full occupancy as expected for stoichiometric Sr3Fe2O7.
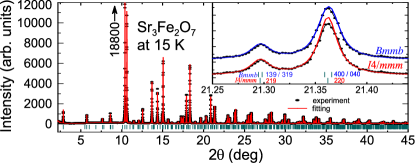
We now turn to the crystal structure for . We first note that neither our neutron diffraction data nor our high-resolution synchrotron x-ray powder pattern (Fig. 2) contained any additional primitive Bragg reflections to indicate a violation of the body-centering condition, nor any obvious splitting of peaks, in agreement with prior work that failed to detect any crystallographic signature of charge disproprotionation [6, 10]. There was a slight discrepancy between the synchrotron x-ray data and the refinements at a handful of peaks (inset of Fig. 2). To check whether anisotropic strain below could explain the peak profile broadening, we used a strain model (Laue class ) in the refinement, but the fit did not improve substantially. Nonetheless, these deviations alone were not compelling evidence for a change in crystal symmetry.
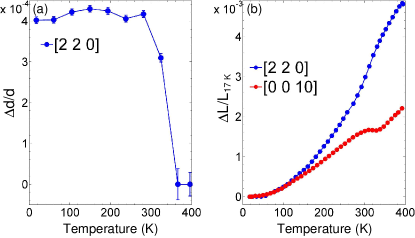
We therefore employed neutron Larmor diffraction on the TRISP spectrometer [33] at the Maier-Leibnitz-Zentrum in Garching, Germany. NLD is capable of detecting lattice parameters and their spread with a resolution better than , independent of beam collimation and monochromaticity and of the crystal’s mosaic spread [13, 14, 29]. Figure 3a shows that of the tetragonal (2 2 0) Bragg reflection extracted from NLD increases sharply but continuously upon cooling below , then saturates at a value of , as expected for the order parameter of a structural phase transition. No comparable change of is observed along the -axis (not shown), but the thermal expansion of the -axis parameter extracted from the Larmor phase of the (0 0 10) reflection provides additional evidence of a continuous structural phase transition at (Fig. 3b).
The spread of the in-plane lattice parameters below revealed by NLD (Fig. 3a) and the slight discrepancy between the synchrotron x-ray data and refinements (Fig. 2) provide clues to the lattice structure in the charge-ordered state. Based on the observation of specific superstructure reflections indicative of a unit cell with doubled in-plane area (see below), we identify the orthorhombic space group (an alternate setting of , No. 63) as the simplest crystallographic description compatible with our experimental data. Here, Fe3+- and Fe5+-like sites in the FeO2 planes alternate in a checkerboard pattern within the plane and also within a bilayer unit along the -axis [Fig. 1(b)]. The checkerboard pattern is analogous to the charge ordering patterns in the pseudocubic perovskite CaFeO3, where Fe3+- and Fe5+-like sites alternate in all three directions [34].
Rietveld refinements in produced lattice constants Å, Å, and Å. We note that the difference between and , , is in quantitative agreement with the independent neutron Larmor diffraction results for the in-plane (Fig. 3a). Complete tables of the resulting structural parameters are given in the Supplemental Materials [29]. The refinement does not indicate any rotations of the FeO6 octahedra such as those observed in nearly-isostructural Sr3Ru2O7 [35, 36] and in CaFeO3. [34] Since substantial rotations and distortions of the FeO6 octahedra are present in CaFeO3 even above , the splitting of its orthorhombic Bragg reflections, , is 20 that of the tetragonal peaks in Sr3Fe2O7 for . Charge order then manifests as a spectral-weight shift between the split peaks, which is readily resolved by standard diffraction probes [34].
To search for weak superstructure reflections that are allowed in but not in , we first investigated a 10 m-diameter Sr3Fe2O7 single crystal at the BM01A beamline at the ESRF, using the wavelength 0.6973 Å. In , such reflections occur at for and for . In , these have non-integer indices and are therefore forbidden. We found no intensity at the position of any superstructure reflection, and were able to place an upper bound of 10-5 on the ratio of the peak intensities ( ) / [(1 1 5) + (1 1 5)] (in the orthorhombic setting), which should be of order according to our refinement [29]. If our space group assignment is correct, this finding implies that the superstructure reflections are broadened by disorder so that their amplitude is reduced below the detection limit.
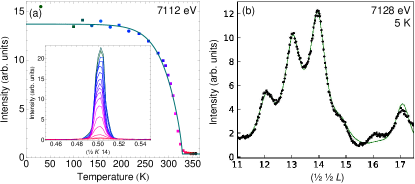
To enhance the sensitivity to the diffraction signal from a charge modulation on the Fe sites, we performed single-crystal REXS [15, 16] measurements at the Fe -edge (photon energy 7128 eV) at beamline P09 at PETRA-III, DESY, in Hamburg, Germany [37]. The incoming polarization was perpendicular to the scattering plane, and the outgoing polarization was not analyzed. As shown in Fig. 4, REXS indeed enables the detection of superstructure peaks at the positions predicted for the space group . The reflections (in notation) are direct manifestations of the unit-cell doubling due to checkerboard charge order. The intensity of the superstructure reflections decreases continuously with increasing and vanishes at (Fig. 4a). Figure 4 represents our most crucial result, as it demonstrates that the checkerboard ordering pattern is correct, and has temperature dependence consistent with Mössbauer (Fig. 1) and neutron Larmor diffraction (Fig. 3) data.
In addition to the data shown in Fig. 4, we surveyed reciprocal space positions, including primitive reflections forbidden in [29]. In particular, superstructure peaks having a temperature dependence consistent with those shown in Fig. 4 were also found at positions (tetragonal cell) for both even and odd , but not at tetragonal or , as expected for . The structure factor of these reflections is roughly consistent with a model that only considers the contribution of the iron atoms resulting from the structural refinement (Fig. 4b). In this model, the structure factor of the reflections shown in Fig. 4b is given by , where are the form factors of inequivalent Fe ions, and their -axis positions measured from the center of the unit cell (Fig. 1b center) [29]. Some deviations from the model calculations are apparent, possibly indicating a contribution from FeO6 octahedral distortions which modulate the Fe intermediate state of -edge REXS, as recently found in experiments on nickel oxides [38]. Since the positional parameters of the O atoms cannot be accurately extracted from the structural refinement [29], comprehensive modelling of the REXS intensity on and off resonance goes beyond the scope of the current paper and will be the subject of future work.
Here we emphasize that the observation of the superstructure reflections and the corresponding extinction rules completes the space-group assignment in the charge-ordered state. The low-temperature space group has to accommodate iron ions in two different valence states as found by the Mössbauer experiments. Since the phase transition at is second order, we considered subgroups of with two crystallographically different Fe sites. The observation of peaks at half-integer positions in and requires a unit cell with a doubled in-plane area. This requirement leads to and its direct subgroups. Out of these, and do not support charge order. itself and its subgroups , , , and can also be ruled out, because and reflections were found for both odd and even (Fig. 4b). Likewise, the non-observation of (1,1,7) and (1,1,9) (again in notation) excludes . This leaves and , which feature in-plane checkerboards with uniform and alternating stacking within a unit cell (and corresponding structure factors with cosine-like and sine-like dependence on ), respectively. The experimentally observed sine-like structure factor (Fig. 4b) singles out , which is also favored by electrostatic and structural considerations. Deviations from orthorhombic symmetry (such as a monoclinic distortion) were not found outside the experimental uncertainty.
The REXS data yield insight into the origin of the “invisibility” of the charge-ordered state to standard diffraction probes. Whereas the width of the superstructure reflections is resolution-limited in the FeO2 planes (which implies a lower bound of tetragonal lattice spacings on the in-plane correlation length), the reflections are broadened into diffuse streaks along the -axis. From their momentum width, we infer a domain size of lattice spacings along . Because of the corresponding reduction of the peak amplitude by about two orders of magnitude, the superstructure peaks are below the detection threshold of standard neutron and non-resonant x-ray scattering. The correlation along the -axis is strong within, but weak between bilayer units, so that the order can be regarded as quasi-two-dimensional. Nonetheless, the observation of well-defined superstructure peaks implies that the space group is correct and the stacking is not random. It is interesting to point out that the Ising symmetry of the charge order parameter allows a finite-temperature phase transition in two dimensions [39], which helps explain the sharp transition in the thermodynamic, transport, and diffraction data even in the presence of substantial stacking disorder.
The insights gained from our resolution of the long-standing Sr3Fe2O7 conundrum provide interesting perspectives for research on hidden order in other compounds. First, we note that Mössbauer spectroscopy provides a sensitive, direct probe of the charge and spin density modulation in Sr3Fe2O7. Without Mössbauer data (which are only obtainable on a small number of compounds with Mössbauer-active elements), the origin of the prominent phase transition in Sr3Fe2O7 would have been far less evident. This is the case, for instance, for the layered iridates with reported hidden-order transitions [4] as well as the archetypical hidden-order compound URu2Si2 [1, 2], which also crystallize in with the same body-centered stacking pattern of electronically active atoms (i.e., iridium or uranium) as in Sr3Fe2O7.
We also note that the orthorhombic distortion breaks the four-fold rotational symmetry of the tetragonal host lattice, and is thus expected to induce two-fold angular modulations in thermodynamic and transport quantities if domain averaging can be avoided (by reducing the sample volume or by applying external strain). Such modulations have indeed been identified in experiments by Okazaki and coworkers on URu2Si2 [40], and were attributed to “nematic” order, that is, a state with broken rotational symmetry that maintains the translational symmetry of the host lattice. Our observation of the orthorhombic supercell in Sr3Fe2O7 suggests an alternative explanation of this behavior. The possible sensitivity of the orthorhombic domain size along the -axis to cooling protocols or defects might help explain why the experiment of Okazaki et al. has been difficult to reproduce [2].
In summary, our NLD and REXS experiments have resolved the 50-year old puzzle of “hidden” charge order in Sr3Fe2O7. The results highlight the need for further investigations of the influence of frustration and disorder on experimental observables in hidden-order phases of other materials. Finally, we point out that the high ordering temperature of Sr3Fe2O7 might enable device applications akin to those recently proposed for organic compounds with frustrated charge order [23].
Acknowledgements.
We thank an anonymous referee for insightful comments on an earlier version of this manuscript. We acknowledge funding from the Deutsche Forschungsgemeinschaft (DFG, German Research Foundation), Collaborative Research Center TRR 80 (project-ID 107745057), and through projects C03 and C06 of the Collaborative Research Center SFB 1143 (project-ID 247310070); the National Natural Science Foundation of China (Grant No. 11674367), and the Zhejiang Provincial Natural Science Foundation (Grant No. LZ18A040002). DCP is supported by the Chinese Academy of Sciences through 2018PM0036. The authors are grateful to the groups of R. Dinnebier, R. Kremer, and L. Schröder, and the staff of beamline P02.1 at PETRA-III for experimental support. We thank HZB for the allocation of neutron diffraction beamtime; DESY (Hamburg, Germany), a member of the Helmholtz Association HGF, for resonant diffraction beamtime; the European Synchrotron Radiation Facility for provision of synchrotron facilities and access to beamlines BM01A and BM01B; and the Heinz Maier-Leibnitz Zentrum (MLZ), Garching, Germany, for use of the TRISP spectrometer at FRM II.References
- Mydosh and Oppeneer [2011] J. A. Mydosh and P. M. Oppeneer, Colloquium: Hidden order, superconductivity, and magnetism: The unsolved case of URu2Si2, Rev. Mod. Phys. 83, 1301 (2011), arXiv:1107.0258 [cond-mat.supr-con] .
- Mydosh et al. [2020] J. A. Mydosh, P. M. Oppeneer, and P. S. Riseborough, Hidden order and beyond: an experimental—theoretical overview of the multifaceted behavior of URu2Si2, Journal of Physics: Condensed Matter 32, 143002 (2020), arXiv:1912.09145 [cond-mat.str-el] .
- Cameron et al. [2016] A. S. Cameron, G. Friemel, and D. S. Inosov, Multipolar phases and magnetically hidden order: review of the heavy-fermion compound Ce1-xLaxB6, Rep. Prog. Phys. 79, 066502 (2016), arXiv:1509.03588 [cond-mat.str-el] .
- Cao and Schlottmann [2018] G. Cao and P. Schlottmann, The challenge of spin–orbit-tuned ground states in iridates: a key issues review, Rep. Prog. Phys. 81, 042502 (2018), arXiv:1704.06007 [cond-mat.str-el] .
- Gallagher et al. [1966] P. K. Gallagher, J. B. MacChesney, and D. N. E. Buchanan, Mössbauer effect in the system Sr3Fe2O6-7, J. Chem. Phys. 45, 2466 (1966).
- Dann et al. [1993] S. E. Dann, M. T. Weller, D. B. Currie, M. F. Thomas, and A. D. Al-Rawwas, Structure and magnetic properties of Sr2FeO4 and Sr3Fe2O7 studied by powder neutron diffraction and Mössbauer spectroscopy, J. Mater. Chem. 3, 1231 (1993).
- Adler [1997] P. Adler, Electronic state, magnetism, and electrical transport behavior of SrFe2O7 (, = Ba, La), Journal of Solid State Chemistry 130, 129 (1997).
- Kobayashi et al. [1997] H. Kobayashi, M. Kira, H. Onodera, T. Suzuki, and T. Kamimura, Electronic state of Sr3Fe2O7-y studied by specific heat and Mössbauer spectroscopy, Physica B: Condensed Matter 237-238, 105 (1997), proceedings of the Yamada Conference XLV, the International Conference on the Physics of Transition Metals.
- Adler et al. [1999] P. Adler, U. Schwarz, K. Syassen, G. K. Rozenberg, G. Y. Machavariani, A. P. Milner, M. P. Pasternak, and M. Hanfland, Collapse of the charge disproportionation and covalency-driven insulator-metal transition in Sr3Fe2O7 under pressure, Phys. Rev. B 60, 4609 (1999).
- Mori et al. [1999] K. Mori, T. Kamiyama, H. Kobayashi, S. Torii, F. Izumi, and H. Asano, Crystal structure of Sr3Fe2O7-δ, Journal of Physics and Chemistry of Solids 60, 1443 (1999).
- Kuzushita et al. [2000] K. Kuzushita, S. Morimoto, S. Nasu, and S. Nakamura, Charge disproportionation and antiferromagnetic order of Sr3Fe2O7, Journal of the Physical Society of Japan 69, 2767 (2000).
- Peets et al. [2013] D. C. Peets, J.-H. Kim, P. Dosanjh, M. Reehuis, A. Maljuk, N. Aliouane, C. Ulrich, and B. Keimer, Magnetic phase diagram of Sr3Fe2O7-δ, Phys. Rev. B 87, 214410 (2013), arXiv:1302.1815 [cond-mat.str-el] .
- Rekveldt et al. [2001] M. T. Rekveldt, T. Keller, and R. Golub, Larmor precession, a technique for high-sensitivity neutron diffraction, Europhysics Letters (EPL) 54, 342 (2001).
- Keller et al. [2002] T. Keller, M. T. Rekveldt, and K. Habicht, Neutron Larmor diffraction measurement of the lattice-spacing spread of pyrolytic graphite, Appl. Phys. A 74, S127 (2002).
- Lorenzo et al. [2012] J. E. Lorenzo, Y. Joly, D. Mannix, and S. Grenier, Charge order as seen by resonant (elastic) X-ray scattering, Europhys. J. Special Topics 208, 121 (2012).
- Fink et al. [2013] J. Fink, E. Schierle, E. Weschke, and J. Geck, Resonant elastic soft x-ray scattering, Reports on Progress in Physics 76, 056502 (2013), arXiv:1210.5387 [cond-mat.mtrl-sci] .
- Walz [2002] F. Walz, The Verwey transition—a topical review, Journal of Physics: Condensed Matter 14, R285 (2002).
- Attfield [2006] J. P. Attfield, Charge ordering in transition metal oxides, Solid State Sciences 8, 861 (2006).
- Ishihara [2010] S. Ishihara, Electronic ferroelectricity and frustration, Journal of the Physical Society of Japan 79, 011010 (2010), arXiv:0912.4083 [cond-mat.str-el] .
- Ikeda et al. [2015] N. Ikeda, T. Nagata, J. Kano, and S. Mori, Present status of the experimental aspect of Fe2O4 study, Journal of Physics: Condensed Matter 27, 053201 (2015).
- Jiang et al. [2014] K. Jiang, S. Zhou, and Z. Wang, Textured electronic states of the triangular-lattice Hubbard model and NaxCoO2, Phys. Rev. B 90, 165135 (2014), arXiv:1309.0518 [cond-mat.str-el] .
- Cano-Cortés et al. [2011] L. Cano-Cortés, A. Ralko, C. Février, J. Merino, and S. Fratini, Geometrical frustration effects on charge-driven quantum phase transitions, Phys. Rev. B 84, 155115 (2011), arXiv:1106.4408 [cond-mat.str-el] .
- Oike et al. [2015] H. Oike, F. Kagawa, N. Ogawa, A. Ueda, H. Mori, M. Kawasaki, and Y. Tokura, Phase-change memory function of correlated electrons in organic conductors, Phys. Rev. B 91, 041101 (2015), arXiv:1501.02873 [cond-mat.str-el] .
- Borzi et al. [2007] R. A. Borzi, S. A. Grigera, J. Farrell, R. S. Perry, S. J. S. Lister, S. L. Lee, D. A. Tennant, Y. Maeno, and A. P. Mackenzie, Formation of a nematic fluid at high fields in Sr3Ru2O7, Science 315, 214 (2007), arXiv:cond-mat/0612599 [cond-mat.str-el] .
- Kimura et al. [1996] T. Kimura, Y. Tomioka, H. Kuwahara, A. Asamitsu, M. Tamura, and Y. Tokura, Interplane tunneling magnetoresistance in a layered manganite crystal, Science 274, 1698 (1996).
- Cava et al. [1990] R. J. Cava, B. Batlogg, R. B. van Dover, J. J. Krajewski, J. V. Waszczak, R. M. Fleming, W. F. Peck Jr, L. W. Rupp Jr, P. Marsh, A. C. W. P. James, and L. F. Schneemeyer, Superconductivity at 60 K in La2-xSrxCaCu2O6: the simplest double-layer cuprate, Nature 345, 602 (1990).
- Kim et al. [2014] J.-H. Kim, A. Jain, M. Reehuis, G. Khaliullin, D. C. Peets, C. Ulrich, J. T. Park, E. Faulhaber, A. Hoser, H. C. Walker, D. T. Adroja, A. C. Walters, D. S. Inosov, A. Maljuk, and B. Keimer, Competing exchange interactions on the verge of a metal-insulator transition in the two-dimensional spiral magnet Sr3Fe2O7, Phys. Rev. Lett. 113, 147206 (2014), arXiv:1409.5205 [cond-mat.str-el] .
- Mazin et al. [2007] I. I. Mazin, D. I. Khomskii, R. Lengsdorf, J. A. Alonso, W. G. Marshall, R. M. Ibberson, A. Podlesnyak, M. J. Martínez-Lope, and M. M. Abd-Elmeguid, Charge ordering as alternative to Jahn-Teller distortion, Phys. Rev. Lett. 98, 176406 (2007).
- [29] See Supplemental Material in the Appendix below, including Refs. 41, 42, 43, 44, 45, 46, for additional experimental details, crystallographic parameters, and Mössbauer results. CIF files of our crystal structure refinements are available as ArXiv ancillary files.
- Maljuk et al. [2004] A. Maljuk, J. Strempfer, C. Ulrich, M. Sofin, L. Capogna, C. Lin, and B. Keimer, Growth of Sr3Fe2O7-x single crystals by the floating zone method, Journal of Crystal Growth 273, 207 (2004).
- Bocquet et al. [1992] A. E. Bocquet, A. Fujimori, T. Mizokawa, T. Saitoh, H. Namatame, S. Suga, N. Kimizuka, Y. Takeda, and M. Takano, Electronic structure of SrFe4+O3 and related Fe perovskite oxides, Phys. Rev. B 45, 1561 (1992).
- Green et al. [2016] R. J. Green, M. W. Haverkort, and G. A. Sawatzky, Bond disproportionation and dynamical charge fluctuations in the perovskite rare-earth nickelates, Phys. Rev. B 94, 195127 (2016), arXiv:1608.01645 [cond-mat.str-el] .
- Keller and Keimer [2015] T. Keller and B. Keimer, TRISP: Three axes spin echo spectrometer, Journal of large-scale research facilities 1, A37 (2015).
- Woodward et al. [2000] P. M. Woodward, D. E. Cox, E. Moshopoulou, A. W. Sleight, and S. Morimoto, Structural studies of charge disproportionation and magnetic order in CaFeO3, Phys. Rev. B 62, 844 (2000).
- Shaked et al. [2000] H. Shaked, J. D. Jorgensen, O. Chmaissem, S. Ikeda, and Y. Maeno, Neutron diffraction study of the structural distortions in Sr3Ru2O7, J. Solid State Chem. 154, 361 (2000).
- Kiyanagi et al. [2004] R. Kiyanagi, K. Tsuda, N. Aso, H. Kimura, Y. Noda, Y. Yoshida, S.-I. Ikeda, and Y. Uwatoko, Investigation of the structure of single crystal Sr3Ru2O7 by neutron and convergent beam electron diffractions, J. Phys. Soc. Japan 73, 639 (2004).
- Strempfer et al. [2013] J. Strempfer, S. Francoual, D. Reuther, D. K. Shukla, A. Skaugen, H. Schulte-Schrepping, T. Krachta, and H. Franz, Resonant scattering and diffraction beamline P09 at PETRA III, Journal of Synchrotron Radiation 20, 541 (2013).
- Lu et al. [2016] Y. Lu, A. Frano, M. Bluschke, M. Hepting, S. Macke, J. Strempfer, P. Wochner, G. Cristiani, G. Logvenov, H.-U. Habermeier, M. W. Haverkort, B. Keimer, and E. Benckiser, Quantitative determination of bond order and lattice distortions in nickel oxide heterostructures by resonant x-ray scattering, Phys. Rev. B 93, 165121 (2016), arXiv:1604.07317 [cond-mat.str-el] .
- Onoda et al. [2004] S. Onoda, Y. Motome, and N. Nagaosa, Two-dimensional charge order in layered 2-1-4 perovskite oxides, Phys. Rev. Lett. 92, 236403 (2004), arXiv:cond-mat/0211520 [cond-mat.stat-mech] .
- Okazaki et al. [2011] R. Okazaki, T. Shibauchi, H. J. Shi, Y. Haga, T. D. Matsuda, E. Yamamoto, Y. Onuki, H. Ikeda, and Y. Matsuda, Rotational symmetry breaking in the hidden-order phase of URu2Si2, Science 331, 439 (2011), arXiv:1107.5480 [cond-mat.str-el] .
- Hall et al. [1995] S. R. Hall, G. S. D. King, and J. M. Stewart, eds., The Xtal3.4 User’s Manual (Lamb Print, University of Western Australia, Perth, 1995).
- Prince [2006] E. Prince, ed., International Tables of Crystallography, Vol. C (International Union of Crystallography, 2006).
- Rodríguez-Carvajal [1993] J. Rodríguez-Carvajal, Recent advances in magnetic structure determination by neutron powder diffraction, Physica B: Condensed Matter 192, 55 (1993).
- Klencsár [2013] Z. Klencsár, MossWinn—methodological advances in the field of Mössbauer data analysis, Hyperfine Interactions 217, 117 (2013).
- Takano et al. [1977] M. Takano, N. Nakanishi, Y. Takeda, S. Naka, and T. Takada, Charge disproportionation in CaFeO3 studied with the Mössbauer effect, Materials Research Bulletin 12, 923 (1977).
- Demazeau et al. [1981] G. Demazeau, B. Buffat, F. Ménil, L. Fournès, M. Pouchard, J. M. Dance, P. Fabritchnyi, and P. Hagenmuller, Characterization of six-coordinated iron (V) in an oxide lattice, Materials Research Bulletin 16, 1465 (1981).
Appendix S1 — Appendix: Supplemental Material —
Appendix S2 Crystal Growth and Characterization
High-quality single crystalline rods of Sr3Fe2O7 grown by the floating zone technique [12, 30] were annealed to full oxygen stoichiometry following two different temperature programs: The material studied here by Mössbauer spectroscopy, resistivity, neutron diffraction, Larmor diffraction, and synchrotron powder diffraction was annealed under 6 kbar of oxygen pressure at 550∘C for 100 h then cooled slowly to room temperature. Crystals used for resonant x-ray diffraction and synchrotron single-crystal diffraction were annealed for 48 hours at 450∘C in 5 kbar of oxygen to rapidly oxygenate the sample, cooled to 400∘C in 6 hours and held there for 24 hours to ensure equilibrium, cooled to 350∘C in 96 hours then to 275 in 48 hours to maximize the oxygen content, then cooled to room temperature in an additional 24 hours. Specific heat measurements were performed on both sets of samples and were indistinguishable, so these were averaged. The oxygen contents were verified by thermogravimetry, and by refinement of diffraction data. Thermogravimetric analysis indicated an oxygen content of 6.92 for the former annealing program and 6.96 for the latter, both within the uncertainty of 7.00, and additionally showed a glitch on warming at 332(5) K, consistent with the charge-order transition.
The specific heat was measured on single crystals of Sr3Fe2O7 in a Quantum Design Physical Properties Measurement System (PPMS), in zero field and for fields up to 9 T along the axis. No hysteresis nor field dependence was observed above the magnetic transition, and as mentioned above, measurements on crystals from the two batches were indistinguishable and were averaged. Samples were attached to the sample holder using Apiezon N grease for measurements below 200 K; Apiezon H grease was used for higher-temperature measurements to avoid the glass transition of Apiezon N grease. Resistivity was measured in standard four-probe geometry in a Quantum Design PPMS. Gold wires were attached with silver epoxy, which was allowed to cure for several hours at 180–200∘C in air before the crystal was mounted to the sample puck with GE Varnish. Thermogravimetric analysis had previously indicated that at these temperatures the oxygen mobility remains extremely low, the oxygen content does not change, and any intercalated water tends to deintercalate, ensuring that the resistivity samples were not altered or damaged while curing the epoxy.
Appendix S3 Neutron diffraction
Single-crystal neutron diffraction was performed on the four-circle diffractometer E5 at the BER-II reactor (Helmholtz-Zentrum Berlin, Germany) using the neutron wavelength Å. Refinements were carried out with the program Xtal3.4 [41] using the nuclear scattering lengths (O) = 5.805 fm, (Fe) = 9.54 fm, and (Sr) = 7.02 fm [42]. A data set of 1302 reflections (303 unique) was collected at 390 K, well above . Refinements of a total of 19 parameters (i.e., the overall scale and extinction factors, 4 positional parameters, and 13 anisotropic thermal parameters) in the space group showed no indications of any reduction in symmetry. Data taken below the charge order transition showed no change.
Appendix S4 Nonresonant x-ray diffraction
To determine the crystal structure for , high-resolution synchrotron powder diffraction measurements were performed at the BM01B (Swiss-Norwegian) beamline at the ESRF (Grenoble, France) using the wavelength Å. The data were refined using the program fullprof [43], using the atomic scattering factors provided therein. However, no peak splittings or additional superstructure reflections were observed. The search for weak superstructure reflections continued at beamline BM01A at the ESRF, using a 10 m-diameter Sr3Fe2O7 single crystal. Data were collected with a Pilatus area detector, using the photon wavelength 0.6973 Å.
| Site | Occ | ||||||||||||
|---|---|---|---|---|---|---|---|---|---|---|---|---|---|
| Sr1 | 2 | 0 | 0 | 1. | 32(8) | 1. | 32 | 1. | 03(8) | 1 | |||
| Sr2 | 4 | 0 | 0 | 0. | 31656(8) | 1. | 64(6) | 1. | 64 | 0. | 97(6) | 1 | |
| Fe | 4 | 0 | 0 | 0. | 09745(6) | 0. | 79(4) | 0. | 79 | 0. | 70(5) | 1 | |
| O1 | 8 | 0 | 0. | 09432(8) | 1. | 52(8) | 1. | 33(7) | 1. | 23(5) | 1 | ||
| O2 | 4 | 0 | 0 | 0. | 19309(11) | 1. | 32(7) | 1. | 32 | 0. | 99(6) | 1 | |
| O3 | 2 | 0 | 0 | 0 | 2. | 07(14) | 2. | 07 | 1. | 64(13) | 0. | 983(23) | |
= = 3.846(4) Å, = 20.234(2) Å, = 299.4(6) Å3
| Site | (Å2) | ||||||||
| Sr1 | 4 | 0 | 0. | 2500(12) | 0. | 290(4) | |||
| Sr21 | 4 | 0 | 0. | 4330(1) | 0. | 290 | |||
| Sr22 | 4 | 0 | 0. | 0670(1) | 0. | 290 | |||
| Fe1 | 4 | 0 | 0. | 6528(15) | 0. | 306(10) | |||
| Fe2 | 4 | 0 | 0. | 8471(15) | 0. | 306 | |||
| O1 | 16 | 0. | 248(6) | 0. | 505(5) | 0. | 3450(1) | 0. | 62(3) |
| O21 | 4 | 0 | 0. | 5573(24) | 0. | 62 | |||
| O22 | 4 | 0 | 0. | 9445(24) | 0. | 62 | |||
| O3 | 4 | 0 | 0. | 62 | |||||
| = 5.43050(3) Å, = 5.43287(3) Å, = 20.12137(7) Å, | |||||||||
| Sr3Fe2O7 at 390 K, in | ||
|---|---|---|
| (Fe–O1) (eq) | 1. | 9244(22) |
| (Fe–O2) (ap) | 1. | 9352(26) |
| (Fe–O3) (br) | 1. | 9718(13) |
| (Fe–O) | 1. | 9341(21) |
Appendix S5 Crystallographic Parameters
The atomic coordinates resulting from refinements of neutron and synchrotron x-ray diffraction data at 390 and 15 K, respectively, are shown in Tables 1 and 2, and the Fe–O bond lengths obtained at 390 K are given in Table 3. Figure S5 indicates the labelling of the crystallographic sites. Somewhat enlarged standard deviations were obtained from synchrotron data for the positional parameters of the oxygen atoms in the low-temperature phase (Table 2). This can be ascribed to the fact that these parameters are highly correlated, and to the fact that the scattering power of the oxygen atoms is relatively weak in x-ray diffraction.
The space group generates a general position 16() for the equatorial O1 atoms. Here the three atomic positions could be individually refined; only the parameter of O3 was fixed to be . Due to the enlarged standard deviations of the positional parameters of the oxygen atoms, it was not possible to determine individual bond lengths (Fe–O) with good accuracy. However, we have obtained reasonable averaged bond lengths (Fe1) = 1.950 Å and (Fe2) = 1.917 Å.
Appendix S6 Neutron Larmor diffraction
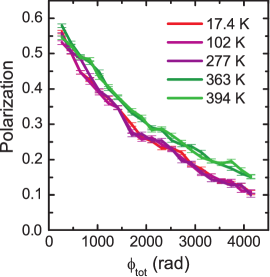
High-resolution neutron Larmor diffraction data were taken at the resonant spin-echo triple-axis spectrometer TRISP at the FRM-II (Garching, Germany) with neutron wavevector Å-1. The crystal was aligned in the tetragonal scattering plane and cooled in a closed-cycle refrigerator, and the tetragonal (2 2 0) and (0 0 10) nuclear Bragg peaks were investigated in zero applied field. The outgoing neutron polarization was measured as a function of the magnetic field applied along the incident and scattered neutron paths, parallel to the tetragonal (2 2 0) Bragg planes. The measured polarization data for the (2 2 0) peak are shown in Fig. S6.
Appendix S7 Resonant elastic x-ray scattering
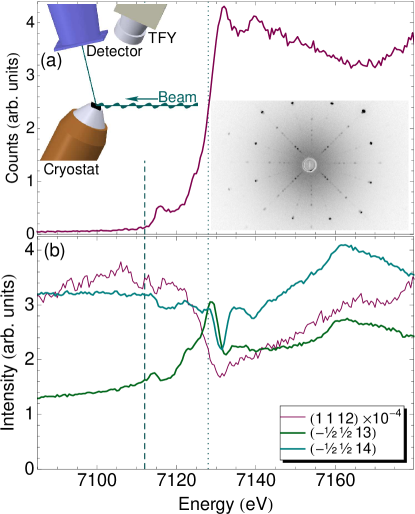
To enhance the contrast between the two Fe sites, we performed temperature-dependent single-crystal resonant elastic x-ray scattering (REXS) at the Fe edge at beamline P09 at PETRA III (DESY, in Hamburg, Germany) [37], with the experimental geometry shown in the upper inset to Fig. S7(a). Before measurement, the sample was aligned using a Photonic Science Laue diffractometer with a tungsten source — the sharp diffraction spots, seen in the inset to Fig. S7(a), indicate the high quality of the single crystal. The Laue pattern produced no clear evidence for superstructure reflections. The sample was mounted on the cold finger of a closed-cycle displex cryostat sitting in a six-circle diffractometer, with the (0 0 1) axis in the vertical scattering plane; polarization was used. An avalanche photodiode point detector was used to measure the scattered x-ray intensity, and a Vortex Si-drift diode fluorescence detector was employed to measure the total fluorescence yield (TFY) from the sample. Fig. S7(a) shows the TFY of Sr3Fe2O7 measured as a function of the incident photon energy across the Fe K edge. The main edge at around 7128 eV and a small pre-edge at around 7115 eV are clearly visible.
| Position | Peak | Axis | Energy | Notes | |
|---|---|---|---|---|---|
| (counts/s) | (K) | (eV) | |||
| (0 0 4) | Present | 5 | 7112 | Area detector | |
| (0 0 6) | 5 | 7012 | |||
| 5 | 7112 | ||||
| 5 | 7112 | ||||
| (1 0 7) | 296 | 7112 | Area detector | ||
| (1 1 7) | 6 | 7012 | |||
| 5 | 7112 | ||||
| (1 1 8) | 6 | 7112 | Area detector | ||
| 5 | 7112 | ||||
| 5 | 7112 | ||||
| (1 1 9) | 6 | 7012 | |||
| (0 0 10) | 5 | 7012 | |||
| 5 | 7112 | ||||
| 5 | 7112 | ||||
| (1 1 10) | 296 | 7112 | |||
| 5 | 7117 | ||||
| 25 | 7112 | ||||
| 5 | 7112 | ||||
| (1 1 11) | 196 | 7112 | overlap Sr2FeO4 (1 1 7) | ||
| 5 | 7117 | ||||
| (0 0 12) | 5 | 7012 | |||
| (0 1 12) | Absent | 5 | 7112 | ||
| 5 | 7012 | ||||
| 5 | 7112 | ||||
| (1 1 12) | 5 | 7012 | |||
| Absent | 5 | 7112 | |||
| 5 | 7112 |
| Position | Peak | Axis | Energy | Notes | |
|---|---|---|---|---|---|
| (counts/s) | (K) | (eV) | |||
| (0 0 13) | 5 | 7112 | overlap Sr2FeO4 (0 0 8) | ||
| (0 1 13) | 5 | 7112 | |||
| 5 | 7112 | ||||
| 5 | 7112 | ||||
| (1 0 13) | 5 | 7132 | |||
| (1 1 13) | 196 | 7112 | overlap Sr2FeO4 (1 1 8) | ||
| Absent | 5 | 7112 | |||
| Absent | 5 | 7112 | |||
| 5 | 7117 | ||||
| (0 1 14) | Absent | 5 | 7112 | ||
| 25 | 7112 | ||||
| 6 | 7112 | ||||
| (1 1 14) | 5 | 7112 | |||
| Absent | 5 | 7112 | |||
| 5 | 7112 | ||||
| (0 1 15) | 5 | 7112 | |||
| 25 | 7112 | ||||
| 5 | 7112 | ||||
| Absent | 5 | 7112 | |||
| 5 | 7080 | ||||
| (0 1 16) | 196 | 7112 | overlap Sr2FeO4 (0 1 10) | ||
| 25 | 7112 | ||||
| 5 | 7112 | ||||
| Absent | 197 | 7112 | |||
| 5 | 7117 | ||||
| 25 | 7112 |
As can be seen in Fig. S7(b), which references peaks to the cell, the diffraction anomalous fine structure (DAFS) of the superstructure peaks is complex. While the regular tetragonal Bragg peak (1 1 12) shows a characteristic absorption dip at the edge, the two superstructure peaks exhibit a complex energy-dependence throughout the entire edge region. This is related to interference effects between the two Fe sites with different valences in combination with the short correlation length along the direction. The temperature-dependent REXS data presented in the main text were collected at an energy of 7112 eV, or 1.743 Å, corresponding to the dashed vertical line in Fig. S7 just below the pre-edge features. This energy avoids the strong fluorescence background but is close enough to the edge in order to benefit from resonant enhancement. Table 4 lists reciprocal-space positions probed by resonant x-ray scattering.
Appendix S8 Mössbauer spectroscopy
Mössbauer spectra were collected between 4.8 and 316 K with a standard WissEl spectrometer, which was operated in constant-acceleration mode and was equipped with a 57Co/Rh source. For the absorber, a crystal of Sr3Fe2O7 was ground. The powder containing about 10 mg of natural Fe/cm2 was diluted with boron nitride to ensure homogeneous distribution and filled into a Plexiglas sample container. In order to prevent sample degradation by moisture the absorber was prepared in an Ar-filled glovebox. Spectra at different temperatures were obtained using a Janis SHI-850-5 closed cycle refrigerator (CCR); the spectra at 292 and 316 K were collected with the CCR switched off. Isomer shifts are given relative to -Fe. The data were evaluated with the program MossWinn [44] in the perturbation limit , where corresponds to the quadrupole splitting and to the hyperfine field. Spectra were evaluated with Lorentzian-type sextets or with hyperfine field distributions according to the Hesse-Rübartsch method.
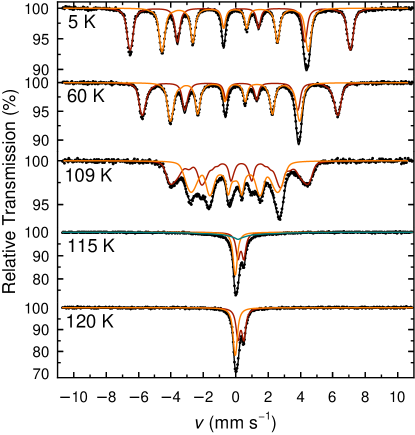
Representative Mössbauer spectra of Sr3Fe2O7 in the temperature range 5-120 K are shown in Fig. S8, and the isomer shifts and hyperfine fields are depicted in Figs. S9 and S10. The spectrum at 5 K can be described by two hyperfine sextets with distinct and values which correspond to two inequivalent iron sites. The two sextets are somewhat broadened. Since the line broadening increases with temperature, the spectra were described by two distributions of hyperfine fields, rather than by two distinct sextets with Lorentzian lineshape. The area ratio between the two subspectra is 1:1 which confirms a charge disproportionation (CD) of Fe4+, in agreement with previous investigations of highly-oxidized Sr3Fe2O7[6, 7, 11].

The CD is frequently written as 2Fe Fe3+ + Fe5+. The and values are similar to those in CaFeO3 [45] which is the classical example for a CD of Fe4+. However, as pointed out previously[7], the of 0.31 mm/s at 5 K for the “Fe3+” site is considerably smaller than the typical values of 0.45 mm/s for Fe3+ in octahedral oxygen coordination, whereas the = 0.03 mm/s for “Fe5+” is larger than for instance = 0.34 mm/s found in the Fe5+ double perovskite La2FeLiO6[46]. Similarly, the hyperfine fields of 42 and 28 T are smaller and larger than expected values of 50 T for Fe3+ and 23 T for Fe5+, respectively[46]. Accordingly, the differences and in isomer shifts and hyperfine fields between the two species are smaller than expected for a full charge disproportionation, which is in qualitative agreement with the view that these formal iron(IV) oxides are strongly covalent and can be considered as negative- materials[31], where is the charge-transfer energy. Then the CD may be formulated as 2 L-1 + L-2, where L-1 and L-2 represent one and two holes in the oxygen coordination sphere, respectively. The formulation 2Fe4+ Fe(4-δ)+ + Fe(4+δ)+ has also been used to indicate an incomplete degree of charge separation. In any case, the CD clearly alters the electron and spin densities at the iron sites which gives rise to distinct and values. As there is only a small quadrupole interaction, the different s correspond to different ordered magnetic moments at the two sites. For CaFeO3, ordered magnetic moments of 3.5 and 2.5 were obtained from neutron diffraction studies for the helical state of CaFeO3[34]. Since the values of CaFeO3 are quite similar to those of Sr3Fe2O7, similar moments are expected. The difference is also nearly the same in the two compounds, which implies a comparable degree of charge segregation in Sr3Fe2O7 and CaFeO3.
The CD remains nearly unchanged up to the magnetic ordering temperature 115 K, where phase coexistence of the paramagnetic and magnetically-ordered phases is found. The latter appears as a broad magnetic hyperfine pattern which is superimposed on the paramagnetic subspectrum. In the magnetically-ordered phase the spectra become continuously broadened with increasing temperature which is reflected in an increased distribution width of . The broadening could reflect slight variations of the magnetic ordering temperature due to a residual oxygen deficiency and/or spin fluctuations. It is noteworthy that even at 5 K a broadening is observed which is more pronounced for the “Fe3+” subspectrum than for the “Fe5+” subspectrum. This may reflect the helical spin structure of Sr3Fe2O7[27]. The “Fe3+” site has a larger quadrupole splitting than the “Fe5+” site, where the quadrupole interaction essentially vanishes. The quadrupole splitting parameter for “Fe3+” (0.06 mm/s at 5 K) depends on the angle between the principal axis of the electric field gradient (efg) and the spin direction, which varies in the case of a helical spin structure. The resulting distribution in may be the origin of the increased broadening in the case of the “Fe3+” component.
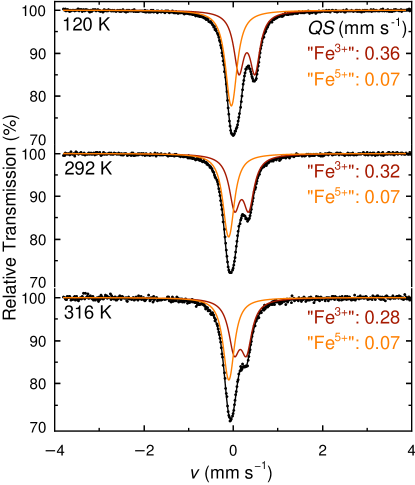
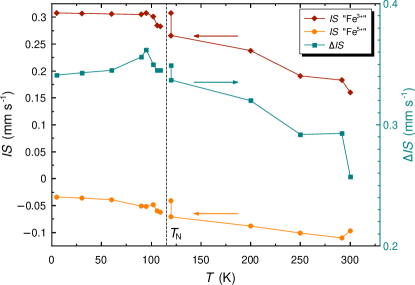
At 120 K the sample is completely in the paramagnetic state. It is obvious that the spectra between 120 and 316 K (Fig. S11) are composed of two components, which evidences that the CD persists in the paramagnetic phase. The spectra were described by two quadrupole doublets, with quadrupole splitting of 0.07 and 0.36 mm/s at 120 K for the “Fe5+” and “Fe3+” sites, respectively. Thus, the “Fe5+” component is essentially a slightly broadened single line. The temperature dependence of the isomer shifts and of the difference between the isomer shifts of the two sites in both the magnetically ordered and the paramagnetic phase is shown in Fig. S9. In agreement with the earlier results these data suggest that the CD is largely insensitive to the magnetic phase transition. With increasing temperature, in particular above 200 K, decreases, which indicates that the degree of charge separation is reduced[7], an effect which is also visible in the resonant diffraction results in the main text. Nevertheless, the CD is still apparent at 316 K, the highest temperature in this study. This is in agreement with the results in the main text and with the slightly higher = 34310 K reported in Ref. 11.
We note that the fit of the spectra in the paramagnetic phase is not unique, and there is another fit with somewhat increased values of for both the “Fe3+” and the “Fe5+” sites which reproduces the spectra equally well. This data analysis, however, results in an anomaly in near the magnetic phase transition and thus would point to a magnetostriction effect, which reduces the charge segregation at . A magnetostriction effect is, however, excluded by the neutron Larmor diffraction results in the main text, and thus this fit is discarded.
In summary, the Mössbauer study on the present Sr3Fe2O7 sample corroborates the CD of Fe4+ and is fully consistent with the crystal structure data at 15 K which reveal a bond-length alternation within in the double layers. The Fe1 sites with the larger bond distances correspond to the “Fe3+” sites in the Mössbauer spectra, whereas the Fe2 sites correspond to the contracted “Fe5+” sites.