∎
Tel.: +91-7018466740
22email: pse2017002@iiita.ac.in 33institutetext: Sonali Agarwal 44institutetext: IIIT Allahabad, Prayagraj, India, 211015
RCA-IUnet: A residual cross-spatial attention guided inception U-Net model for tumor segmentation in breast ultrasound imaging
Abstract
The advancements in deep learning technologies have produced immense contributions to biomedical image analysis applications. With breast cancer being the common deadliest disease among women, early detection is the key means to improve survivability. Medical imaging like ultrasound presents an excellent visual representation of the functioning of the organs; however, for any radiologist analysing such scans is challenging and time consuming which delays the diagnosis process. Although various deep learning based approaches are proposed that achieved promising results, the present article introduces an efficient residual cross-spatial attention guided inception U-Net (RCA-IUnet) model with minimal training parameters for tumor segmentation using breast ultrasound imaging to further improve the segmentation performance of varying tumor sizes. The RCA-IUnet model follows U-Net topology with residual inception depth-wise separable convolution and hybrid pooling (max pooling and spectral pooling) layers. In addition, cross-spatial attention filters are added to suppress the irrelevant features and focus on the target structure. The segmentation performance of the proposed model is validated on two publicly available datasets using standard segmentation evaluation metrics, where it outperformed the other state-of-the-art segmentation models.
Keywords:
Breast tumor segmentation Deep learning Ultrasound imaging U-Net1 Introduction
Breast cancer is the most prevalent cancer in women among all the cancers siegel2019cancer with the leading cause of death worldwide. With the molecular etiology of breast cancer being unknown, identifying the early signs of cancer is the only means to reduce the mortality rate. Due to the non-invasive, non-radioactive, painless, cost effective and ease in availability of the ultrasound imaging cheng2010automated , it is most widely accepted for screening and diagnosing breast cancer. However, even for an expert radiologist, the manual analysis of such scans is challenging and time consuming. Following this context, deep learning based computer-aided diagnosis (CAD) systems are developed for the early detection of breast tumor for faster diagnosis and treatment xian2018automatic . In most CAD systems breast tumor segmentation (BTS) is the key phase for follow up tumor treatment plans and diagnosis, where the goal is to segregate the target tumor region from the rest of the image. However, most of the approaches proposed for BTS are presented and validated on the private datasets which limit their reusability and reachability.
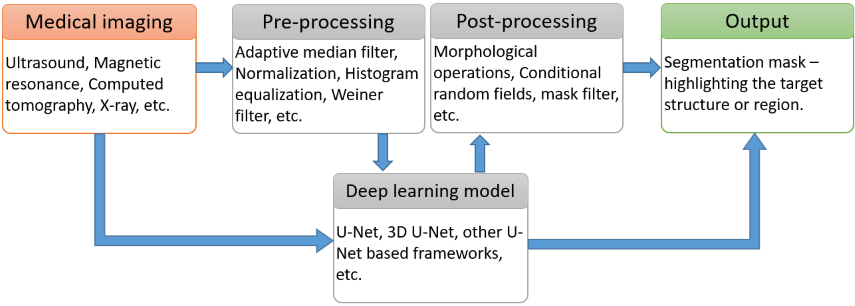
The general schematic representation of the deep learning based segmentation models is presented in Fig. 1. In the data pre-processing phase, the aim is to transform the data into the trainable format by applying certain techniques like normalization to reduce intensity variation, resize to fit the model input layer, cropping the irrelevant features or noise, data augmentation, etc. The processed data is utilized to train the deep learning model and generate the desired segmentation mask. Finally, the generated mask is post-processed to refine the segmentation results. In the last decades many deep learning based segmentation models are proposed haque2020deep , where U-Net based approaches achieved state-of-the-art performance in a wide variety of 2D and 3D data space punn2020inception ; oktay2018attention ; dong2020deu while also addressing the challenge of limited availability of the medical data.
1.1 U-Net
The U-Net model, developed by Ronneberger et al. ronneberger2015u , formed the basis of the state-of-the-art biomedical image segmentation networks. This model employed unique contraction and expansion paths along with the residual skip connections for biomedical image segmentation. In this architecture, the contraction phase tends to extract high and low level features, whereas the expansion phase follows from the features learned in the corresponding contraction phase (skip connections) to reconstruct the image into the desired dimensions with the help of transposed convolutions or upsampling operations. The network does not have any fully connected layers and only uses the valid convolution accompanied by rectified linear unit (ReLU) activation and max pooling operations. Following the state-of-the-art potential of the U-Net model, many variants are proposed for biomedical image segmentation haque2020deep . With such high utility of the U-Net model, this article presents a U-Net based model for breast tumor segmentation.
1.2 Our contribution
The major contribution of the article concerning breast tumor segmentation is described below:
-
•
A novel architecture, residual cross-spatial attention guided inception U-Net model (RCA-IUnet) is introduced with long and short skip connections to generate binary segmentation mask of tumor using ultrasound imaging.
-
•
Instead of the direct concatenation of encoder feature maps with upsampled decoded feature maps, a cross-spatial attention filter is introduced in the long skip connections that use multi-level encoded feature maps to generate attention maps for concatenation with decoded feature maps.
-
•
Hybrid pooling operation is introduced that uses a combination of spectral and max pooling for efficient pooling of the feature maps. It is utilized in two modes: a) same: used in inside inception block b) valid: used to connect inception blocks (reduce the spatial resolution by half the input feature map).
-
•
The model is also equipped with short skip connections (residual connections) along with the inception depth-wise separable convolution layers (concatenated feature maps from 11, 33, 55 and hybrid pooling).
1.3 Article organization
The rest of the article is structured in various sections covering related work in Section 2 to present the literature survey and the proposed approach in Section 3. In the later Section 4 and Section 5, the experimental setup and results are presented along with the qualitative and quantitative results to cover the comparative analysis and ablation study. Finally, the concluding remarks and future scope are presented.
2 Related work
With the advent of advancements in deep learning, the healthcare sector is improving every day Bhardwaj2017ASO . In classical approaches, thresholding shan2008novel , region growing joo2004computer and watershed huang2006automatic based frameworks were adopted to produce segmentation masks. In this section, various breast ultrasound image segmentation approaches are studied that achieved state-of-the-art performance, especially on their private dataset xian2018automatic .
Shan et al. shan2012completely proposed a fully automatic deep learning based segmentation framework to identify and localize the breast lesions using ultrasound imaging. The framework considers textural and spatial features, where initially region of interest (RoI) is generated (region likely to contain lesion) with automatic seed point selection and region growing approach. Following the RoI generation, multi-domain features are extracted: phase in max orientation (PMO), radial distance (RD) and a frequently used texture-and-intensity feature joint probability (JP). Later, an artificial neural network was used to generate the binary segmentation mask of the lesion region. In 2014, Torbati et al. torbati2014efficient introduced a neural network based framework that uses merging moving average self organizing maps (MMA-SOM) to generate an initial segmentation mask and objects belonging to the joint cluster are merged. Later, a 2D discrete wavelet transform (DWT) is computed to generate the input feature space of the network. The approach was validated on multiple modalities, where for breast ultrasound image segmentation authors established a strong correlation between ground truth mask and predicted mask. In another approach, a stacked denoising auto-encoder (SDAE) was introduced by Cheng et al. cheng2016computer to diagnose lesions in breast ultrasound and pulmonary nodules in CT scans. The approach achieved robust results and outperformed traditional computer-aided diagnosis (CAD) approaches, because of automatic feature extraction and high noise tolerance.
With transfer learning tan2018survey being a growing area of research, Huyanh et al. huynh2016mo proposed a transfer learning based approach to classify cystic, benign, or malignant cancer in breast ultrasound imaging. In a similar approach, Fujioka et al. fujioka2019distinction utilized GoogLeNet inception szegedy2015going model to classify breast tumors with varying shapes and size. To generate the segmentation mask, Yap et al. yap2017automated utilized a pre-trained FCN-AlexNet model. The approach outperformed other segmentation models, however failed to produce better segmentation masks for small lesion regions. Huang et al. huang2020segmentation introduced a superpixels classification and clustering patches based segmentation approach to diagnose breast tumors in ultrasound imaging. Though the authors achieved promising segmentation results, the performance was fairly low on large tumors due to simple linear iterative clustering ilesanmi2020multiscale . In order to generate better segmentation results, several methods have been studied to dynamically adapt to the target structures (tumor) of varying shapes and sizes using attention mechanism vaswani2017attention ; oktay2018attention . Following this context, Lee et al. lee2020channel introduced a channel attention module and multi-scale grid average pooling to segment breast ultrasound images. Unlike channel attention that offers depth correlation, spatial attention allows to prioritize an area within the receptive field to better extract the target feature maps woo2018cbam . With this potential of spatial attention filter, we propose a novel residual inception U-Net architecture that uses a cross-spatial attention filter to extract relevant features from multi-scale encoded features to generate binary tumor segmentation masks. Furthermore, the model is equipped with residual inception depth-wise separable convolution and hybrid pooling (max pooling and spectral pooling) layers for better feature extraction and learning.


3 Proposed architecture
The schematic representation of the residual cross-spatial attention guided inception U-Net model (RCA-IUnet) is presented in Fig. 2. The network follows U-Net topology where standard convolution and pooling operations are replaced by inception convolution with short skip connections and hybrid pooling along with the cross-spatial attention filter on long skip connection to focus on the most relevant features. The network has four stages of encoding and decoding layer, where at each stage the spatial dimension (width and height) of the feature map reduces by 50% and channel depth increases by 50%. Besides, in order to minimize the training parameters and the number of multiplications, the depth-wise separable convolution (DSC) operation chollet2017xception is followed which resulted in 2.9M trainable parameters.
The network generates a binary segmentation mask to highlight the tumor region. In some of the predicted masks, minor holes (false negative) and small unnecessary regions (false positive) are identified. Hence, the generated segmentation mask is further refined with post-processing morphological operations such as the flood fill algorithm, mask extraction and binary thresholding to fill the minor holes left in the generated mask based on the surrounding or connected pixels (reducing the false negative predictions), remove the small masked regions (reducing the false positive predictions) and filter the masked regions, respectively.
3.1 Depthwise separable convolution
Unlike standard convolution (SC) operation, in DSC the convolution is performed in two stages involving depthwise and pointwise convolutions as shown in Fig. 3(b) for some input feature map with width (w), height (h) and depth (d), . From Fig. 3 it can be observed that the ratio of reduction in parameters and multiplications can be presented using Eq. 3 in terms of number of parameters () or multiplications (), number of kernels () and kernel size ().
| (1) |
| (2) |
| (3) |
3.2 Hybrid pooling
In deep learning various pooling operations are introduced akhtar2020interpretation , where max pooling is the most common choice for downsampling the feature maps. Max pooling tends to only preserve the sharpest features by applying max operation in given window size, whereas spectral pooling rippel2015spectral not only downsamples the feature maps but also preserves more information as compared to max pooling. In spectral pooling, discrete Fourier transform (DFT) of the input feature map is computed to truncate the high frequency values in the spectral domain and then inverse DFT is applied to convert back to the spatial domain. Hence, to better downsample the feature maps, in this article hybrid pooling is introduced in which downsampled feature maps from max pooling and spectral pooling are merged using the 11 convolution operation.
3.3 Inception convolution
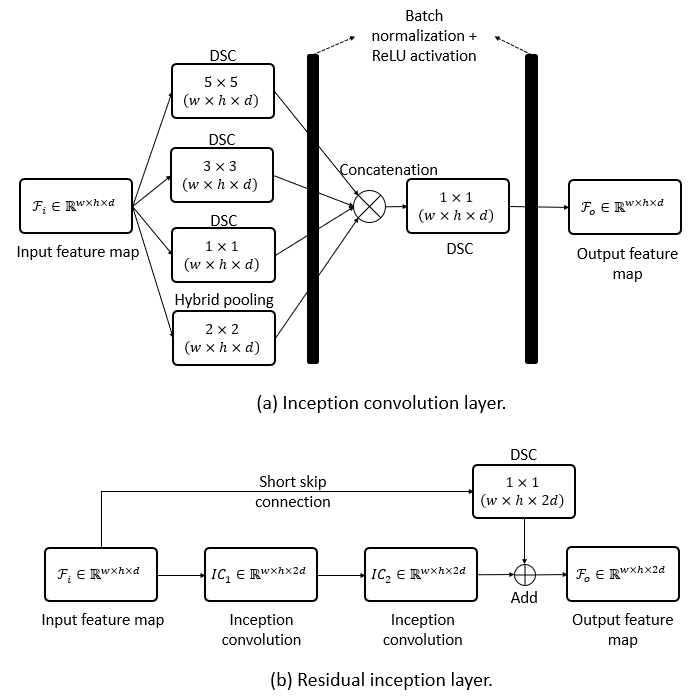
In order to identify the features concerning tumor regions of varying shape and size, the model needs to have an adaptive receptive field punn2020multi ; luo2017understanding . The inception convolution is designed by concatenating the feature maps extracted using the ReLU activated parallel depthwise separable convolutions with different kernels of sizes such as 11, 33 and 55, and hybrid pooling while also using the batch normalization to avoid the covariance shift problem. Finally, the concatenated feature maps undergo 11 convolution to setup the channel correlation and optimize the spatial dimension. Consider an input feature map, , the overview of the inception convolution is illustrated in Fig. 4(a). Following from the inception convolution layers the residual inception convolution block is developed by applying double inception convolution layers with a short skip connection to merge the extracted feature maps with input using 11 DSC as shown in Fig. 4(b).
3.4 Cross-spatial attention block
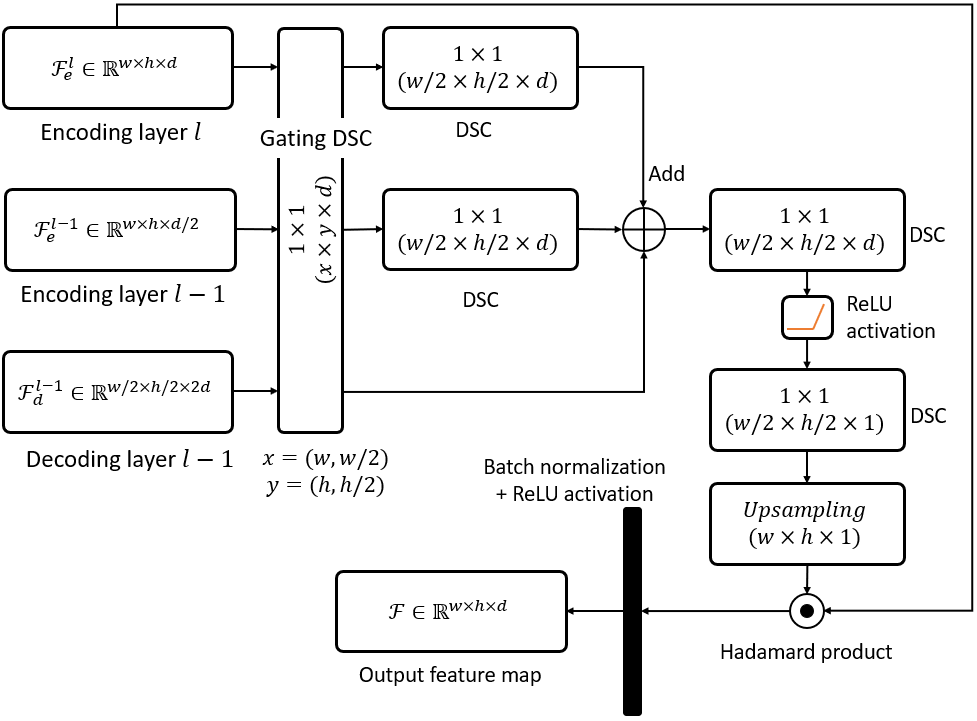
In order to draw the attention of the model towards the tumor structure of varying shape and size, a cross-spatial attention block is introduced in the long skip connections. Unlike the standard attention network oktay2018attention , in this block, the attention filter utilizes the extracted features maps from multiple encoded layers to develop better correlation in the spatial dimension of the feature maps. The schematic representation of the cross-spatial attention approach is illustrated in Fig. 5, where feature maps from three different layers are considered to form the attention feature maps (output feature maps) which are later concatenated with the corresponding decoded layer in the expansion or reconstruction phase.
4 Experiment setup
In this section, details concerning the experimental environment and datasets are presented along with the obtained results and comparative analysis. Due to non-availability of the implementation of the existing breast ultrasound image segmentation models and a standard testing set, the proposed model is compared with other state-of-the-art segmentation models like SegNet111https://github.com/lsh1994/keras-segmentation badrinarayanan2017segnet , U-Net1 ronneberger2015u , U-Net++222https://github.com/kannyjyk/Nested-UNet zhou2018unet++ , attention U-Net333https://github.com/ozan-oktay/Attention-Gated-Networks oktay2018attention , dense U-Net444https://github.com/clguo/Dense_Unet_Keras and deep layer aggregation (DLA)2 yu2018deep while using vgg16 he2016deep and resnet50 he2016deep as backbone architectures.
| Metric | Expression |
|---|---|
| Accuracy | |
| Precision | |
| Recall | |
| Dice coefficient | |
| Mean intersection-over-union | |
| Average Hausdorff distance | |
| Mean absolute error |
4.1 Dataset description and setup
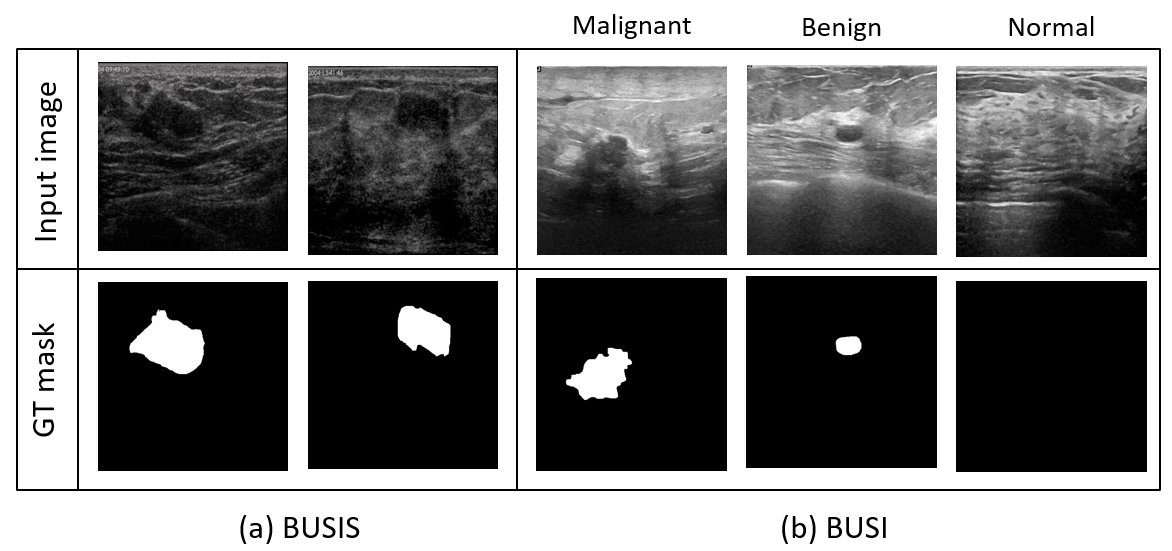
The RCA-IUnet model is trained and evaluated using two publicly available datasets: a) breast ultrasound image segmentation (BUSIS) benchmark dataset xian2018benchmark and b) breast ultrasound images (BUSI) dataset al2020dataset . The BUSIS dataset comprises 562 breast ultrasound images that are collected from vivid hospitals: Harbin medical university, Qingdao university, and Hebei medical university. Each image is provided with a binary ground truth mask (1 label is assigned for tumor pixel and 0 label for background pixel) to highlight the tumor region which is generated using the majority voting approach from the annotations provided by various radiologists. Unlike the BUSIS dataset, BUSI dataset offers 780 ultrasound images divided into normal (133), benign (487) and malignant (210) classes along with the binary ground truth mask. Fig. 6 shows the sample ultrasound images along with the ground truth from BUSIS and BUSI datasets. Due to the variation in the image size in both the datasets, the images are normalized and resized to 256256 for all the segmentation models. Both datasets are randomly split into 70% of the training set and 30% of the testing set and are kept the same throughout the experimentation. All the segmentation models are trained on the training set which is further split into 70% train set and 30% validation set. The trained models are then evaluated on the testing set.
4.2 Training and testing
The models are trained and tested on the BUSIS and BUSI datasets. The training phase is assisted with the stochastic gradient descent approach and Adam as an optimizer ruder2016overview on an NVIDIA GeForce RTX 2070 Max-Q GPU. During training, the learning rate initialized at is reduced by a factor of once learning stagnates to achieve better results. Moreover, earlystopping technique is adopted that halts the training process as soon as the validation error stops improving to avoid the overfitting problem. The RCA-IUnet is trained with the segmentation loss function () that is defined as the average of binary cross entropy loss () and dice coefficient loss () as shown in Eq. 4.
| (4) |
| (5) | |||
| (6) |
where is the ground truth label, is the predicted label and is the total number of pixels. During the backpropagation the gradient of the loss function with respect to the predicted value can be computed using Eq. 7.
| (7) |
where
| (8) |
| (9) |
The trained models are utilized to predict the tumor segmentation mask for the test set. The performance of the models is compared using various evaluation metrics as shown in Table 1. In addition, inference time (IT) amnon2020 is considered to measure the speed of the model. This is computed by measuring the average time taken by the model to generate mask for each sample in test set, where less inference time indicate faster mask generation.
| Dataset | Model | Params | IT (ms) | PP | Tumor segmentation | ||||||
|---|---|---|---|---|---|---|---|---|---|---|---|
| Acc. | Pr. | R | DC | mIoU | AHD | MAE | |||||
| BUSIS | SegNet + vgg16 | 29.4M | 46.12 | N | 0.910 | 0.882 | 0.713 | 0.789 | 0.777 | 5.936 | 0.052 |
| Y | 0.961 | 0.949 | 0.717 | 0.817 | 0.820 | 5.730 | 0.038 | ||||
| U-Net + resnet50 | 36.5M | 25.48 | N | 0.925 | 0.899 | 0.881 | 0.890 | 0.861 | 5.303 | 0.034 | |
| Y | 0.980 | 0.941 | 0.889 | 0.914 | 0.910 | 4.800 | 0.022 | ||||
| U-Net++ + resnet50 | 37.7M | 41.33 | N | 0.928 | 0.867 | 0.847 | 0.857 | 0.888 | 5.156 | 0.029 | |
| Y | 0.976 | 0.921 | 0.865 | 0.892 | 0.890 | 4.920 | 0.024 | ||||
| Attention U-Net + vgg16 | 31.9M | 45.32 | N | 0.939 | 0.894 | 0.892 | 0.893 | 0.891 | 4.980 | 0.027 | |
| Y | 0.978 | 0.930 | 0.888 | 0.909 | 0.909 | 4.650 | 0.022 | ||||
| Dense U-Net + vgg16 | 20.2M | 41.54 | N | 0.939 | 0.838 | 0.871 | 0.854 | 0.825 | 5.485 | 0.031 | |
| Y | 0.973 | 0.893 | 0.872 | 0.882 | 0.879 | 5.002 | 0.027 | ||||
| DLA + vgg16 | 23.7M | 44.22 | N | 0.933 | 0.840 | 0.832 | 0.836 | 0.851 | 5.345 | 0.024 | |
| Y | 0.976 | 0.900 | 0.834 | 0.866 | 0.887 | 5.002 | 0.023 | ||||
| RCA-IUnet (Ours) | 2.9M | 18.75 | N | 0.980 | 0.950 | 0.920 | 0.935 | 0.904 | 4.760 | 0.019 | |
| Y | 0.990 | 0.954 | 0.920 | 0.937 | 0.910 | 4.632 | 0.019 | ||||
| BUSIS | SegNet + vgg16 | 29.4M | 46.15 | N | 0.919 | 0.779 | 0.637 | 0.701 | 0.780 | 5.896 | 0.048 |
| Y | 0.925 | 0.842 | 0.693 | 0.760 | 0.787 | 5.750 | 0.042 | ||||
| U-Net + resnet50 | 36.5M | 25.48 | N | 0.825 | 0.808 | 0.815 | 0.811 | 0.815 | 5.535 | 0.035 | |
| Y | 0.926 | 0.881 | 0.814 | 0.846 | 0.834 | 5.050 | 0.027 | ||||
| U-Net++ + resnet50 | 37.7M | 41.32 | N | 0.885 | 0.883 | 0.811 | 0.845 | 0.864 | 5.393 | 0.029 | |
| Y | 0.941 | 0.900 | 0.812 | 0.854 | 0.850 | 5.136 | 0.027 | ||||
| Attention U-Net + vgg16 | 31.9M | 45.32 | N | 0.860 | 0.877 | 0.752 | 0.810 | 0.827 | 5.215 | 0.027 | |
| Y | 0.946 | 0.901 | 0.808 | 0.852 | 0.860 | 5.010 | 0.025 | ||||
| Dense U-Net + vgg16 | 20.2M | 41.54 | N | 0.883 | 0.881 | 0.787 | 0.831 | 0.811 | 5.082 | 0.032 | |
| Y | 0.960 | 0.914 | 0.820 | 0.864 | 0.880 | 4.840 | 0.023 | ||||
| DLA + vgg16 | 23.7M | 44.21 | N | 0.880 | 0.859 | 0.812 | 0.835 | 0.839 | 5.142 | 0.028 | |
| Y | 0.968 | 0.910 | 0.820 | 0.863 | 0.890 | 5.082 | 0.024 | ||||
| RCA-IUnet (Ours) | 2.9M | 18.74 | N | 0.969 | 0.938 | 0.889 | 0.913 | 0.888 | 4.810 | 0.022 | |
| Y | 0.970 | 0.940 | 0.890 | 0.914 | 0.899 | 4.710 | 0.020 | ||||

5 Results and discussion
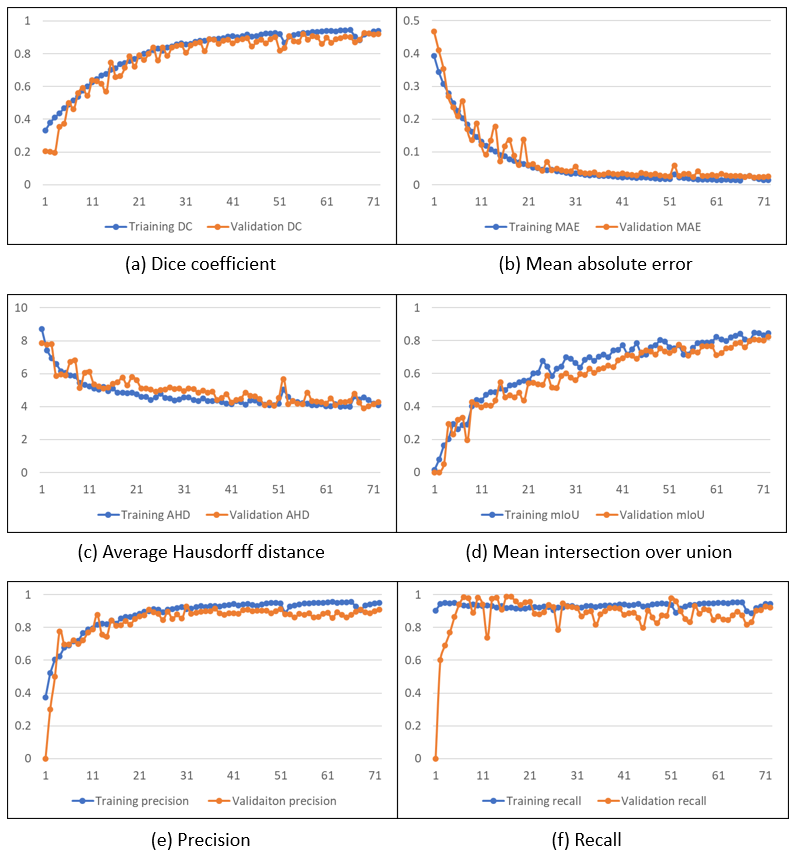
The models produce a binary tumor segmentation mask for a given BUS image. The qualitative results of all the models with and without the post-processing are shown in Fig. 7. The generated segmentation mask along with the dice scores confirms the better performance of the RCA-IUnet model over other segmentation models. Fig. 8 presents the mean segmentation performance of the RCA-IUnet model over the training and validation sets from both the datasets monitored during the training phase. From Fig. 8, it can be observed that the training and validation scores are promising and close to each other indicating that the RCA-IUnet model neither overfits nor underfits the training data and hence generates better segmentation masks.
| Dataset | Model | IT (ms) | Tumor segmentation | ||||||
|---|---|---|---|---|---|---|---|---|---|
| Acc. | Pr. | R | DC | mIoU | AHD | MAE | |||
| BUSIS | U-Net | 3.187 | 0.680 | 0.521 | 0.553 | 0.536 | 0.527 | 6.433 | 0.095 |
| U-Net + RIC | 18.06 | 0.920 | 0.881 | 0.864 | 0.872 | 0.869 | 5.001 | 0.022 | |
| U-Net + CSA | 14.28 | 0.911 | 0.873 | 0.860 | 0.866 | 0.862 | 5.120 | 0.022 | |
| U-Net + RIC + HP | 18.11 | 0.930 | 0.901 | 0.884 | 0.892 | 0.883 | 4.701 | 0.021 | |
| U-Net + CSA + HP | 14.93 | 0.933 | 0.911 | 0.884 | 0.893 | 0.883 | 4.700 | 0.021 | |
| U-Net + CSA + RIC | 18.31 | 0.987 | 0.926 | 0.912 | 0.919 | 0.897 | 4.644 | 0.019 | |
| U-Net + RIC + HP + CSA (RCA-IUnet) | 18.75 | 0.990 | 0.954 | 0.920 | 0.937 | 0.910 | 4.632 | 0.019 | |
| BUSI | U-Net | 3.185 | 0.621 | 0.468 | 0.519 | 0.492 | 0.483 | 6.501 | 0.095 |
| U-Net + RIC | 18.06 | 0.899 | 0.861 | 0.849 | 0.855 | 0.843 | 5.110 | 0.024 | |
| U-Net + CSA | 14.28 | 0.885 | 0.860 | 0.845 | 0.852 | 0.839 | 5.121 | 0.024 | |
| U-Net + RIC + HP | 18.11 | 0.933 | 0.911 | 0.866 | 0.888 | 0.858 | 4.823 | 0.021 | |
| U-Net + CSA + HP | 14.93 | 0.923 | 0.920 | 0.861 | 0.890 | 0.860 | 4.813 | 0.021 | |
| U-Net + CSA + RIC | 18.31 | 0.968 | 0.932 | 0.879 | 0.905 | 0.889 | 4.751 | 0.020 | |
| U-Net + RIC + HP + CSA (RCA-IUnet) | 18.74 | 0.970 | 0.940 | 0.891 | 0.914 | 0.899 | 4.710 | 0.020 | |
| Scenario | Acc. | Pr. | R | DC | mIoU | AHD | MAE |
|---|---|---|---|---|---|---|---|
| 0.957 | 0.913 | 0.885 | 0.901 | 0.855 | 4.879 | 0.023 | |
| 0.990 | 0.959 | 0.921 | 0.936 | 0.926 | 4.897 | 0.019 |
It is also observed that among the tested models, the post-processing techniques have minimal impact on the performance of the RCA-IUnet model, indicating that the model produces a segmentation mask with very low false positive and false negative predictions of the tumor regions. However, there is a noticeable improvement in the performance of other models by using post-processing, indicating that these models generate high false predictions and hence relies on further refinement to improve the results. For instance, in Fig. 7, the segmentation mask generated for the second sample by U-Net without and with post-processing has dice scores of and respectively, while the RCA-IUnet model produces same results with a better dice score of . Besides, the overall quantitative results are shown in Table 2 along with the comparative analysis with other state-of-the-art models in terms of evaluati-
on metrics described in Table 1. The proposed model outperformed with best segmentation scores and minimal inference time while having considerably less number of training parameters.
The effectiveness of each proposed component of the RCA-IUnet model is analyzed in Table 3. This ablation study is conducted by adding the proposed components to base U-Net model. Here U-Net is a skeleton model of complete RCA-IUnet model that consists of default depth-wise separable convolutions, max pooling operations and skip connections with four stages of encoding and decoding. This study is conducted with the same training, validation and testing sets of both datasets over various combinations to form different models by adding components to the U-Net model such as U-Net + CSA, U-Net + RIC + HP, etc. The performance of each model is compared using segmentation metrics along with the inference time (IT). From Table 3 it can be inferred that RIC and CSA are core components that derive the outperforming nature of the RCA-IUnet model as shown for models: U-Net + RIC, U-Net + CSA and U-Net + RIC + CSA. The residual inception convolution enables the network to capture multi-scale feature representation, and cross-spatial attention enables the network to draw attention towards the most relevant features. As compared to max pooling, hybrid pooling plays a vital role with efficient downsampling to further improve the results as shown for the models: U-Net + RIC + HP vs U-Net + RIC and U-Net + CSA + HP vs U-Net + CSA. With the achieved quantitative results it is evident that each component contributes to improving the segmentation performance of the RCA-IUnet model. Though this segmentation performance is delivered with increased inference time as compared to the base U-Net model but is comparatively lesser as compared to the existing models as shown in Table 2.
To further establish the robustness of the proposed model a cross data validation is performed as shown in Table 4. The testing is performed with two scenarios: 1) model pre-trained on BUSIS dataset is tested on BUSI dataset, and 2) model pre-trained on BUSI dataset and is tested on BUSIS dataset, by fine-tuning. The model achieved similar results as highlighted in Table 2 and Table 3. This indicates that the proposed model can adapt to a new dataset by just fine-tuning without compromising the performance.
6 Conclusion
This article proposes a deep learning based model, residual cross-spatial attention inception U-Net (RCA-IUnet), for breast tumor segmentation in ultrasound imaging. The RCA-IUnet model is designed with a state-of-the-art U-Net model that uses residual inception depth-wise separable convolution and hybrid pooling (max pooling and spectral pooling) layers along with the cross-spatial attention filter in the long skip connections to better propagate and extract the feature maps concerning the tumor region. With exhaustive trials, the proposed model achieved significant improvement over the state-of-the-art models with minimal training parameters and inference time on two publicly available datasets to generate tumor segmentation mask. Moreover, the ablation study describes the significance of each component of the model towards tumor segmentation, where residual inception convolution (RIC) and cross-spatial attention (CSA) components displayed a major contribution in the achieved results. As an extension, the attention component could further be improved by incorporating a channel attention filter to focus on most relevant feature layers. Overall the performance of the model could further be improved by incorporating deeper feature extraction layers, hybrid or ensemble learning leading towards better feature representation for tumor regions. Besides, the scope of this model is not limited to tumor segmentation in breast ultrasound imaging, it can also provide potentially useful results with other modalities for biomedical image segmentation.
Acknowledgment
We thank our institute, Indian Institute of Information Technology Allahabad (IIITA), India and Big Data Analytics (BDA) lab for allocating the centralised computing facility and other necessary resources to perform this research. We extend our thanks to our colleagues for their valuable guidance and suggestions.
References
- (1) R. L. Siegel, K. D. Miller, A. Jemal, Cancer statistics, 2019, CA: a cancer journal for clinicians 69 (1) (2019) 7–34.
- (2) H.-D. Cheng, J. Shan, W. Ju, Y. Guo, L. Zhang, Automated breast cancer detection and classification using ultrasound images: A survey, Pattern recognition 43 (1) (2010) 299–317.
- (3) M. Xian, Y. Zhang, H.-D. Cheng, F. Xu, B. Zhang, J. Ding, Automatic breast ultrasound image segmentation: A survey, Pattern Recognition 79 (2018) 340–355.
- (4) I. R. I. Haque, J. Neubert, Deep learning approaches to biomedical image segmentation, Informatics in Medicine Unlocked 18 (2020) 100297.
- (5) N. S. Punn, S. Agarwal, Inception u-net architecture for semantic segmentation to identify nuclei in microscopy cell images, ACM Transactions on Multimedia Computing, Communications, and Applications (TOMM) 16 (1) (2020) 1–15.
- (6) O. Oktay, J. Schlemper, L. L. Folgoc, M. Lee, M. Heinrich, K. Misawa, K. Mori, S. McDonagh, N. Y. Hammerla, B. Kainz, et al., Attention u-net: Learning where to look for the pancreas, arXiv preprint arXiv:1804.03999 (2018).
- (7) S. Dong, J. Zhao, M. Zhang, Z. Shi, J. Deng, Y. Shi, M. Tian, C. Zhuo, Deu-net: Deformable u-net for 3d cardiac mri video segmentation, in: International Conference on Medical Image Computing and Computer-Assisted Intervention, Springer, 2020, pp. 98–107.
- (8) O. Ronneberger, P. Fischer, T. Brox, U-net: Convolutional networks for biomedical image segmentation, in: International Conference on Medical image computing and computer-assisted intervention, Springer, 2015, pp. 234–241.
- (9) R. Bhardwaj, A. R. Nambiar, D. Dutta, A study of machine learning in healthcare, 2017 IEEE 41st Annual Computer Software and Applications Conference (COMPSAC) 02 (2017) 236–241.
- (10) J. Shan, H.-D. Cheng, Y. Wang, A novel automatic seed point selection algorithm for breast ultrasound images, in: 2008 19th International Conference on Pattern Recognition, IEEE, 2008, pp. 1–4.
- (11) S. Joo, Y. S. Yang, W. K. Moon, H. C. Kim, Computer-aided diagnosis of solid breast nodules: use of an artificial neural network based on multiple sonographic features, IEEE transactions on medical imaging 23 (10) (2004) 1292–1300.
- (12) Y.-L. Huang, D.-R. Chen, Automatic contouring for breast tumors in 2-d sonography, in: 2005 IEEE Engineering in Medicine and Biology 27th Annual Conference, IEEE, 2006, pp. 3225–3228.
- (13) J. Shan, H. Cheng, Y. Wang, Completely automated segmentation approach for breast ultrasound images using multiple-domain features, Ultrasound in medicine & biology 38 (2) (2012) 262–275.
- (14) N. Torbati, A. Ayatollahi, A. Kermani, An efficient neural network based method for medical image segmentation, Computers in biology and medicine 44 (2014) 76–87.
- (15) J.-Z. Cheng, D. Ni, Y.-H. Chou, J. Qin, C.-M. Tiu, Y.-C. Chang, C.-S. Huang, D. Shen, C.-M. Chen, Computer-aided diagnosis with deep learning architecture: applications to breast lesions in us images and pulmonary nodules in ct scans, Scientific reports 6 (1) (2016) 1–13.
- (16) C. Tan, F. Sun, T. Kong, W. Zhang, C. Yang, C. Liu, A survey on deep transfer learning, in: International conference on artificial neural networks, Springer, 2018, pp. 270–279.
- (17) B. Huynh, K. Drukker, M. Giger, Mo-de-207b-06: Computer-aided diagnosis of breast ultrasound images using transfer learning from deep convolutional neural networks, Medical physics 43 (6Part30) (2016) 3705–3705.
- (18) T. Fujioka, K. Kubota, M. Mori, Y. Kikuchi, L. Katsuta, M. Kasahara, G. Oda, T. Ishiba, T. Nakagawa, U. Tateishi, Distinction between benign and malignant breast masses at breast ultrasound using deep learning method with convolutional neural network, Japanese journal of radiology 37 (6) (2019) 466–472.
- (19) C. Szegedy, W. Liu, Y. Jia, P. Sermanet, S. Reed, D. Anguelov, D. Erhan, V. Vanhoucke, A. Rabinovich, Going deeper with convolutions, in: Proceedings of the IEEE conference on computer vision and pattern recognition, 2015, pp. 1–9.
- (20) M. H. Yap, G. Pons, J. Marti, S. Ganau, M. Sentis, R. Zwiggelaar, A. K. Davison, R. Marti, Automated breast ultrasound lesions detection using convolutional neural networks, IEEE journal of biomedical and health informatics 22 (4) (2017) 1218–1226.
- (21) Q. Huang, Y. Huang, Y. Luo, F. Yuan, X. Li, Segmentation of breast ultrasound image with semantic classification of superpixels, Medical image analysis 61 (2020) 101657.
- (22) A. E. Ilesanmi, O. P. Idowu, S. S. Makhanov, Multiscale superpixel method for segmentation of breast ultrasound, Computers in Biology and Medicine 125 (2020) 103879.
- (23) A. Vaswani, N. Shazeer, N. Parmar, J. Uszkoreit, L. Jones, A. N. Gomez, L. Kaiser, I. Polosukhin, Attention is all you need, arXiv preprint arXiv:1706.03762 (2017).
- (24) H. Lee, J. Park, J. Y. Hwang, Channel attention module with multiscale grid average pooling for breast cancer segmentation in an ultrasound image, IEEE transactions on ultrasonics, ferroelectrics, and frequency control 67 (7) (2020) 1344–1353.
- (25) S. Woo, J. Park, J.-Y. Lee, I. S. Kweon, Cbam: Convolutional block attention module, in: Proceedings of the European conference on computer vision (ECCV), 2018, pp. 3–19.
- (26) F. Chollet, Xception: Deep learning with depthwise separable convolutions, in: Proceedings of the IEEE conference on computer vision and pattern recognition, 2017, pp. 1251–1258.
- (27) N. Akhtar, U. Ragavendran, Interpretation of intelligence in cnn-pooling processes: a methodological survey, Neural Computing and Applications 32 (3) (2020) 879–898.
- (28) O. Rippel, J. Snoek, R. P. Adams, Spectral representations for convolutional neural networks, arXiv preprint arXiv:1506.03767 (2015).
- (29) N. S. Punn, S. Agarwal, Multi-modality encoded fusion with 3d inception u-net and decoder model for brain tumor segmentation, Multimedia Tools and Applications (2020) 1–16.
- (30) W. Luo, Y. Li, R. Urtasun, R. Zemel, Understanding the effective receptive field in deep convolutional neural networks, arXiv preprint arXiv:1701.04128 (2017).
- (31) V. Badrinarayanan, A. Kendall, R. Cipolla, Segnet: A deep convolutional encoder-decoder architecture for image segmentation, IEEE transactions on pattern analysis and machine intelligence 39 (12) (2017) 2481–2495.
- (32) Z. Zhou, M. M. R. Siddiquee, N. Tajbakhsh, J. Liang, Unet++: A nested u-net architecture for medical image segmentation, in: Deep learning in medical image analysis and multimodal learning for clinical decision support, Springer, 2018, pp. 3–11.
- (33) F. Yu, D. Wang, E. Shelhamer, T. Darrell, Deep layer aggregation, in: Proceedings of the IEEE conference on computer vision and pattern recognition, 2018, pp. 2403–2412.
- (34) K. He, X. Zhang, S. Ren, J. Sun, Deep residual learning for image recognition, in: Proceedings of the IEEE conference on computer vision and pattern recognition, 2016, pp. 770–778.
- (35) M. Xian, Y. Zhang, H.-D. Cheng, F. Xu, K. Huang, B. Zhang, J. Ding, C. Ning, Y. Wang, A benchmark for breast ultrasound image segmentation (BUSIS), Infinite Study.
- (36) W. Al-Dhabyani, M. Gomaa, H. Khaled, A. Fahmy, Dataset of breast ultrasound images, Data in brief 28 (2020) 104863.
- (37) S. Ruder, An overview of gradient descent optimization algorithms, arXiv preprint arXiv:1609.04747 (2016).
- (38) A. Geifman, The correct way to measure inference time of deep neural networks, https://deci.ai/resources/blog/measure-inference-time-deep-neural-networks/, [Online; accessed October 23, 2021] (2020).