First tidal disruption events discovered by SRG/eROSITA: X-ray/optical properties and X-ray luminosity function at
Abstract
We present the first sample of tidal disruption events (TDEs) discovered during the SRG all-sky survey. These 13 events were selected among X-ray transients detected in the hemisphere by eROSITA during its second sky survey (10 June – 14 December 2020) and confirmed by optical follow-up observations. The most distant event occurred at . One TDE continued to brighten at least 6 months. The X-ray spectra are consistent with nearly critical accretion onto black holes of a few to , although supercritical accretion is possibly taking place. In two TDEs, a spectral hardening is observed 6 months after the discovery. Four TDEs showed an optical brightening apart from the X-ray outburst. The other 9 TDEs demonstrate no optical activity. All 13 TDEs are optically faint, with ( and being the -band and 0.2–6 keV luminosity, respectively). We have constructed a TDE X-ray luminosity function, which can be fit by a power law with a slope of , similar to the trend observed for optically selected TDEs. The total rate is estimated at TDEs per galaxy per year, an order of magnitude lower than inferred from optical studies. This suggests that X-ray bright events constitute a minority of TDEs, consistent with models predicting that X-rays can only be observed from directions close to the axis of a thick accretion disk formed from the stellar debris. Our TDE detection threshold can be lowered by a factor of , which should allow a detection of TDEs by the end of the SRG survey.
keywords:
transients: tidal disruption events – accretion, accretion discs – black hole physics – (galaxies:) quasars: supermassive black holes – X-rays: galaxies1 Introduction
Stellar disruptions by the gravitation of supermassive black holes (SMBHs) – tidal disruption events (TDEs) – provide valuable and largely unique information on relatively small () SMBHs in, usually, dormant galactic nuclei and allow us to explore various regimes of accretion onto black holes. Predicted by theorists (Hills, 1975; Lidskii & Ozernoi, 1979; Gurzadian & Ozernoi, 1981; Rees, 1988), TDEs were first discovered as soft X-ray transients (Komossa & Bade, 1999) by the ROSAT satellite during its all-sky survey in 1990–1991. Soft X-ray emission is one of two expected distinctive features (together with a flux decline) of TDEs, since the thermal emission of an accretion disk that forms around the SMBH from the debris of the disrupted star is expected to have a characteristic temperature of K. Accordingly, X-ray searches remained the main channel of discovering TDEs until recently (e.g. Donley et al. 2002; Esquej et al. 2008; Maksym et al. 2010; Khabibullin & Sazonov 2014), and the current list of TDEs discovered in X-rays comprises some 20 events (see Saxton et al. 2021 for a recent review).
In the last years, a new influx of TDE discoveries has emerged from optical/UV surveys, which have provided an additional sample of TDEs that is comparable in size to the X-ray based one (e.g., van Velzen et al. 2011; Gezari et al. 2012; Blagorodnova et al. 2019; Holoien et al. 2019; van Velzen et al. 2020; van Velzen et al. 2021b). Interestingly, these optical/UV selected objects seem to have, on average, quite different properties compared to the X-ray selected ones. Specifically, the spectral energy distribution (SED) of the former can be described to a first approximation as thermal emission with a temperature K, which is at least an order of magnitude lower than expected for near-Eddington standard accretion disks (Shakura & Sunyaev, 1973) around moderately massive black holes.
This apparent dichotomy in TDE SEDs resembles the distinction between type 1 and type 2 active galactic nuclei (AGN), which has led to suggestions that we might be dealing with a similar orientation-driven effect. In particular, it was proposed (Dai et al., 2018; Curd & Narayan, 2019) that X-ray rich TDEs are observed from directions close to the axis of a thick accretion disk with a powerful wind, whereas X-ray weak ones are viewed from larger inclination angles. In the latter case, the central X-ray source is obscured by the disk so that we can only see the reprocessed optical/UV emission. However, in addition to the viewing direction, other factors, in particular the black hole mass, are also likely to strongly affect TDE SEDs and light curves (Mummery, 2021). In other proposed models, the conversion of the accretion disk emission to optical wavelengths occurs in the unbound part of the stellar debris (Metzger & Stone, 2016; Lu & Bonnerot, 2020), or the optical emission is directly powered by energy liberated during the formation of the accretion disk rather than by energy released during subsequent accretion onto the black hole (Piran et al., 2015).
It is clear that more observational data in various energy bands are needed for a better understanding of the physics of the TDE phenomenon. Therefore, the launch of the eROSITA telescope (Predehl et al., 2021) on board the SRG observatory (Sunyaev et al., 2021) was eagerly awaited, because it was expected to find hundreds to thousands of TDEs during its revolutionary all-sky X-ray survey (Khabibullin et al., 2014). On 13 July 2019, SRG was successfully launched from the Baikonur Cosmodrome and on 12 December 2019 it started its all-sky X-ray survey from a halo orbit around the Sun–Earth L2 point. The survey is to consist of 8 consecutive full scans of the sky, each lasting 6 months. Already during the first weeks of the survey a few TDE candidates were found in the eROSITA data through comparison with archival observations by previous X-ray missions (Khabibullin et al., 2020a, b). On 10 June 2020, the second eROSITA all-sky survey began, which allowed us to begin a regular search for TDEs over the sky. Specifically, TDE candidates are sought among the multitude of transient X-ray sources detected in a given eROSITA all-sky survey and undetected in the preceding survey. The second all-sky survey was completed on 14 Dec. 2020, and the third survey has also been finished by now.
In this paper, we present an initial sample of 13 relatively bright TDEs discovered by SRG/eROSITA during its second all-sky survey at 111Analysis of eROSITA data in this half of the sky is performed by the Russian eROSITA consortium.. The TDE nature of these transients was suggested by their X-ray properties and then confirmed by our follow-up optical observations. Below we discuss the X-ray and optical properties of this TDE sample and use it to draw inferences on the statistical properties of TDEs in the Universe.
In what follows we adopt a flat cold dark matter cosmological model with and .
2 Selection of TDE candidates
| No. | X-ray source | 1 | eRASS1: | eRASS2: | eRASS3: | |||
|---|---|---|---|---|---|---|---|---|
| Dates | X-ray flux2 | Dates | X-ray flux | Dates | X-ray flux | |||
| 1 | SRGE J135514.8+311605 | 2019 Dec 22–24 | 2020 Jun 23–24 | 2020 Dec 24–25 | ||||
| 2 | SRGE J013204.6+122236 | 2020 Jan 08–09 | 2020 Jul 08–09 | 2021 Jan 07–08 | ||||
| 3 | SRGE J153503.4+455056 | 2020 Jan 11–14 | 2020 Jul 13–16 | 2021 Jan 09–11 | ||||
| 4 | SRGE J163831.7+534020 | 2020 Jan 30–04 | 2020 Aug 01–08 | 2021 Jan 22–26 | ||||
| 5 | SRGE J163030.2+470125 | 2020 Feb 08–16 | 2020 Aug 06–14 | 2021 Jan 29–31 | ||||
| 6 | SRGE J021939.9+361819 | 2020 Feb 05–07 | 2020 Aug 07–09 | 2021 Jan 27–28 | ||||
| 7 | SRGE J161001.2+330121 | 2020 Feb 12–18 | 2020 Aug 14–16 | 2021 Feb 01–02 | ||||
| 8 | SRGE J171423.6+085236 | 2020 Mar 18–19 | 2020 Sep 18–19 | 2021 Mar 14–16 | ||||
| 9 | SRGE J071310.6+725627 | 2020 Apr 07–08 | 2020 Oct 11–12 | 2021 Apr 06–07 | ||||
| 10 | SRGE J095928.6+643023 | 2020 Apr 25–26 | 2020 Oct 28–29 | 2021 Apr 28–30 | ||||
| 11 | SRGE J091747.6+524821 | 2020 Apr 26–27 | 2020 Oct 28–29 | 2021 Apr 29–30 | ||||
| 12 | SRGE J133053.3+734824 | 2020 May 01–03 | 2020 Nov 02–04 | 2021 May 05–07 | ||||
| 13 | SRGE J144738.4+671821 | 2020 May 20–22 | 2020 Nov 19–21 | 2021 May 20–22 | ||||
Notes: (1) Radius of the 98% localization region in eRASS2 in units of arcsec; (2) observed fluxes or upper limits (3) in the 0.3–2.2 keV energy band in units of erg s-1 cm-2.
The initial sample of X-ray transients for this pilot study consisted of sources that were undetected in the first eROSITA all-sky survey (hereafter eRASS1) but were detected during the second scan (hereafter eRASS2) at a flux level exceeding at least tenfold the upper limit at a likelihood of 6 () on their flux in the 0.3–2.2 keV energy band during eRASS1. The search for transients spanned the entire period of eRASS2 (10 June – 14 Dec. 2020). By the time of this writing, all transients found in eRASS2 have been scanned by eROSITA for the third time during eRASS3.
Among these X-ray transients, we filtered out objects of likely Galactic origin based on positional coincidence of the X-ray source with a star having a statistically significant () parallax and/or proper motion in the Gaia astrometric catalog (Gaia Collaboration et al., 2016, 2021). For the majority of the remaining, potentially extragalactic, objects, a likely counterpart was readily found in archival optical and/or infrared images within the eROSITA localization region (of arcsec radius). Some of these counterparts are known AGN or have signatures suggestive of an AGN origin, namely, archival detections by previous X-ray missions, a color (Assef et al., 2013) in the WISE infrared all-sky survey (Wright et al., 2010), or irregular optical variability in the Zwicky Transient Facility (ZTF; Bellm et al. 2019; Graham et al. 2019; Masci et al. 2019) data many months before the eROSITA X-ray discovery. In addition, we analyzed the eROSITA data and found that a number of transients had very soft X-ray spectra, suggesting a TDE origin.
For a final identification, we have been following up the presumably extragalactic eROSITA transients detected in eRASS2, apart from the indisputable AGN, with optical spectroscopy (§4). This campaign has now come to an end and allowed us to discriminate TDEs from AGN. The new AGN discovered during this campaign will be discussed elsewhere.
As a result, we have obtained a sample of firmly established TDEs detected at during eRASS2. The limiting X-ray flux of our sample varies across the sky depending on the sensitivity achieved at a given location in the first SRG sky survey. In the present paper, we discuss the 13 events from this catalog that have revealed themselves as bright transients in X-rays only (although a few of them also showed moderate activity in the optical, as will be discussed in §4). In a companion paper (Gilfanov et al., in preparation), we discuss the subset of eROSITA TDEs with prominent optical transient counterparts.
3 The sample and its X-ray properties
Table 1 presents our TDE sample. Specifically, the following information is provided: (1) the source name in the eROSITA catalog (“SRGE” followed by the equatorial coordinates of the source measured in eRASS2), (2) the radius of the localization region (at the 98% confidence level) in eRASS2, (3) the dates when the source was scanned during eRASS1, (4) the upper limit (3) on the source flux (0.3–2.2 keV) during this period, (5) the dates when the source was scanned during eRASS2, (6) the average X-ray flux during this period, (7) the dates when the source was scanned during eRASS3, and (8) the average X-ray flux or 3 upper limit for this period. The fluxes and upper limits were determined from the measured count rates using the results of our X-ray spectral analysis, discussed in §3.3 below, namely the best-fitting parameters of eRASS2 and eRASS3 spectra by a multi-blackbody accretion disk emission model if available or the corresponding eRASS2 spectral parameters in the remaining cases.
Weak, marginally significant () X-ray emission at the position of SRGE J135514.8+311605 was registered by eROSITA during eRASS1. This emission may be associated with a quasar (which was revealed by our follow-up optical spectroscopy), J135514.83+311612.7, that is located 8″ away, i.e. close to the eROSITA localization region of SRGE J135514.8+311605. In computing the upper limit on the eRASS1 flux of this TDE, we took into account all counts registered near this source.
3.1 Data reduction
eROSITA raw data were processed by the calibration pipeline developed at IKI based on the eROSITA Science Analysis Software System (eSASS222https://erosita.mpe.mpg.de/, Brunner et al. 2021) and using early in-flight calibration data. Source spectra and light curves were extracted using a circular aperture of 60″ (corresponding to 90% encircled energy) centered on the best-fitting X-ray source position. An annulus with the inner and outer radii of 150″ and 450″ around the source position was used for background extraction. Any faint sources detected in the background extraction area were masked out using a 15″ circular mask.
We took advantage of the soft X-ray response of eROSITA to perform an X-ray spectral analysis of the TDEs in the 0.2–6 keV energy band. To this end, we used the 5 (out of 7) telescope modules that are equipped with the on-chip filter. Source detection and construction of X-ray light curves was done in the 0.3–2.2 keV energy band, using the data from all operational telescope modules.
The spectral analysis was done using xspec, version 12.11.1 (Arnaud, 1996). The quality of spectral fits was accessed using W-statistic for the source and background spectra with Poisson statistics. To avoid the well-known bias in a profile likelihood, we bin the source spectrum so that every bin in the corresponding background spectrum contains at least 5 counts. The binning was done using the ftgrouppha tool of the HEASoft package (v. 6.28). Errors for the best-fitting parameters are quoted at the 90% confidence level.
3.2 X-ray light curves
| Object | , month |
|---|---|
| SRGE J135514.8+311605 | |
| SRGE J013204.6+122236 | |
| SRGE J153503.4+455056 | |
| SRGE J163831.7+534020 | |
| SRGE J163030.2+470125 | |
| SRGE J021939.9+361819 | |
| SRGE J161001.2+330121 | |
| SRGE J171423.6+085236 | |
| SRGE J071310.6+725627 | |
| SRGE J095928.6+643023 | |
| SRGE J091747.6+524821 | |
| SRGE J133053.3+734824 | |
| SRGE J144738.4+671821 | undefined |
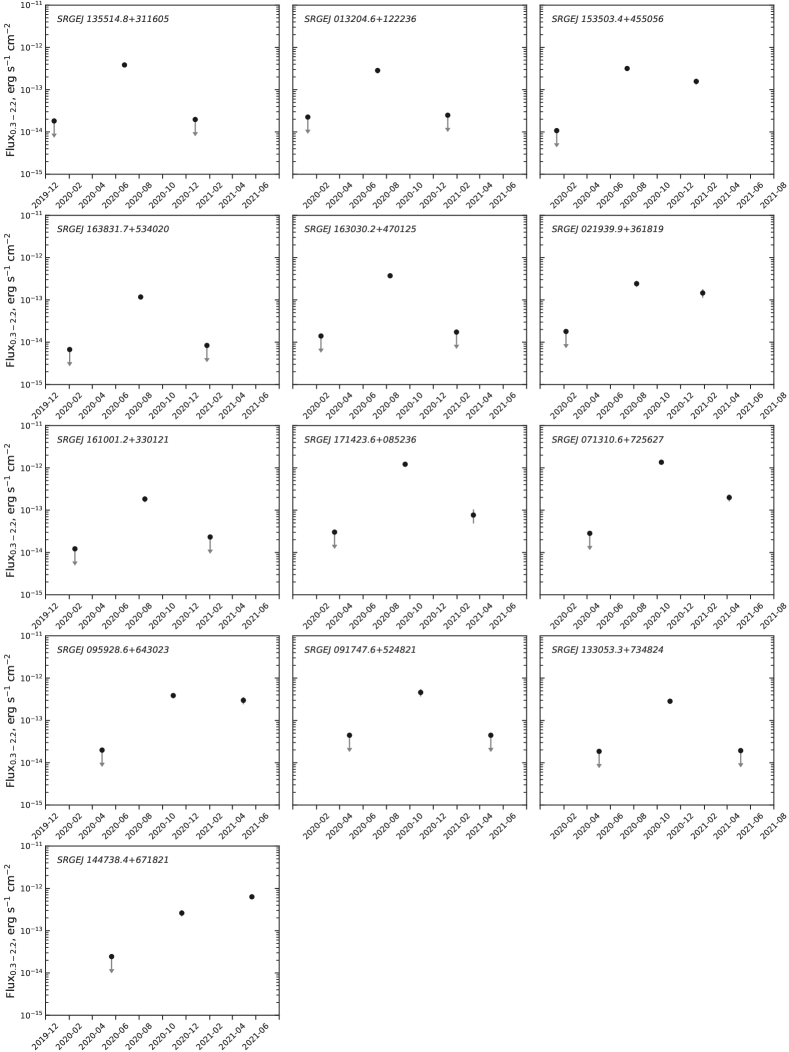
Figure 1 shows the X-ray (0.3–2.2 keV) light curves of the TDEs based on eROSITA data. Specifically, these light curves consist of three flux measurements or upper limits (see Table 1) taken at 6-month intervals during eRASS1, eRASS2, and eRASS3. The fluxes and upper limits for each source were determined from the measured count rates using the spectral parameters derived from our X-ray spectral analysis (see §3.3 below). In addition, we present in Appendix A the short-term X-ray light curves of the TDEs obtained during their visits by eROSITA in eRASS2 and eRASS3, which last between and days. None of the transients have demonstrated substantial variability on these short time scales.
Twelve out of the 13 TDEs have faded during the 6-month interval between their passages by eROSITA in eRASS2 and eRASS3, with 7 of them not detected anymore in the third scan. The amplitude of the flux drop varies between a factor of and . However, SRGE J144738.4+671821 has instead become brighter by a factor of in eRASS3 compared to eRASS2.
Assuming that eROSITA caught all these events at a canonical TDE decay phase (Evans & Kochanek, 1989), we can use the eRASS2 and eRASS3 flux measurements/upper limits to evaluate the time of onset of a given TDE relative to the date of its discovery during eRASS2, . Specifically, we assume that the TDE X-ray light curve consists of an initial rise/peak (possibly supercritical) phase with duration and flux and a subsequent phase when the flux (0.3–2.2 keV) decreases as
| (1) |
The resulting estimates are presented in Table 2. The maximum flux () depends on the unknown , and we thus do not try to estimate it.
For the majority of the TDEs, months, and, moreover, months. This implies that these events started somewhere between their first and second visits by SRG, and in fact shortly before the eRASS2 observations. This is consistent with the non-detection of these transients in eRASS1. However, months for three events. This implies that their X-ray temporal behavior cannot be described by a law and that eROSITA probably caught these TDEs during eRASS2 at a rise/peak phase. An even more extreme case is the already mentioned SRGE J144738.4+671821, which has brightened between eRASS2 and eRASS3.
We stress that the above X-ray variability analysis is currently based on just two flux measurements/upper limits per TDE. As five more scans of the entire sky are planned during the SRG mission, it should be possible to add a few more data points to the X-ray light curves of at least some of these TDEs and draw firmer conclusions about their long-term behavior. Dedicated follow-up observations by other X-ray observatories can also be helpful in studying this unique TDE sample.
The above discussion was based on the assumption that the observed luminosity in the 0.3–2.2 keV band (which corresponds to a factor of harder X-ray band in the TDE rest frame) is proportional to the accretion rate, . In reality, when the accretion rate drops below the critical Eddington rate, the maximum temperature of the accretion disk (Shakura & Sunyaev, 1973) is expected to decline as . As a result, eROSITA should at some point start probing the Wien tail of the disk thermal emission, with the X-ray flux declining exponentially (Lodato & Rossi, 2011). This might affect some of the the eROSITA light curves presented here.
We also note that optically selected TDEs often show dramatic soft X-ray variability in contrast to the smooth power-law decline of the UV/optical light curve (e.g., van Velzen et al. 2021b). In particular, TDEs ASASSN-15oi (Gezari et al., 2017) and AT 2019azh/ASASSN-19dj (Liu et al., 2019; van Velzen et al., 2021b; Hinkle et al., 2021) showed a prominent (by a factor of and , respectively) brightening in X-rays over a period of days since the peak of the initial optical-UV flare, which might be attributed to a delayed formation of an accretion disk. Something similar might have been occuring in SRGE J144738.4+671821, for which we see an X-ray brightening on a day timescale, although there is no evidence of prominent optical activity for this TDE (see §4 below).
| Absorbed power-law model: tbabs*zphabs*zpowerlw | ||||
|---|---|---|---|---|
| Object (SRGE) | cstat/ | |||
| cm-2 | d.o.f | |||
| J135514.8+311605 | 28.5/25 | |||
| J013204.6+122236 | 35.7/43 | |||
| J153503.4+455056 | 68.4/64 | |||
| J163831.7+534020 | 91.1/99 | |||
| J163030.2+470125 | 59.8/77 | |||
| J021939.9+361819 | 19.5/29 | |||
| J161001.2+330121 | 44.9/43 | |||
| J171423.6+085236 | 62.8/55 | |||
| J071310.6+725627 | 27.5/19 | |||
| J095928.6+643023 | 18.6/17 | |||
| J091747.6+524821 | 9.9/20 | |||
| J133053.3+734824 | 36.3/38 | |||
| J144738.4+671821 | 34.9/41 | |||
| Multi-blackbody accretion disk model: tbabs*zashift*diskbb | ||||
| Object (SRGE) | cstat/ | |||
| km | eV | d.o.f | ||
| J135514.8+311605 | 30.3/26 | |||
| J013204.6+122236 | 36.9/44 | |||
| J153503.4+455056 | 69.2/65 | |||
| J163831.7+534020 | 93.5/100 | |||
| J163030.2+470125 | 73.6/78 | |||
| J021939.9+361819 | 20.4/30 | |||
| J161001.2+330121 | 49.4/44 | |||
| J171423.6+085236 | 60.7/56 | |||
| J071310.6+725627 | 26.3/20 | |||
| J095928.6+643023 | 19.4/18 | |||
| J091747.6+524821 | 10.1/21 | |||
| J133053.3+734824 | 30.3/39 | |||
| J144738.4+671821 | 36.3/42 | |||
Notes: a — power-law normalization at 1 keV in the source’s rest frame, in units of photons keV-1 cm-2 s-1.
3.3 X-ray spectra
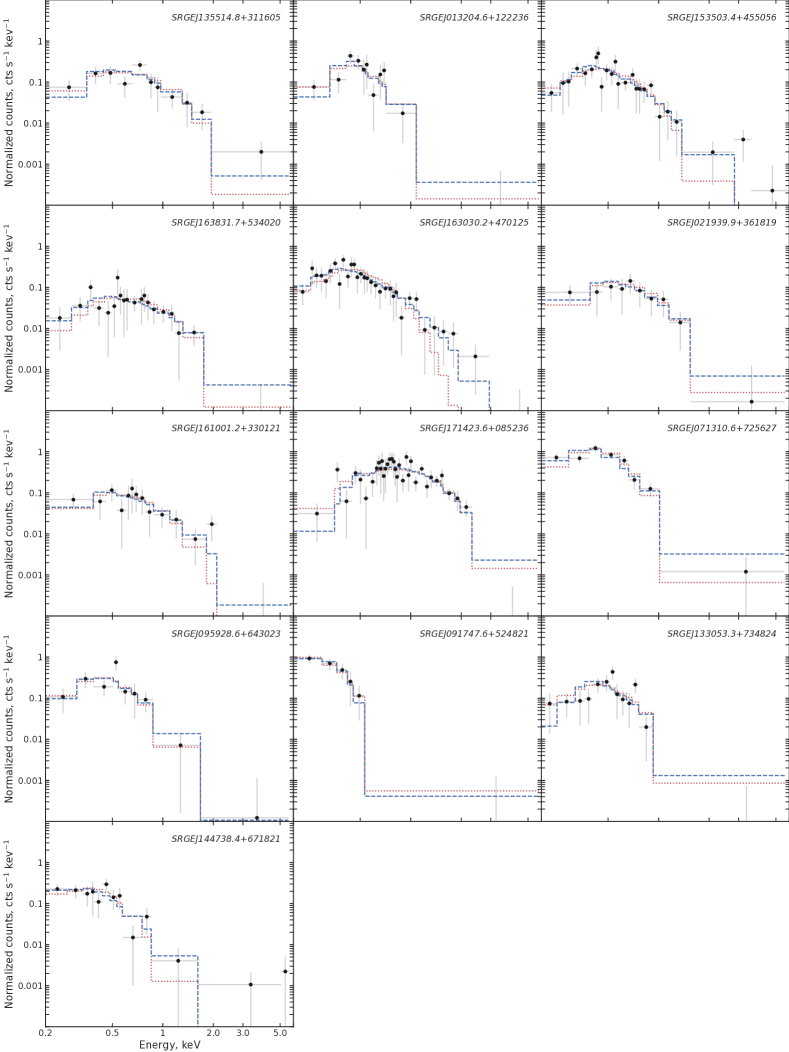
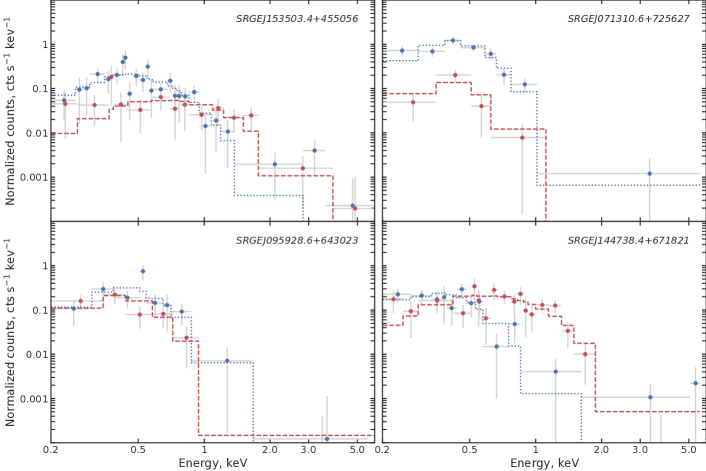
We analyzed the X-ray spectra of the TDEs in their “bright” phase, using the eROSITA data obtained during eRASS2 (Fig. 2). Four transients after their discovery in eRASS2 remained sufficiently bright (at least 30 detector counts) six months later (during eRASS3) to allow us to analyze their spectra obtained at this late phase.
| tbabs*optxagnf | ||||
|---|---|---|---|---|
| Object (SRGE) | cstat/d.o.f | |||
| J135514.8+311605 | 30.4/26 | |||
| J013204.6+122236 | 36.8/44 | |||
| J153503.4+455056 | 69.3/65 | |||
| J163831.7+534020 | 93.5/100 | |||
| J163030.2+470125 | 74.0/78 | |||
| J021939.9+361819 | 20.5/30 | |||
| J161001.2+330121 | 49.4/44 | |||
| J171423.6+085236 | 60.7/56 | |||
| J071310.6+725627 | 26.5/20 | |||
| J095928.6+643023 | 19.4/18 | |||
| J091747.6+524821 | 10.1/21 | |||
| J133053.3+734824 | 30.2/39 | |||
| J144738.4+671821 | 36.4/42 | |||
| J135514.8+311605 | 30.4/26 | |||
| J013204.6+122236 | 36.8/44 | |||
| J153503.4+455056 | 69.3/65 | |||
| J163831.7+534020 | 93.5/100 | |||
| J163030.2+470125 | 74.0/78 | |||
| J021939.9+361819 | 20.4/30 | |||
| J161001.2+330121 | 49.4/44 | |||
| J171423.6+085236 | 60.8/56 | |||
| J071310.6+725627 | 26.5/20 | |||
| J095928.6+643023 | 19.4/18 | |||
| J091747.6+524821 | 10.1/21 | |||
| J133053.3+734824 | 30.2/39 | |||
| J144738.4+671821 | 36.4/42 | |||
3.3.1 Simple models
We first tried to describe the spectra by two alternative simple models, modified by Galactic and intrinsic absorption: (i) power law (tbabs*zphabs*zpowerlw) and (ii) multi-blackbody accretion disk emission (tbabs*zphabs*zashift*diskbb). The Galactic absorption was adopted from the HI4PI survey (HI4PI Collaboration et al., 2016), while the redshifts of the TDEs have been measured during our optical spectroscopy program (see §4 below).
Most of the studied spectra can be described similarly well by the power-law and accretion disk models, with some intrinsic absorption ( cm-2) required for the former. Intrinsic absorption does not improve the quality of approximation of the spectra by diskbb, i.e. is consistent with zero for this model. We thus omitted intrinsic absorption from subsequent consideration. The best-fitting parameters of the two models applied to the eRASS2 spectra are given in Table 3.
The inferred temperatures at the inner boundary of the accretion disk vary between keV for SRGE J091747.6+524821 and keV for SRGE J171423.6+085236. The significantly better fit quality provided by the power-law model compared to diskbb for SRGE J163030.2+470125 suggests the presence of a harder component in addition to the soft thermal emission in the spectrum of this object, which is possibly associated with comptonized emission from a hot corona of the accretion disk.
3.3.2 Black hole masses and Eddington ratios
| Absorbed power-law model: tbabs*zphabs*zpowerlw | ||||
| Object (SRGE) | cstat | |||
| cm-2 | d.o.f | |||
| J153503.4+455056 | 47.9/42 | |||
| J071310.6+725627 | 8.7/19 | |||
| J095928.6+643023 | 8.5/16 | |||
| J144738.4+671821 | 34.9/27 | |||
| Multi-blackbody accretion disk model: tbabs*zashift*diskbb | ||||
| Object (SRGE) | cstat/ | |||
| km | eV | d.o.f | ||
| J153503.4+455056 | 52.1/43 | |||
| J071310.6+725627 | 12.6/20 | |||
| J095928.6+643023 | 10.9/17 | |||
| J144738.4+671821 | 30.5/28 | |||
| Color temperature corrected disk model: tbabs*optxagnf | ||||
| Object (SRGE) | cstat | |||
| d.o.f | ||||
| J153503.4+455056 | 52.1/43 | |||
| J071310.6+725627 | 12.6/20 | |||
| J095928.6+643023 | 10.9/17 | |||
| J144738.4+671821 | 30.5/28 | |||
| J153503.4+455056 | 52.0/43 | |||
| J071310.6+725627 | 12.6/20 | |||
| J095928.6+643023 | 10.9/17 | |||
| J144738.4+671821 | 30.4/28 | |||
a — power-law normalization at 1 keV in the source’s rest frame, in units of photons keV-1 cm-2 s-1.
Under the assumption that the X-ray emission in TDEs is produced in a standard accretion disk (Shakura & Sunyaev, 1973), the diskbb model (Makishima et al., 1986) is more physically motivated than powerlaw. However, the real situation is likely more complicated. First, the shape of the spectrum emergent from a standard accretion disk can significantly deviate from a sum of blackbodies (e.g. Koratkar & Blaes 1999; Davis et al. 2005), assumed in diskbb. Second, at least some of the TDEs discussed here may have been caught by eROSITA in their early super-Eddington phase, when the accretion disk is expected to be geometrically thick, with the radial distribution of X-ray surface brightness being different than in the case of a thin disk (Shakura & Sunyaev, 1973; Abramowicz et al., 1988; Watarai et al., 2000). Finally, general relativity can significantly affect the properties of emission from the inner accretion disk (e.g. Wen et al. 2021). On the other hand, at a later stage in the evolution of a TDE, the X-ray spectrum might experience a transition from a purely thermal state to a combination of thermal and comptonized emission, as suggested by our knowledge of X-ray binary systems and AGN and has been observed in a number of TDEs (e.g. Komossa et al. 2004; Jonker et al. 2020; Wevers 2020; Wevers et al. 2021).
We thus next tried to describe the eROSITA spectra by the optxagnf model (Done et al., 2012), designed for AGN SEDs. In its simplest version, it represents the spectrum of emission from a standard (i.e. geometrically thin and optically thick) accretion disk around a SMBH, taking into account the expected deviations from a simple multitemperature blackbody shape due to the incomplete thermalization of the radiation in the disk. The main parameters of the model are black hole mass (), spin (), and accretion rate in terms of the Eddington critical luminosity (). Essentially, this model is a modification of diskbb, with the blackbody spectrum of each annulus of the disk modified by a temperature-dependent hardening factor . In addition, it takes into account the radiative efficiency of the accretion disk as a function of spin (Novikov & Thorne, 1973). As a result, optxagnf retains the key property of the diskbb model that, for a given , the peak energy of the spectrum is proportional to (Shakura & Sunyaev, 1973), while the observed bolometric flux is of course proportional to (divided by the distance squared). Therefore, by fitting a measured spectrum by optxagnf it is possible to infer both and for an assumed .
We note, however, that optxagnf is not applicable to the case of a slim accretion disk. Hence, whenever our spectral analysis implies a super-Eddington accretion rate for a given TDE, the inferred parameter values should be taken with great caution.
The best fits of the eRASS2 spectra by the optxagnf model are shown in Fig. 2 in comparison with those by the power-law model. The quality of approximation by the optxagnf model proves to be nearly insensitive to the black hole spin. We thus fixed this parameter at two extreme values: (Schwarzschild black hole) and (maximally rotating Kerr black hole)333Assuming that the accretion disk rotates in the same direction as the black hole.. The resulting best-fitting parameters are given in Table 4. The quality of approximation by the optxagnf model is nearly identical to that by the diskbb model (Table 3), which is not surprizing since both models describe multi-blackbody accretion disk emission.
As seen from Table 4, the black hole mass for each of our objects may range by a factor of depending on the unknown spin of the black hole, with increasing with . The corresponding accretion rates are close to the Eddington limit if the black holes are rapidly spinning () and are supercritical if the rotation is not extreme. As already noted, the inferred parameter values, including the black hole masses, become unreliable in the latter case.
Although our X-ray spectral analysis is admittedly simplistic, we can nonetheless conclude that the available X-ray spectral data are consistent with the studied events being stellar disruptions by black holes with masses between and .
3.3.3 Late-phase X-ray spectra
As was mentioned before, we have also analyzed the spectra of four TDEs obtained in eRASS3, six months after the discovery of these transients by eROSITA. These spectra are compared in Fig. 3 with the corresponding spectra taken during eRASS2. We similarly applied the absorbed power-law, multi-blackbody accretion disk, and the color temperature corrected disk models to these late-phase TDE spectra; see the resulting best-fitting parameters in Table 5.
Individual TDEs show significantly different evolution. In the case of SRGE J071310.6+725627 and SRGE J095928.6+643023, the black hole masses estimated from the late-phase spectra are consistent with those inferred from the early-phase ones and the observed spectral evolution can be accounted for by moderate decreases in the accretion rates.
The situation is quite different for SRGE J153503.4+455056. Here, fitting the eRASS3 spectrum by optxagnf leads to a much lower black hole mass compared to the eRASS2 spectrum, which indicates that this model is inadequate for description of the observed spectral evolution. We might be witnessing a change from purely thermal accretion disk emission to a harder spectral state, where a major contribution is provided by comptonized emission associated with a freshly formed hot corona of the accretion disk. This is also suggested by the somewhat better fit quality provided by the power-law model compared to optxagnf for the eRASS3 spectrum (see Table 5).
The least clear situation is with SRGE J144738.4+671821. Here too, the eRASS3 spectrum is much harder than the eRASS2 one and the early- and late-phase estimates are inconsistent with each other, despite the good fit quality provided by the optxagnf model for both spectra. We recall that this TDE is unique in that eROSITA seems to have caught it during an usually long rising phase, so that it has become brighter in eRASS3 compared to eRASS2. Hopefully, if SRGE J144738.4+671821 remains bright in several subsequent SRG/eROSITA scans, we will be able to better understand its spectral evolution and nature.
| Object (SRGE) | Date | Telescope | Exposure (s), | mg | mr | mi |
|---|---|---|---|---|---|---|
| J135514.8+311605 | 2020 July 21 | RTT150 | 1060, 1060, 1060 | 20.490.07 | 19.600.04 | 19.130.05 |
| J153503.4+455056 | 2020 July 23–27 | CMO | 4200, 8200+4300, 200+3300 | 20.060.05 | 19.020.03 | 18.550.05 |
| 2020 Aug. 5 | CMO | 3200, 3200+2300, 9200 | 20.010.05 | 19.020.02 | 18.540.04 | |
| 2020 Sept. 17 | CMO | 3300, 4300, 3300 | 20.090.02 | 19.020.01 | 18.490.01 | |
| J163030.2+470125 | 2020 Oct. 17 | BTA | 440, 440, 440 | 21.450.08 | 20.420.06 | 20.040.06 |
| J161001.2+330121 | 2021 Mar. 12 | RTT150 | 2300, 3300, 2300 | 19.280.01 | 18.510.01 | 18.110.01 |
| J171423.6+085236 | 2020 Oct. 18 | CMO RC600 | 2200, 13200, 2200 | 16.900.03 | 16.020.02 | 15.570.06 |
| 2020 Oct. 21 | CMO RC600 | 8240, 3240, 3240 | 16.860.02 | 16.000.03 | 15.590.02 | |
| J095928.6+643023 | 2021 Mar. 10 | AZT-33IK | 1890, 1890, 1890 | 23.340.22 | 22.310.11 | 22.230.13 |
| Object (SRGE) | Date | Telescope | Exp. (s) |
|---|---|---|---|
| J135514.8+311605 | 2020 Dec. 17 | BTA | 4900 |
| 2021 Jun. 7 | Keck-I | 435 | |
| J013204.6+122236 | 2021 Jul. 6 | Keck-I | 600 |
| J153503.4+455056 | 2020 Sep. 16–20 | CMO | 211200 |
| 2021 May 13 | Keck-I | 570 | |
| J163831.7+534020 | 2021 Apr. 14 | Keck-I | 1250 |
| J163030.2+470125 | 2020 Oct. 17 | BTA | 4900 |
| 2021 Jun. 7 | Keck-I | 1010 | |
| J021939.9+361819 | 2021 Jul. 6 | Keck-I | 750 |
| J161001.2+330121 | 2021 Apr. 14 | Keck-I | 300 |
| J171423.6+085236 | 2020 Oct. 18, 21 | CMO | 21200 |
| 2021 Jun. 7 | Keck-I | 280 | |
| J071310.6+725627 | 2020 Nov. 11–12 | AZT-33IK | 7600 |
| 2020 Nov. 20 | Keck-I | 900 | |
| J095928.6+643023 | 2021 May 13 | Keck-I | 2500 |
| J091747.6+524821 | 2021 Apr. 14 | Keck-I | 600 |
| J133053.3+734824 | 2021 Apr. 14 | Keck-I | 400 |
| J144738.4+671821 | 2021 Mar. 11 | AZT-33IK | 5600 |
| 2021 Apr. 14 | Keck-I | 300 |
4 Optical/infared properties
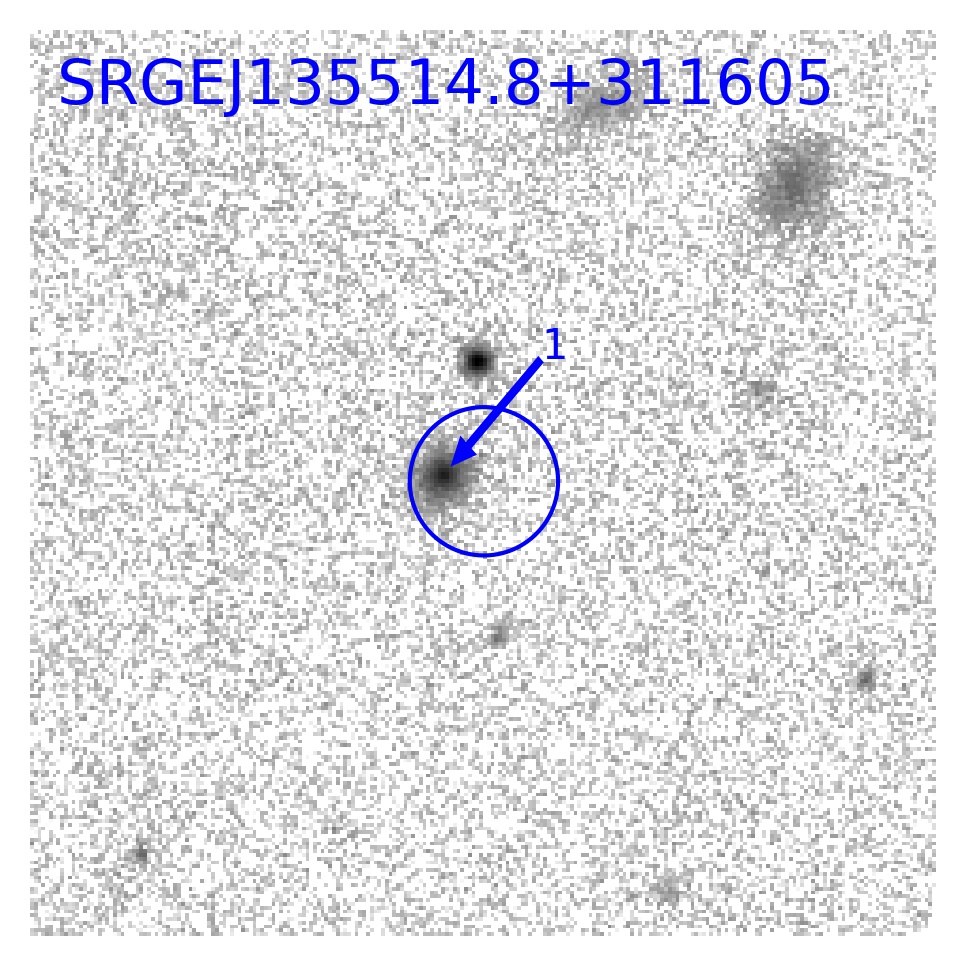
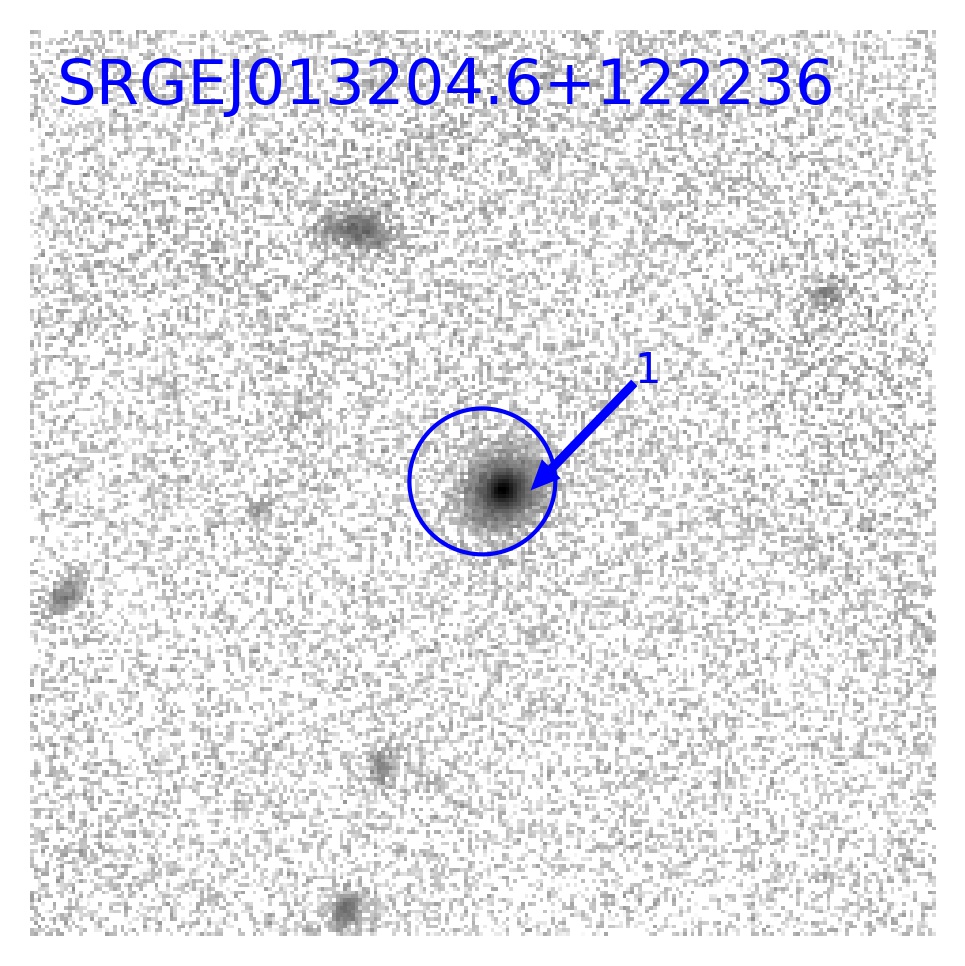
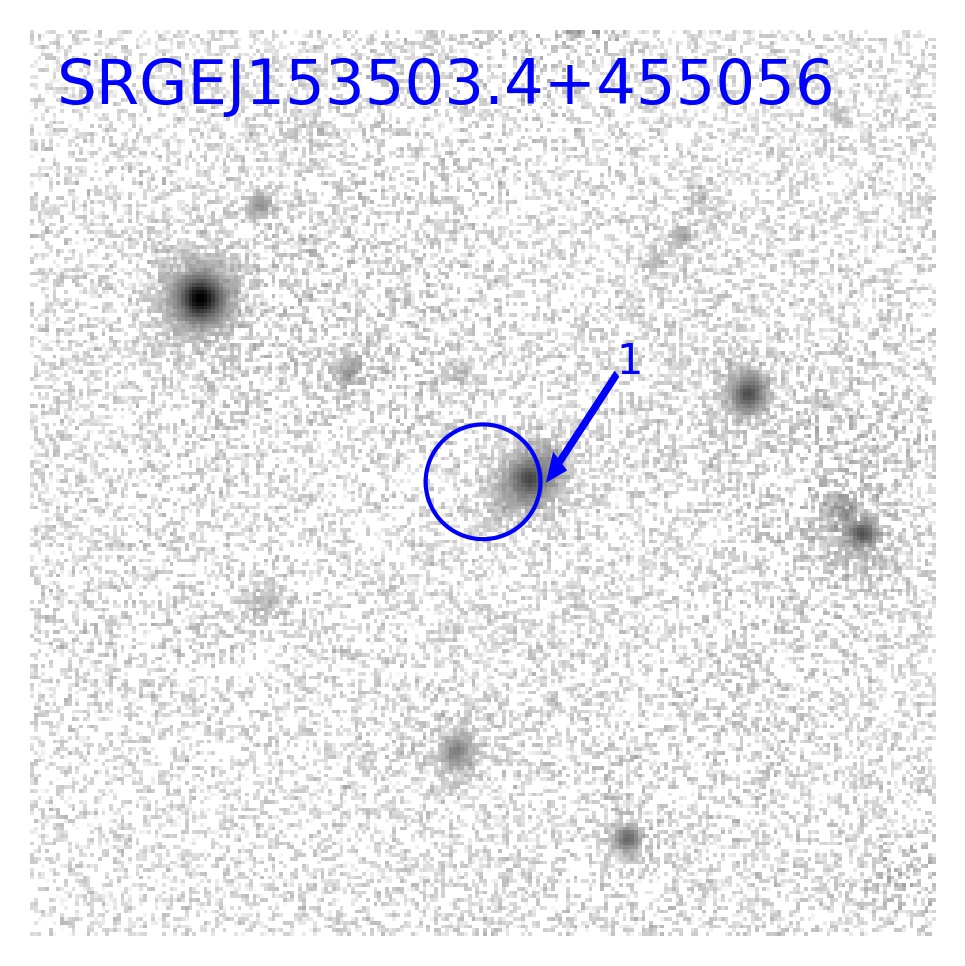
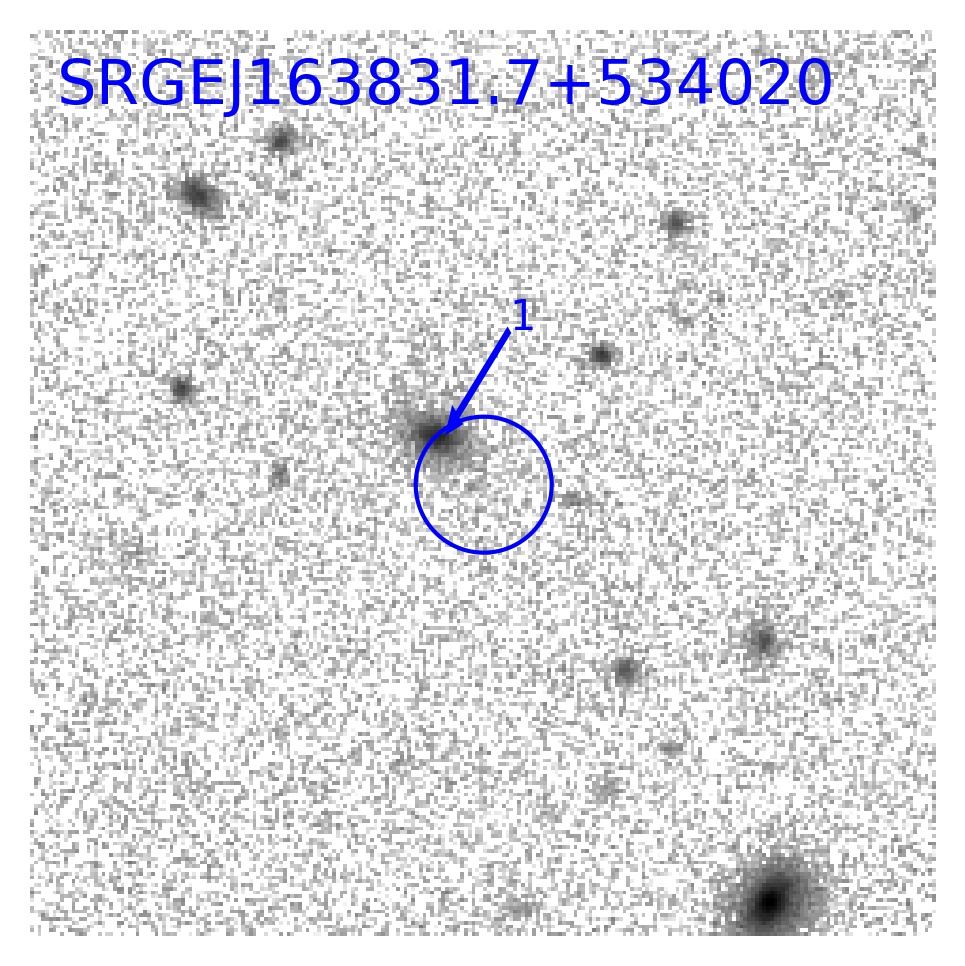
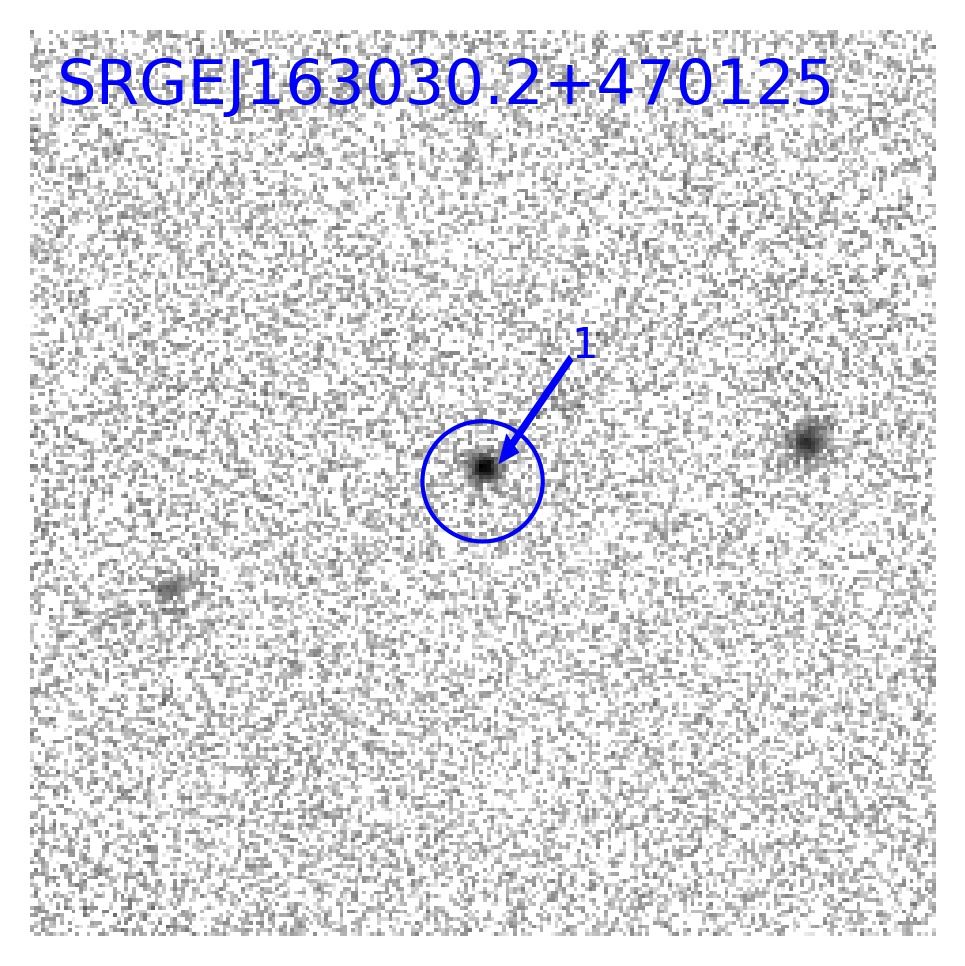
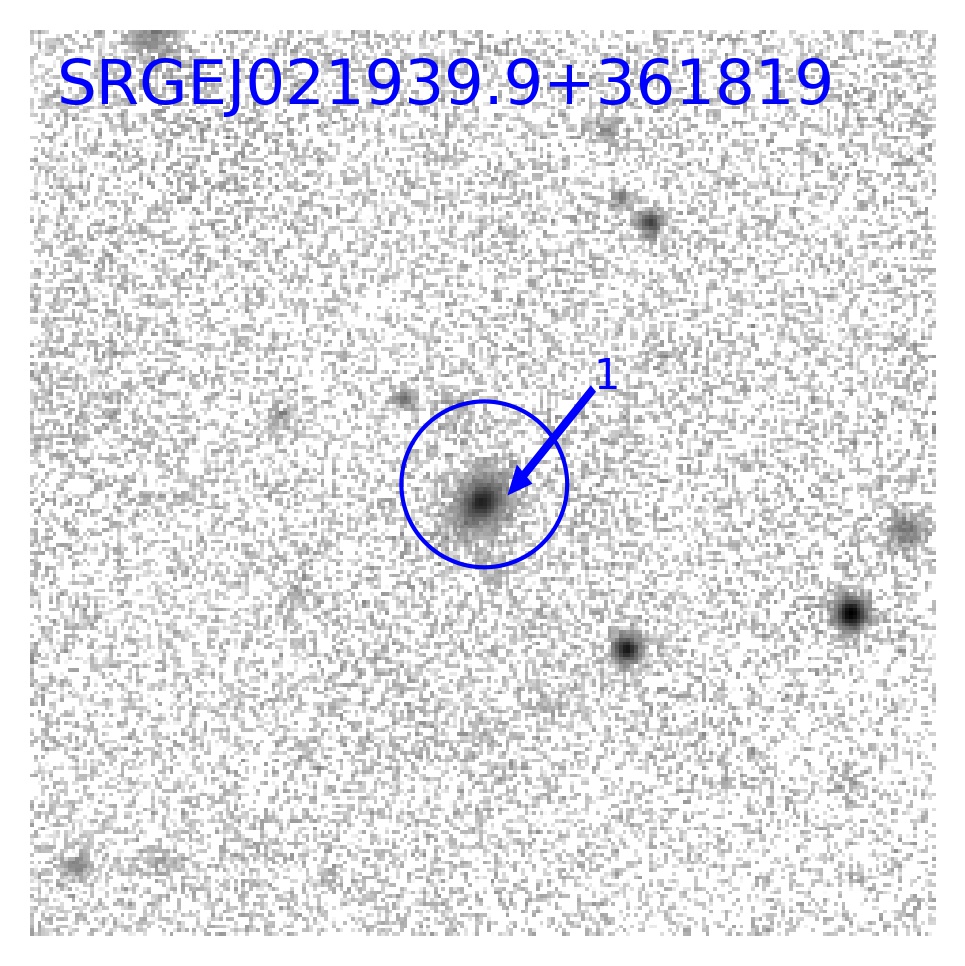
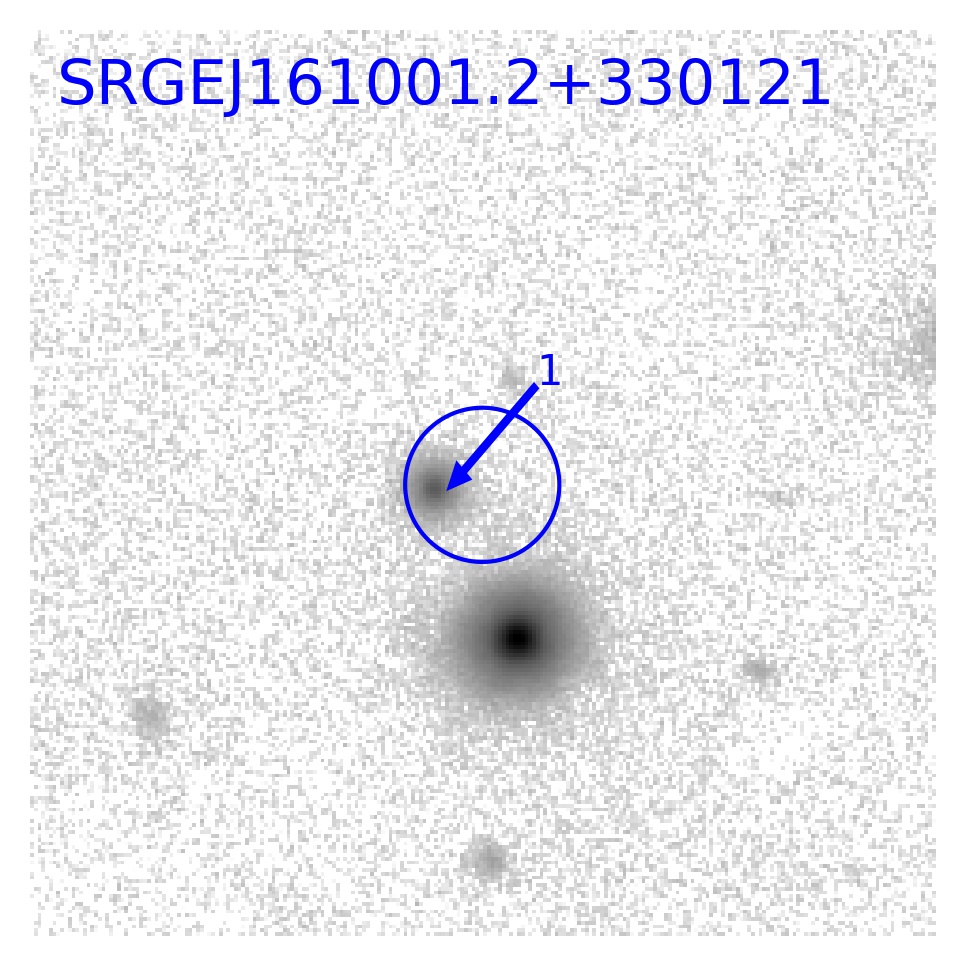
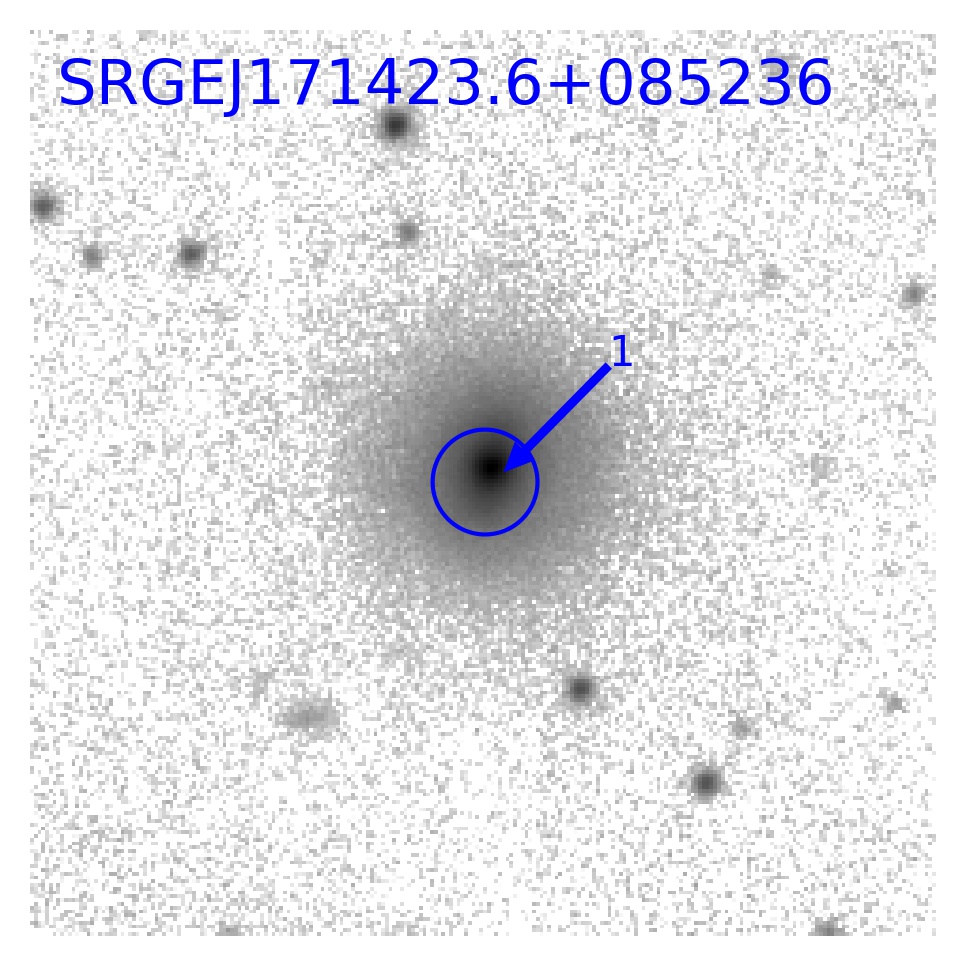
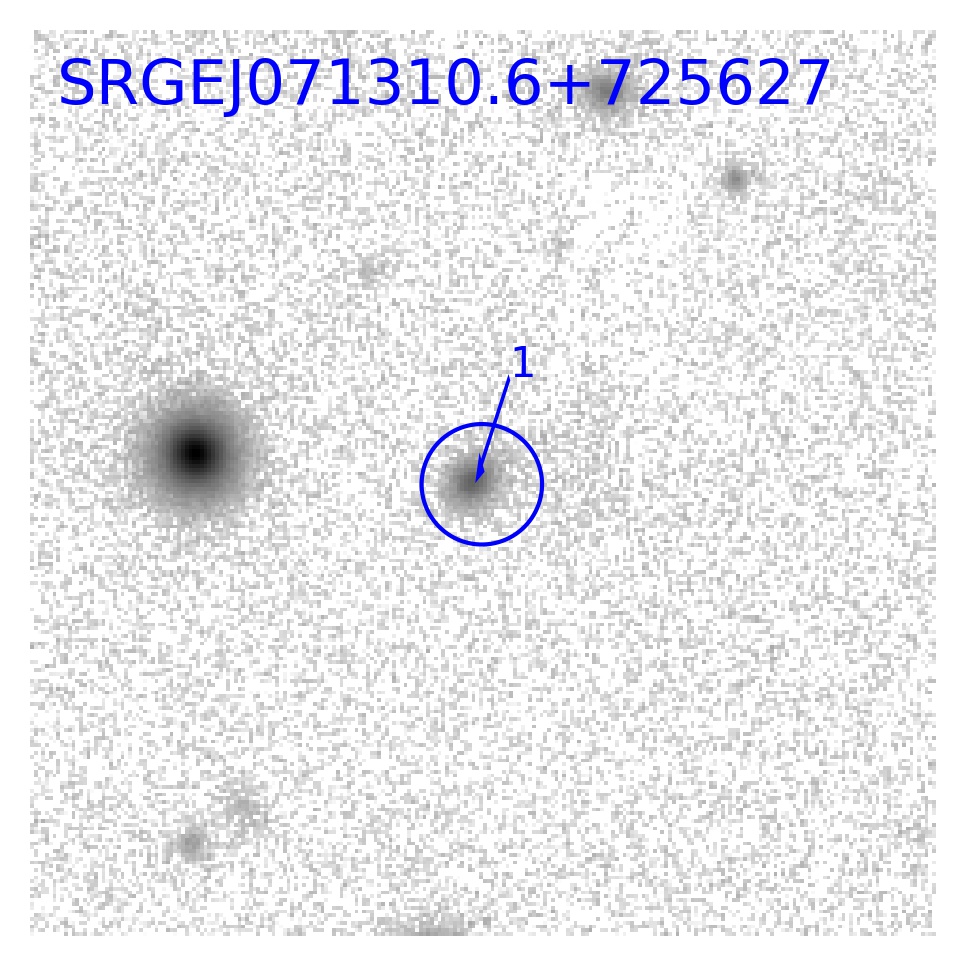
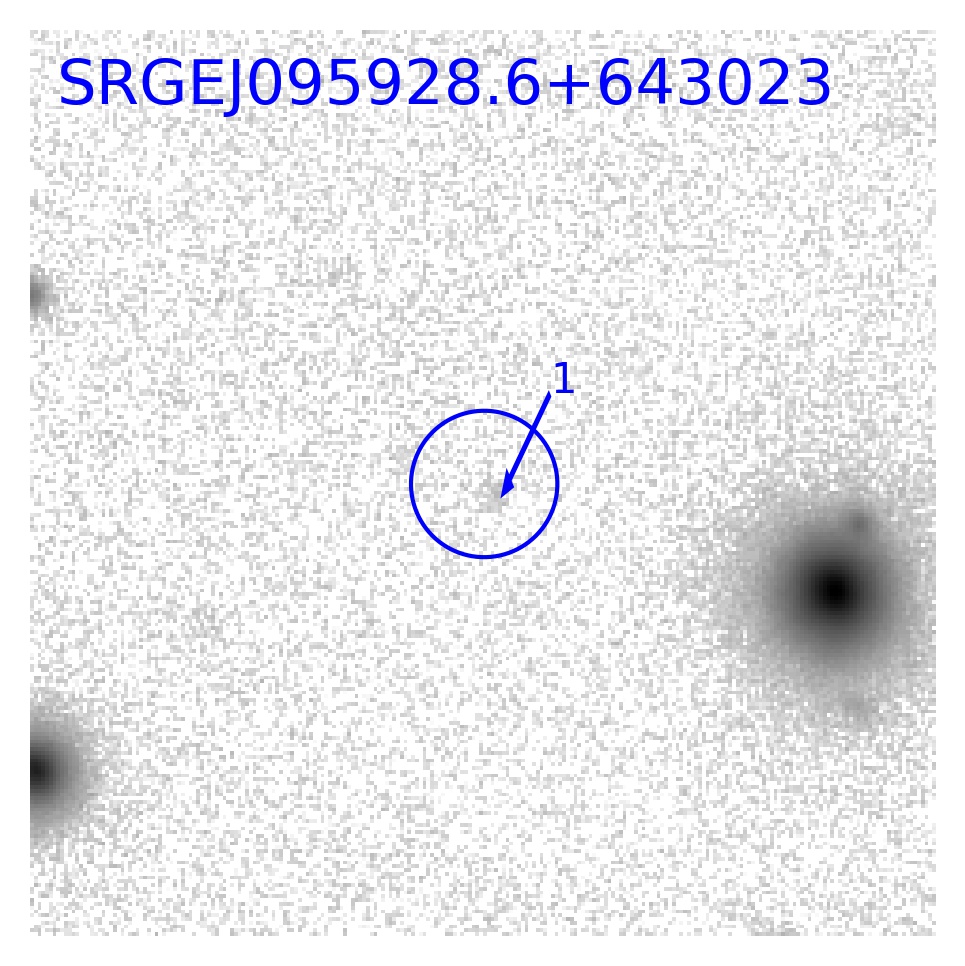
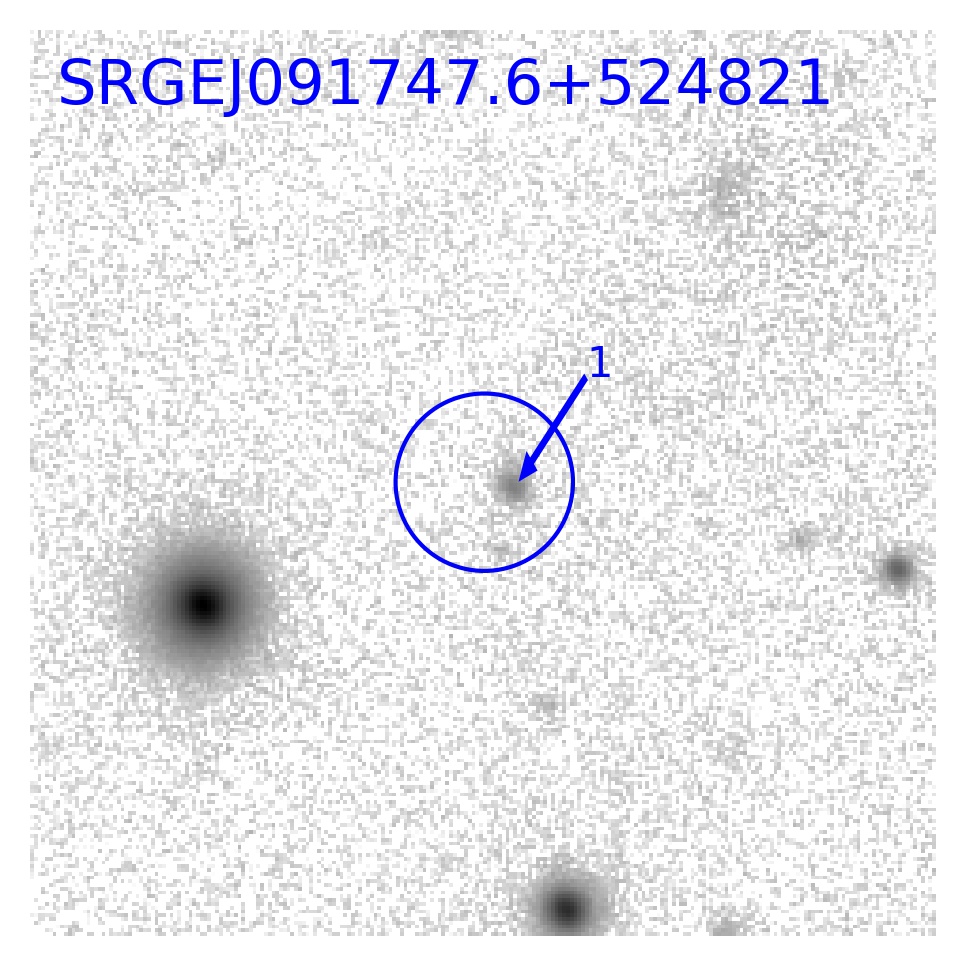
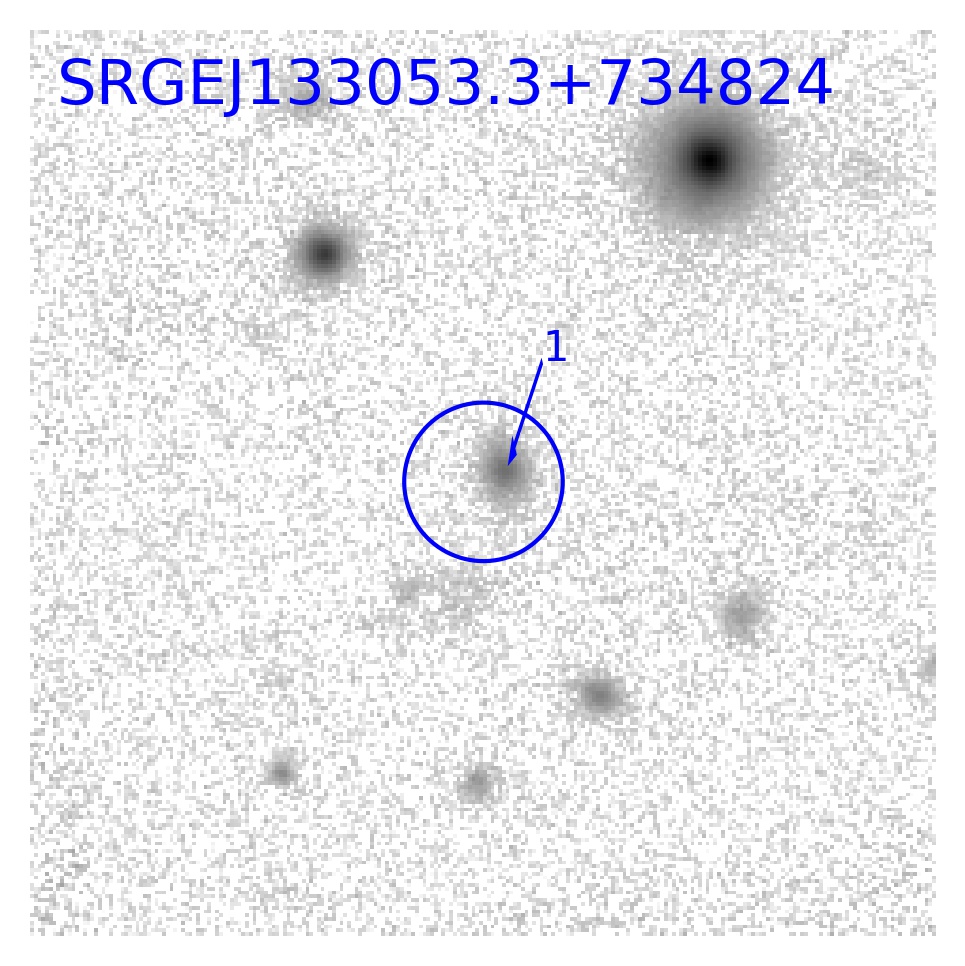
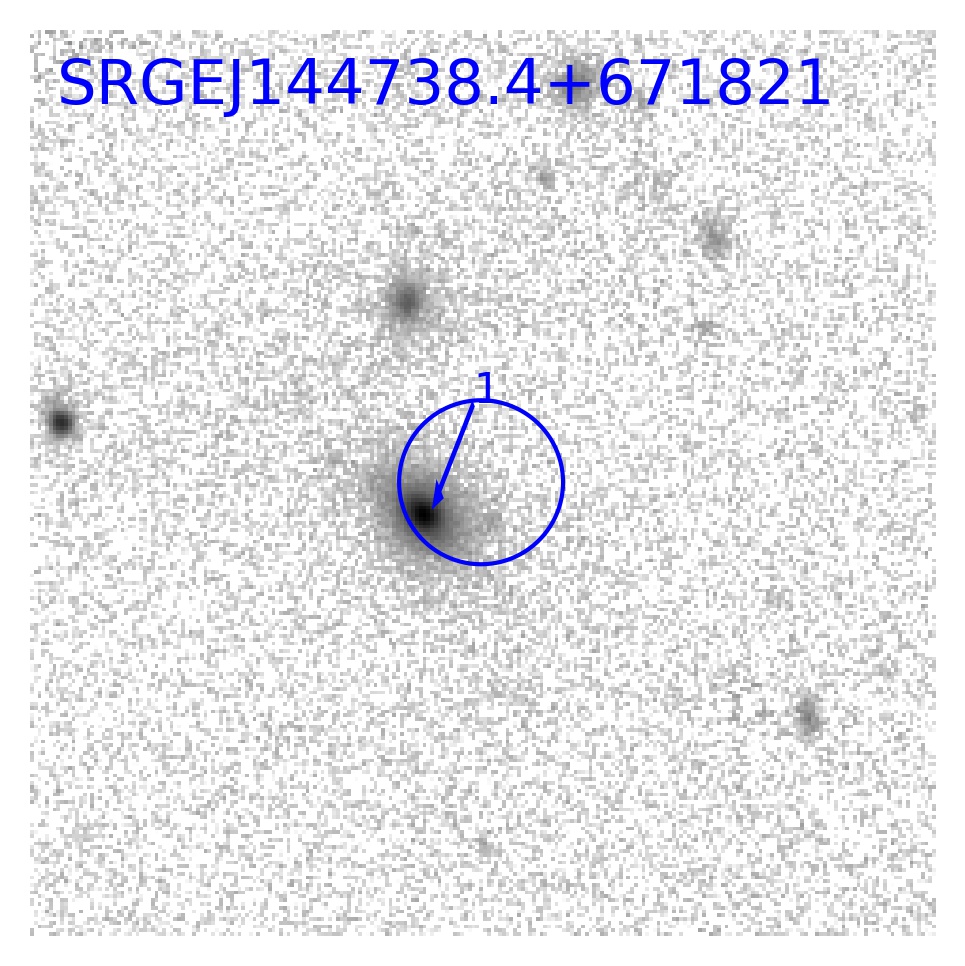
Figure 4 shows optical images around the studied objects from the Panoramic Survey Telescope and Rapid Response System DR1 (Pan-STARRS, PS1) (Flewelling et al., 2020; Waters et al., 2020). There is a single potential optical counterpart within each eROSITA localization region. All of these candidates appear to be extended and thus can be TDE host galaxies. Their optical positions are provided in Table 11 below.
We carried out spectroscopy and photometry of the candidate optical counterparts of the eROSITA transients using a number of telescopes and instruments, namely: the CCD-photometer (CMO RC600, Berdnikov et al. 2020) on the RC600 60-cm telescope of the Caucasus Mountain Observatory of the Sternberg Astronomical Institute (CMO SAI MSU, Russia), the ADAM low and medium resolution spectrograph (Afanasiev et al., 2016; Burenin et al., 2016) and the Andor iKon-M imaging camera on the AZT-33IK 1.6-meter telescope (Kamus et al., 2002) of the Sayan Observatory (Russia), the TÜBITAK Faint Object Spectrograph and Camera444https://tug.tubitak.gov.tr/en/teleskoplar/rtt150-telescope-0 (TFOSC) on the Russian-Turkish 1.5-meter Telescope (RTT150) of the TÜBITAK National Observatory (Turkey), the Transient Double-Beam Spectrograph (TDS, Potanin et al. 2020) and the NBI CCD-photometer on the 2.5-meter telescope of CMO SAI MSU (Russia), the SCORPIO-2 universal focal reducer (Afanasiev & Moiseev, 2011) on the BTA 6-meter telescope of the Special Astrophysical Observatory (Russia), and the Low Resolution Imaging Spectrograph (LRIS, Oke et al. 1995) on the Keck-I 10-meter telescope (USA).
Table 6 presents a log of our photometric follow-up observations and the () apparent magnitudes measured during these observations. Table 7 presents a log of our spectroscopic follow-up observations. Further details on the observations and data reduction are presented in Appendix B.
4.1 Optical light curves
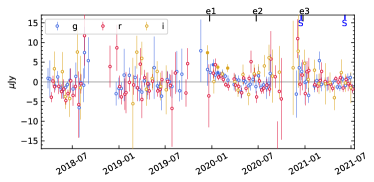
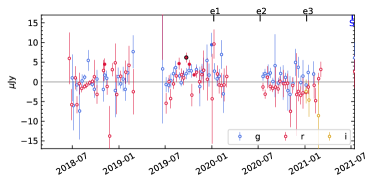
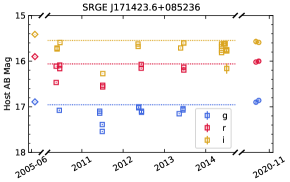
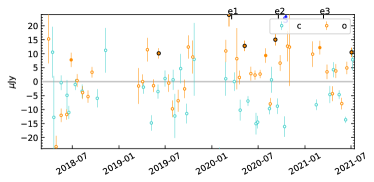
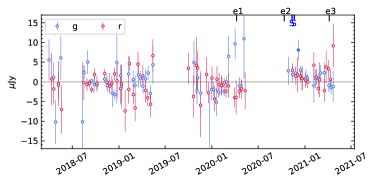
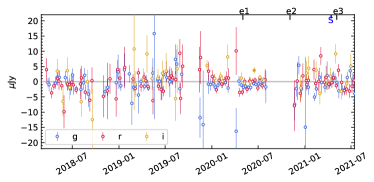
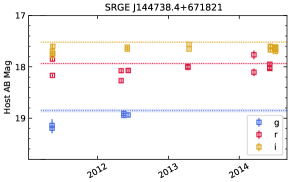
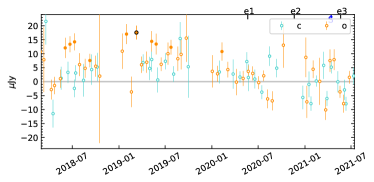
The left panels of Fig. 5 show long-term optical light curves of the TDE host galaxies constructed from our follow-up photometry (Table 6) and archival photometry provided by Pan-STARRS DR2 (PS2) and the Sloan Digital Sky Survey (SDSS, Alam et al. 2015). The right panels show forced differential photometry light curves from ZTF, which cover epochs both before and after the eROSITA X-ray observations. Since the ZTF coverage at the locations of SRGE J153503.4+455056, SRGE J171423.6+085236, and SRGE J144738.4+671821 is poor, we also show the Asteroid Terrestrial-impact Last Alert System (ATLAS; Tonry et al. 2018; Smith et al. 2020) forced photometry in the cyan () and orange () bands for these objects.
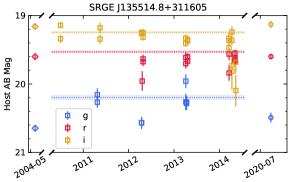
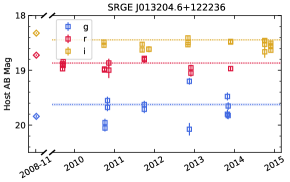
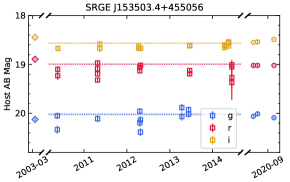
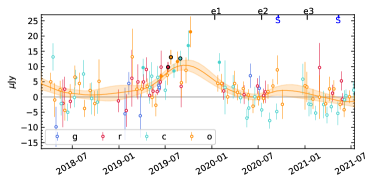
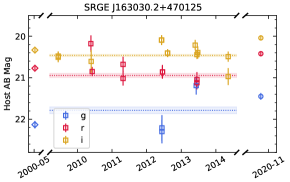
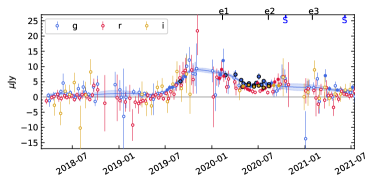
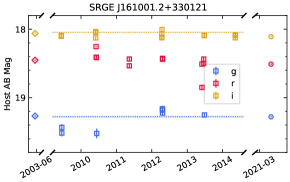
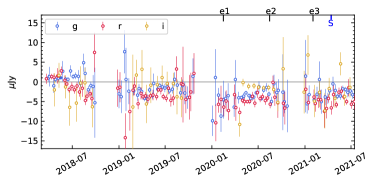
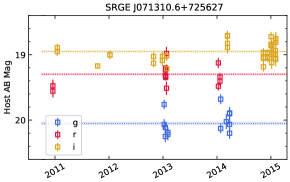
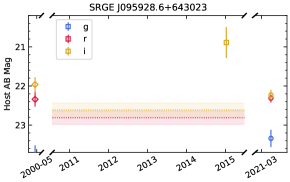
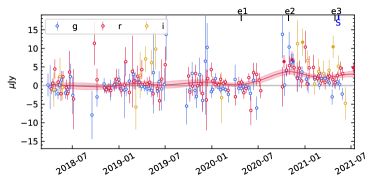
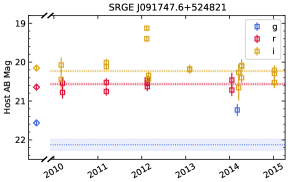
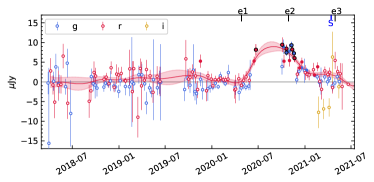
Three, or possibly four, TDEs exhibit optical flares. For SRGE J153503.4+455056, we observe an optical brightening starting around July 2019 and ending before July 2020, i.e., just before its discovery in X-rays by eROSITA on 13–16 July 2020, while during the previous visit in January 2020 eROSITA did not detect this source. For SRGE J163030.2+470125, we observe a clear optical brightening starting in July 2019 and lasting at least until the end of 2020, whereas eROSITA discovered this transient in X-rays in August 2020 and did not detect it in February 2020 and at the end of January 2021. For SRGE J091747.6+524821, we observe an optical brightening between June 2020 and March 2021, while eROSITA discovered the X-ray transient in October 2020 and did not detect it in April 2020 and April 2021. A fourth object, SRGE J095928.6+643023, might also exhibit a weak optical flare around the eRASS2 visit in October–November 2020.
Therefore, for two events (SRGE J153503.4+455056 and SRGE J163030.2+470125) there is evidence that the optical activity started before the X-ray activity, whereas the data for another two transients (SRGE J095928.6+643023 and SRGE J091747.6+524821) are consistent with the X-ray and optical activity occurring nearly concurrently.
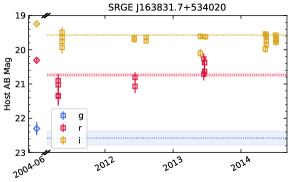
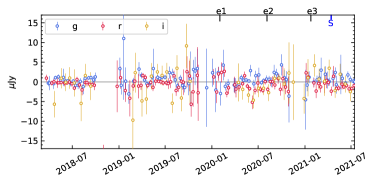
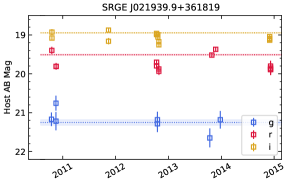
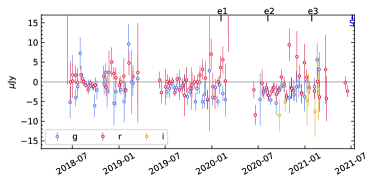
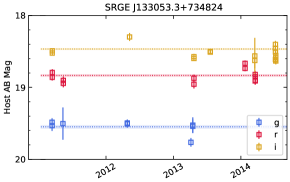
The other nine events do not show evidence of optical flares. For SRGE J171423.6+085236 and SRGE J144738.4+671821, we observe moderate variability in the difference photometry light curve from July 2015 to July 2021 (ATLAS data before March 2018 is not shown in Fig. 5 for visual clarity). An amplitude of Jy in difference photometry corresponds to mag for SRGE J171423.6+085236 and mag for SRGE J144738.4+671821. Therefore, the scatter shown in Fig. 5 is probably due to imperfect image subtraction at the bright galaxy nuclei, rather than variability associated with the stellar tidal disruption. Some other events (e.g., SRGE J135514.8+311605, SRGE J013204.6+122236, SRGE J071310.6+725627) show data points in the binned differential photometry light curves. However, those data are consistent with random fluctuations.
| Object | Optical flare peak | , | , | ||||
|---|---|---|---|---|---|---|---|
| (SRGE) | AB mag | K | K | K | K | K | K |
| J135514.8+311605 | |||||||
| J013204.6+122236 | |||||||
| J153503.4+455056 | 1.56–3.12 | 6.01–11.99 | 19.52–38.95 | 0.94–1.87 | 1.05–2.09 | 1.09–2.17 | |
| J163831.7+534020 | , | ||||||
| J163030.2+470125 | 1.92–3.86 | 5.13–10.32 | 14.66–29.52 | 1.21–2.43 | 0.94–1.89 | 0.86–1.73 | |
| J021939.9+361819 | |||||||
| J161001.2+330121 | |||||||
| J171423.6+085236 | |||||||
| J071310.6+725627 | |||||||
| J095928.6+643023 | 1.80–3.62 | 5.80–11.67 | 17.73–35.71 | 1.27–2.56 | 1.19–2.41 | 1.17–2.35 | |
| J091747.6+524821 | 0.90–1.79 | 3.42–6.83 | 11.11–22.17 | 0.52–1.04 | 0.58–1.15 | 0.60–1.19 | |
| J133053.3+734824 | |||||||
| J144738.4+671821 | |||||||
Notes. Numbers presented in this table are corrected for Galactic extinction. †: Assuming the optical emission can be described by a blackbody with typical temperatures of K, K, or K, is the blackbody luminosity, and is the rest-frame -band luminosity.
| Object (SRGE) | BPT class | |||||||
|---|---|---|---|---|---|---|---|---|
| J013204.6+122236 | – | – | – | – | – | |||
| J153503.4+455056 | – | – | – | |||||
| J163831.7+534020 | – | – | – | – | ||||
| J161001.2+330121 | – | – | – | |||||
| J171423.6+085236 | LINER | |||||||
| J071310.6+725627 | – | – | – | – | ||||
| J133053.3+734824 | Composite | |||||||
| J144738.4+671821 | – | LINER/Seyfert |
Notes. Observed line fluxes are given in units of . The luminosity of [OIII]5007 (in units of ) is corrected for Galactic extinction.
| Object (SRGE) | EW(H) | EW(H) | W1W2 |
|---|---|---|---|
| J135514.8+311605 | |||
| J013204.6+122236 | |||
| J153503.4+455056 | |||
| J163831.7+534020 | |||
| J163030.2+470125 | |||
| J021939.9+361819 | |||
| J161001.2+330121 | |||
| J171423.6+085236 | |||
| J071310.6+725627 | |||
| J095928.6+643023 | — | ||
| J091747.6+524821 | |||
| J133053.3+734824 | |||
| J144738.4+671821 |
Notes. Equivalent widths are given in units of Å. The WISE color W1W2 is given in the Vega system.
4.2 Constraints on optical luminosity
The observed optical flare peak magnitudes or upper limits are shown in Table 8. For the nine events without optical flares, we compute long-term median of upper limits using ZTF and ATLAS forced differential photometry. For the four events with optical flares, we calculate maximum of the model fits shown in Fig. 5. Since the optical data have seasonal gaps, the peak of the optical emission might be missed. Therefore, we consider the actual optical peak to be 1–2 times the model maximum.
Previous studies have shown that the broad-band SED of UV or optically discovered TDEs can be described by blackbody spectra with temperatures () between K and K (van Velzen et al., 2020; Gezari, 2021). Assuming three typical values of , we report the constraints on optical luminosities in Table 8. Although the total blackbody luminosity is largely model dependent, the rest-frame -band luminosity only has a weak dependence on .
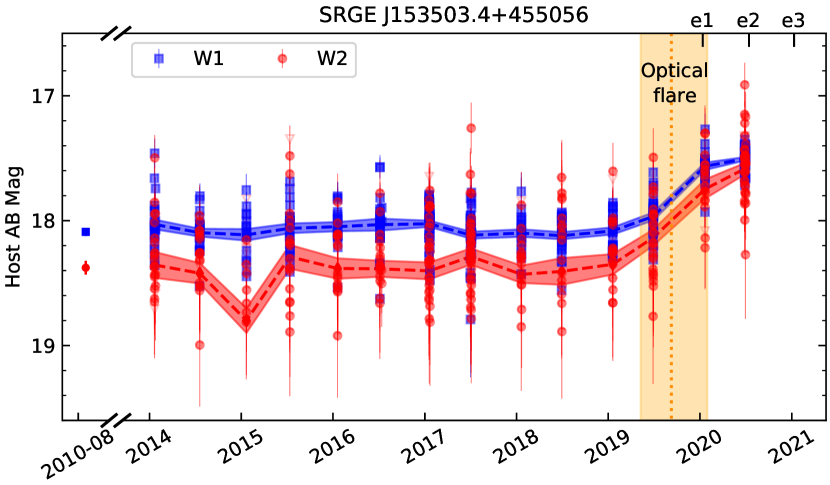
4.3 WISE detection of a luminous infrared echo in SRGE J153503.4+455056
If the circum-nuclear medium of a TDE is dusty, a significant fraction of the UV/optical radiation energy will be absorbed by dust and reprocessed to the infrared (Lu et al., 2016). The resulting IR echoes bear important information on the dust properties at sub-pc scales in quiescent galaxies (van Velzen et al., 2016, 2021a). By performing photometry on time-resolved AllWISE/NEOWISE coadds, Jiang et al. (2021) reported the detection of IR echoes in 8 of 23 optically selected TDEs. The ratio of their peak dust luminosity (–) and their UV/optical luminosity () suggests a dust-covering factor of .
In order to search for IR echoes in the SRG TDE sample, we collected AllWISE and NEOWISE-R data for the TDE hosts. Significant IR brightening was observed in SRGE J153503.4+455056 (Fig. 6). In the most recent NEOWISE epoch (from 2021 June 26 to July 1), compared with the 2010 baseline, its IR flux has increased by Jy in W1 and Jy in W2. The corresponding dust luminosity and temperature are and K. The derived is a lower limit on , but is already at the same level of the most luminous dust echo detected in optically selected TDEs (Jiang et al., 2021). We have constrained the peak UV/optical luminosity of SRGE J153503.4+455056 to be (Table 8). Taken together, we infer a dust covering factor of , which is greater than typical values seen in optically selected TDEs.
Future detailed studies on the IR properties of SRG/eROSITA selected TDEs should reveal if the dust environment of X-ray selected TDEs is statistically different from that of optically selected events.
4.4 Optical spectra
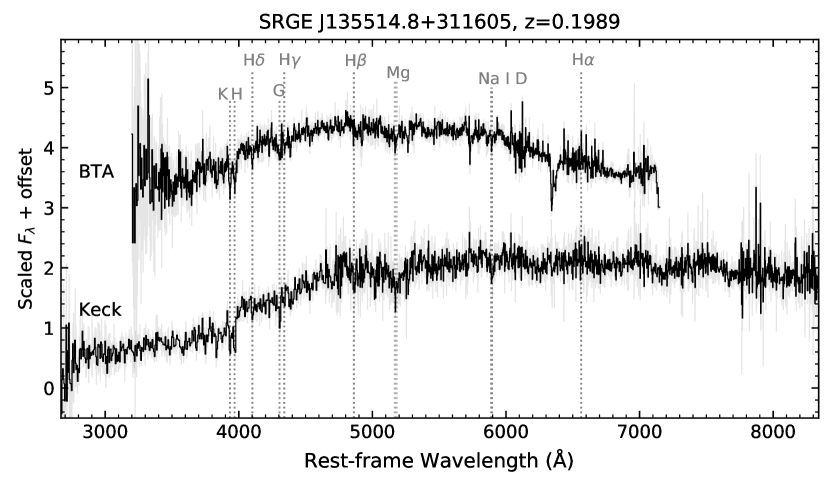
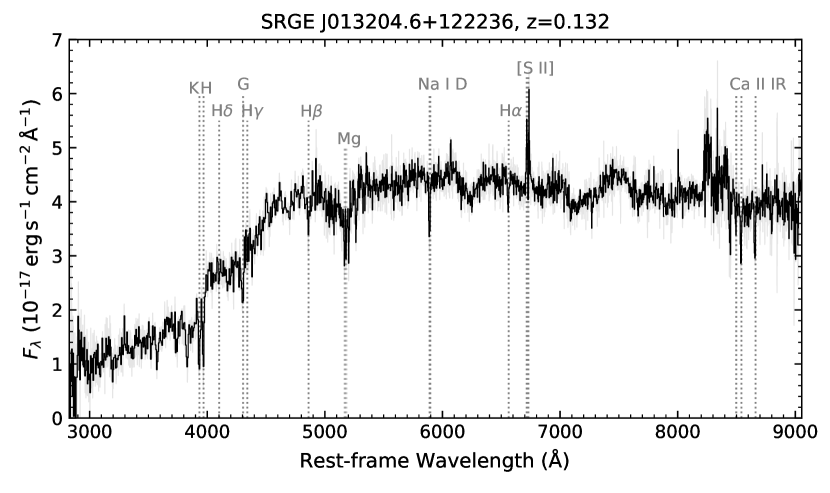
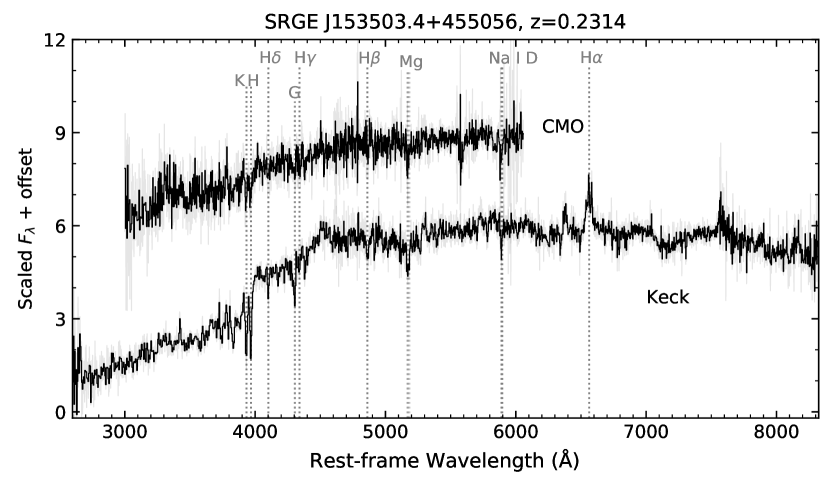
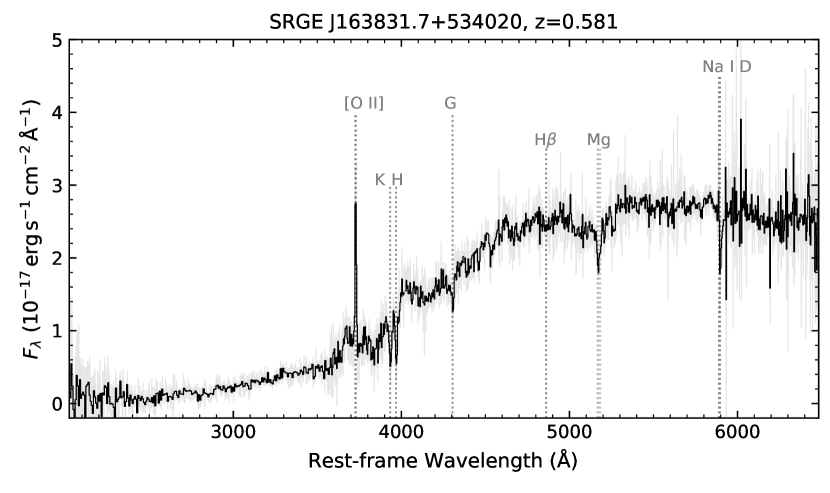
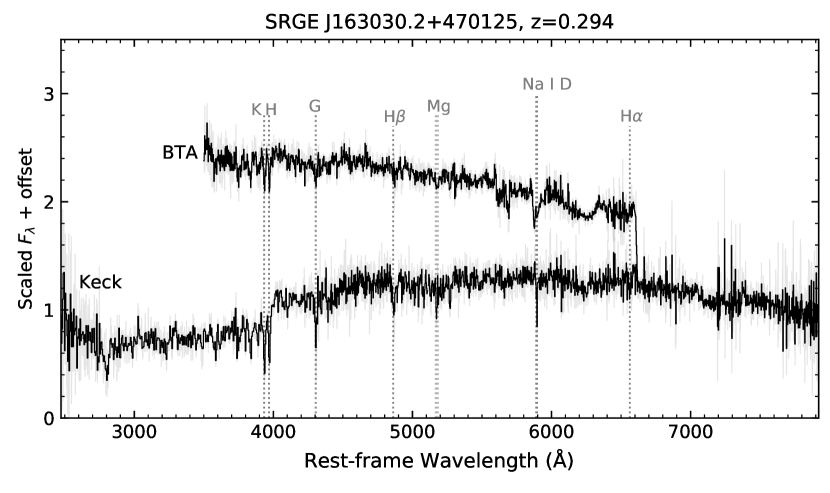
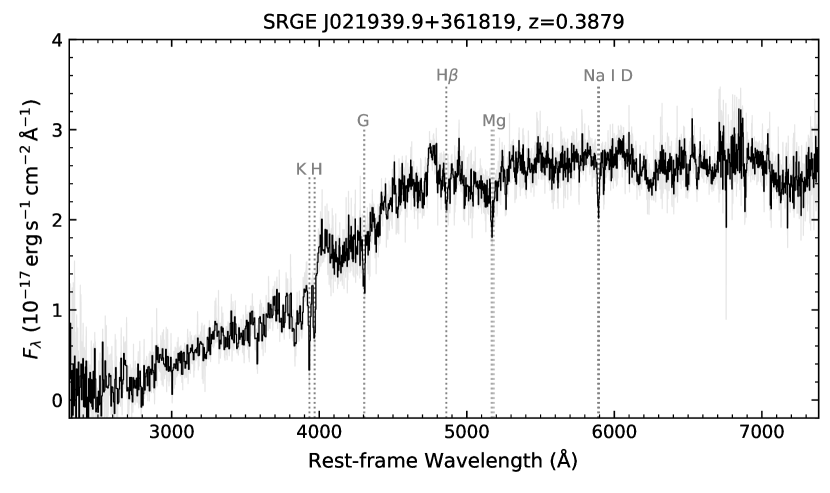
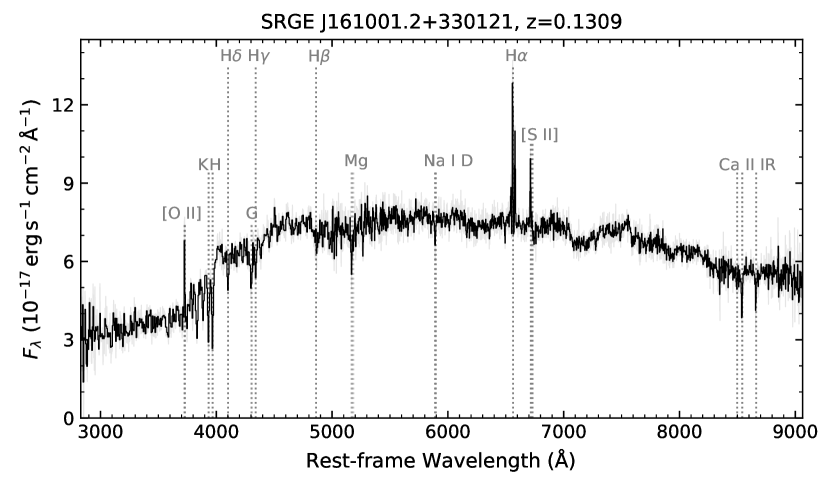
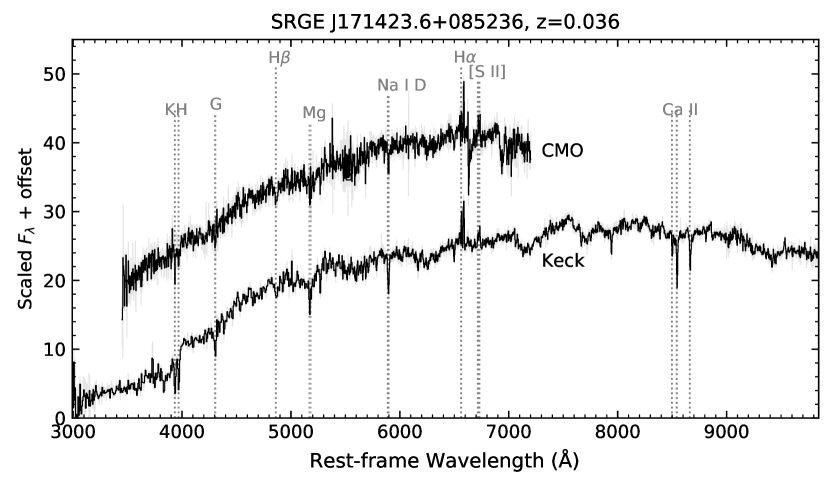
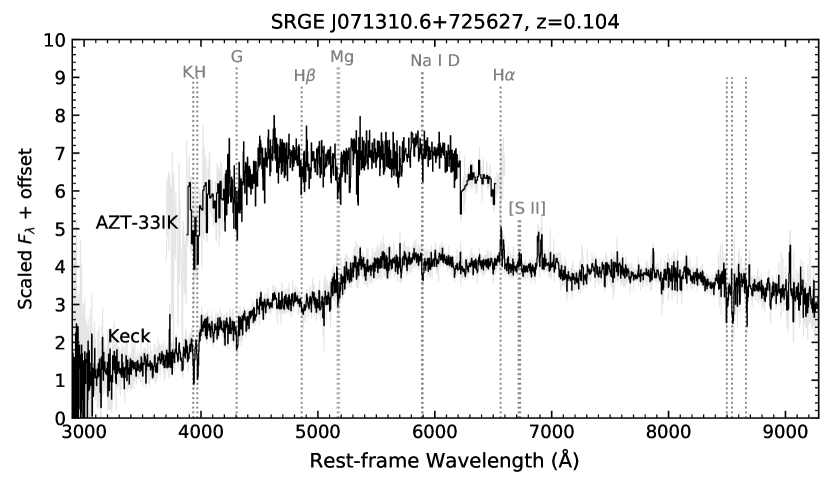
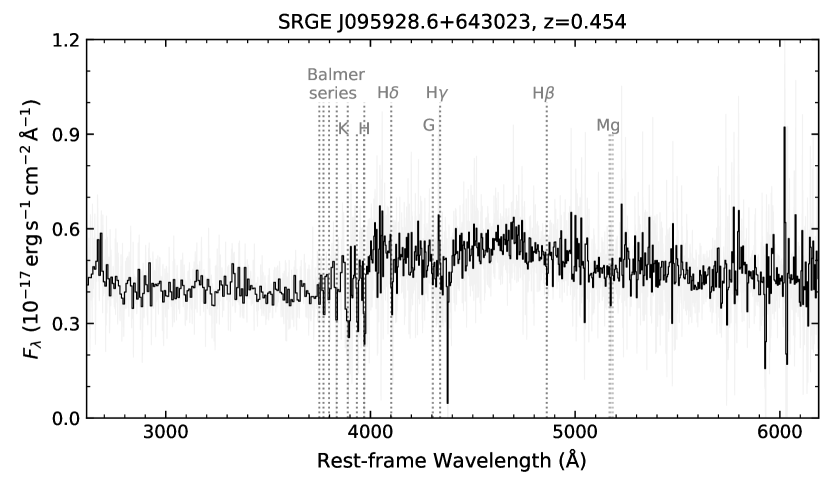
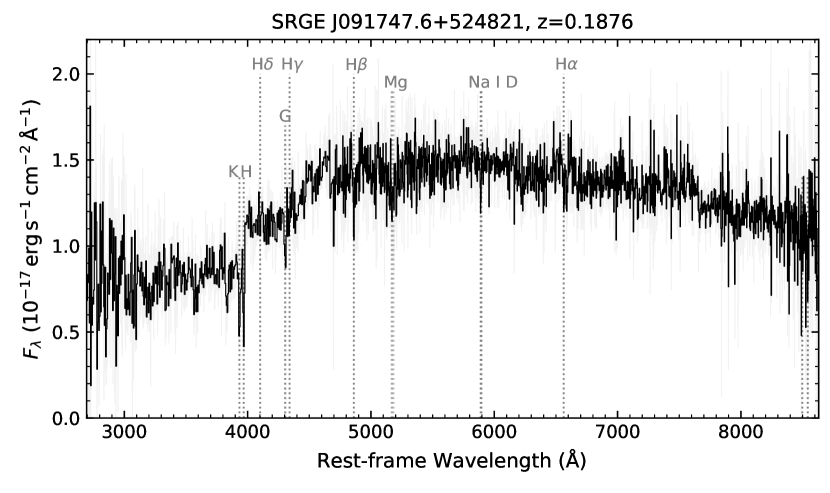
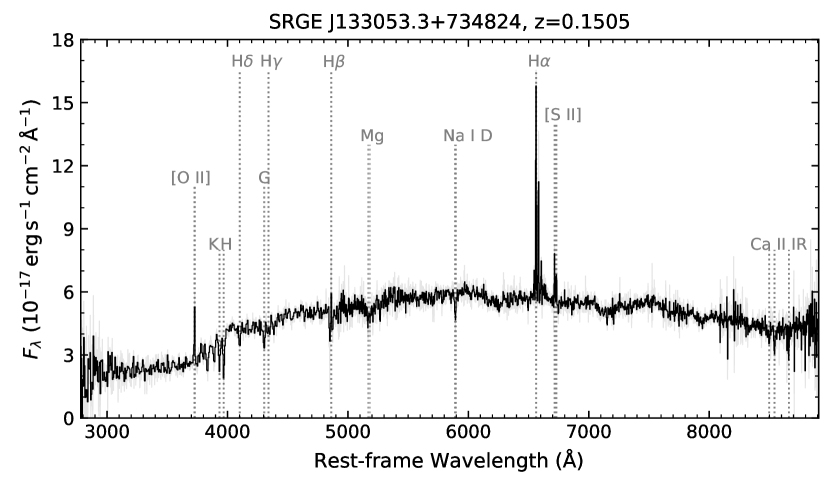
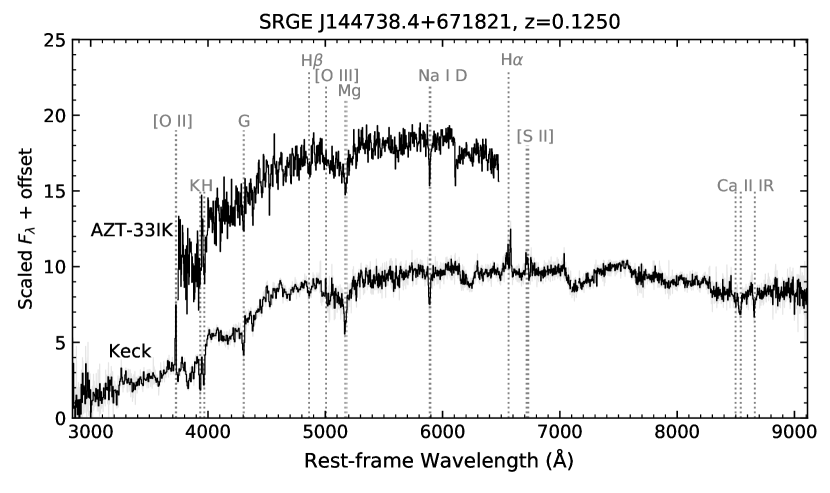
Figure 7 shows the optical spectra obtained during our follow-up program. For some objects, only a single-epoch spectrum is available, while for others we obtained a couple of spectra with an interval of several months. The achieved spectral quality is sufficient for a reliable measurement of the redshift in all cases.
Only in the spectrum of SRGE J163030.2+470125 do we see a clear indication of optical emission associated with the presumed stellar tidal disruption on top of the host galaxy light. Specifically, the first spectrum taken in October 2020, i.e. nearly 2 months after the eROSITA discovery, exhibits a blue continuum, while this blue excess is not observed anymore in a second spectrum obtained 8 months later (in June 2021). This spectral evolution is consistent with the brightening seen in the optical light curve between the middle of 2019 and the end of 2020.
The other 3 objects demonstrating optical flares in their light curves (as was discussed in §4.1), namely SRGE J153503.4+455056, SRGE J095928.6+643023, and SRGE J091747.6+524821, do not show any signatures in their optical spectra that could be attributed to a TDE. This is, however, fully consistent with the fact that we conducted spectroscopy for these events after the flares faded away.
To characterize the emission content of the host galaxies, we fit the observed Keck spectra with stellar population models using ppxf (Cappellari, 2017). We use the MILES spectra library (Vazdekis et al., 2015), and emission lines of Balmer series, [OII], [SII], [OIII], [OI], and [NII]. Among the 13 hosts, emission lines are confidently detected in 8 objects. Table 9 presents their line fluxes and classes on the Baldwin, Phillips, & Terlevich (BPT) diagnostic diagram (Baldwin et al., 1981; Veilleux & Osterbrock, 1987; Kewley et al., 2006).
In order to explore the star formation history of SRG-selected TDE hosts (discussed in §5.2 below), we measure the equivalent width (EW) of the Lick H index in the ppxf best-fit stellar continuum. This index was defined to capture stellar absorption from A stars (Worthey & Ottaviani, 1997). We then measure the EW of the H emission using the following formula
| (2) |
where is the total EW of H in the observed spectrum, and is the EW of the absorption line in the ppxf best-fit stellar continuum. The H line of SRGE J163831.7+534020 and SRGE J095928.6+643023 are redshifted out of the LRIS bandpass. For these two objects, we assume that the emission line flux of H is the emission line flux of H. For SRGE J095928.6+643023, the H emission line is not confidently detected in the observed spectrum, and therefore . For SRGE J163831.7+534020, . By inspecting its observed spectrum (Fig. 7), we take the H continuum flux to be . Therefore, . Table 10 presents the measurements of EW(H) and EW(H), as well as the corresponding WISE W1W2 colors.
Most of the emission lines observed in the spectra are consistent with being due to star formation in the host galaxies. However, we see clear signatures of AGN activity (namely, high [NII]/H, [SII]/H, and [OIII]/H ratios), for a few objects, in particular SRGE J171423.6+085236, SRGE J133053.3+734824, and SRGE J144738.4+671821, which are classified according to the BPT diagram as “LINER”, “Composite” (i.e. [HII]/LINER), and “LINER” or “Seyfert”, respectively. Furthermore, although the [OIII] and H emission lines are very weak or absent in some of the spectra, we can try to use the equivalent width of the H emission line as a proxy of the [OIII]/H ratio on the BPT diagram (Cid Fernandes et al., 2010) together with the [NII]/H ratio. Based on the values of EW(H from Table 10, we infer that SRGE J153503.4+455056, SRGE J161001.2+330121, and SRGE J071310.6+725627 might also be LINERs.
Despite this evidence of AGN activity, it is unlikely that it is responsible for the X-ray transient phenomena revealed by SRG/eROSITA in these objects. First of all, for all of the suspected AGN (see Tables 9 and 10), which indicates that the mid-infrared emission associated with an active nucleus is overwhelmed by that from the surrounding galaxy, hence the suspected AGN cannot be luminous.
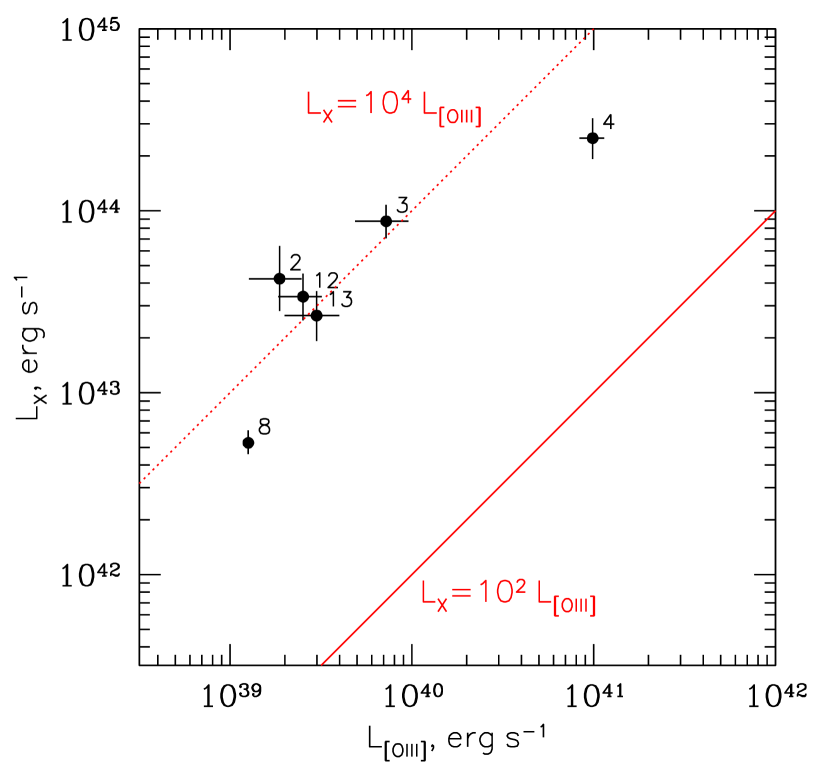
A more quantitative assessment of the AGN activity can be done based on the measured luminosity in the [OIII] line (see Table 9). This quantity correlates with the X-ray luminosity in Seyfert galaxies (Heckman et al., 2005) and may be used as a proxy of AGN bolometric luminosity (e.g. LaMassa et al. 2010). Typically for Seyfert 1 galaxies (i.e. for AGN whose observed spectra are not significantly affected by intrinsic absorption), the [OIII] luminosity is –3% of the luminosity in the standard X-ray band (2–10 keV) (Heckman et al., 2005), although there is a substantial scatter around this mean trend. Taking into account that for typical SEDs of Seyferts/quasars (Sazonov et al., 2004) the luminosity in the 0.2–6 keV band (our working energy range in this study), , is a factor of higher than in the 2–10 keV band, we may roughly predict the AGN contribution to the 0.2–6 keV luminosity of our objects as . As shown in Fig. 8, the ratios for all of the SRG/eROSITA transients with detectable [OIII] emission are larger than and concentrate around .
We conclude that the few galaxies tentatively classified as LINER/Seyfert according to their optical emission line ratios appear to be relatively low luminosity AGN in which SRG/eROSITA has registered luminous soft X-ray outbursts associated with stellar tidal disruptions. The low persistent X-ray luminosity expected for these objects based on the [OIII] flux is consistent with their non-detection by eROSITA during its first scan (eRASS1). However, we cannot completely rule out that AGN do play some role in the properties of the X-ray transients discussed here (see Zabludoff et al. 2021 for a discussion of the overlap of the observed properties of TDEs and AGN), especially in the case of SRGE J144738.4+671821, which showed an atypical X-ray brightening over the 6-month period after its discovery by eROSITA. The presence of a few AGN in the current sample of 13 TDEs is not surprising, since roughly every second galaxy in the local Universe appears to have a weakly active nucleus (Ho, 2008).
5 Discussion
As has been demonstrated in the preceding sections, the totality of existing X-ray and optical data leaves little doubt that the objects under consideration are TDEs.
5.1 Properties of the SRG TDE sample
Table 11 summarizes the key properties of the discovered TDEs. Specifically, we provide for each object: (1) coordinates of the host galaxy, (2) the Galactic HI column in this direction, (3) its redshift, (4) TDE intrinsic X-ray luminosity in the 0.2–6 keV energy band, , or the corresponding upper limit in eRASS2 and eRASS3, (5) TDE rest-frame -band luminosity, , or the corresponding upper limit, and (6) the volume of the Universe, , within which the TDE could be detected during eRASS2 (see §5.3 below).
The quoted X-ray luminosities and upper limits were determined from the best-fitting diskbb models (Tables 3 and 5) and corrected for the Galactic absorption in those cases where the available number of eROSITA photons had allowed us to perform a spectral analysis; otherwise the X-ray luminosities/upper limits for eRASS3 were estimated from the measured count rates adopting the best-fitting spectral model from eRASS2 (i.e. during the “bright phase” of the TDE). The estimates and upper limits on are adopted from the last three columns in Table 8, i.e. allowing for the characteristic blackbody temperature to range between and K.
| Object (SRGE) | Optical position | , erg s-1 | ||||||
|---|---|---|---|---|---|---|---|---|
| RA | Dec | cm-2 | eRASS2 | eRASS3 | erg s-1 | Gpc3 | ||
| J135514.8+311605 | 208.812579 | 31.268121 | 1.21 | 1.90 | ||||
| J013204.6+122236 | 23.018675 | 12.376562 | 4.80 | 0.439 | ||||
| J153503.4+455056 | 233.763172 | 45.848598 | 1.22 | 0.9–2.2 | 1.87 | |||
| J163831.7+534020 | 249.633401 | 53.672931 | 2.93 | 10.6 | ||||
| J163030.2+470125 | 247.626052 | 47.023730 | 1.62 | 0.9–2.4 | 4.16 | |||
| J021939.9+361819 | 34.916264 | 36.305054 | 5.26 | 8.43 | ||||
| J161001.2+330121 | 242.505920 | 33.022416 | 1.56 | 0.235 | ||||
| J171423.6+085236 | 258.598393 | 8.876918 | 5.39 | 0.0965 | ||||
| J071310.6+725627 | 108.293835 | 72.940751 | 3.53 | 1.06 | ||||
| J095928.6+643023 | 149.868660 | 64.506053 | 3.07 | 1.2–2.6 | 13.8 | |||
| J091747.6+524821 | 139.447492 | 52.805635 | 1.52 | 0.5–1.2 | 0.747 | |||
| J133053.3+734824 | 202.720918 | 73.806739 | 1.59 | 0.477 | ||||
| J144738.4+671821 | 221.912771 | 67.305094 | 0.88 | 0.179 | ||||
Notes: 1: Luminosity in the rest-frame 0.2–6 keV energy range, corrected for Galactic absorption. 2: Rest-frame -band luminosity.
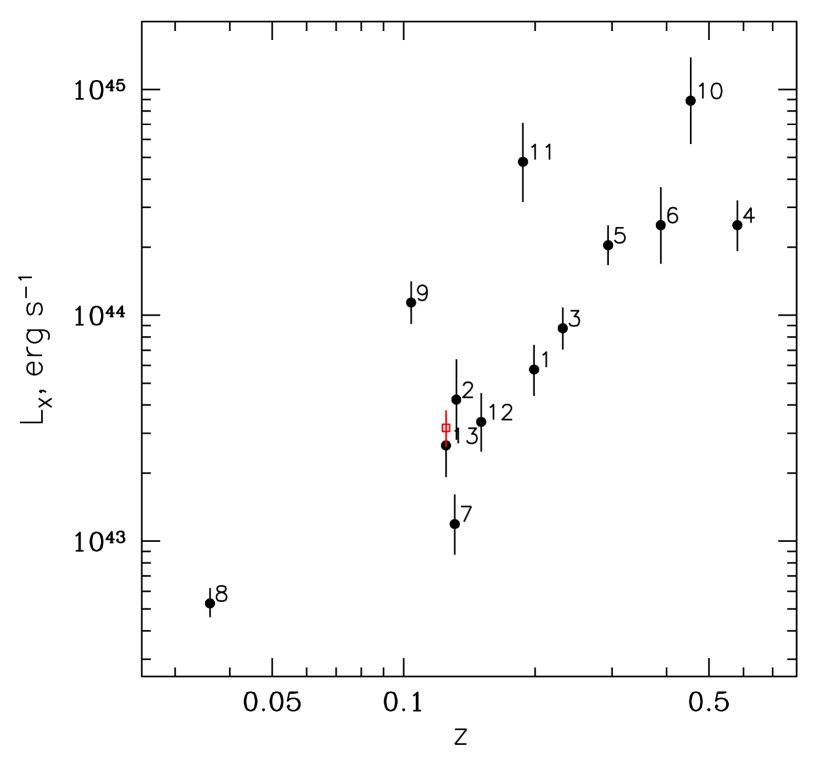
Figure 9 shows the distribution of the TDEs over redshift and X-ray luminosity. Thanks to the high sensitivity of the SRG/eROSITA all-sky survey, the effective “horizon” of TDE observability in X-rays has moved out to from , where it was during the ROSAT all-sky survey (Komossa, 2015). Moreover, our current sample is based on a conservative, high detection threshold (see §2). The latter can be lowered in future work by a factor of , which should lead to the discovery of TDEs at even higher redshifts. Therefore, thanks to SRG we are starting to explore the TDE phenomenon beyond the low-redshift Universe.
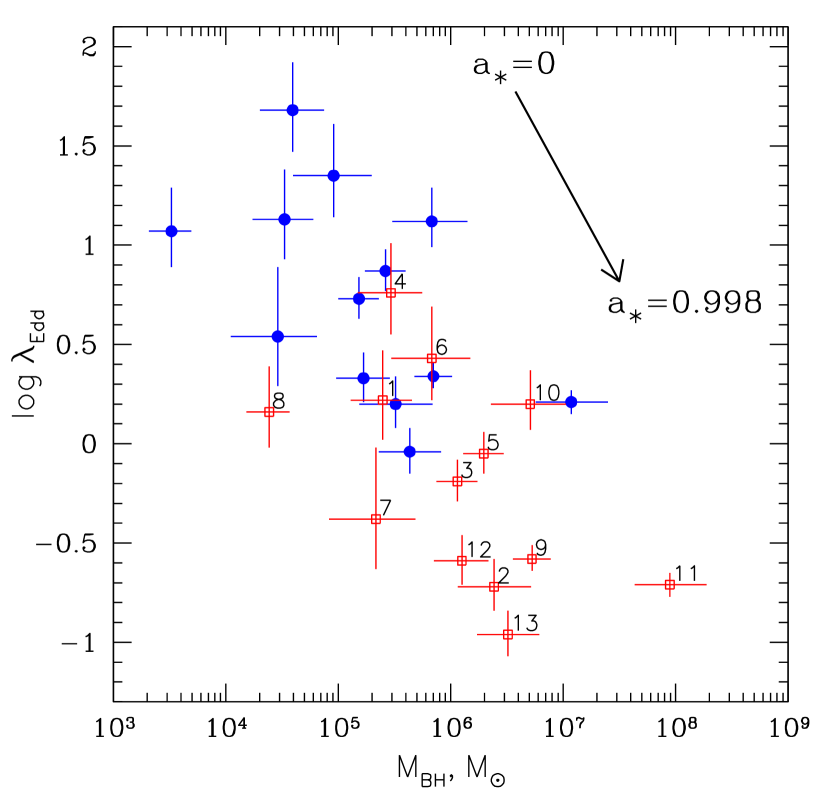
In §3.3 we made an attempt to estimate the masses () and Eddington ratios () of the black holes associated with the TDEs (see Table 4) from their X-ray spectra measured by eROSITA, based on the assumption of a standard accretion disk. As noted before, this assumption may fail for at least some of these events if eROSITA caught them in a super-Eddington accretion phase, when a slim rather than thin accretion disk would be expected. Furthermore, such estimates strongly depend on the adopted spin of the black hole. Bearing in mind these uncertainties, we plot in Fig. 10 the inferred values of and for two extreme cases: (a Schwarzschild black hole) and (a maximally rotating Kerr black hole). In the case of a slowly rotating black hole, most of the TDEs would have been in a super-Eddington accretion phase at the epoch of their first detection by eROSITA, while in the case, the deduced accretion rates are nearly critical. Regardless of the actual black hole spins, all the inferred black hole masses are consistent with being below the theoretical upper limits for nonspinning and rapidly spinning black holes in TDEs of and , respectively (Rees, 1988; Kesden, 2012).
5.2 Host galaxy properties
Following the procedures described by Mendel et al. (2014) and van Velzen et al. (2021b), we can estimate the stellar mass of the host galaxies of the SRG TDEs using pre-transient photometry from GALEX (Martin et al., 2005; Million et al., 2016), PS2, SDSS, the Two Micron All-Sky Survey (2MASS; Skrutskie et al. 2006), and the Near-Earth Object WISE Reactivation Mission (NEOWISE; Mainzer et al. 2014).
Briefly speaking, we employ a simple flexible stellar population systhesis (FSPS; Conroy & Wechsler 2009) model to fit the UV–MIR broad-band SEDs. The five free parameters are the total stellar mass (), the e-folding time of the star formation history (), the age of the stellar population, the metalicity (), and the Calzetti et al. (2000) dust model optical depth. We measure the Galactic extinction-corrected, rest-frame color () from the synthetic photometry. The broad-band SEDs and fitted parameters are given in Appendix C.
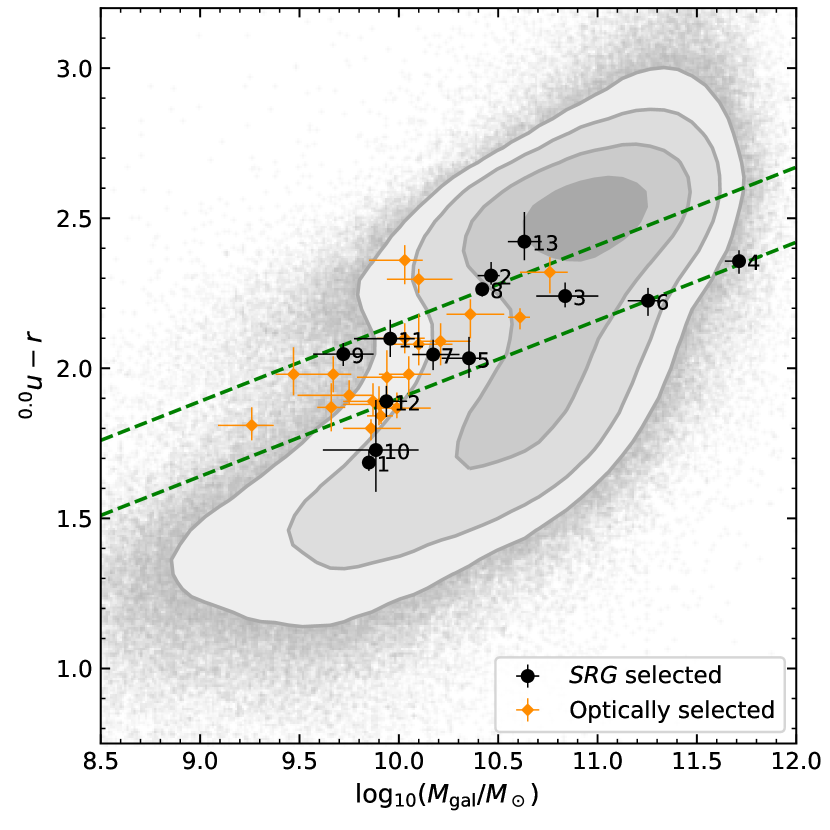
Figure 11 shows vs. for the host galaxies of the TDEs discovered by SRG/eROSITA and discussed in this work, together with a comparison sample of galaxies from SDSS (Mendel et al., 2014). For comparison, we also show a sample of optically selected TDEs (van Velzen et al., 2021b; Hammerstein et al., 2021). The majority of SRG TDE hosts reside in the green valley. This result is expected since previous studies on optically selected TDEs also show that green galaxies are over-represented in TDE hosts (Law-Smith et al., 2017; Hammerstein et al., 2021). We note, however, that SRG TDEs are systematically hosted by galaxies with greater .
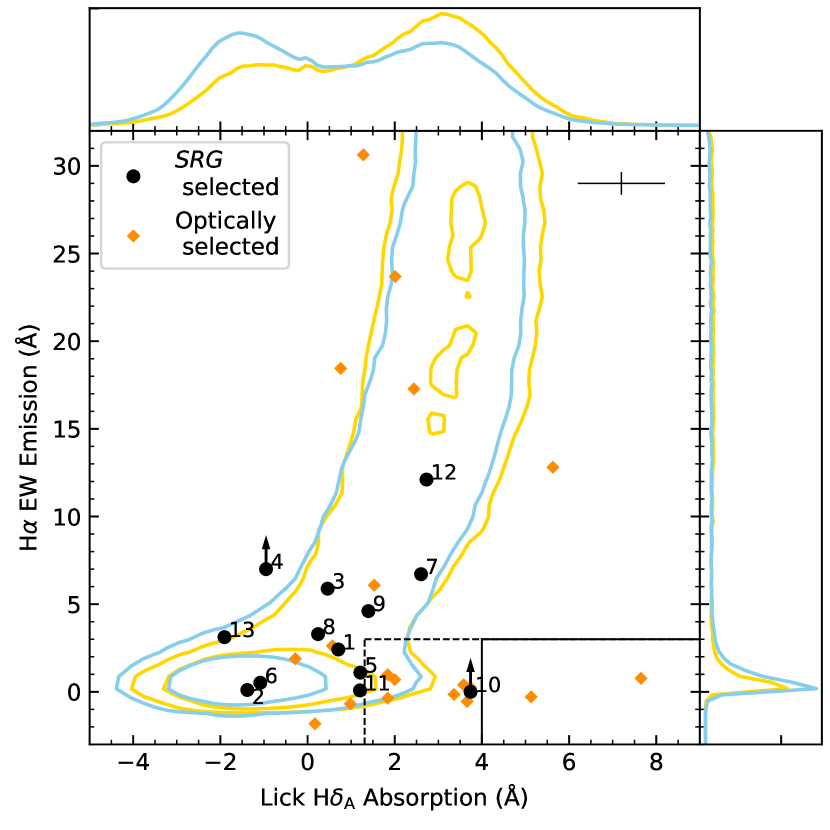
Moreover, it has been found that optically selected TDEs are preferentially hosted by rare quiescent post-starburst (QBS) galaxies or E+A galaxies characterized by strong H absorption and weak H emission (French et al., 2016; Law-Smith et al., 2017; Hammerstein et al., 2021). In order to see if QBS galaxies are also over-represented in X-ray TDEs, we show the distribution of SRG selected TDEs and optically selected TDEs on the H absorption index versus EW(H) diagram in Figure 12. In addition, we collect a sample of SDSS galaxies from the MPA+JHU catalogs (Brinchmann et al., 2004) by requiring the H EW error H_ALPHA_EQW_ERR, the H continuum , the redshift , the median signal-to-noise ratio per pixel of the whole spectrum , and entries in the Mendel et al. (2014) catalog. We construct two comparison samples with the distribution of similar to the SRG selected TDE hosts and the ZTF TDE hosts (see the blue and yellow contours in Fig. 12).
Fig. 12 shows that 0–8% of SRG TDEs are hosted by QBS galaxies. In contrast, 42% of ZTF TDEs are hosted by QBS galaxies. Compared with ZTF TDE hosts, SRG TDE hosts typically exhibit lower values of H, and there appears to be a dearth of host galaxies with strong H emission. These differences might be partially accounted for by the greater of the SRG TDEs, as evidenced by the distributions shown in Fig. 12.
5.3 TDE occurrence rate
Although the first SRG sample of TDEs presented in this work is fairly small, comprising 13 objects, it is already well suited for drawing some inferences about the statistical properties of TDEs in the Universe.
The detectability of a TDE in the SRG/eROSITA all-sky survey largely depends on the following physical parameters: – TDE redshift, – X-ray luminosity (in the rest-frame 0.2–6 keV energy band) at the peak of TDE brightness, – time passed between TDE onset and its detection by eROSITA, – characteristic temperature of the TDE X-ray spectrum assuming multi-blackbody accretion disk emission, – ecliptic latitude (since the SRG all-survey sensitivity increases toward the ecliptic poles), and – Galactic absorption in the TDE direction.
Since SRG passes each location in the sky every 6 months, only a fragmentary X-ray light curve can be obtained for a given TDE based on eROSITA data. Nevertheless, as we have seen in §3.2, the X-ray light curves obtained in this work suggest that most of the TDEs have been caught by eROSITA within 2 months after their onset. In addition, our X-ray spectral modeling indicates that during the discovery of these TDEs their Eddington ratios were all near or greater than 100% (see Table 4). These facts together suggest that the X-ray luminosities measured by eROSITA during eRASS2 should be close to the peak X-ray luminosities of these TDEs (i.e. ). We note in passing that it is hardly possible to predict the delay based on existing theoretical models, since they have too many parameters (see Rossi et al. 2021 for a recent review).
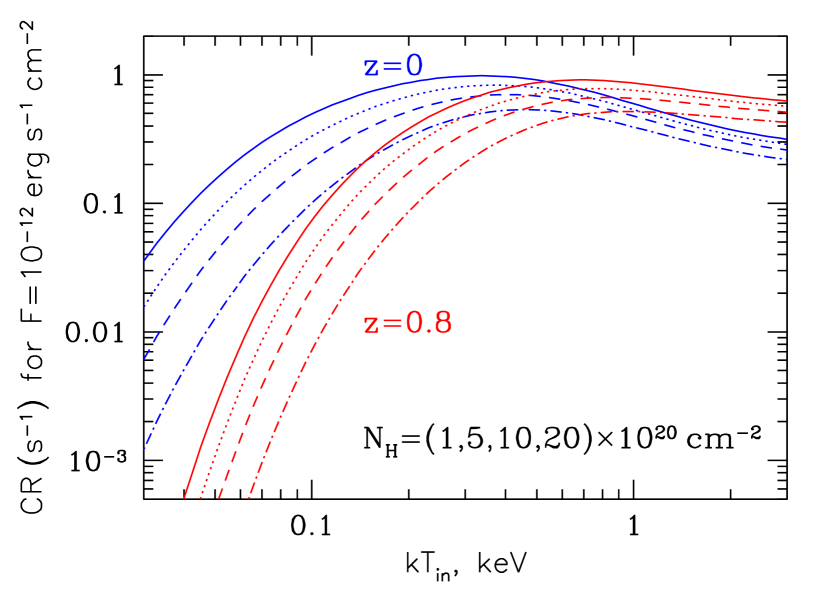

The detectability of TDEs in the SRG survey is strongly affected by their X-ray spectral hardness/softness. As we have seen in §3.3, the analyzed eROSITA spectra can be described fairly well in terms of multi-blackbody accretion disk emission, with their shape characterized by the single parameter . Figure 13 (upper panel) shows the expected eROSITA count rate in the 0.3–2.2 keV energy range (actually used for TDE detection) as a function of for a fixed intrinsic flux of erg s-1 cm-2 in the rest-frame 0.2–6 keV energy range. For nearby TDEs (), the sensitivity in the directions with low Galactic absorption does not vary by more than a factor of 2 for keV, while it decreases dramatically below 0.1 keV. This effect is further strengthened if there is a significant column of cold gas ( cm-2) in the direction of the source, and with redshift.
All but one (SRGE J091747.6+524821, with keV) TDEs in our sample have keV, i.e. fall within the temperature range favorable for detection at (we recall that the most distant TDE in our sample is located at ). While it is unlikely that we are missing TDEs with very hard spectra ( keV), there is certainly a strong selection effect against TDEs with keV. Within the standard TDE paradigm of nearly critical accretion onto a SMBH, such low temperatures correspond to black holes with . Therefore, the current SRG/eROSITA TDE sample is well suited for estimating the rate of TDEs near SMBHs with in the Universe, while our working energy range (0.3–2.2 keV) is too hard for systematic exploration of softer TDEs, presumably associated with more massive black holes.
We next need to know the minimum count rate, , required for detection of TDEs in the 0.3–2.2 keV band during eRASS2 according to the criteria outlined at the beginning of §2, namely that a candidate transient must be at least 10 times brighter during eRASS2 compared to the upper limit on its flux during eRASS1. This threshold depends primarily on the ecliptic latitude, since the exposure per point accumulated during the SRG all-sky survey is inversely proportional to . Figure 13 (lower panel) shows the exact behavior of the minimum count rate on ; the details of this computation will be presented elsewhere. Count rates of at least and counts s-1 are needed to satisfy our TDE detection criterion at and , respectively. Note that a typical (vignetting corrected) exposure during one eROSITA all-sky survey is s at , and s at , so that the quoted thresholds correspond to and counts for and , respectively.
5.3.1 X-ray luminosity function
Having discussed the key properties of the SRG/eROSITA TDE sample and possible selection biases associated with it, we now proceed to evaluation of the TDE X-ray luminosity function (XLF). To this end, we may use the classical method (Schmidt, 1968).
The maximum observable volume for a given TDE in the studied sample depends on its intrinsic luminosity in the 0.2–6 keV energy band () and its intrinsic spectral shape, characterized by . Given these quantities, the computation of is straightforward using the tabulated dependencies (, , ) and () discussed above. Specifically, we should integrate the comoving volume over the hemisphere (probed by this study) out to a luminosity distance (or equivalently a redshift ) defined for each position in the sky so that . The Galactic absorption column entering this equation varies across the sky, and we adopt it from (HI4PI Collaboration et al., 2016).
The computed values for the studied TDEs are given in the last column of Table 11. We have not tried to estimate the corresponding uncertainties associated with the X-ray spectral analysis (i.e., the uncertainties in and ) since these are less important compared to the scatter in the values of individual objects used in the calculation of the XLF. To calculate the TDE XLF, we just need to sum the derived values of individual TDEs in specified luminosity bins. To this end, we use 5 equal intervals in between 42.5 and 45. The uncertainty within a given bin is found as , where the summation is done over the objects within that bin.
We next have to take into account that TDEs are transients. As discussed above, eROSITA appears to typically discover TDEs within 2 months after their onset. Adopting as a fiducial value months (ignoring subtleties associated with cosmological time dilation) and taking into account that the studied TDE sample was collected over a period of 6 months, we should multiply our based estimates by to evaluate the volume rate of TDEs per year.
We finally note that the current sample of 13 TDEs is not statistically complete. Indeed, as already mentioned, there are 3 additional TDEs discovered during eRASS2 based on the same criteria, which are discussed elsewhere (Gilfanov et al., in prep.) because of their pronounced activity in the optical band. To a first approximation, we can take this into account by multiplying the XLF by a factor of 16/13.
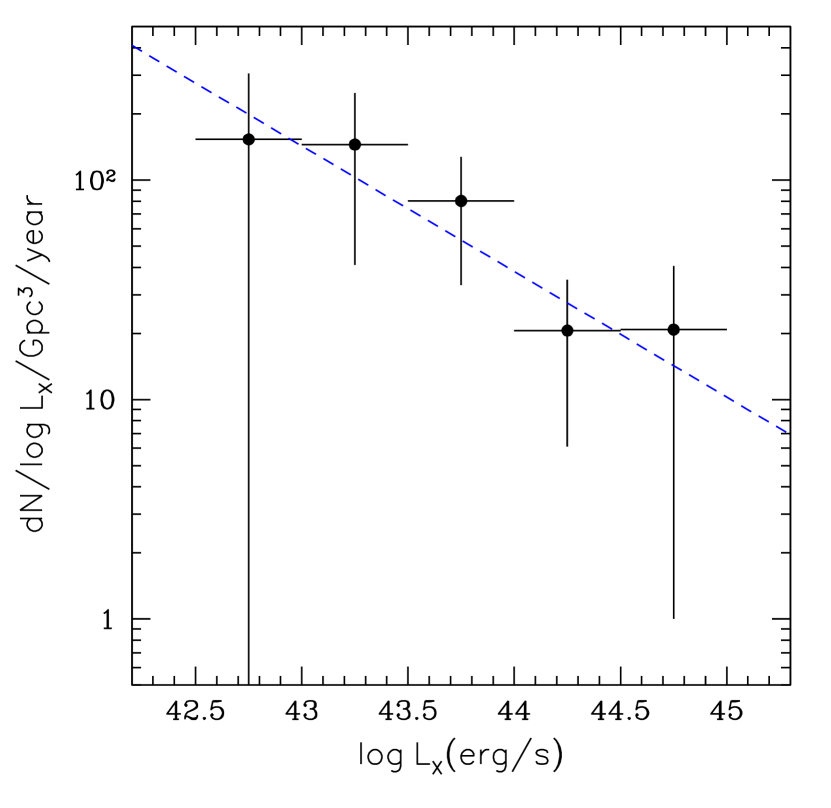
The computed TDE XLF is shown in Fig. 14. The largest uncertainty is associated with the lowest luminosity bin, erg s-1, where there is just one, nearby TDE (SRGE J171423.6+085236 at ) in the current SRG/eROSITA sample. There is a clear indication of the TDE volume rate declining with increasing X-ray luminosity. Fitting the XLF (using minimization) by a power law, we obtain (see Fig. 14):
| (3) |
If we exclude the erg s-1 bin from this calculation, the slope of the power law becomes somewhat steeper, , but consistent with the slope in equation (3).
According to theoretical predictions, TDEs should occur more frequently in lower mass galaxies with correspondingly lighter central black holes (Magorrian & Tremaine 1999; Wang & Merritt 2004; Kesden 2012; see Stone et al. 2020 for a recent review). This, together with the higher abundance of low-mass galaxies compared to high-mass ones, the approximately Eddington luminosities of TDEs, and the expectation that TDEs associated with smaller black holes should emit a larger fraction of their bolometric luminosity in X-rays (due to their hotter accretion disks), suggests that the X-ray TDE rate should increase within decreasing . Apparently, we are starting to see this trend in the data of the SRG all-sky survey.
We note in this connection that the nearest and least X-ray luminous TDE in our sample, SRGE J171423.6+085236, has the hardest X-ray spectrum ( keV). This suggests that it is also associated with the smallest black hole in the sample, with , albeit with a large uncertainty in this estimate based on our simplistic X-ray spectral modeling (see Table 4). On the other hand, its host galaxy is fairly massive, with stellar mass (see Table 12).
The declining trend of the TDE rate with increasing X-ray luminosity inferred here is similar to the trend noticed before for optically-UV selected TDEs. In that case, the measured slope of the luminosity function is (van Velzen, 2018), somewhat steeper than inferred here for X-ray selected TDEs. However, this difference is only marginally significant.
5.3.2 Total rate
By integrating the XLF over the entire luminosity range probed here ( erg s-1) we can estimate the average TDE volumetric rate in the –0.6 Universe: Mpc-3 year-1. Given the total galaxy volume density of Mpc-3 (Bell et al., 2003), this translates to a rate of TDEs per galaxy.
This estimated specific TDE rate is consistent with the earliest estimate of yr-1 per galaxy, based on 3 TDEs detected during the ROSAT all-sky survey and followed-up during ROSAT pointed observations (Donley et al., 2002). Another published estimate is much higher, yr-1 per galaxy (Esquej et al., 2008), but it is based on just 2 TDEs discovered during the XMM-Newton Slew Survey (Saxton et al., 2008) and undetected previously during the ROSAT all-sky survey. Yet another estimate was presented by Khabibullin & Sazonov (2014), who used a sample of 4 candidate TDEs selected based on their brightness during the ROSAT all-sky survey and non-detection in subsequent XMM-Newton pointed observations: yr-1 per galaxy. In summary, all these previous estimates were based on extremely small samples of X-ray selected TDEs, and within their large (and poorly defined) uncertainties appear to be in line with the new result obtained here based on the first SRG TDE sample.
For comparison, the existing estimates of the total rate of optically-UV selected TDEs are yr-1 per galaxy (van Velzen et al., 2020), which is significantly larger than our X-ray-based estimate, and is in better agreement with theoretical “loss cone” predictions (Stone & Metzger, 2016). This possibly indicates that the XLF shown in Fig. 14 continues to rise below erg s-1. However, the optical TDE rate, currently determined for erg s-1, may also increase if less luminous TDEs are included.
The lower volumetric rate of X-ray TDEs compared to that of optical TDEs may also imply that X-ray bright TDEs constitute a minority of all TDEs. The latter possibility would provide support to TDE models (e.g. Dai et al. 2018; Curd & Narayan 2019) that predict a strong dependence of the optical/X-ray brightness ratio on the viewing angle: namely, that we can only observe TDEs (during their luminous early phase) in X-rays from directions close to the axis of a thick accretion disk (formed from the debris of the disrupted star) with a powerful wind, while at larger inclination angles one can only observe the reprocessed optical-UV emission. In this connection, we also note that we have found no evidence of intrinsic absorption in the X-ray spectra of the 13 studied TDEs. However, since not only the viewing direction but also the black hole mass is expected to play a key role in diversity of TDE types (Mummery, 2021), a more elaborate comparison between the TDE population properties inferred from this work and from optical studies should be done. In addition, slow or inefficient circularization of the stellar debris (Piran et al., 2015; Shiokawa et al., 2015) could also lead to a paucity of X-ray TDEs.
In future work, we plan to lower our X-ray detection threshold by a factor of , which should increase the TDE discovery rate by eROSITA by a factor of (assuming that the TDE XLF continues to grow to lower luminosities, so that the resulting eROSITA sample is dominated by low-redshift events). Given that our current sample of bright TDEs detected on one half of the sky over a period of half a year comprises 16 confirmed events, this implies that TDEs per year can be detected by eROSITA over the whole sky and a total of TDEs can be discovered by the end of the 4-year SRG survey (excluding from this calculation the first of the 8 planned sky scans). These numbers are consistent within an order of magnitude with the predictions done for the SRG/eROSITA all-sky survey prior to its beginning (Khabibullin et al., 2014; Jonker et al., 2020), which, however, strongly depend on the distribution of spins of the black holes associated with TDEs. Continued search during the SRG survey will allow us to further narrow down the rate of stellar disruptions in galactic nuclei and place tighter constraints on the underlying population of black holes.
5.4 Optical faintness
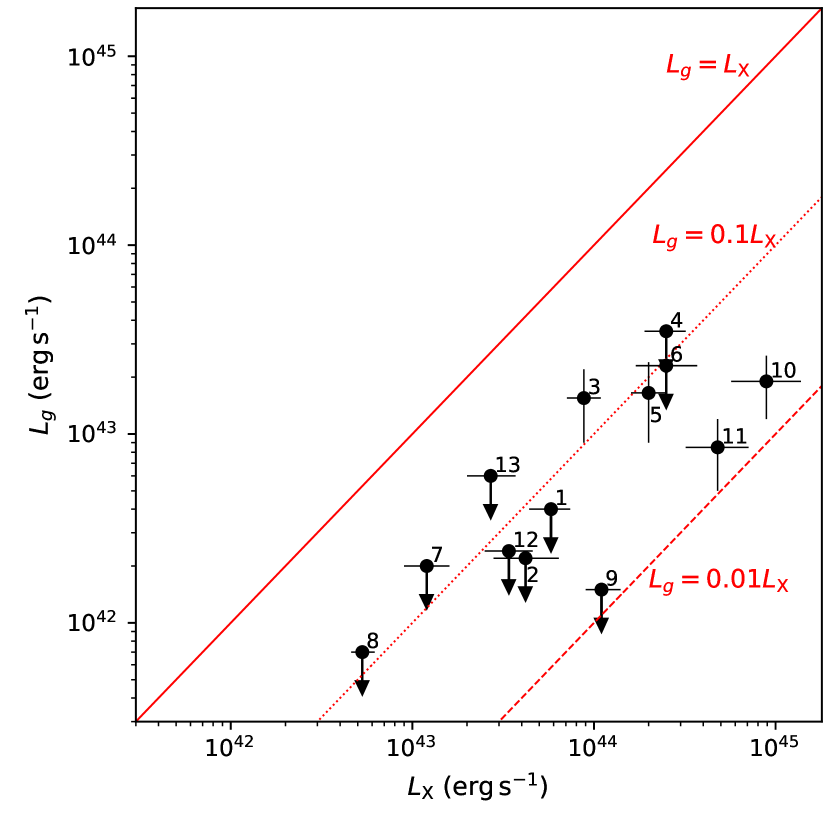
A salient feature of the TDEs discovered by SRG/eROSITA and studied here is their optical faintness. Figure 15 shows the inferred optical vs. X-ray luminosities (from Table 11) for our sample. For the four TDEs that have shown noticeable optical flares in addition to X-ray activity, the ratio is constrained between 0.01 and 0.3. For the remaining TDEs, and for most of them .
These constraints are conservative. Indeed, the possibility that the peak of TDE optical emission has been missed is already taken into account in our estimates (see §4.2). On the other hand, as discussed before, our estimates should be considered lower limits on the maximum X-ray luminosity. Therefore, the ratios can actually be smaller than shown in Fig. 15.
The SRG TDEs studied here are similar to the very first TDEs that came to light thanks to the ROSAT X-ray observatory three decades ago, but drastically different from those discovered recently in the optical/UV, for which typically (e.g. Gezari 2021). Although it is certainly too early to draw firm conclusions on the underlying physical picture, it is possible that we are dealing here with the same orientation effect that was discussed above in relation to the observed TDE volumetric rate. Namely, that most of the TDEs detected by SRG are observed from small angles with respect to the accretion disk axis, whereas optical-UV surveys catch TDEs from quasi-random inclination angles, so that most of them prove to be X-ray faint.
We note, however, that apart from optically faint TDEs SRG/eROSITA has also discovered TDEs with prominent optical activity (Gilfanov et al., 2020, 2021). Several first events of this kind will be discussed by Gilfanov et al. (in prep.). Postponing further discussion of the relationship between optically bright and optically faint X-ray selected TDEs to that paper, we note that the former appear to constitute % of TDEs found during the the SRG all-sky survey.
6 Conclusions
We have presented the first sample of TDEs discovered during the on-going SRG all-sky survey. These 13 events were selected among the multitude of X-ray transients detected by eROSITA during its second scan of the sky (June 10 – December 14, 2020) at a level exceeding at least tenfold the upper limit on the flux in the first scan and confirmed as TDEs by our optical follow-up observations. The most distant of these events (SRG J163831.7+534020) occurred at . Therefore, the SRG survey has already expanded the horizon of TDE X-ray detectability by a factor of compared to the ROSAT all-sky survey, conducted 30 years ago.
The properties of these events are similar to those of TDEs detected (in small numbers) by previous X-ray missions. Namely, the X-ray light curves, currently consisting of a flux measured by eROSITA during the second sky survey and a second measurement/upper limit obtained 6 months later, are in most cases consistent with a decline that started shortly before the eROSITA discovery. Particularly interesting is the TDE SRGE J144738.4+671821, which continued to brighten after its discovery for at least another 6 months.
The early (eRASS2) X-ray spectra of these TDEs can be described by a multi-blackbody accretion disk model with between and keV, which is consistent with nearly critical accretion onto black holes with masses between a few and depending on their (unknown) spins. In reality, we may be dealing with supercritical accretion in most of these events. No evidence of intrinsic absorption is found in the X-ray spectra. Four TDEs remained sufficiently bright in eRASS3 to allow us to analyze their spectra taken by eROSITA at this later epoch. In two cases, we observe a clear spectral hardening, possibly indicating the formation of an accretion disk corona.
Four TDEs have shown a brightening in their optical light curves, concurring with or preceding the X-ray outburst. One of these events (SRGE J163030.2+470125) also exhibited a blue excess in an optical spectrum taken two months after the eROSITA discovery, which disappeared in a spectrum obtained eight months later. The other nine TDEs show no signs of optical activity associated with stellar tidal disruption in existing photometric and spectroscopic data.
All of the TDEs (including those with optical flares) are optically faint in the sense that the estimated optical/X-ray luminosity ratio is less than 0.3 and in most cases . In this respect, this sample is drastically different from TDEs selected at optical-UV wavelengths, which typically have . However, apart from the events presented in this work, SRG/eROSITA has also discovered a few TDEs that demonstrate prominent activity in the optical-UV band (Gilfanov et al., in prep.).
The SRG TDEs are mostly hosted by galaxies located in the green valley on the color-stellar mass diagram, similarly to optically selected TDEs. However, no excess of quiescent post-starburst galaxies or E+A galaxies is observed among the hosts of the SRG TDEs, unlike in some previous studies of optically selected TDEs. This may be partially accounted for by the fact that the host galaxies of the SRG TDEs are more massive on average.
We have constructed the X-ray luminosity function in the range from to erg s-1, the first of its kind to our knowledge. It clearly shows that the TDE volumetric rate decreases with increasing X-ray luminosity. This trend can be described by a power law with a slope of (), or if we exclude from consideration the lowest luminosity bin of erg s-1, which contains just one TDE. This behavior is similar to the trend previously observed for optically selected TDEs, but in that case the decline is marginally steeper, with .
The total rate of X-ray TDEs is estimated at events per galaxy per year. This is an order of magnitude lower than recent estimates of optical TDEs, which possibly indicates that the TDE XLF continues to rise below erg s-1 and/or that X-ray bright events constitute a minority of TDEs. The latter possibility would provide support to the TDE models that predict a strong dependence on the viewing angle, namely, that TDEs can only be observed in X-rays from directions close to the axis of a thick accretion disk formed from the debris of the disrupted star.
The SRG all-sky survey is to continue until the end of 2023, opening up exciting prospects for TDE studies. In particular, we plan to lower our detection threshold for such events by a factor of , which should increase the eROSITA TDE discovery rate by a factor of . This implies that TDEs can be found by the end of the 4-year SRG survey over the entire sky. Furthermore, regular (every 6 months) visits by eROSITA of previously discovered TDEs will provide valuable information on their long-term X-ray evolution.
To conclude, a continued search for TDEs during the SRG all-sky survey should allow us to narrow down the rate of stellar disruptions in galactic nuclei, tighten constraints on the properties of the underlying population of supermassive and, perhaps, intermediate-mass black holes, and shed light on the physics of near- and super-critical accretion onto such objects.
Acknowledgements
This work is based on observations with the eROSITA telescope on board the SRG observatory. The SRG observatory was built by Roskosmos in the interests of the Russian Academy of Sciences represented by its Space Research Institute (IKI) in the framework of the Russian Federal Space Program, with the participation of the Deutsches Zentrum für Luft- und Raumfahrt (DLR). The SRG/eROSITA X-ray telescope was built by a consortium of German Institutes led by MPE, and supported by DLR. The SRG spacecraft was designed, built, launched, and is operated by the Lavochkin Association and its subcontractors. The science data are downlinked via the Deep Space Network Antennae in Bear Lakes, Ussurijsk, and Baykonur, funded by Roskosmos. The eROSITA data used in this work were processed using the eSASS software system developed by the German eROSITA consortium and proprietary data reduction and analysis software developed by the Russian eROSITA Consortium.
The observations at the 6-m telescope of the Special Astrophysical Observatory, Russian Academy of Sciences, were carried out with the financial support of the Ministry of Science and Higher Education of the Russian Federation (including agreement No. 05.619.21.0016, project ID RFMEFI61919X0016). The observations at the AZT-33IK telescope were performed within the basic financing of the FNI II.16 program, using the equipment of the Angara sharing center555http://ckp-rf.ru/ckp/3056/. CMO SAI MSU observations are supported by the M.V. Lomonosov Moscow State University Program of Development. The authors are grateful to TÜBITAK, IKI, KFU, and AST for their partial support in using RTT150 (the Russian–Turkish 1.5-m telescope in Antalya).
SS, MG, PM, RB, AM, and GH acknowledge the support of this research of by grant 21-12-00343 from the Russian Science Foundation. Y. Yao thanks the Heising–Simons Foundation for financial support. The work of KAP and AVD is supported by the Ministry of science and higher education of Russia under contract 075-15-2020-778 (observations of objects with extreme energy release) in the framework of the Large scientific projects program within the national project “Science”. The work of AAB and AMCh was supported by the Scientific and Educational School of M.V. Lomonosov Moscow State University “Fundamental and applied space research”. The work of IFB and RIG was supported by subsidy 0671-2020 0052 allocated to the Kazan Federal University for state assignment in the sphere of scientific activities.
Data availability
X-ray data analysed in this article were used by permission of the Russian SRG/eROSITA consortium. The data will become publicly available as part of the corresponding SRG/eROSITA data release along with the appropriate calibration information. Optical data used in the article will be shared on reasonable request to the corresponding author.
Appendix A Short-term X-ray light curves
During each SRG all-sky survey, eROSITA monitors any X-ray source in the sky for a period of at least one day. Each such visit consists of a series of s-long measurements taken at 4-hour intervals. Therefore, apart from the long-term X-ray light curves of the TDEs presented in Fig. 1, we can also construct their short-term light curves during eRASS2 and eRASS3 (if a given transient remained detectable during eRASS3). These light curves are presented in Figs. 16 and 17. They span between and days, depending on the ecliptic latitudes, , of the TDEs (as a result of the SRG survey’s strategy, Sunyaev et al. 2021).
None of the TDEs exhibit substantial X-ray variability on time scales between 4 hours and a few days. This may place interesting constraints on TDE models.
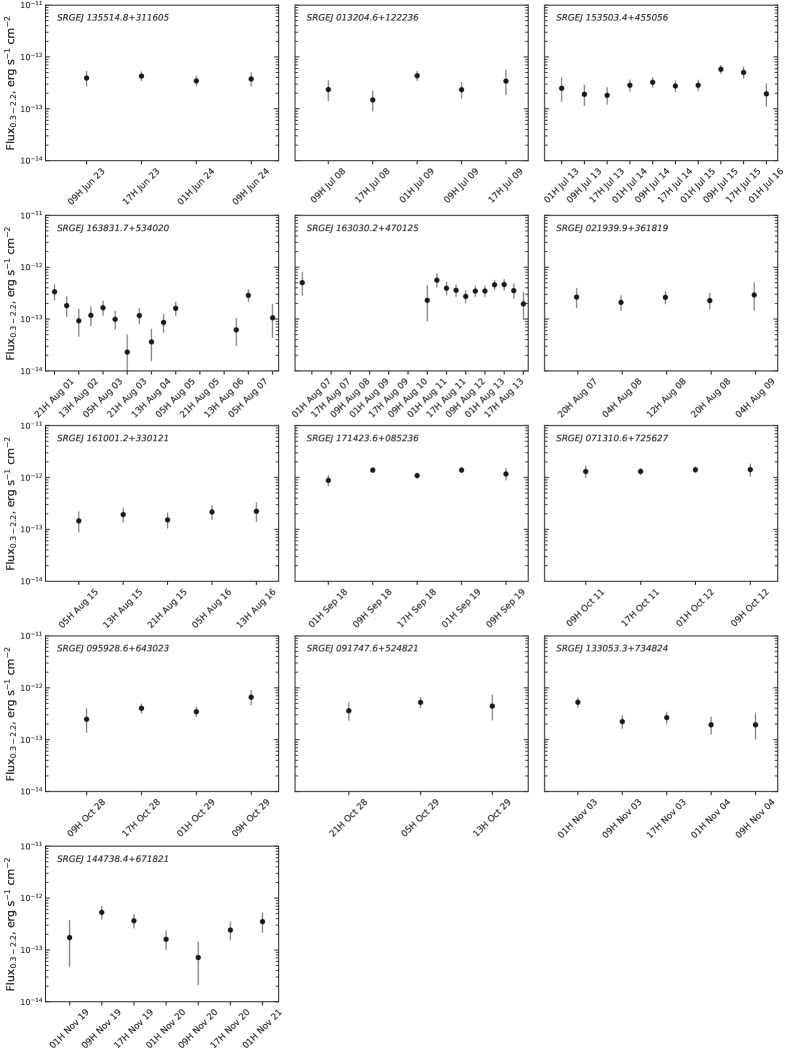
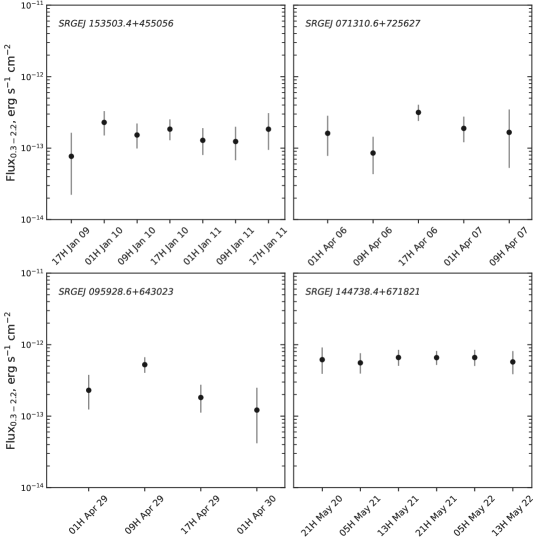
Appendix B Optical observational details and data reduction
All Keck-I/LRIS spectroscopic observations were conducted using the blue side grism 300/3400, the dichroic 560, the red side grating 400/8500, and a slit mask of 1′′. This setup provides a spectral coverage of 3200–10250 Å. All LRIS spectra were reduced and extracted using Lpipe (Perley, 2019).
BTA/SCORPIO-2 spectroscopic observations were conducted with the VPHG940@600 grating, providing a spectral range of 3500–8500 Å. The spectrum of SRGE J135514.8+311605 was obtained with a slit of 1′′ and that of SRGE J163030.2+470125 with a slit of 2′′. During both observations, the seeing was near 1.2″. SCORPIO-2 photometry was done in a pixel imaging mode, corresponding to a binning of 22 ( pixel scale).
Photometry at the CMO’s 2.5-m telescope was conducted using the NBI CCD-photometer with a pixel scale. Spectroscopy at the 2.5-m telescope was done using the TDS instrument. The spectra were obtained in a range of 3600–7500 Å with a 1″ slit, at a spectral resolution of . The spectrograph and data reduction are described in (Potanin et al., 2020). Photometry at the CMO’s RC600 telescope was carried out using the Andor iKon-L camera with pixels and a pixel scale of .
AZT-33IK/ADAM spectra were obtained using a 2″ slit and the VPHG600G grating (spectral range 3700–7340 Å, resolution 8.8 Å). Photometric observations at AZT-33IK were done using the CCD photometer, consisting of a focal reducer and the Andor iKon-M 934 camera with pixels, which provide a field of view with a pixel scale.
Photometric observations at RTT150 were conducted using the TFOSC instrument equipped with an ANDOR iKon-L DZ936N CCD detector with a pixel scale.
Images and spectroscopy from BTA, AZT-33IK, and RTT150 were processed using iraf and our own software. Aperture photometry was done using the apphot task from the iraf digiphot package. Measurement of source fluxes was done relative to nearby bright stars, with the aperture size for each observation series defined such that the total flux was obtained.
The obtained magnitudes were calibrated using the magnitudes of secondary photometric standards in the source field with a brightness comparable to or greater than the flux of the target object. We used PSF magnitudes for the calibration stars from SDSS (Ahumada et al., 2020) if available, or from Pan-STARRS1 DR2 (Chambers et al., 2016) otherwise.
Appendix C Host Galaxy Analysis.
As described in §5.2, we fit the historical photometry of the TDE hosts following the approach used by van Velzen et al. (2021b). The FSPS (Conroy & Wechsler, 2009) and Prospector (Johnson et al., 2021) packages are used to find the synthetic galaxy model that is the best description for the host galaxy photometry. Figure 18 present the host SEDs and the fitted models. The fitted parameters are given in Table 12.
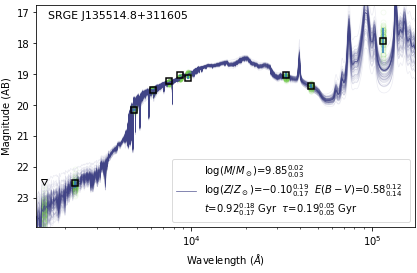
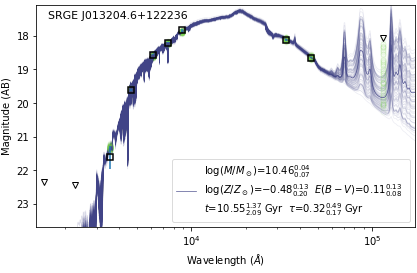
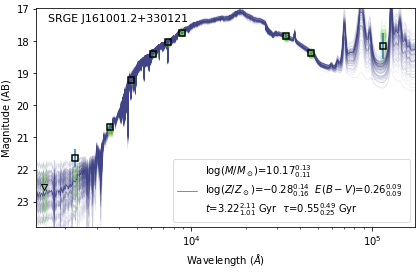
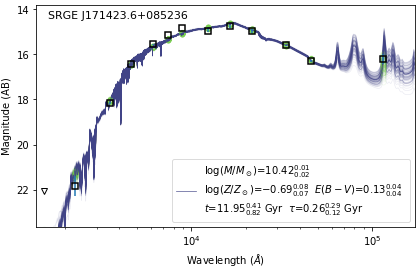
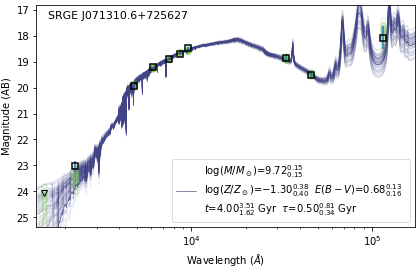
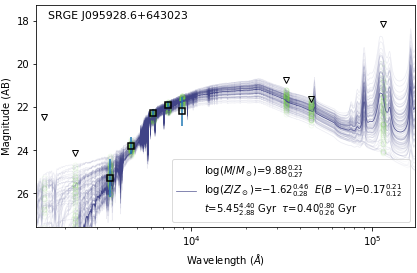
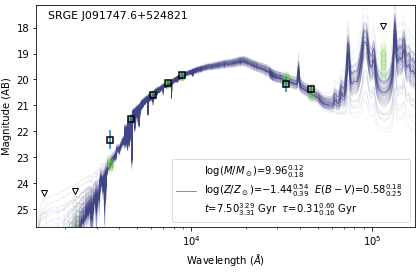
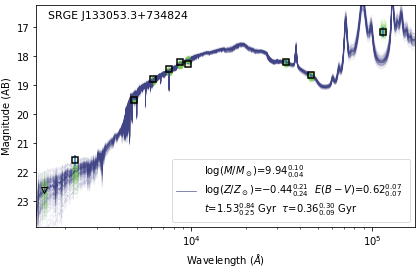
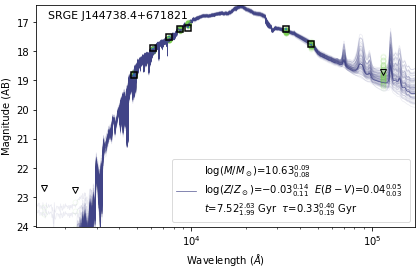
| Object | age | dust | ||||
|---|---|---|---|---|---|---|
| Gyr | Gyr | |||||
| SRGE J135514.8+311605 | ||||||
| SRGE J013204.6+122236 | ||||||
| SRGE J153503.4+455056 | ||||||
| SRGE J163831.7+534020 | ||||||
| SRGE J163030.2+470125 | ||||||
| SRGE J021939.9+361819 | ||||||
| SRGE J161001.2+330121 | ||||||
| SRGE J171423.6+085236 | ||||||
| SRGE J071310.6+725627 | ||||||
| SRGE J095928.6+643023 | ||||||
| SRGE J091747.6+524821 | ||||||
| SRGE J133053.3+734824 | ||||||
| SRGE J144738.4+671821 |
References
- Abramowicz et al. (1988) Abramowicz M. A., Czerny B., Lasota J. P., Szuszkiewicz E., 1988, ApJ, 332, 646
- Afanasiev & Moiseev (2011) Afanasiev V. L., Moiseev A. V., 2011, Baltic Astronomy, 20, 363
- Afanasiev et al. (2016) Afanasiev V. L., Dodonov S. N., Amirkhanyan V. R., Moiseev A. V., 2016, Astrophysical Bulletin, 71, 479
- Ahumada et al. (2020) Ahumada R., et al., 2020, ApJS, 249, 3
- Alam et al. (2015) Alam S., et al., 2015, ApJS, 219, 12
- Arnaud (1996) Arnaud K. A., 1996, in Jacoby G. H., Barnes J., eds, Astronomical Society of the Pacific Conference Series Vol. 101, Astronomical Data Analysis Software and Systems V. p. 17, http://adsabs.harvard.edu/abs/1996ASPC..101...17A
- Assef et al. (2013) Assef R. J., et al., 2013, ApJ, 772, 26
- Baldwin et al. (1981) Baldwin J. A., Phillips M. M., Terlevich R., 1981, PASP, 93, 5
- Bell et al. (2003) Bell E. F., McIntosh D. H., Katz N., Weinberg M. D., 2003, ApJS, 149, 289
- Bellm et al. (2019) Bellm E. C., et al., 2019, PASP, 131, 018002
- Berdnikov et al. (2020) Berdnikov L. N., Belinskii A. A., Shatskii N. I., Burlak M. A., Ikonnikova N. P., Mishin E. O., Cheryasov D. V., Zhuiko S. V., 2020, Astronomy Reports, 64, 310
- Blagorodnova et al. (2019) Blagorodnova N., et al., 2019, ApJ, 873, 92
- Brinchmann et al. (2004) Brinchmann J., Charlot S., White S. D. M., Tremonti C., Kauffmann G., Heckman T., Brinkmann J., 2004, MNRAS, 351, 1151
- Brunner et al. (2021) Brunner H., et al., 2021, arXiv e-prints, p. arXiv:2106.14517
- Burenin et al. (2016) Burenin R. A., et al., 2016, Astronomy Letters, 42, 295
- Calzetti et al. (2000) Calzetti D., Armus L., Bohlin R. C., Kinney A. L., Koornneef J., Storchi-Bergmann T., 2000, ApJ, 533, 682
- Cappellari (2017) Cappellari M., 2017, MNRAS, 466, 798
- Chambers et al. (2016) Chambers K. C., et al., 2016, arXiv e-prints, p. arXiv:1612.05560
- Cid Fernandes et al. (2010) Cid Fernandes R., Stasińska G., Schlickmann M. S., Mateus A., Vale Asari N., Schoenell W., Sodré L., 2010, MNRAS, 403, 1036
- Conroy & Wechsler (2009) Conroy C., Wechsler R. H., 2009, ApJ, 696, 620
- Curd & Narayan (2019) Curd B., Narayan R., 2019, MNRAS, 483, 565
- Dai et al. (2018) Dai L., McKinney J. C., Roth N., Ramirez-Ruiz E., Miller M. C., 2018, ApJ, 859, L20
- Davis et al. (2005) Davis S. W., Blaes O. M., Hubeny I., Turner N. J., 2005, ApJ, 621, 372
- Done et al. (2012) Done C., Davis S. W., Jin C., Blaes O., Ward M., 2012, MNRAS, 420, 1848
- Donley et al. (2002) Donley J. L., Brandt W. N., Eracleous M., Boller T., 2002, AJ, 124, 1308
- Esquej et al. (2008) Esquej P., et al., 2008, A&A, 489, 543
- Evans & Kochanek (1989) Evans C. R., Kochanek C. S., 1989, ApJ, 346, L13
- Flewelling et al. (2020) Flewelling H. A., et al., 2020, ApJS, 251, 7
- French et al. (2016) French K. D., Arcavi I., Zabludoff A., 2016, ApJ, 818, L21
- Gaia Collaboration et al. (2016) Gaia Collaboration et al., 2016, A&A, 595, A1
- Gaia Collaboration et al. (2021) Gaia Collaboration et al., 2021, A&A, 649, A1
- Gezari (2021) Gezari S., 2021, arXiv e-prints, p. arXiv:2104.14580
- Gezari et al. (2012) Gezari S., et al., 2012, Nature, 485, 217
- Gezari et al. (2017) Gezari S., Cenko S. B., Arcavi I., 2017, ApJ, 851, L47
- Gilfanov et al. (2020) Gilfanov M., et al., 2020, The Astronomer’s Telegram, 14246, 1
- Gilfanov et al. (2021) Gilfanov M., Sazonov S., Medvedev P., Khorunzhev G., Sunyaev R., Yao Y., Kulkarni S. R., Sharma Y., 2021, The Astronomer’s Telegram, 14800, 1
- Graham et al. (2019) Graham M. J., et al., 2019, PASP, 131, 078001
- Gurzadian & Ozernoi (1981) Gurzadian V. G., Ozernoi L. M., 1981, A&A, 95, 39
- HI4PI Collaboration et al. (2016) HI4PI Collaboration et al., 2016, A&A, 594, A116
- Hammerstein et al. (2021) Hammerstein E., et al., 2021, ApJ, 908, L20
- Heckman et al. (2005) Heckman T. M., Ptak A., Hornschemeier A., Kauffmann G., 2005, ApJ, 634, 161
- Hills (1975) Hills J. G., 1975, Nature, 254, 295
- Hinkle et al. (2021) Hinkle J. T., et al., 2021, MNRAS, 500, 1673
- Ho (2008) Ho L. C., 2008, ARA&A, 46, 475
- Holoien et al. (2019) Holoien T. W. S., et al., 2019, ApJ, 883, 111
- Jiang et al. (2021) Jiang N., Wang T., Hu X., Sun L., Dou L., Xiao L., 2021, ApJ, 911, 31
- Johnson et al. (2021) Johnson B. D., Leja J., Conroy C., Speagle J. S., 2021, ApJS, 254, 22
- Jonker et al. (2020) Jonker P. G., Stone N. C., Generozov A., van Velzen S., Metzger B., 2020, ApJ, 889, 166
- Kamus et al. (2002) Kamus S. F., Denisenko S. A., Lipin N. A., Tergoev V. I., Papushev P. G., Druzhinin S. A., Karavaev Y. S., Palachev Y. M., 2002, J. Opt. Technol., 69, 674
- Kesden (2012) Kesden M., 2012, Phys. Rev. D, 85, 024037
- Kewley et al. (2006) Kewley L. J., Groves B., Kauffmann G., Heckman T., 2006, MNRAS, 372, 961
- Khabibullin & Sazonov (2014) Khabibullin I., Sazonov S., 2014, MNRAS, 444, 1041
- Khabibullin et al. (2014) Khabibullin I., Sazonov S., Sunyaev R., 2014, MNRAS, 437, 327
- Khabibullin et al. (2020a) Khabibullin I., Sunyaev R., Churazov E., Gilfanov M., Medvedev P., Sazonov S., 2020a, The Astronomer’s Telegram, 13494, 1
- Khabibullin et al. (2020b) Khabibullin I., et al., 2020b, The Astronomer’s Telegram, 13499, 1
- Komossa (2015) Komossa S., 2015, Journal of High Energy Astrophysics, 7, 148
- Komossa & Bade (1999) Komossa S., Bade N., 1999, A&A, 343, 775
- Komossa et al. (2004) Komossa S., Halpern J., Schartel N., Hasinger G., Santos-Lleo M., Predehl P., 2004, ApJ, 603, L17
- Koratkar & Blaes (1999) Koratkar A., Blaes O., 1999, PASP, 111, 1
- LaMassa et al. (2010) LaMassa S. M., Heckman T. M., Ptak A., Martins L., Wild V., Sonnentrucker P., 2010, ApJ, 720, 786
- Law-Smith et al. (2017) Law-Smith J., Ramirez-Ruiz E., Ellison S. L., Foley R. J., 2017, ApJ, 850, 22
- Lidskii & Ozernoi (1979) Lidskii V. V., Ozernoi L. M., 1979, Soviet Astronomy Letters, 5, 16
- Liu et al. (2019) Liu X.-L., Dou L.-M., Shen R.-F., Chen J.-H., 2019, arXiv e-prints, p. arXiv:1912.06081
- Lodato & Rossi (2011) Lodato G., Rossi E. M., 2011, MNRAS, 410, 359
- Lu & Bonnerot (2020) Lu W., Bonnerot C., 2020, MNRAS, 492, 686
- Lu et al. (2016) Lu W., Kumar P., Evans N. J., 2016, MNRAS, 458, 575
- Magorrian & Tremaine (1999) Magorrian J., Tremaine S., 1999, MNRAS, 309, 447
- Mainzer et al. (2014) Mainzer A., et al., 2014, ApJ, 792, 30
- Makishima et al. (1986) Makishima K., Maejima Y., Mitsuda K., Bradt H. V., Remillard R. A., Tuohy I. R., Hoshi R., Nakagawa M., 1986, ApJ, 308, 635
- Maksym et al. (2010) Maksym W. P., Ulmer M. P., Eracleous M., 2010, ApJ, 722, 1035
- Martin et al. (2005) Martin D. C., et al., 2005, ApJ, 619, L1
- Masci et al. (2019) Masci F. J., et al., 2019, PASP, 131, 018003
- Mendel et al. (2014) Mendel J. T., Simard L., Palmer M., Ellison S. L., Patton D. R., 2014, ApJS, 210, 3
- Metzger & Stone (2016) Metzger B. D., Stone N. C., 2016, MNRAS, 461, 948
- Million et al. (2016) Million C., et al., 2016, ApJ, 833, 292
- Mummery (2021) Mummery A., 2021, arXiv e-prints, p. arXiv:2104.06212
- Novikov & Thorne (1973) Novikov I. D., Thorne K. S., 1973, in Black Holes (Les Astres Occlus). pp 343–450
- Oke et al. (1995) Oke J. B., et al., 1995, PASP, 107, 375
- Perley (2019) Perley D. A., 2019, PASP, 131, 084503
- Piran et al. (2015) Piran T., Svirski G., Krolik J., Cheng R. M., Shiokawa H., 2015, ApJ, 806, 164
- Potanin et al. (2020) Potanin S. A., et al., 2020, Astronomy Letters, 46, 836
- Predehl et al. (2021) Predehl P., et al., 2021, A&A, 647, A1
- Rees (1988) Rees M. J., 1988, Nature, 333, 523
- Rossi et al. (2021) Rossi E. M., Stone N. C., Law-Smith J. A. P., Macleod M., Lodato G., Dai J. L., Mandel I., 2021, Space Sci. Rev., 217, 40
- Saxton et al. (2008) Saxton R. D., Read A. M., Esquej P., Freyberg M. J., Altieri B., Bermejo D., 2008, A&A, 480, 611
- Saxton et al. (2021) Saxton R., Komossa S., Auchettl K., Jonker P. G., 2021, Space Sci. Rev., 217, 18
- Sazonov et al. (2004) Sazonov S. Y., Ostriker J. P., Sunyaev R. A., 2004, MNRAS, 347, 144
- Schmidt (1968) Schmidt M., 1968, ApJ, 151, 393
- Shakura & Sunyaev (1973) Shakura N. I., Sunyaev R. A., 1973, A&A, 500, 33
- Shiokawa et al. (2015) Shiokawa H., Krolik J. H., Cheng R. M., Piran T., Noble S. C., 2015, ApJ, 804, 85
- Skrutskie et al. (2006) Skrutskie M. F., et al., 2006, AJ, 131, 1163
- Smith et al. (2020) Smith K. W., et al., 2020, PASP, 132, 085002
- Stone & Metzger (2016) Stone N. C., Metzger B. D., 2016, MNRAS, 455, 859
- Stone et al. (2020) Stone N. C., Vasiliev E., Kesden M., Rossi E. M., Perets H. B., Amaro-Seoane P., 2020, Space Sci. Rev., 216, 35
- Sunyaev et al. (2021) Sunyaev R., et al., 2021, arXiv e-prints, p. arXiv:2104.13267
- Tonry et al. (2018) Tonry J. L., et al., 2018, PASP, 130, 064505
- Vazdekis et al. (2015) Vazdekis A., et al., 2015, MNRAS, 449, 1177
- Veilleux & Osterbrock (1987) Veilleux S., Osterbrock D. E., 1987, ApJS, 63, 295
- Wang & Merritt (2004) Wang J., Merritt D., 2004, ApJ, 600, 149
- Watarai et al. (2000) Watarai K.-y., Fukue J., Takeuchi M., Mineshige S., 2000, PASJ, 52, 133
- Waters et al. (2020) Waters C. Z., et al., 2020, ApJS, 251, 4
- Wen et al. (2021) Wen S., Jonker P. G., Stone N. C., Zabludoff A. I., 2021, arXiv e-prints, p. arXiv:2104.01498
- Wevers (2020) Wevers T., 2020, MNRAS, 497, L1
- Wevers et al. (2021) Wevers T., et al., 2021, ApJ, 912, 151
- Worthey & Ottaviani (1997) Worthey G., Ottaviani D. L., 1997, ApJS, 111, 377
- Wright et al. (2010) Wright E. L., et al., 2010, AJ, 140, 1868
- Yao et al. (2020) Yao Y., et al., 2020, ApJ, 900, 46
- Zabludoff et al. (2021) Zabludoff A., et al., 2021, Space Sci. Rev., 217, 54
- van Velzen (2018) van Velzen S., 2018, ApJ, 852, 72
- van Velzen et al. (2011) van Velzen S., et al., 2011, ApJ, 741, 73
- van Velzen et al. (2016) van Velzen S., Mendez A. J., Krolik J. H., Gorjian V., 2016, ApJ, 829, 19
- van Velzen et al. (2020) van Velzen S., Holoien T. W. S., Onori F., Hung T., Arcavi I., 2020, Space Sci. Rev., 216, 124
- van Velzen et al. (2021a) van Velzen S., Pasham D. R., Komossa S., Yan L., Kara E. A., 2021a, Space Sci. Rev., 217, 63
- van Velzen et al. (2021b) van Velzen S., et al., 2021b, ApJ, 908, 4