ssdatta@princeton.edu.
Forced Imbibition in Stratified Porous Media:
Fluid Dynamics and Breakthrough Saturation
Abstract
Imbibition, the displacement of a nonwetting fluid by a wetting fluid, plays a central role in diverse energy, environmental, and industrial processes. While this process is typically studied in homogeneous porous media with uniform permeabilities, in many cases, the media have multiple parallel strata of different permeabilities. How such stratification impacts the fluid dynamics of imbibition, as well as the fluid saturation after the wetting fluid breaks through to the end of a given medium, is poorly understood. We address this gap in knowledge by developing an analytical model of imbibition in a porous medium with two parallel strata, combined with a pore network model that explicitly describes fluid crossflow between the strata. By numerically solving these models, we examine the fluid dynamics and fluid saturation left after breakthrough. We find that the breakthrough saturation of nonwetting fluid is minimized when the imposed capillary number Ca is tuned to a value Ca∗ that depends on both the structure of the medium and the viscosity ratio between the two fluids. Our results thus provide quantitative guidelines for predicting and controlling flow in stratified porous media, with implications for water remediation, oil/gas recovery, and applications requiring moisture management in diverse materials.
I Introduction
Imbibition, the process by which a wetting fluid displaces a nonwetting fluid from a porous medium, plays crucial roles in our lives. It underlies key energy processes, such as oil/gas recovery [1, 2, 3, 4] and water management in fuel cells [5]; environmental processes, such as geological CO2 sequestration [6, 7, 8, 9], groundwater aquifer remediation [10, 11], and moisture infiltration in soil and wood [12, 13, 14, 15, 16]; and diverse other applications including operation of chemical reactors [17] and wicking in fabrics [18, 19], paper microfluidics [20], building materials [21, 22, 23], coatings [24], and diagnostic devices [25]. As a result, the physics of imbibition has been studied widely. A common simplifying assumption is that the medium is homogeneous, with uniformly-disordered pores of a single mean size with no spatial correlations between them. For such homogeneous media, decades of previous work have demonstrated how different invasion dynamics and flow patterns can arise depending on the pore size, solid wettability, surface roughness, as well as the fluid viscosity, interfacial tension, and flow boundary conditions [26, 27, 8, 28, 29, 30, 31, 32, 33, 34, 35, 36, 37, 38, 39].
However, in many cases, porous media are not homogeneous. Instead, they can have parallel strata, characterized by different mean pore sizes, oriented along the direction of macroscopic fluid flow [40, 41, 42, 43]; these can further impact the interfacial dynamics in complex ways [44, 43, 45, 46, 47, 40, 41, 42]. Being able to predict and control imbibition in stratified porous media is therefore both fundamentally interesting and of critical practical importance. Some studies have indicated that heterogeneous invasion can arise during spontaneous imbibition from a bulk fluid reservoir [48, 49], but did not investigate the distinct case of forced imbibition at a fixed flow rate. Other studies have provided tantalizing evidence that different heterogeneous invasion behaviors can arise during forced imbibition, but only probed a narrow range of flow rates [50, 51, 52], only focused on bulk fluid saturation [50, 53, 47], or explored small differences in pore size between strata [52, 50, 54, 47, 55, 56, 57, 58]. A systematic study of these dynamics is lacking, and thus the physics of imbibition in stratified porous media remains poorly understood.
Our previous work took a first step towards addressing these gaps in knowledge by experimentally visualizing the onset of forced imbibition in stratified porous media [59]. Our work explored a wide range of imposed volumetric flow rates in media with parallel strata characterized by a large permeability ratio, arising from different mean pore sizes in the strata. We found that imbibition is spatially heterogeneous and exhibits an unexpected transition in fluid displacement behavior: for small , the wetting fluid preferentially invades the fine stratum of a smaller mean pore size, while for sufficiently large , the fluid instead preferentially invades the coarse stratum of a larger mean pore size. This transition, which is not captured by models of imbibition that assume a homogeneous medium overall, reflects the complex interplay between pore-scale capillary forces driving imbibition in the different strata, transverse viscous forces due to crossflow between strata, and longitudinal viscous forces due to macroscopic flow through the medium. However, while these results provide insight into the initial nature of imbibition at the inlet of the medium, they do not consider the subsequent dynamics as the fluid continues to move through the medium and ultimately breaks through at the outlet.
These dynamics can play a critical role in many of the applications mentioned above. In particular, they determine two key quantities that are often used as metrics of performance: the breakthrough time and the breakthrough nonwetting fluid saturation . For example, in oil/gas recovery [60, 61] and groundwater remediation [62, 63], a wetting fluid is often used to displace and remove nonwetting fluid, such as hydrocarbons and non-aqueous contaminants. In these cases, the fluid properties and injection conditions must be chosen to most rapidly remove the largest quantity of nonwetting fluid, and therefore minimize both and . However, due to the dearth of predictive models of imbibition, current approaches rely on trial and error. Hence, an improved understanding of the full dynamics of forced imbibition in stratified porous media is needed.
Here, we combine analytical theory with computational pore network modeling to examine these full dynamics. First, to gain intuition, we develop a theoretical model of imbibition in a porous medium with two parallel strata by considering the balance of capillary and viscous forces, neglecting crossflow between the strata. This balance is quantified by the global capillary number Ca defined using macroscopic quantities, where is the wetting fluid dynamic shear viscosity, is the overall cross-section area of the medium, and is the interfacial tension between the fluids. Next, to assess the influence of crossflow, we design a pore network model that explicitly treats this behavior. By numerically solving both models, we explore the full dynamics of imbibition; in particular, we investigate how the performance metrics and depend on Ca as well as the structure of the medium and the viscosity ratio of the two fluids. Our findings suggest a simple rule: to minimize both and , as is often desirable, Ca should be tuned to a transition value Ca∗ that emerges from our theory, contrary to the conventional belief that Ca should be maximized. Taken together, these results thus demonstrate that – in addition other commonly-considered factors such as wettability and fluid properties – stratification is another important factor that must also be considered when modeling imbibition in porous media. More broadly, our work provides quantitative guidelines for predicting and controlling flow in stratified porous media, with implications for water remediation, oil/gas recovery, and applications requiring moisture management in diverse materials.
II Theoretical Model
For Imbibition Dynamics
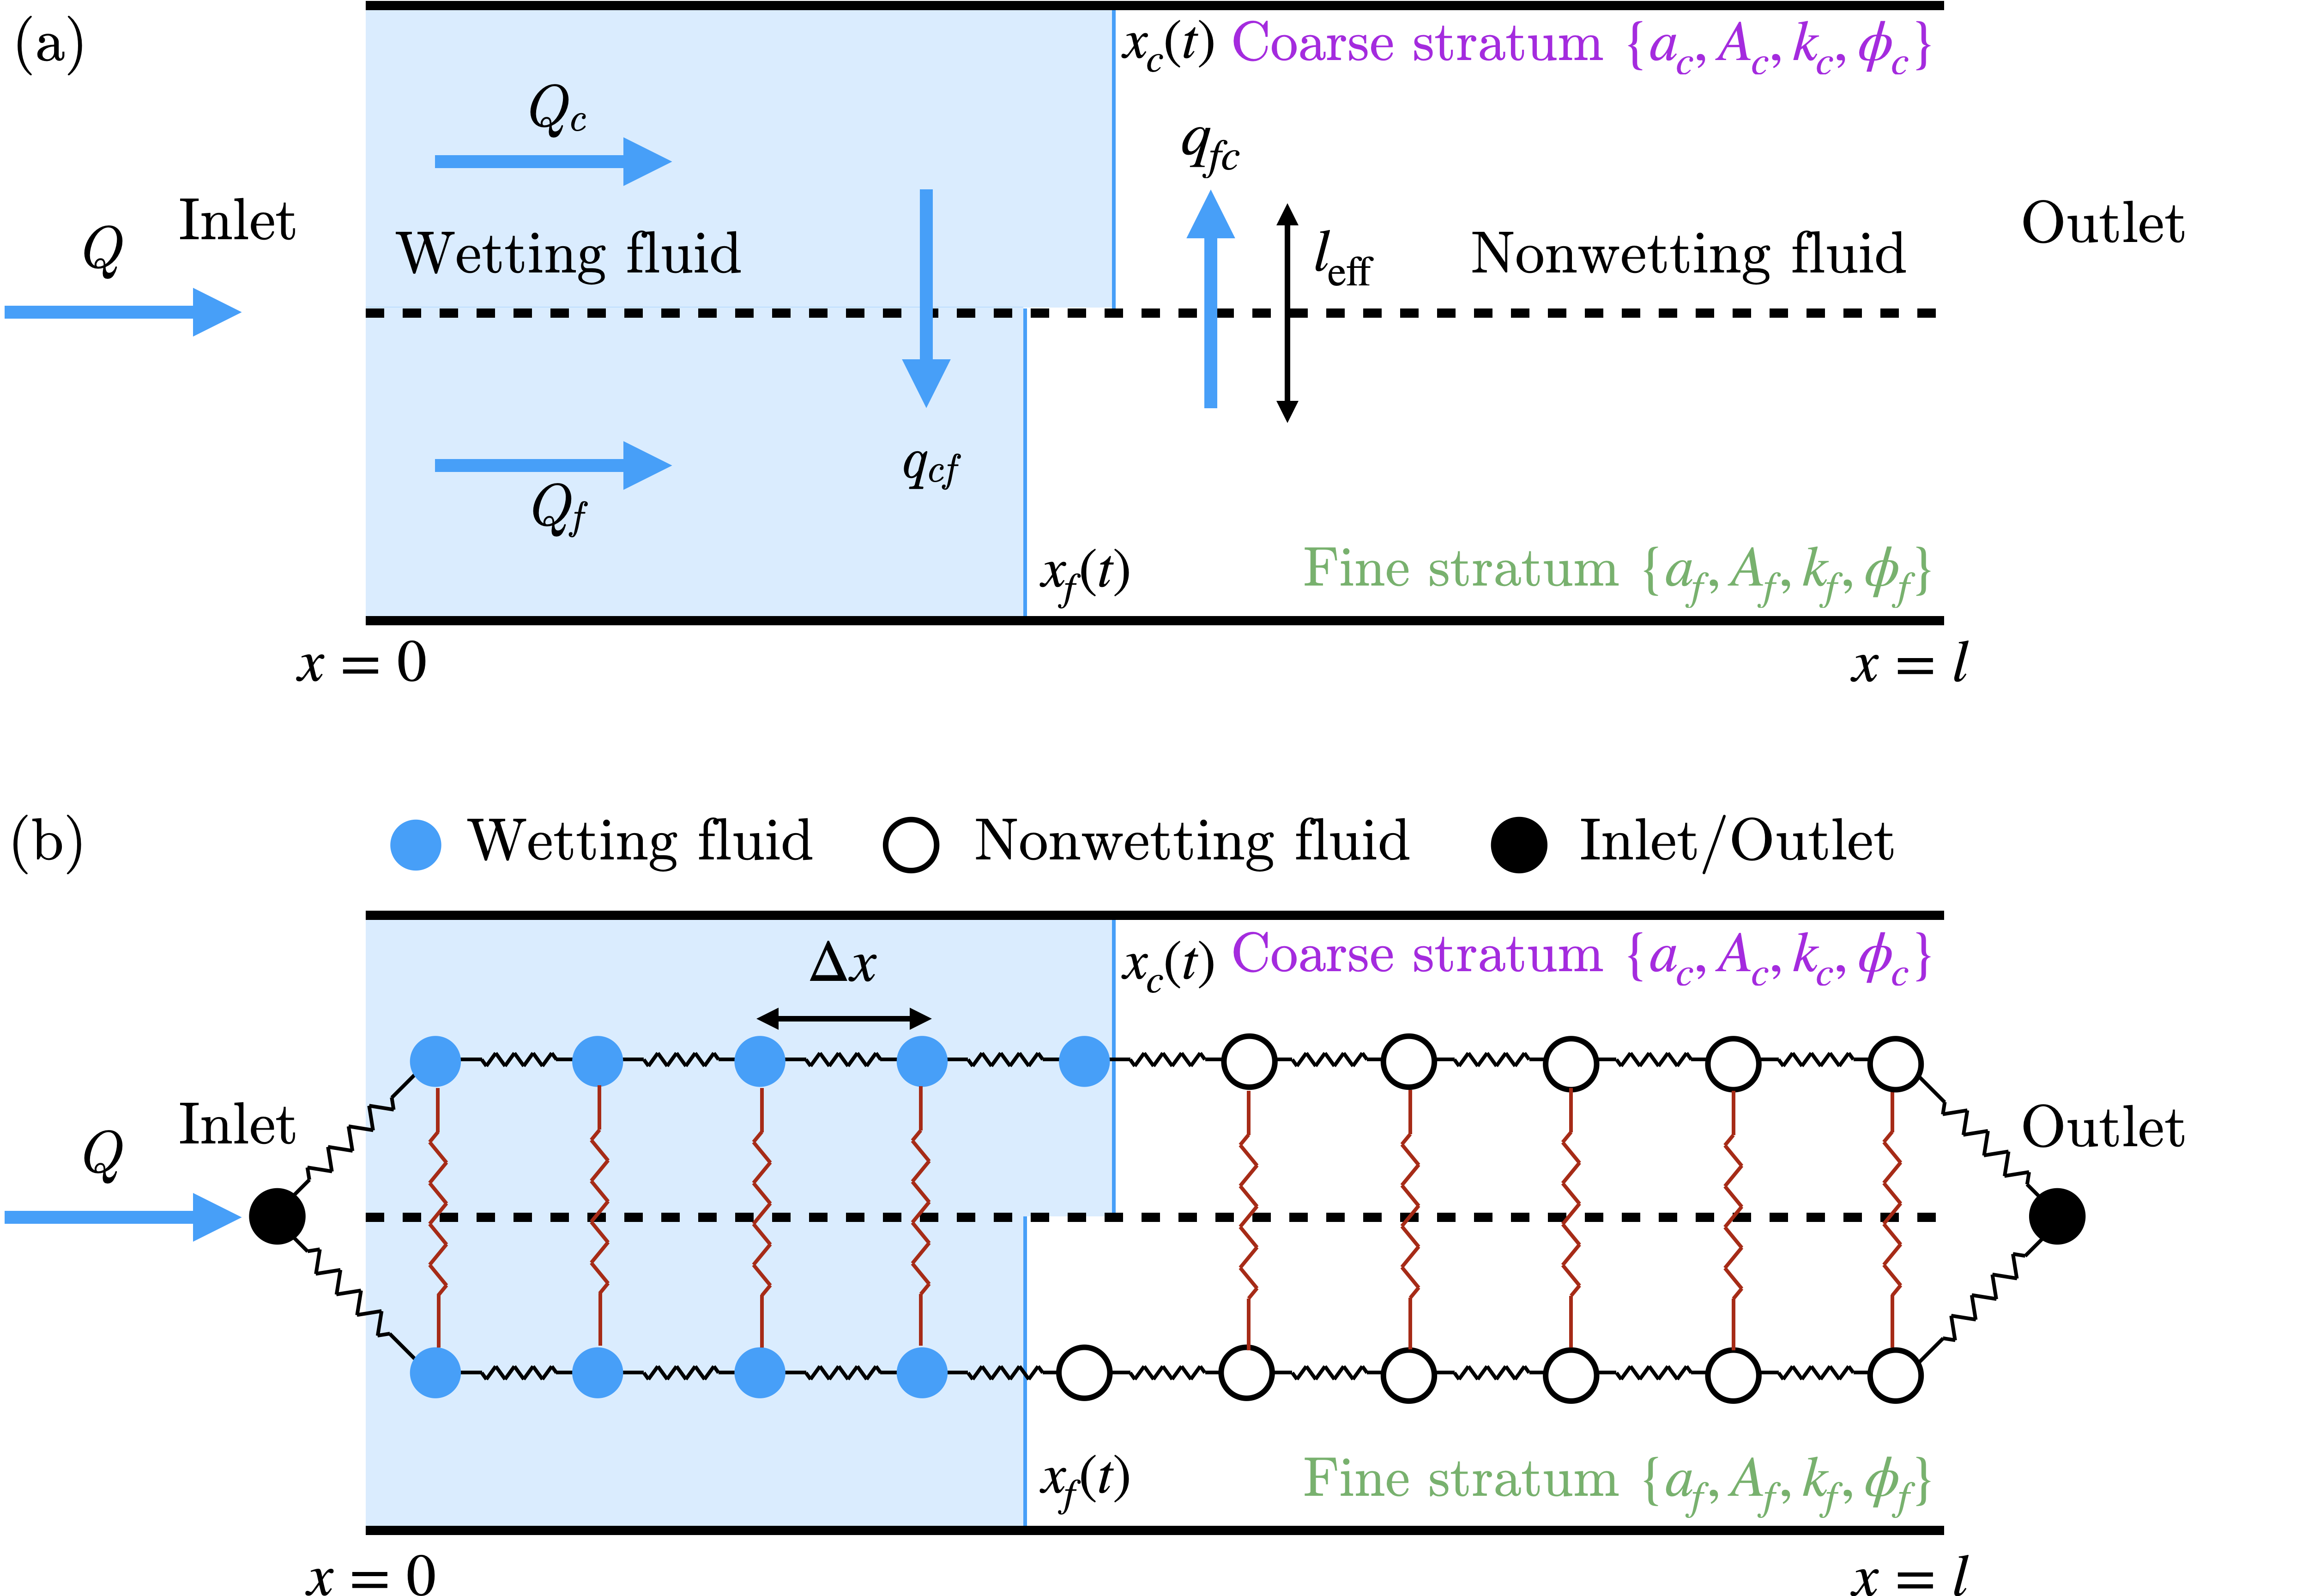
As a first step toward modeling the complex flow behavior during imbibition, we consider a porous medium with parallel coarse and fine strata, characterized by uniform pore throat radii , cross-sectional areas , permeabilities , and porosities ; hereafter denotes the coarse and fine stratum, respectively. A schematic of this model is shown in Figure 1(a). Following our previous work [59], we analyze the distribution of pressures in each fluid and each stratum during imbibition. The pressure gradient in each stratum and fluid is described by Darcy’s law , where denotes the wetting and nonwetting fluids, respectively. Furthermore, at the interface between the fluids, the pressure in the wetting fluid is reduced by the capillary pressure compared to the nonwetting fluid [64, 65, 66, 67, 68].
The flow rate can vary along the length of each stratum due to crossflow. Without loss of generality, we assume that the initial longitudinal position of the invading wetting/nonwetting fluid interface in the coarse stratum, , is slightly ahead of the position of the invading interface in the fine stratum, . Because the strata are in contact with each other over their entire length , fluid can flow across them. We represent this crossflow by , the transverse volumetric flow rate from stratum to stratum per unit length along the medium; for simplicity, we consider that crossflow only occurs within a given fluid, i.e., there is no crossflow across different fluid phases. Mass conservation then implies that
| (1) |
| (2) |
| (3) |
where we have taken the porosity to be equal across the different strata for simplicity.
Using Equations 1, 2, and 3, we then use Darcy’s Law in the coarse stratum from the inlet to the outlet to obtain an expression for the total pressure drop across the medium of length :
| (4) |
Repeating this procedure for the fine stratum results in another expression for the total pressure drop across the medium:
| (5) |
Because the fluid pressure is equal across the strata at the inlet and outlet, Eq. (4) is subtracted from (5):
| (6) |
We introduce the ansatz that a difference in pressures in the strata at a given longitudinal position drives a transverse crossflow between the strata: , where is a proportionality constant. To obtain the crossflow term, we integrate Darcy’s law to some arbitrary distance and simply subtract the pressures obtained in each stratum at that location. This procedure yields the following integral equations for the crossflow in the wetting and nonwetting fluids, respectively:
| (7) |
| (8) |
Together, the six coupled integral equations Eqs. (1), (2), (3), (6), (7), and (8) provide a description of the full dynamics of imbibition in a stratified porous medium. However, in practice, analytically solving these equations is challenging. Therefore, in our previous work, we performed a linear stability analysis of these equations [59] to predict the flow behavior only at its incipient stages of imbibition. This analysis predicted two different types of behavior during the beginning of imbibition, which we confirmed using experiments: fine-preferential invasion, where the wetting fluid invades the fine stratum faster, and coarse-preferential invasion, where the wetting fluid invades the coarse stratum faster. The linear stability analysis does not capture any of the subsequent dynamics and therefore, does not enable predictions for the two key performance metrics and . Hence, in this work, we turn to numerical simulations of Eqs. (1), (2), (3), (6), (7), (8) to examine these subsequent dynamics.
Physical Parameter Variable Experimental Range Simulated Range Reservoir Range Pore throat size ratio 8.1 1.4 to 14 1 to [43] Cross section area ratio 0.2 to 4 0.1 to 10 to [69] Normalized medium length 5 to 22 0.7 to 70 to [70, 71] Fluid viscosity ratio 6.2 0.1 to 10 0.6 to [72] Capillary number Ca to to to [61, 71, 70, 72]
A notable idealization of this theoretical model is that it treats the nonwetting/wetting fluid interface in each stratum as a flat front that completely displaces nonwetting fluid as it moves. However, interfacial instabilities are well-known to arise during flow, particularly at large values of the fluid viscosity ratio [31]. Under these conditions, the fluid interface can destabilize into discrete fingers, with different regions moving at different speeds. Moreover, discrete ganglia of nonwetting fluid can form and remain trapped behind the moving fingers. These additional behaviors are known to depend on a complex array of factors including flow rate, pore geometry, medium wettability, and pore size [31, 73, 74, 75, 76, 77, 78, 79]; explicitly incorporating these additional physics into our model will be an important direction for future work. Nevertheless, the work presented here provides a useful first step that highlights the critical role played by stratification in influencing the dynamics of imbibition and consequently, the performance metrics and .
II.1 Imbibition Dynamics Without Crossflow
To gain intuition, we first simplify the model and neglect crossflow between the strata i.e., we set both and to be 0. Furthermore, to highlight the explicit dependence of the permeability on pore size and porosity, we apply the Kozeny-Carman relationship for permeability [80, 81], , hereafter. We numerically solve the simplified equations to determine the interface positions and at different imposed Ca. Using these simulations, we examine three key structural parameters: the ratio of the characteristic pore throat sizes of the two strata , the ratio of the cross-section areas of the two strata , and the nondimensional length of the overall medium , as well as the viscosity ratio . We use the experimental parameters from our previous work as the default values, but also sweep a broad range of these parameters, as summarized in Table 1. In each case, we plot the position of the nonwetting/wetting fluid interface in each stratum normalized by the overall length of the medium, , as a function of time normalized by the characteristic invasion time . This nondimensional time corresponds to the number of injected fluid pore volumes of the entire medium. The results obtained are shown in panel (a) of Figs. 2, 4, 6, and 8.
In all cases, we observe the two different invasion behaviors consistent with our previous work: fine-preferential invasion at low Ca and coarse-preferential invasion at sufficiently large Ca. In between these regimes, transitional invasion arises in which both strata are invaded at similar initial speeds—also as observed in our previous experiments [59]. Our previous linear stability analysis [59] predicted that the transition between these two behaviors occurs when Ca equals a transition capillary number:
| (9) |
This transition capillary number quantifies the value of Ca at which the difference in the characteristic viscous pressure drops across the overall strata, , balances the difference in the characteristic capillary suction pressures in the strata, . The numerical simulations presented here show excellent agreement with this prediction in all cases, as shown by the blue lines in panel (a) of Figs. 2, 4, 6, and 8.
Our numerical simulations enable us to go beyond our previous prediction and reveal the full dynamics of imbibition over time, as detailed below. Furthermore, we use our simulations to assess how the performance metrics , the wetting fluid breakthrough time, and , the breakthrough nonwetting fluid saturation, depend on Ca as well as the structure of the medium and the fluid viscosity ratio, as shown in panel (a) of Figs. 3, 5, 7, and 9. We define as the moment at which the wetting fluid reaches the outlet in either stratum. To facilitate comparison across different simulations, we normalize by the characteristic invasion time evaluated at , the median of the range of Ca explored in our simulations. At this moment of breakthrough, we also compute the breakthrough saturation as the volume fraction of nonwetting fluid remaining in the pore space of the adjacent, non-broken through stratum: . As noted previously, our model assumes, as a simplifying approximation, that wetting fluid invasion into each stratum stably and completely displaces nonwetting fluid: all regions and are completely saturated with the wetting fluid, where and represent the positions of the flat fronts in the coarse and fine strata, respectively.
II.2 Imbibition Dynamics With Crossflow
Our simplified analysis neglecting crossflow between the strata provides useful intuition on how the dynamics of imbibition depend on the structure of the medium as well as the viscosities of the defending and invading fluids. Next, motivated by previous theoretical work [46, 47], we incorporate crossflow between strata and via the position-dependent transverse flow rate per unit length along the medium , where the pressure difference across the interface between the strata drives crossflow and is a proportionality constant. In particular, the pressure difference drives a transverse volumetric flow rate of fluid across the strata, , which is defined within a differential width centered at position along the medium: , and therefore, . To estimate , we make the Darcy-Brinkman-type assumption that the transverse flow is localized near the interface between strata, only extending over a characteristic length or away from the interface into stratum or , respectively. Then, treating the transverse flow as proceeding between two porous media in series, by Darcy’s law; here is the dynamic shear viscosity of the fluid phase being considered and is the depth of the medium (i.e. into/out of the page in Fig. 1). Therefore,
| (10) |
The six coupled integral equations Eqs. (1), (2), (3), (6), (7), (8) with a nonzero given by Eq. (10) fully describe the evolution of the nonwetting/wetting fluid interface position in each of the two strata; however, analytically solving these equations is challenging. Hence, we instead develop a pore network model that numerically solves for the flow in a discretized representation of a stratified porous medium, as described in the next section.
III Pore Network Model
Our network model is schematized in Fig. 1(b). Each stratum of the medium is represented by a one dimensional array of nodes connected by edges in series (black resistors). These two arrays lie adjacent to each other, and are connected using a transverse array of edges (red resistors) to incorporate crossflow—except for locations that have different fluids in the adjacent strata, at which crossflow is suspended (schematized by the missing red resistor in the middle of Fig. 1(b)). A single node introduces wetting fluid into both strata at the inlet with imposed volumetric flow rate , and both strata join together at another single node at the outlet, providing control of the overall boundary conditions. Each node represents a discrete position along the medium, with between successive nodes and the inlet and outlet corresponding to and , respectively.
For prescribed – which correspond to a given imposed value of Ca – as well as prescribed values of , we solve for the fluid pressures in the nodes and flow rates in the edges at successive discrete time steps , where is the characteristic invasion time of the entire medium. We do this using four equations:
-
i.
Conservation of mass and fluid incompressibility throughout dictates that all net flow into a given node must sum to zero.
-
ii.
For a given fluid in a given stratum, Darcy’s law dictates that the flow rate through edge in stratum is , where and are the pressures at the two nodes and connected by the edge, and describe the permeability and cross-section area of the stratum, and is the viscosity of the fluid type contained within the edge.
-
iii.
For the edge containing the immiscible fluid interface at a position in a given stratum , we instead apply a modified form of Darcy’s law that accounts for the fraction of the wetting fluid within the edge and the capillary pressure difference across the immiscible fluid interface: .
-
iv.
Within a given fluid, we apply Darcy’s law across the adjacent strata to describe crossflow: , where the edge now connects strata and and is given by Eq. 10. For the calculations given here, we choose mm and represent the overall cross-section of the medium as a square with to facilitate comparison to our previous experiments [59].
Together, the equations in i-iv constitute a system of linear equations that we solve numerically for the interface positions and until one of the interfaces breaks through to the outlet. To validate this network model, we first consider imbibition without crossflow (). The solid lines in panel (a) of Figs. 2, 4, 6, and 8 show the results of the network model, while the open circles show the explicit numerical solutions of the coupled set of governing Eqs. (1), (2), (3), (6), (7), (8). Both approaches yield identical results in all cases, confirming the fidelity of the network model.
We next use the network model to examine the influence of crossflow on the dynamics of forced imbibition. Following the studies without crossflow described in Section II.1, we examine the influence of the three key structural parameters , , , as well as the viscosity ratio . The results obtained are summarized in panel (b) of Figs. 2, 4, 6, and 8.
In all cases, we observe similar dynamics to the case without crossflow. In particular, we again observe the two different invasion behaviors consistent with our previous work: fine-preferential invasion at low Ca and coarse-preferential invasion at sufficiently large Ca, with transitional invasion between the two. Our previous linear stability analysis [59] predicted that the transition between these two behaviors occurs when Ca equals a transition capillary number:
| (11) |
where analysis of Eqs. 6 and 8 yields . We again find good agreement between the results of the network model and this theoretical prediction, as shown by the blue lines in panel (b) of Figs. 2, 4, 6, and 8. The network model also enables us to go beyond this previous prediction and examine the full dynamics of imbibition over time. Furthermore, we again use the pore network model to investigate how the performance metrics , the wetting fluid breakthrough time, and , the breakthrough nonwetting fluid saturation, depend on Ca as well as the structure of the medium and the fluid viscosity ratio, as shown in panel (b) of Figs. 3, 5, 7, and 9.
IV Results
IV.1 Influence of Pore Throat Ratio
The pore throat size contrast between strata is one important structural characteristic of a stratified medium. For example, in shales, the ratio of the pore throat sizes in a high permeability stratum compared to an adjacent low permeability stratum can be as high as 10 (Table 1). Hence, to explore the influence of this key structural descriptor, we vary the pore throat ratio from 1.4 to 14 by holding constant and changing . Changing the pore throat ratio over this range has two impacts, because the permeability and the capillary pressure : it corresponds to a permeability ratio ranging from 2 to 200 and a capillary pressure ratio that concomitantly ranges from 0.7 to 0.07.
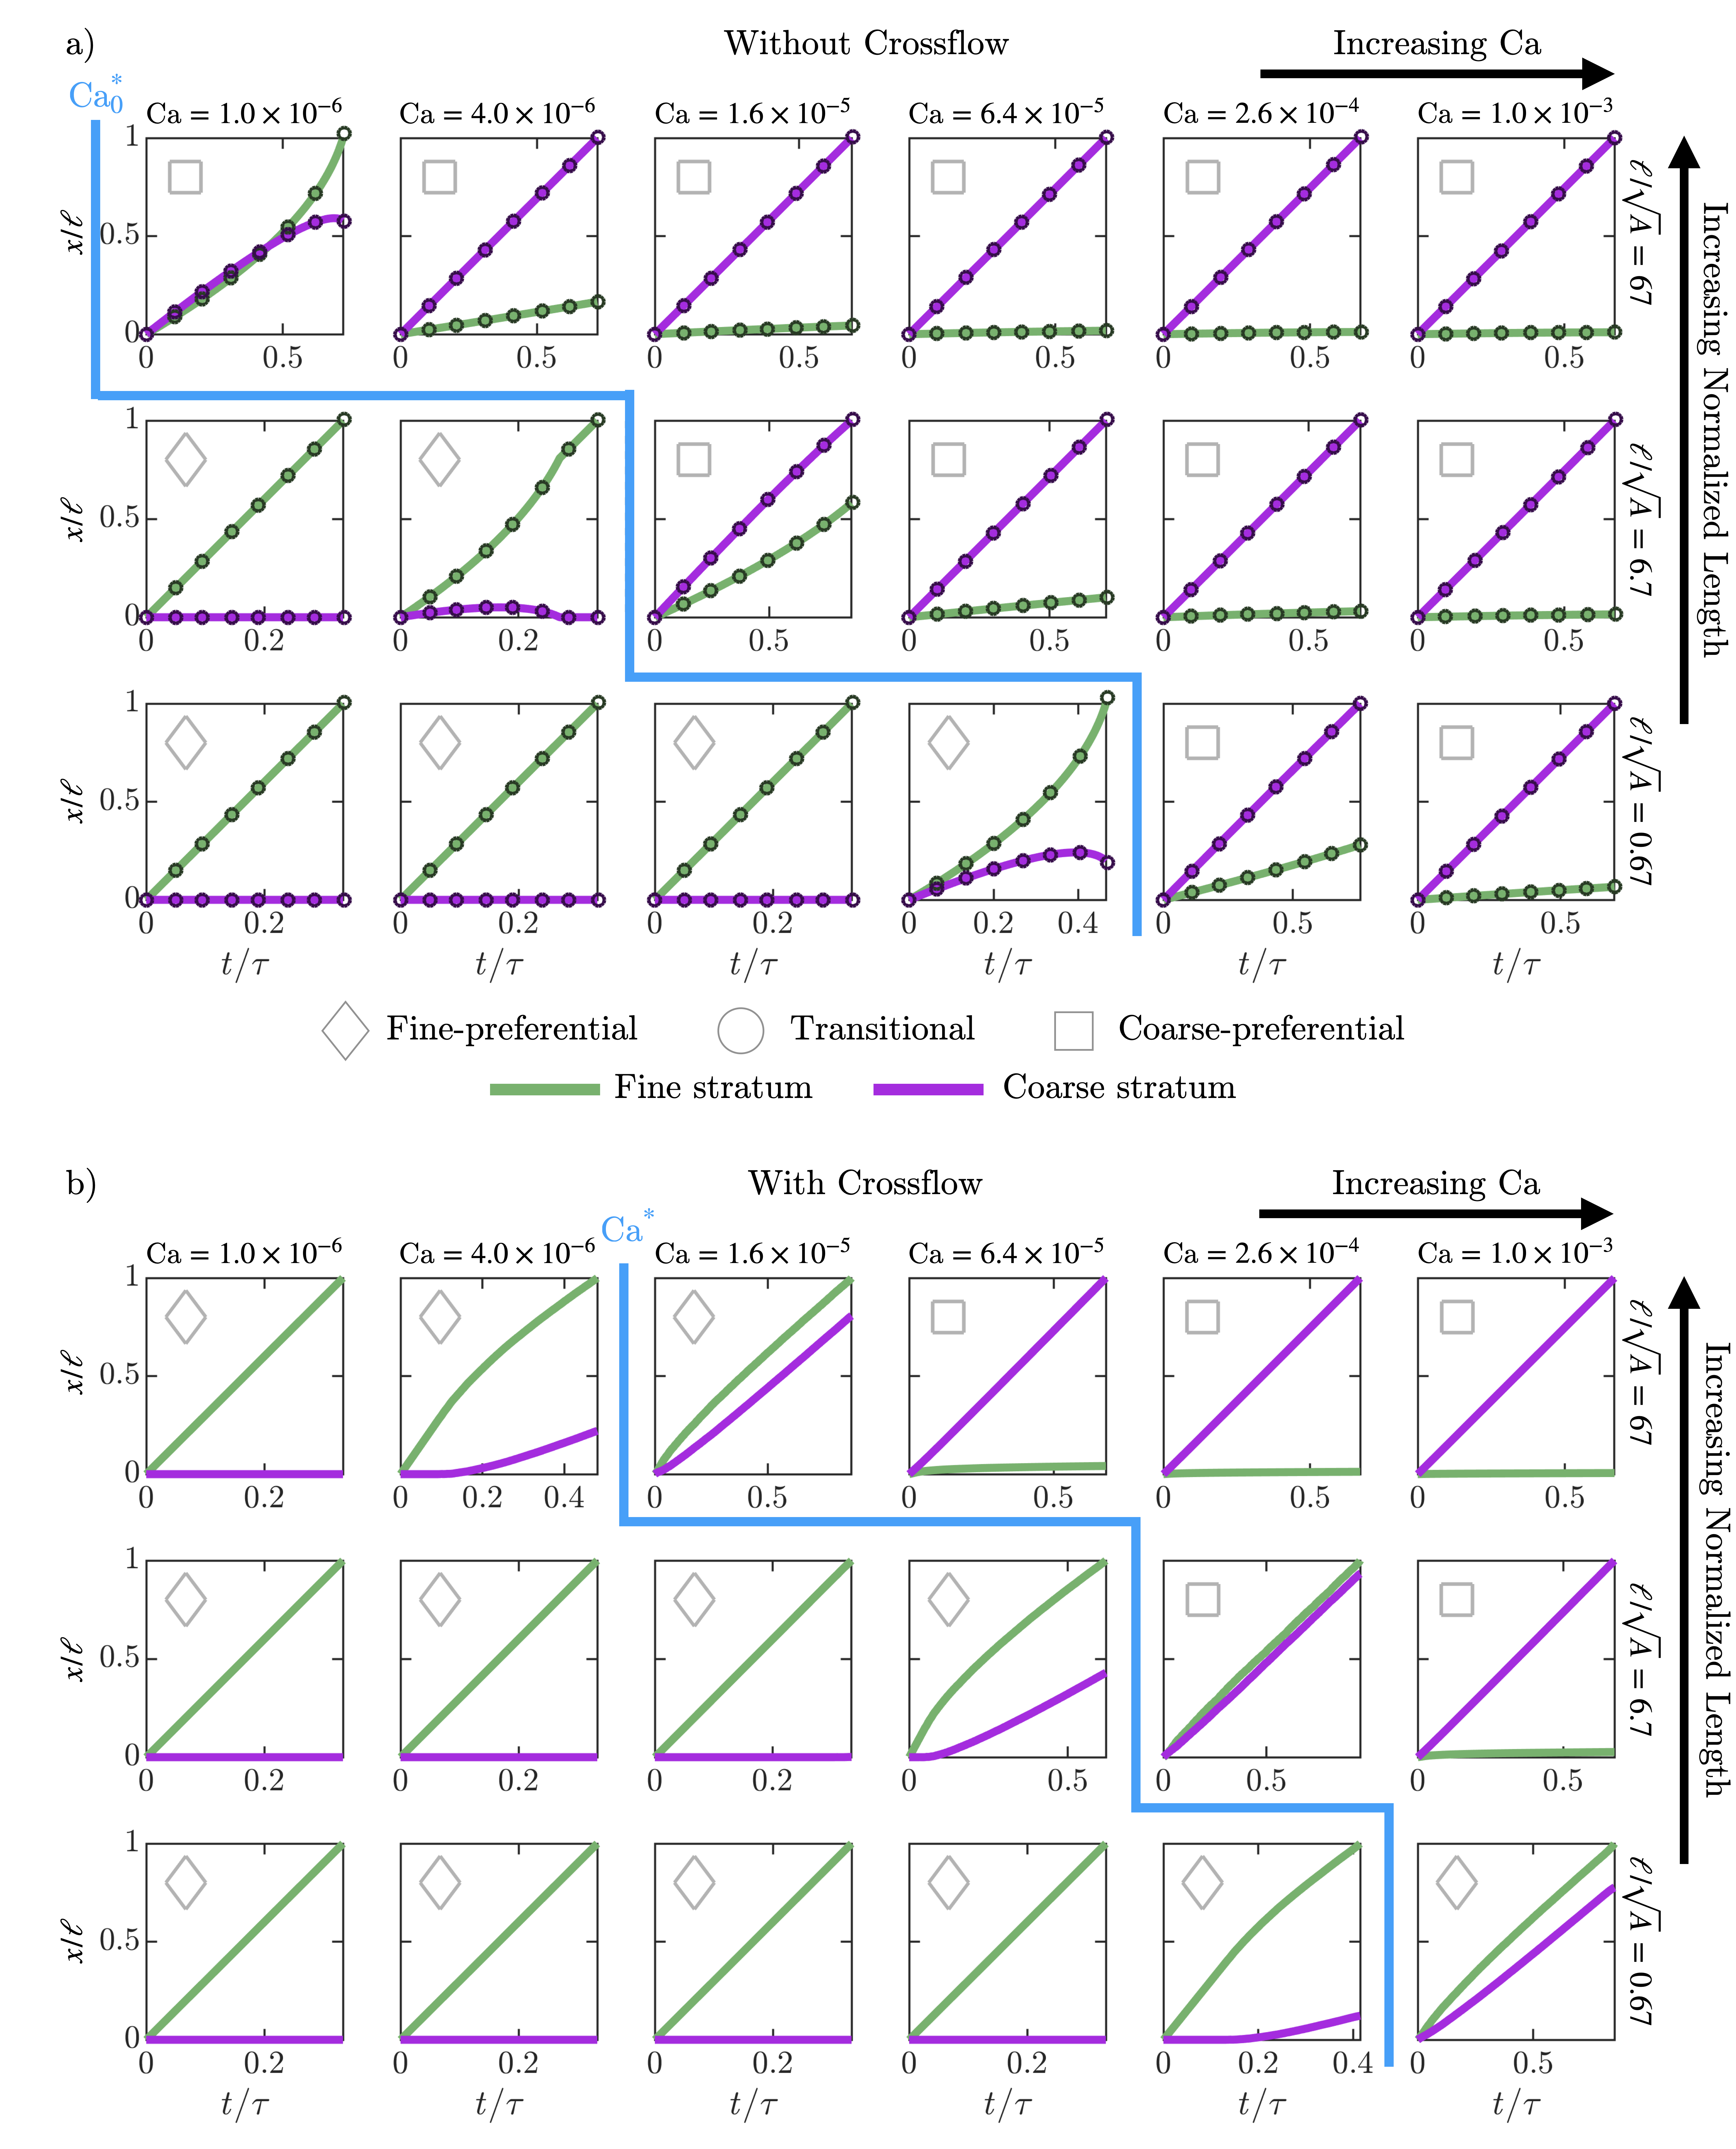
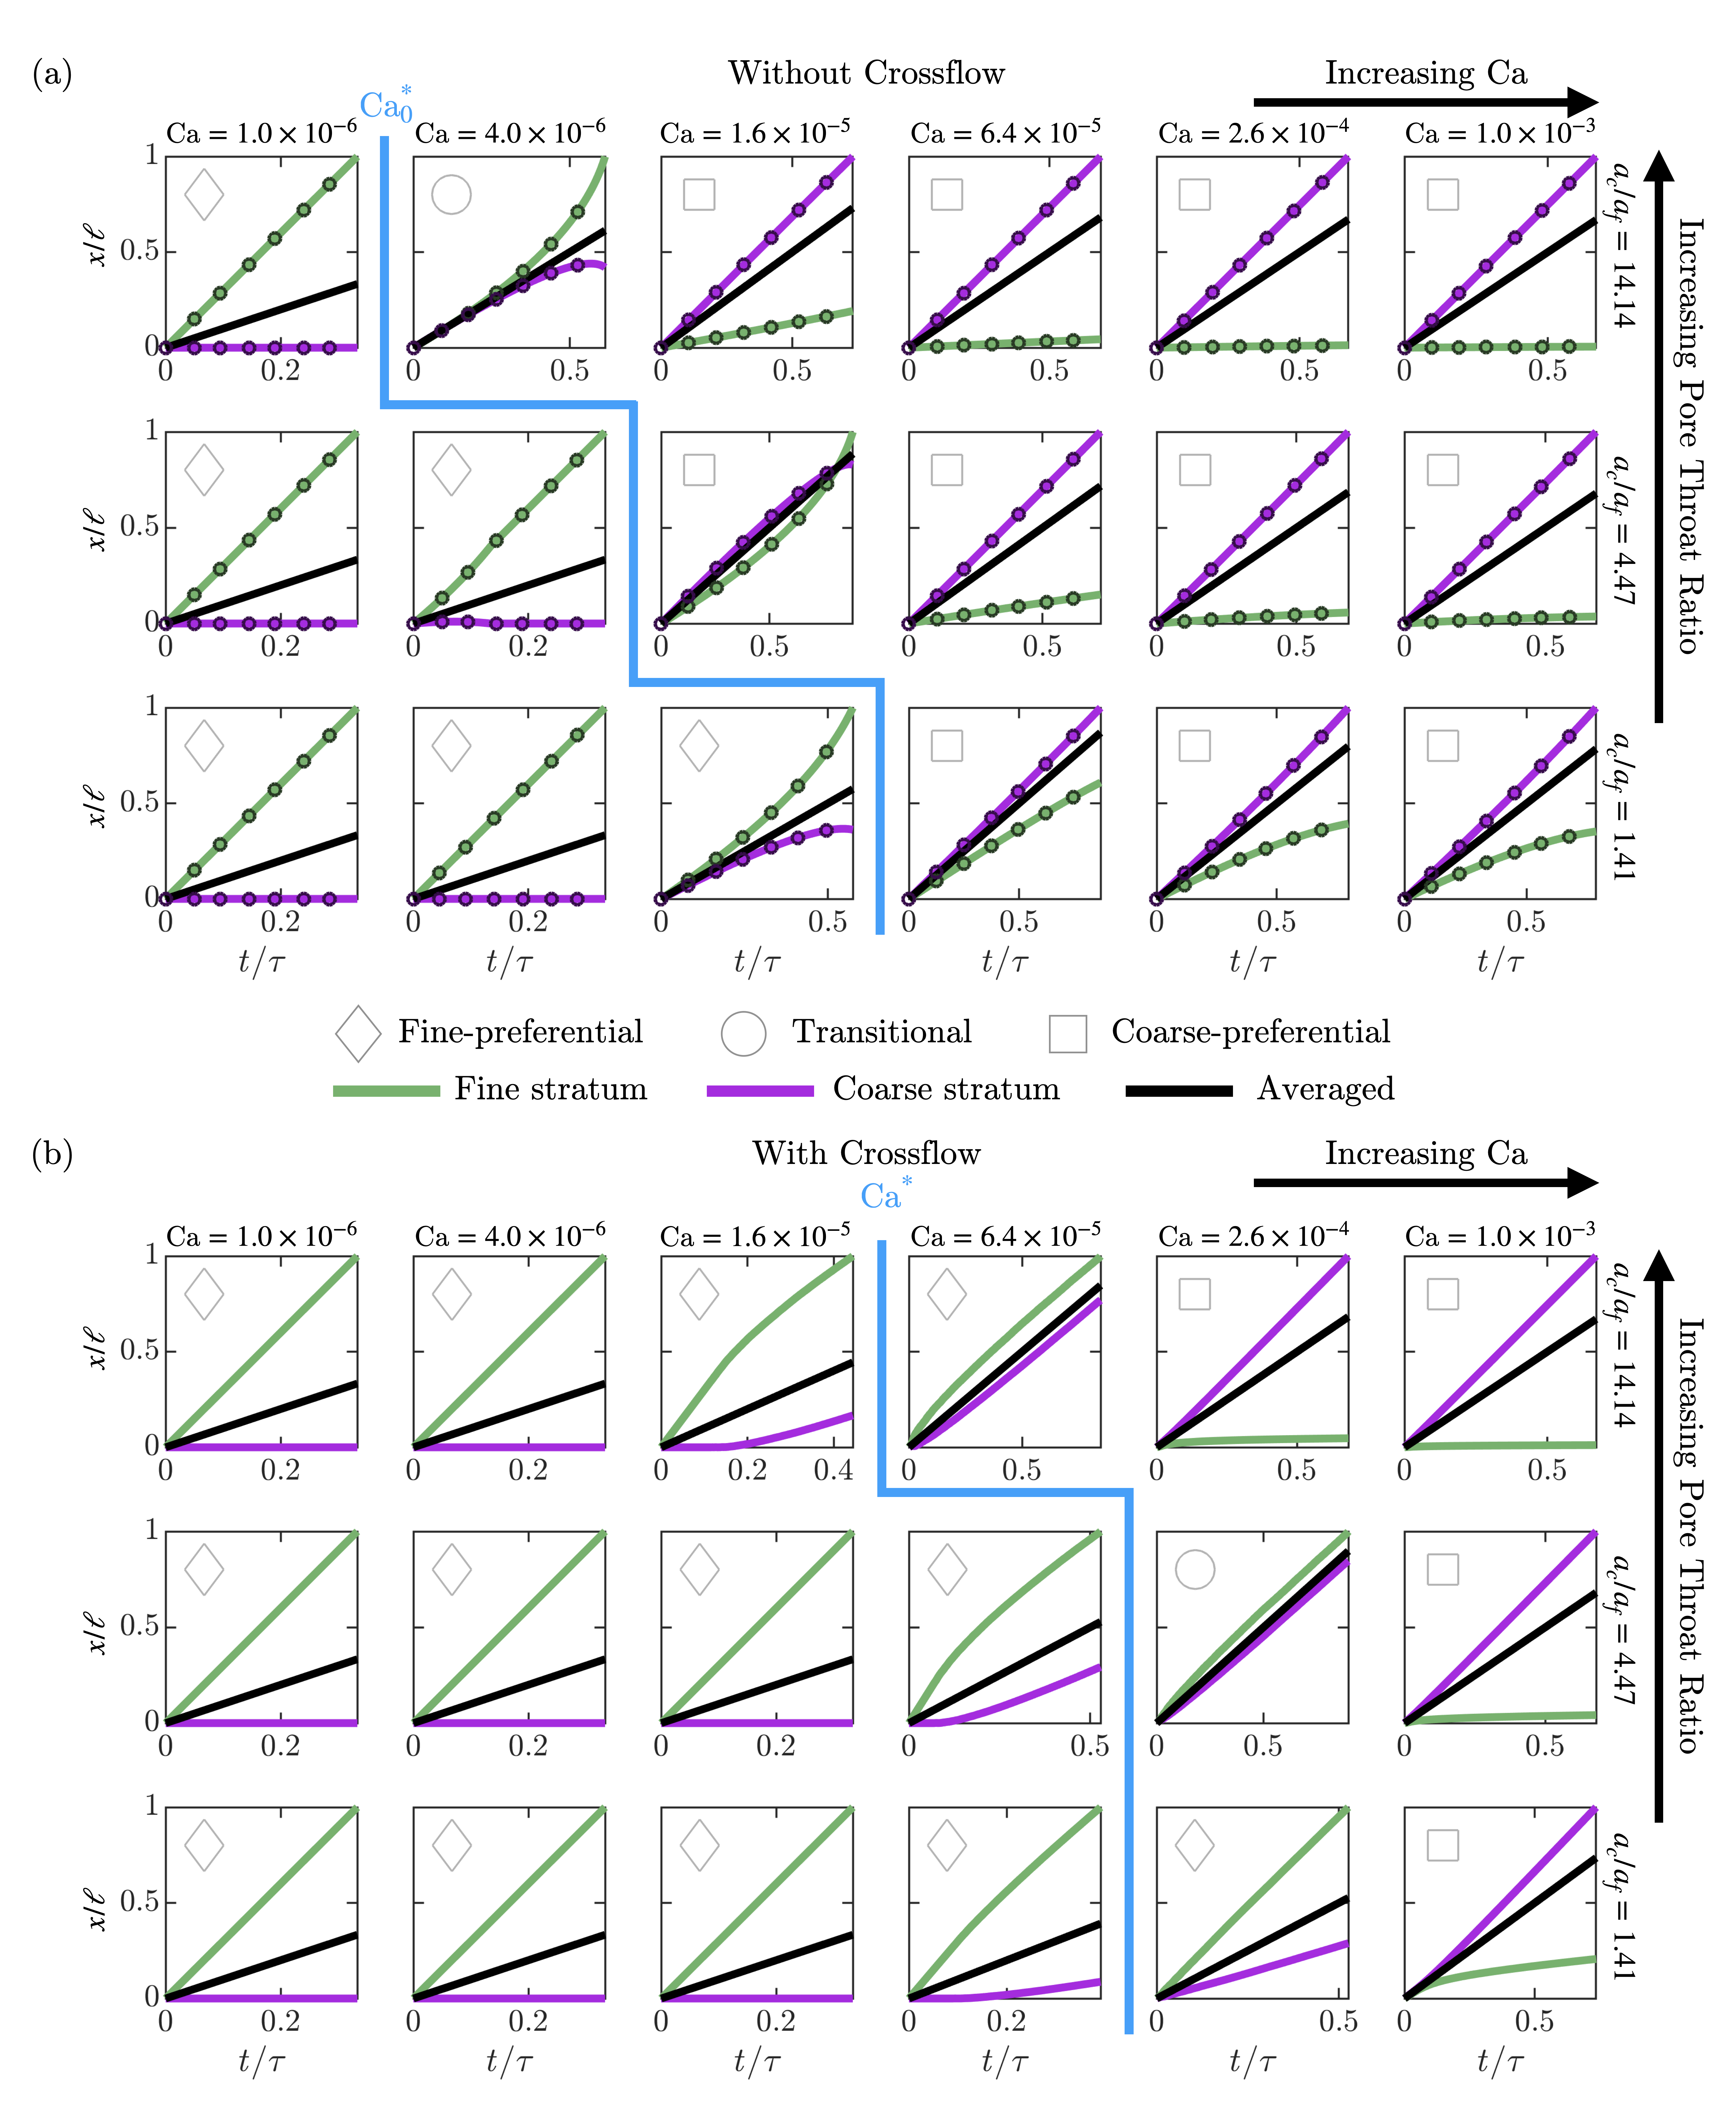
Dynamics without crossflow: First, we examine imbibition without crossflow, as shown in Fig. 2(a). We initially focus on the smallest pore size ratio, , as shown in the bottom row. At the lowest imposed Ca (first and second columns), the wetting fluid exclusively invades the fine stratum, as shown by the green points. We therefore classify this behavior as fine-preferential invasion, indicated by the diamond symbol in the top left corner. Under these conditions, capillarity dominates viscous effects; as a result, the wetting fluid imbibes faster into the fine stratum, for which the capillary suction is stronger. At a higher Ca (third column), the coarse stratum is also invaded, albeit much slower. As invasion progresses, it speeds up in the fine stratum — reflecting the absence of crossflow between the strata in this implementation of the model. In particular, the porous medium acts as a “pore doublet” in which the growing viscous pressure drop limits continued invasion in the coarse stratum, while the enhanced capillary suction in the fine stratum continues to drive invasion into it — redirecting flow from the former to the latter. Finally, at even higher Ca (fourth through sixth columns), the wetting fluid invades the coarse stratum increasingly faster than the fine stratum, as shown by the magenta points. We therefore classify this behavior as coarse-preferential invasion, indicated by the square symbols in the top left corners. Under these conditions, viscous effects increasingly dominate the influence of capillarity; as a result, the wetting fluid imbibes faster into the coarse stratum, for which the permeability is larger and thus the viscous pressure drop is lower. The onset of coarse invasion coincides with the predicted transition capillary number Ca (Eq. 9), as shown by the blue line, confirming our previous prediction.
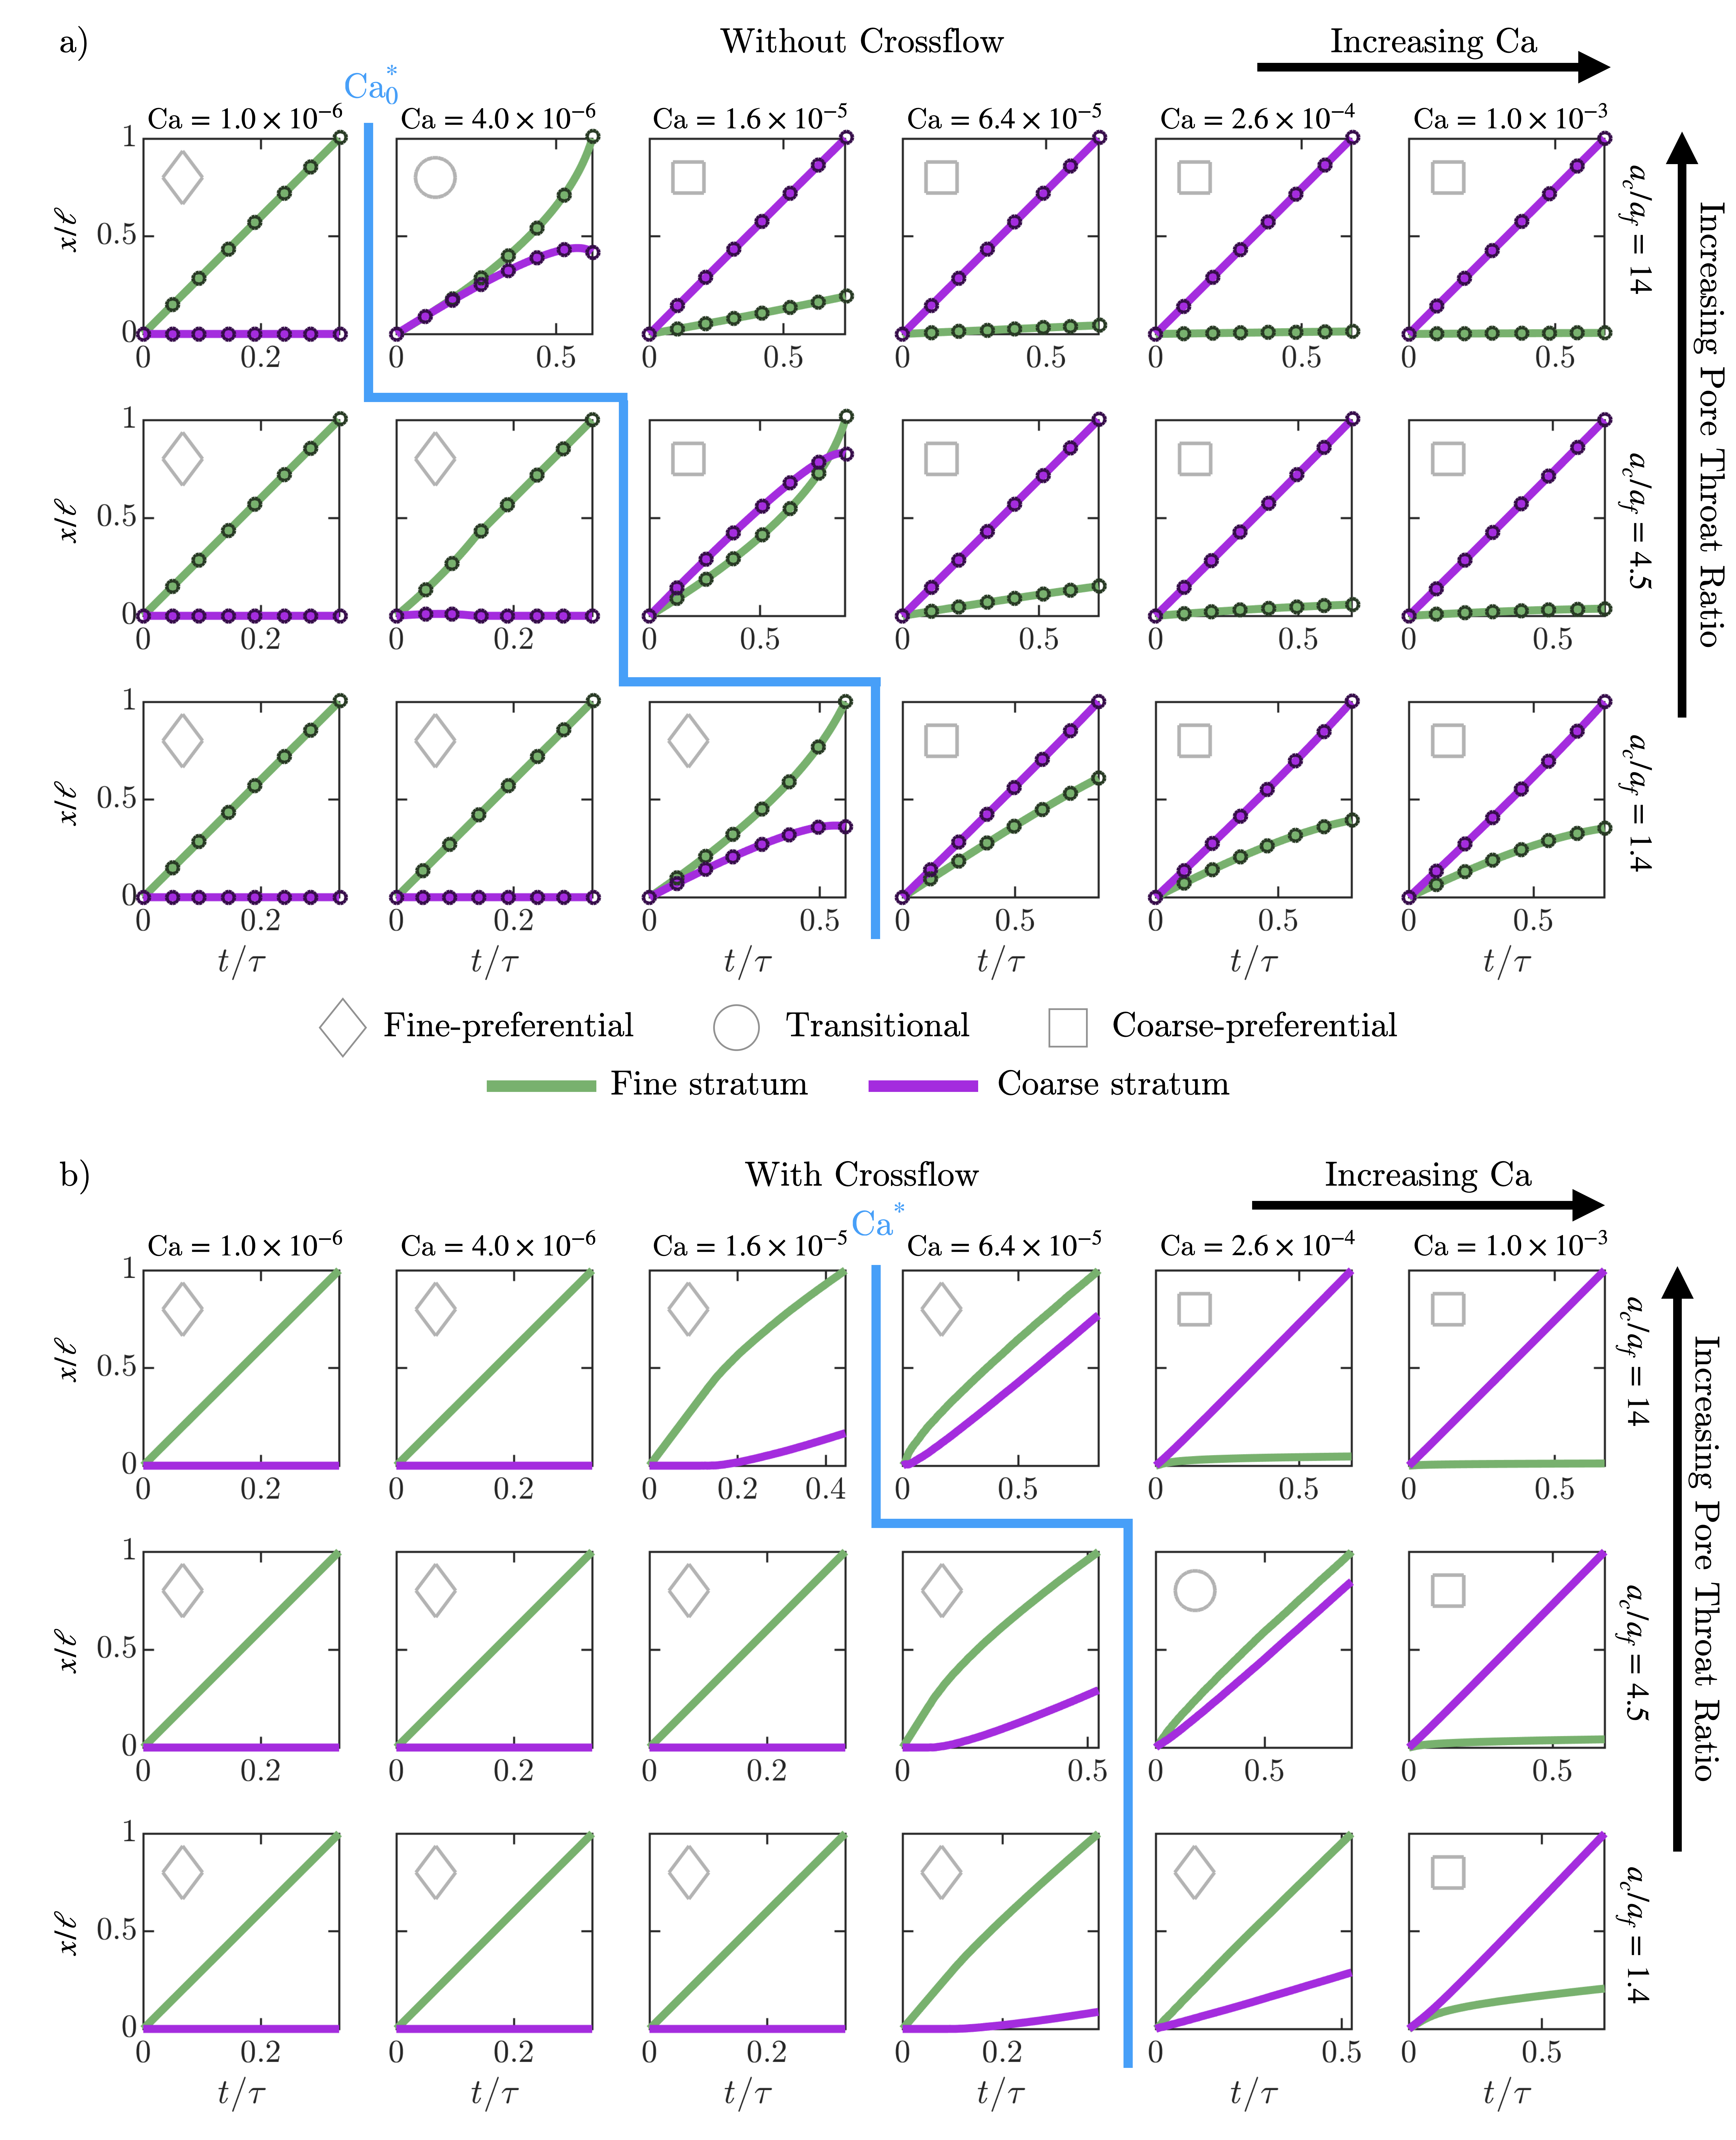
We next investigate the influence of increasing pore throat ratio . As exemplified by the middle and top rows of Fig. 2(a), we find similar behavior as in the case, but with the onset of coarse invasion shifted to lower and lower Ca. Intriguingly, for the largest pore throat size ratio , the transition between fine and coarse invasion is characterized by a regime in which both strata are initially invaded at similar speeds (Ca , second column): the difference between the initial invasion speeds in the different strata is the speed of the faster-moving interface. We therefore classify this behavior as transitional invasion, indicated by the circle symbol in the top left hand corner. Apparently similar behavior is observed near the transition (Ca ) for the intermediate pore throat size ratio , shown in the middle row and third column of Fig. 2(a); however, in this case, the difference between the initial invasion speeds in the different strata is not the speed of the faster-moving interface. We therefore still classify this behavior as coarse invasion, indicated by the square symbol in the top left hand corner. This example highlights that a classification based only on the incipient invasion behavior misses interesting subsequent dynamics during imbibition; indeed, as invasion progresses in this case, the interface speeds up in the fine stratum and recedes from the coarse stratum, again reflecting the “pore doublet” dynamics described above.
The shift in the transition between invasion behaviors is again consistent with our theoretical prediction for Ca, as indicated by the blue line. In particular, as given by Eq. 9, , which scales as as pore throat size ratio increases: while capillary suction guides the initial invasion of the wetting fluid into the pores, viscous effects increasingly limit invasion into the lower-permeability fine stratum. Indeed, at the highest Ca (fourth through sixth columns), the wetting fluid invades the coarse stratum almost exclusively in the case of — again reflecting coarse-preferential invasion.
Dynamics with crossflow: Incorporating crossflow into the model yields qualitatively similar invasion dynamics; compare Fig. 2(b) to (a). In particular, in all cases, we observe a similar transition between fine- and coarse-preferential invasion around the Ca∗ predicted by Eq. 11, as shown by the blue line in Fig. 2(b). Notably, in all cases: crossflow suppresses, but does not eliminate, the transition to coarse-preferential invasion. This effect arises from the influence of crossflow in forcing the nonwetting fluid from the fine stratum to the coarse stratum ahead of the fluid interface, reducing the overall viscous dissipation; therefore, one has to increase Ca even further for viscous effects to become comparable to capillarity. Additionally, unlike the case without crossflow, we do not observe “pore doublet” dynamics in which the flow slows down in and even recedes from the coarse stratum: crossflow stabilizes these non-monotonic effects.
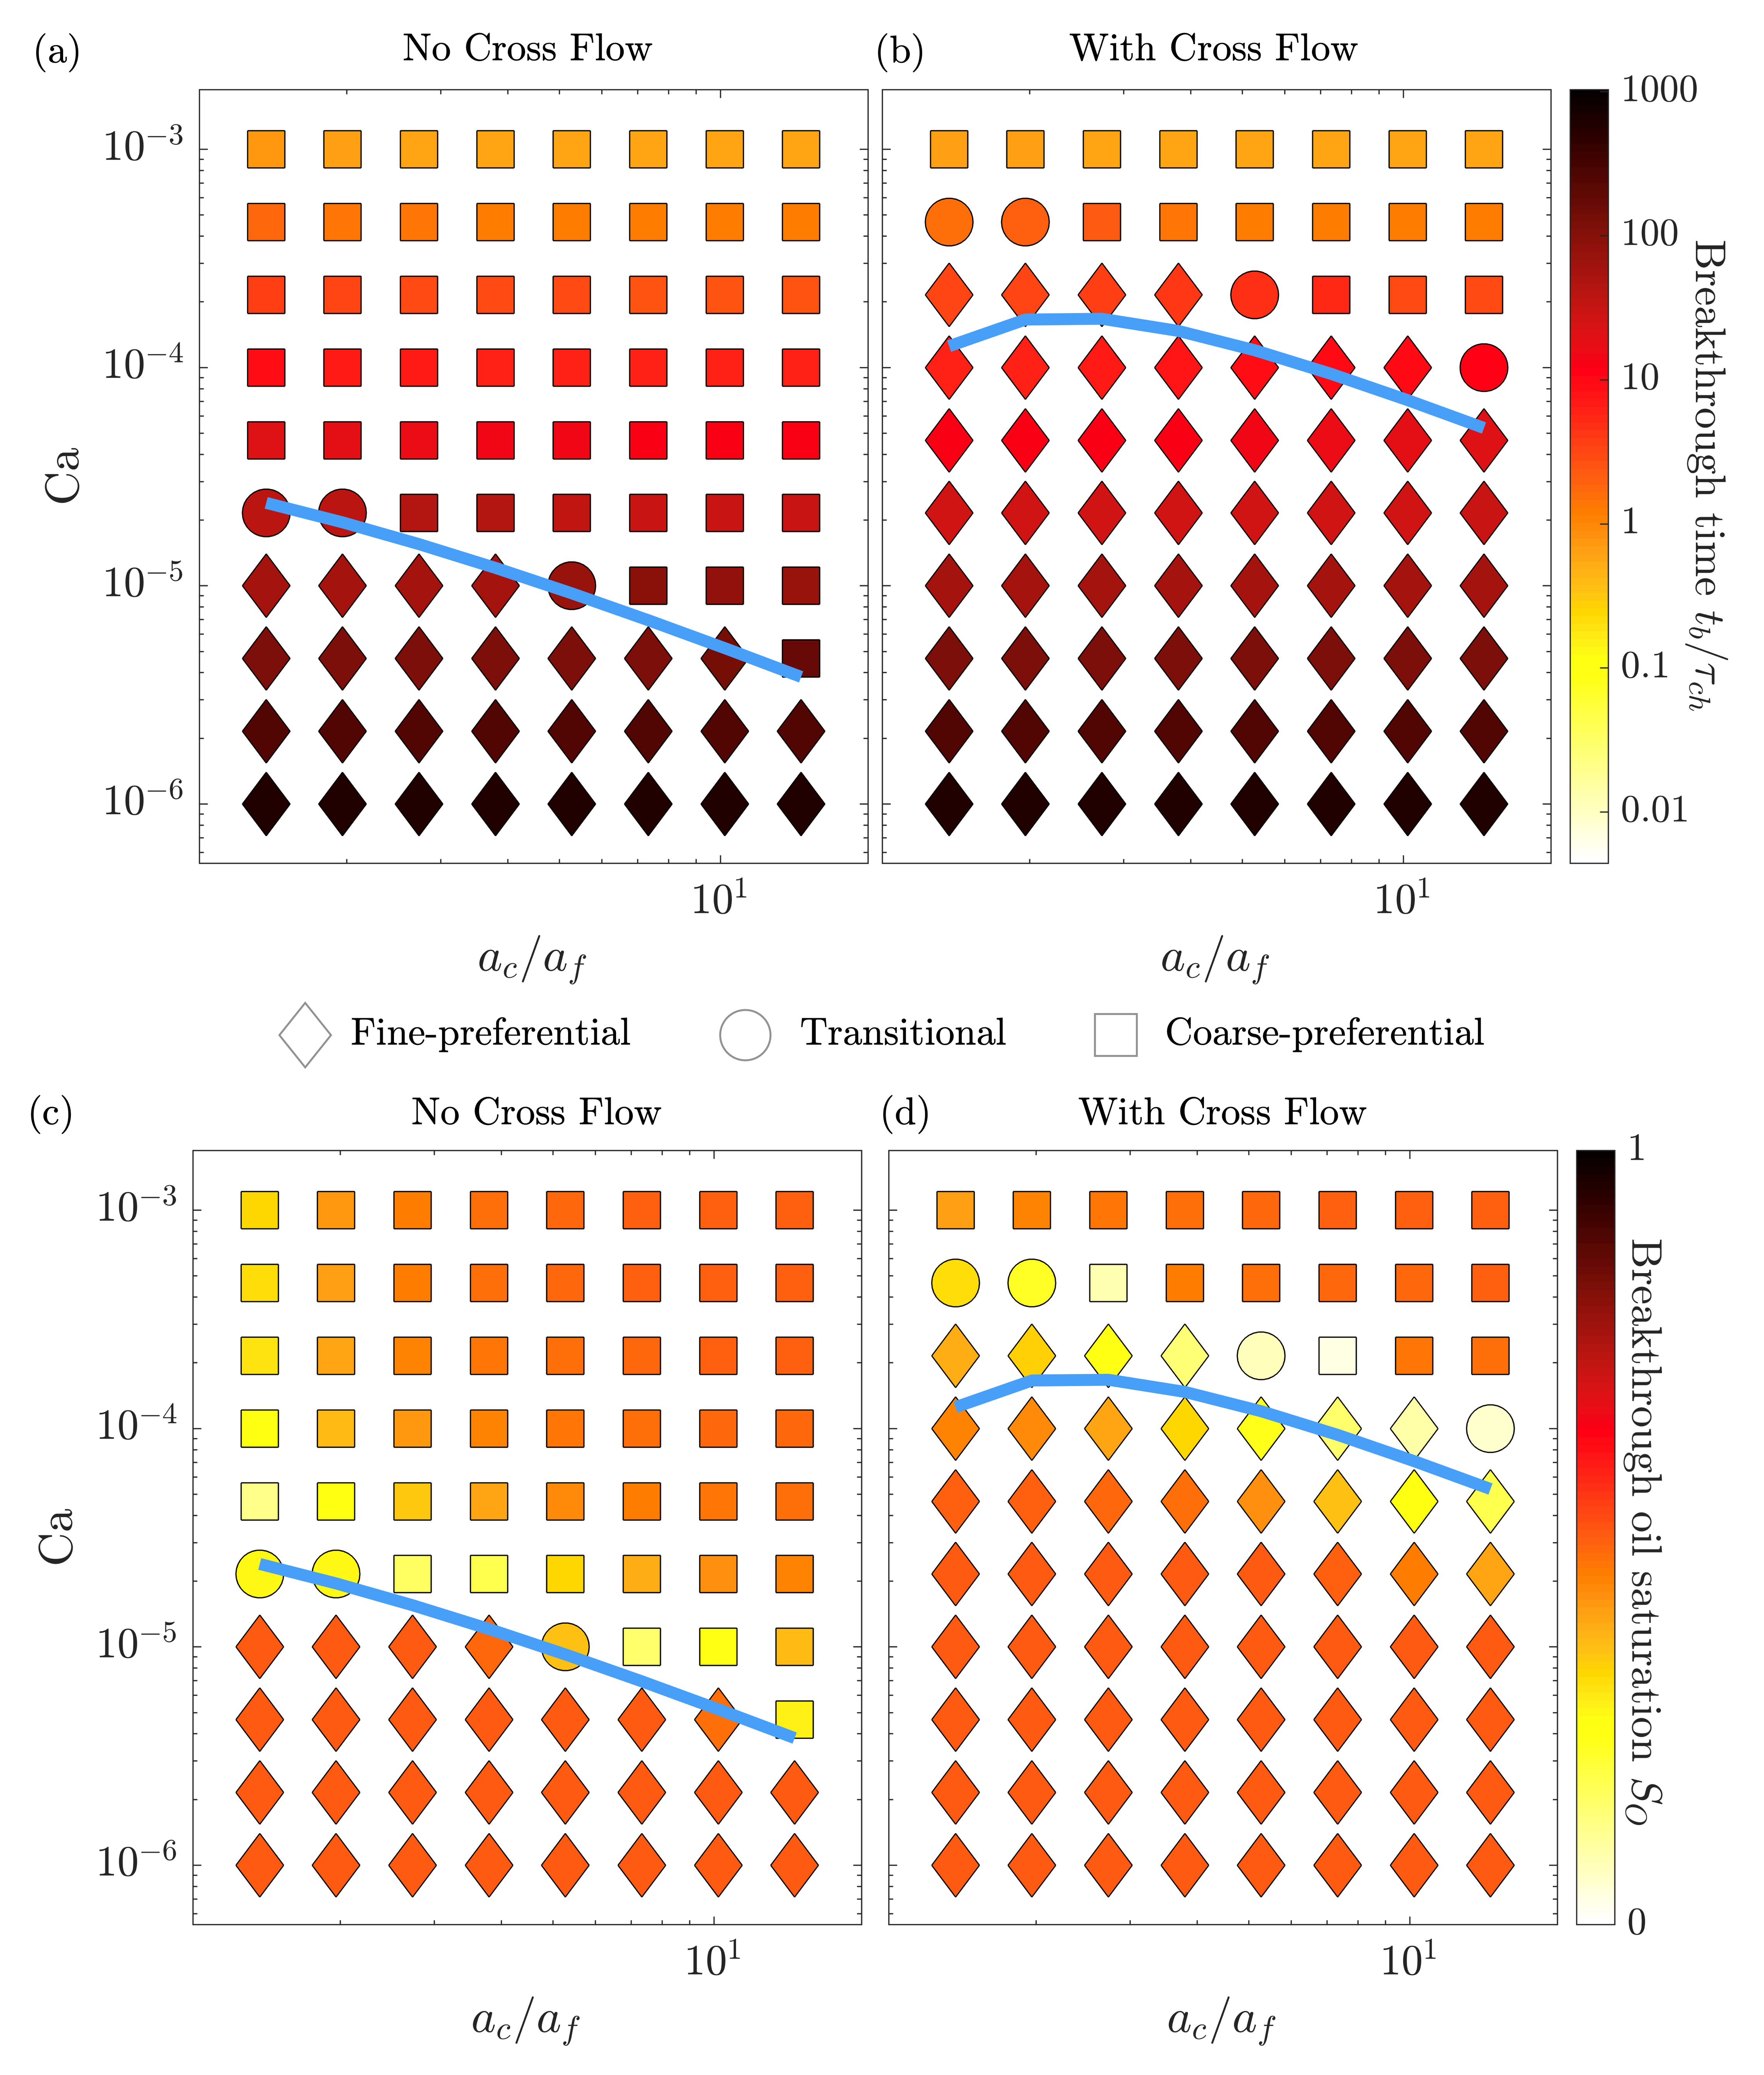
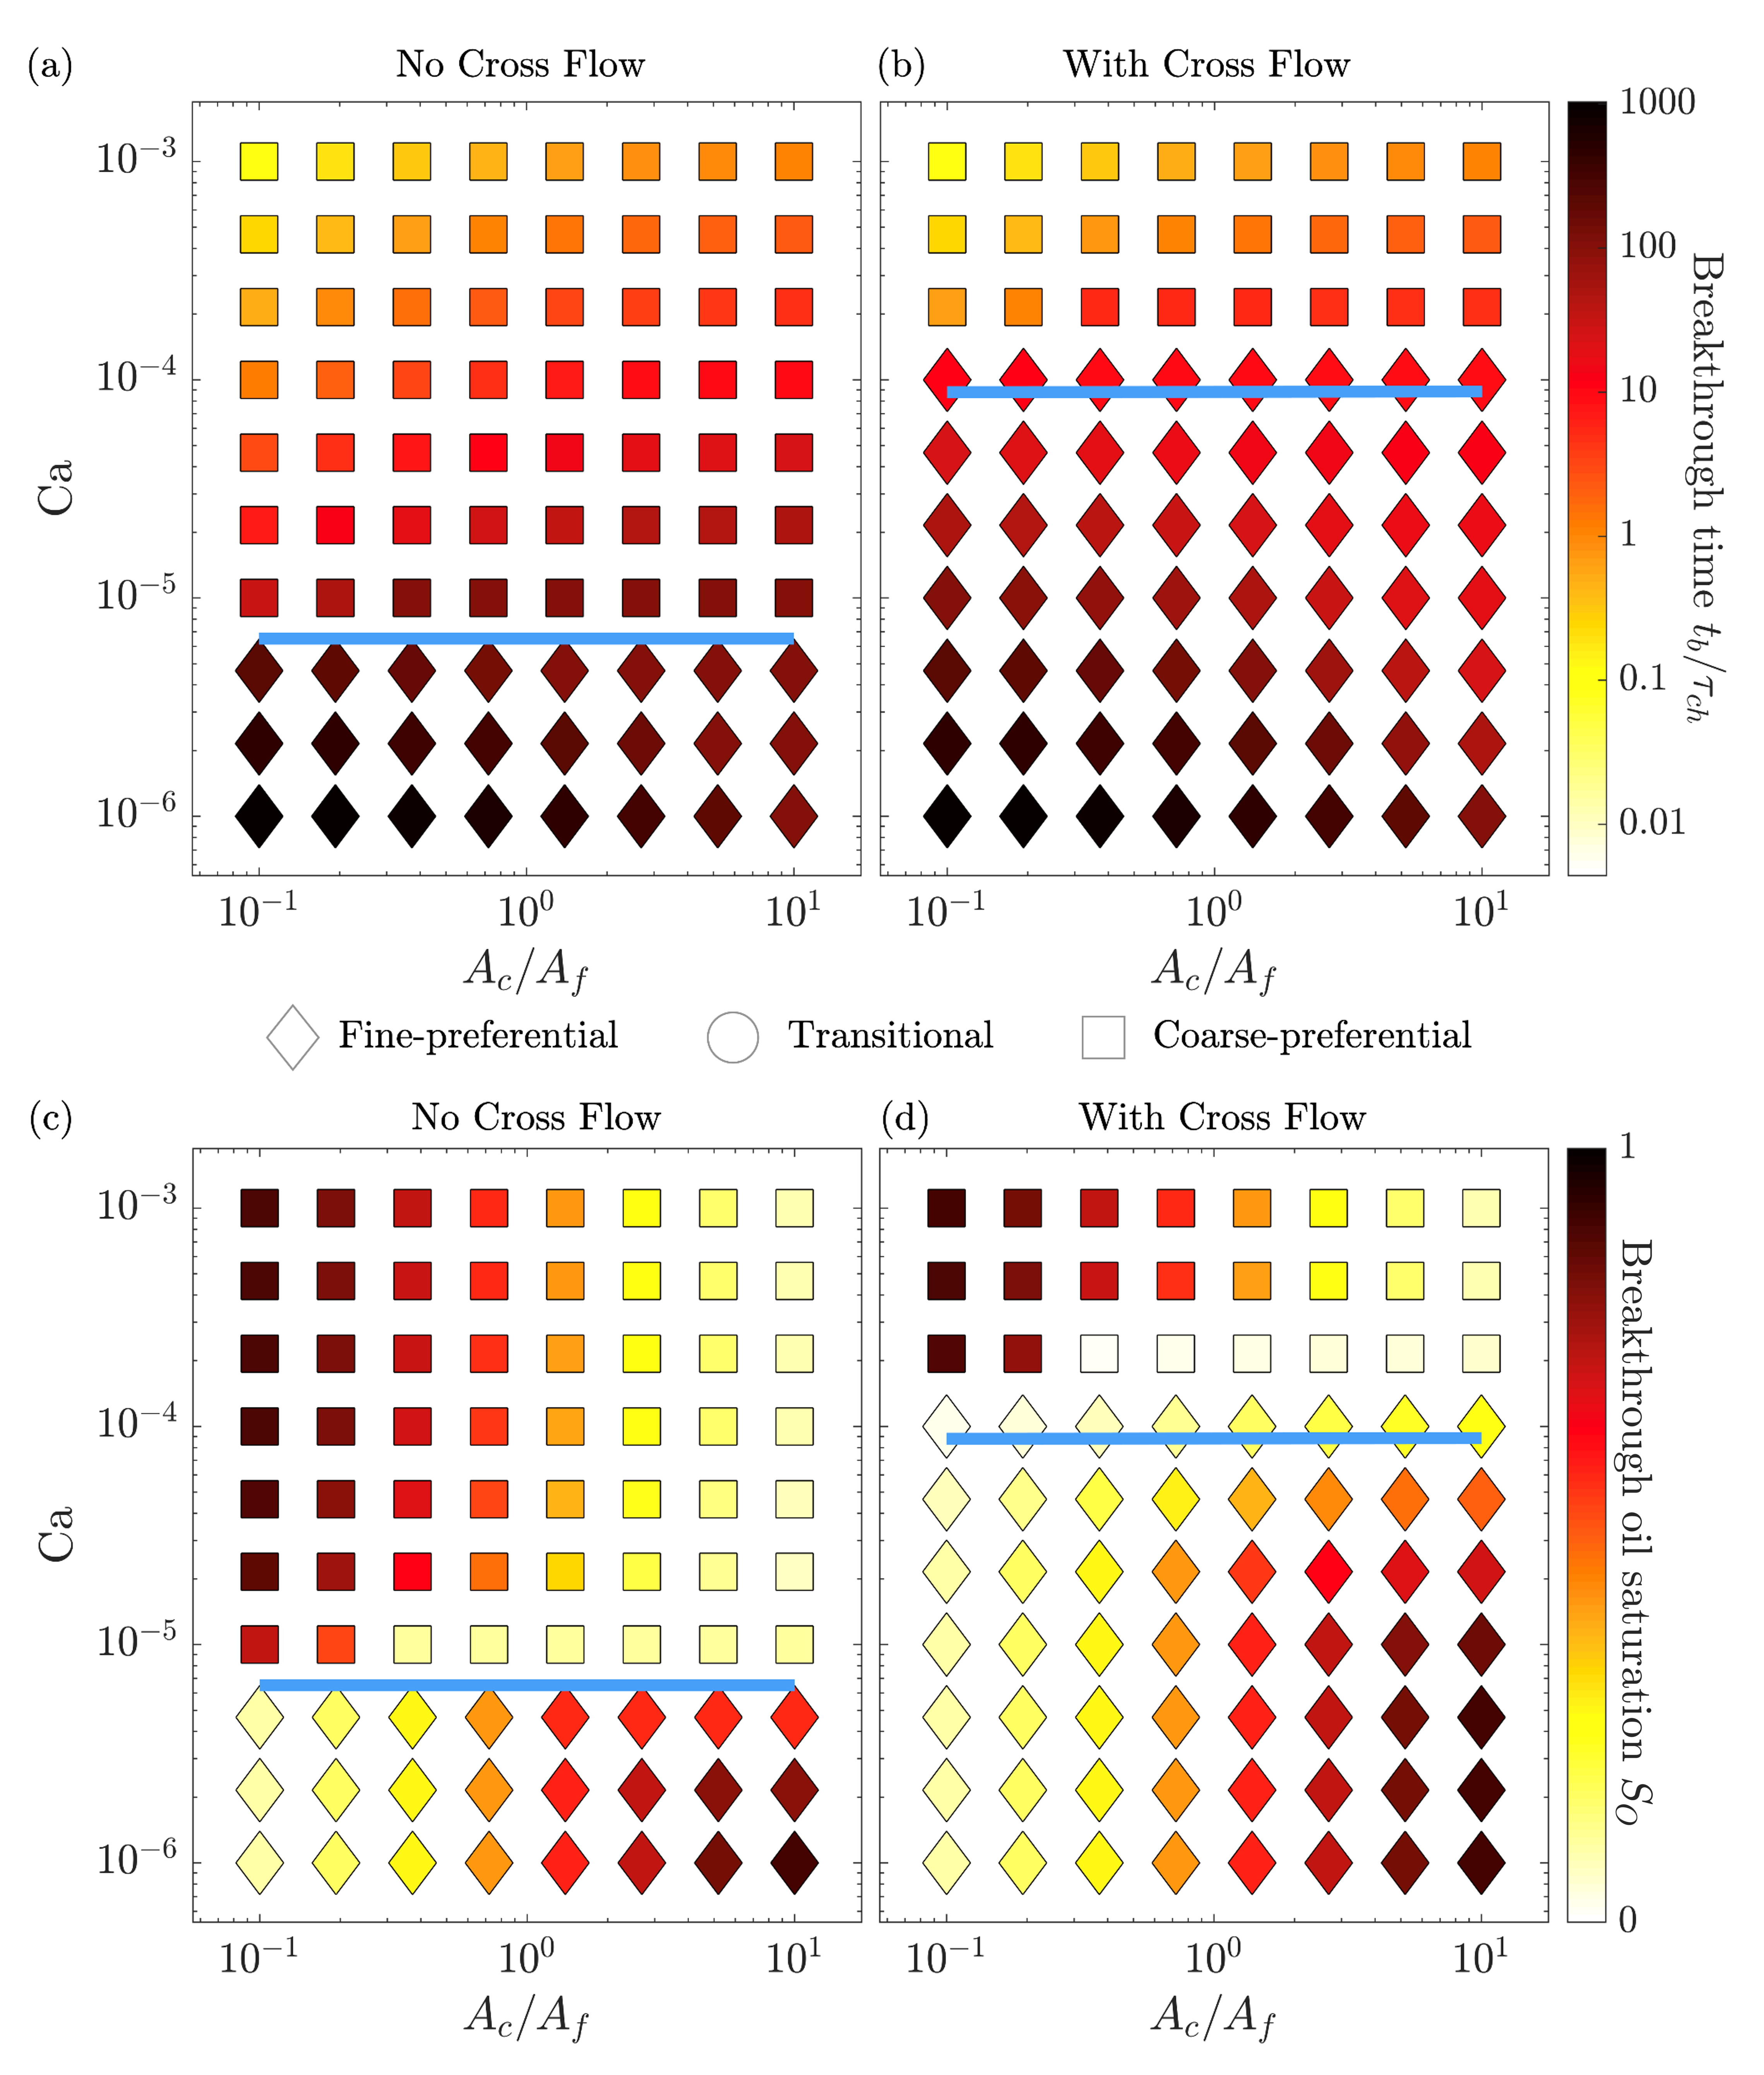
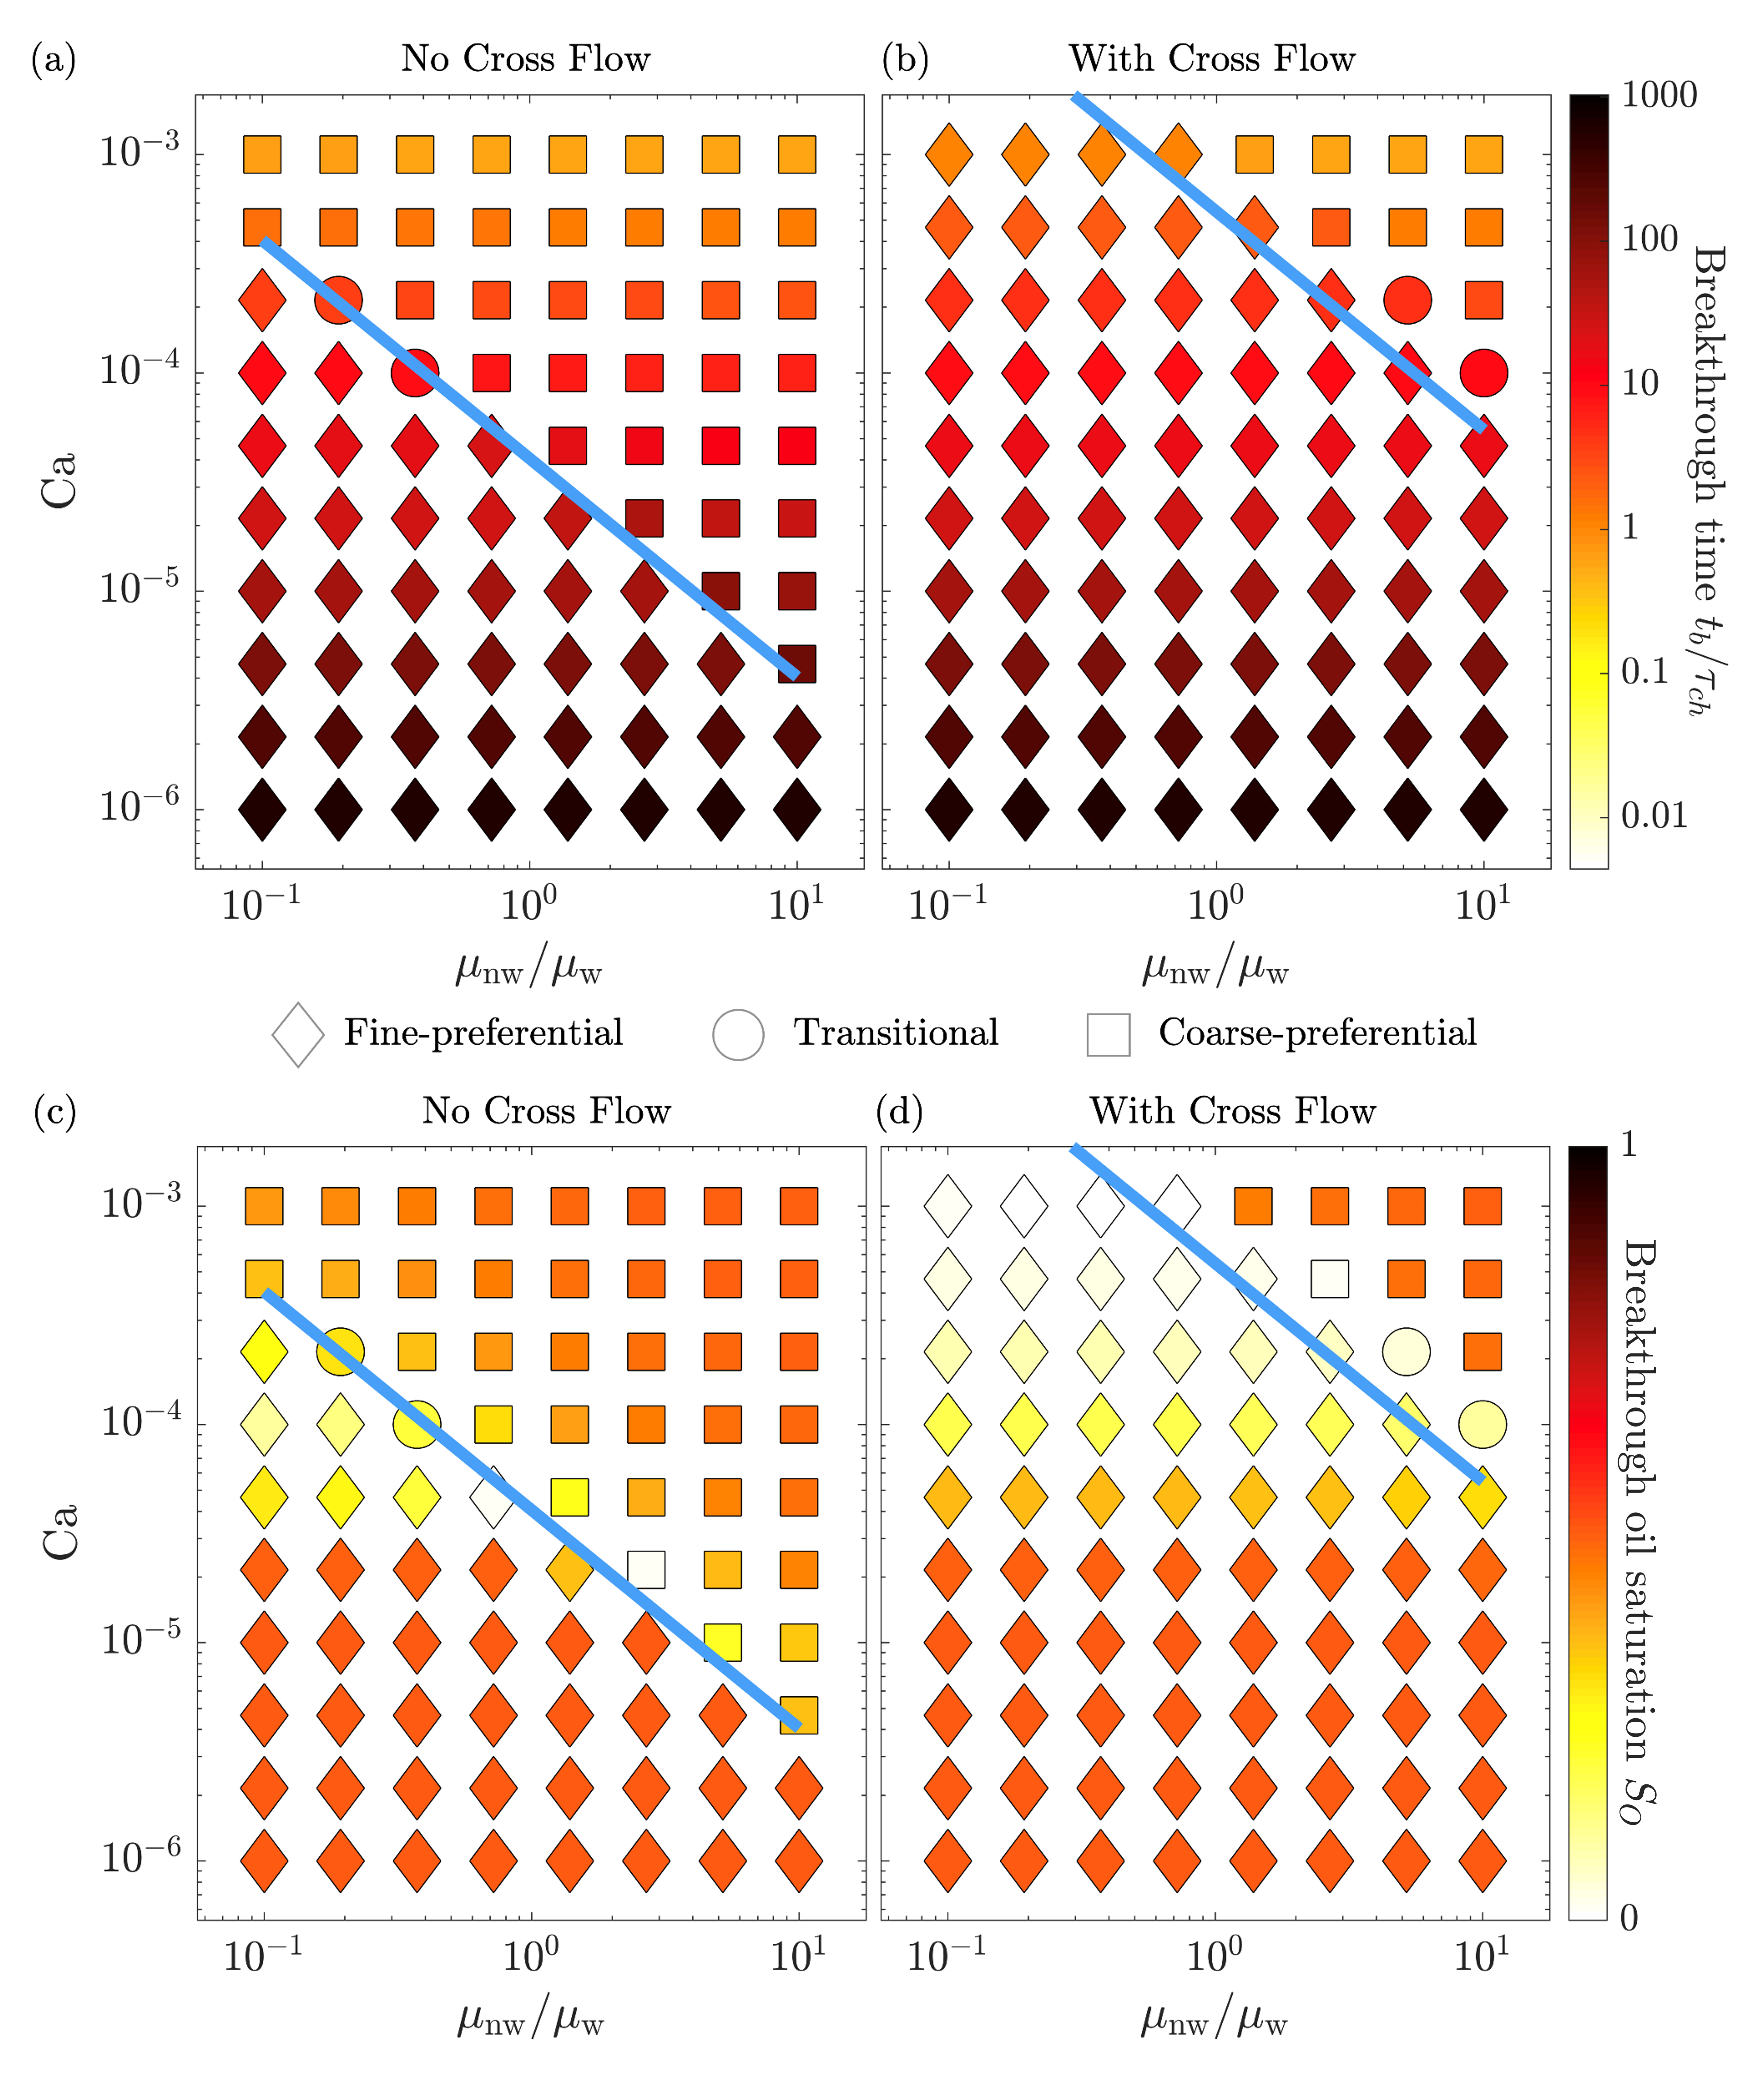
Breakthrough time: The numerical simulations enable us to examine the breakthrough time both without and with crossflow incorporated, as shown in Figs. 3(a) and (b), respectively. In each plot, we represent the normalized breakthrough time by the color scale, the initial invasion behavior observed by the symbols shown, and the transition capillary number by the blue line. We observe similar results in both cases: as intuitively expected, the breakthrough time monotonically decreases with Ca—intriguingly, with no apparent dependence on or crossflow. Thus, processes that only seek to minimize breakthrough time should maximize the imposed Ca.
Breakthrough saturation: We next examine the breakthrough nonwetting fluid saturation both without and with crossflow incorporated, as shown in Figs. 3(c) and (d), respectively. We represent by the color scale, the initial invasion behavior observed by the symbols shown, and the transition capillary number again by the blue line. Contrary to the conventional belief that Ca should be maximized to minimize , we find that in both cases, the breakthrough saturation exhibits a non-monotonic dependence on Ca: is minimized near the transition capillary number Ca or Ca∗. Intuitively, this non-monotonic behavior reflects the improved displacement of nonwetting fluid during transitional invasion, in which both strata are simultaneously invaded, instead of only one being preferentially invaded. Thus, processes that seek to minimize both breakthrough time and breakthrough saturation should not maximize the imposed Ca. Instead, they should be tuned to slightly above the transition capillary number that describes the transition between invasion behaviors. The value of this transition capillary number decreases with increasing pore throat size ratio, highlighting the critical role played by the geometry of the medium in influencing performance during fluid imbibition.
IV.2 Influence of Cross-Section Area Ratio
The cross-section area of each stratum is another key structural descriptor of a porous medium. The ratio of the cross-section areas between strata in a typical oil reservoir can range from 0.05 to 20 (Table 1). Hence, we vary the cross-section area ratio from 0.1 to 10 while keeping the total cross-section area constant.
Dynamics without crossflow: First, we examine imbibition without crossflow, as shown in Fig. 4(a). We initially focus on the smallest cross-section area ratio, , as shown in the bottom row. We again observe a transition between fine-preferential and coarse-preferential invasion driven by Ca, reflecting the dominance of pore-scale capillarity at low Ca and macroscopic viscous forces at high Ca. This transition again coincides with the predicted transition capillary number Ca, as shown by the blue line, confirming our previous prediction. We next investigate the influence of increasing cross-section area ratio . As exemplified by the middle and top rows of Fig. 4(a), we find similar behavior as in the case. This result is again consistent with our theoretical prediction for Ca, as indicated by the blue line. In particular, because the fluid pressure is equal across the strata at the inlet and outlet, (Eq. 9) is independent of . Our simulations confirm this expectation: while we see slight differences in the full dynamics of imbibition across the different simulations, we observe no variation of with .
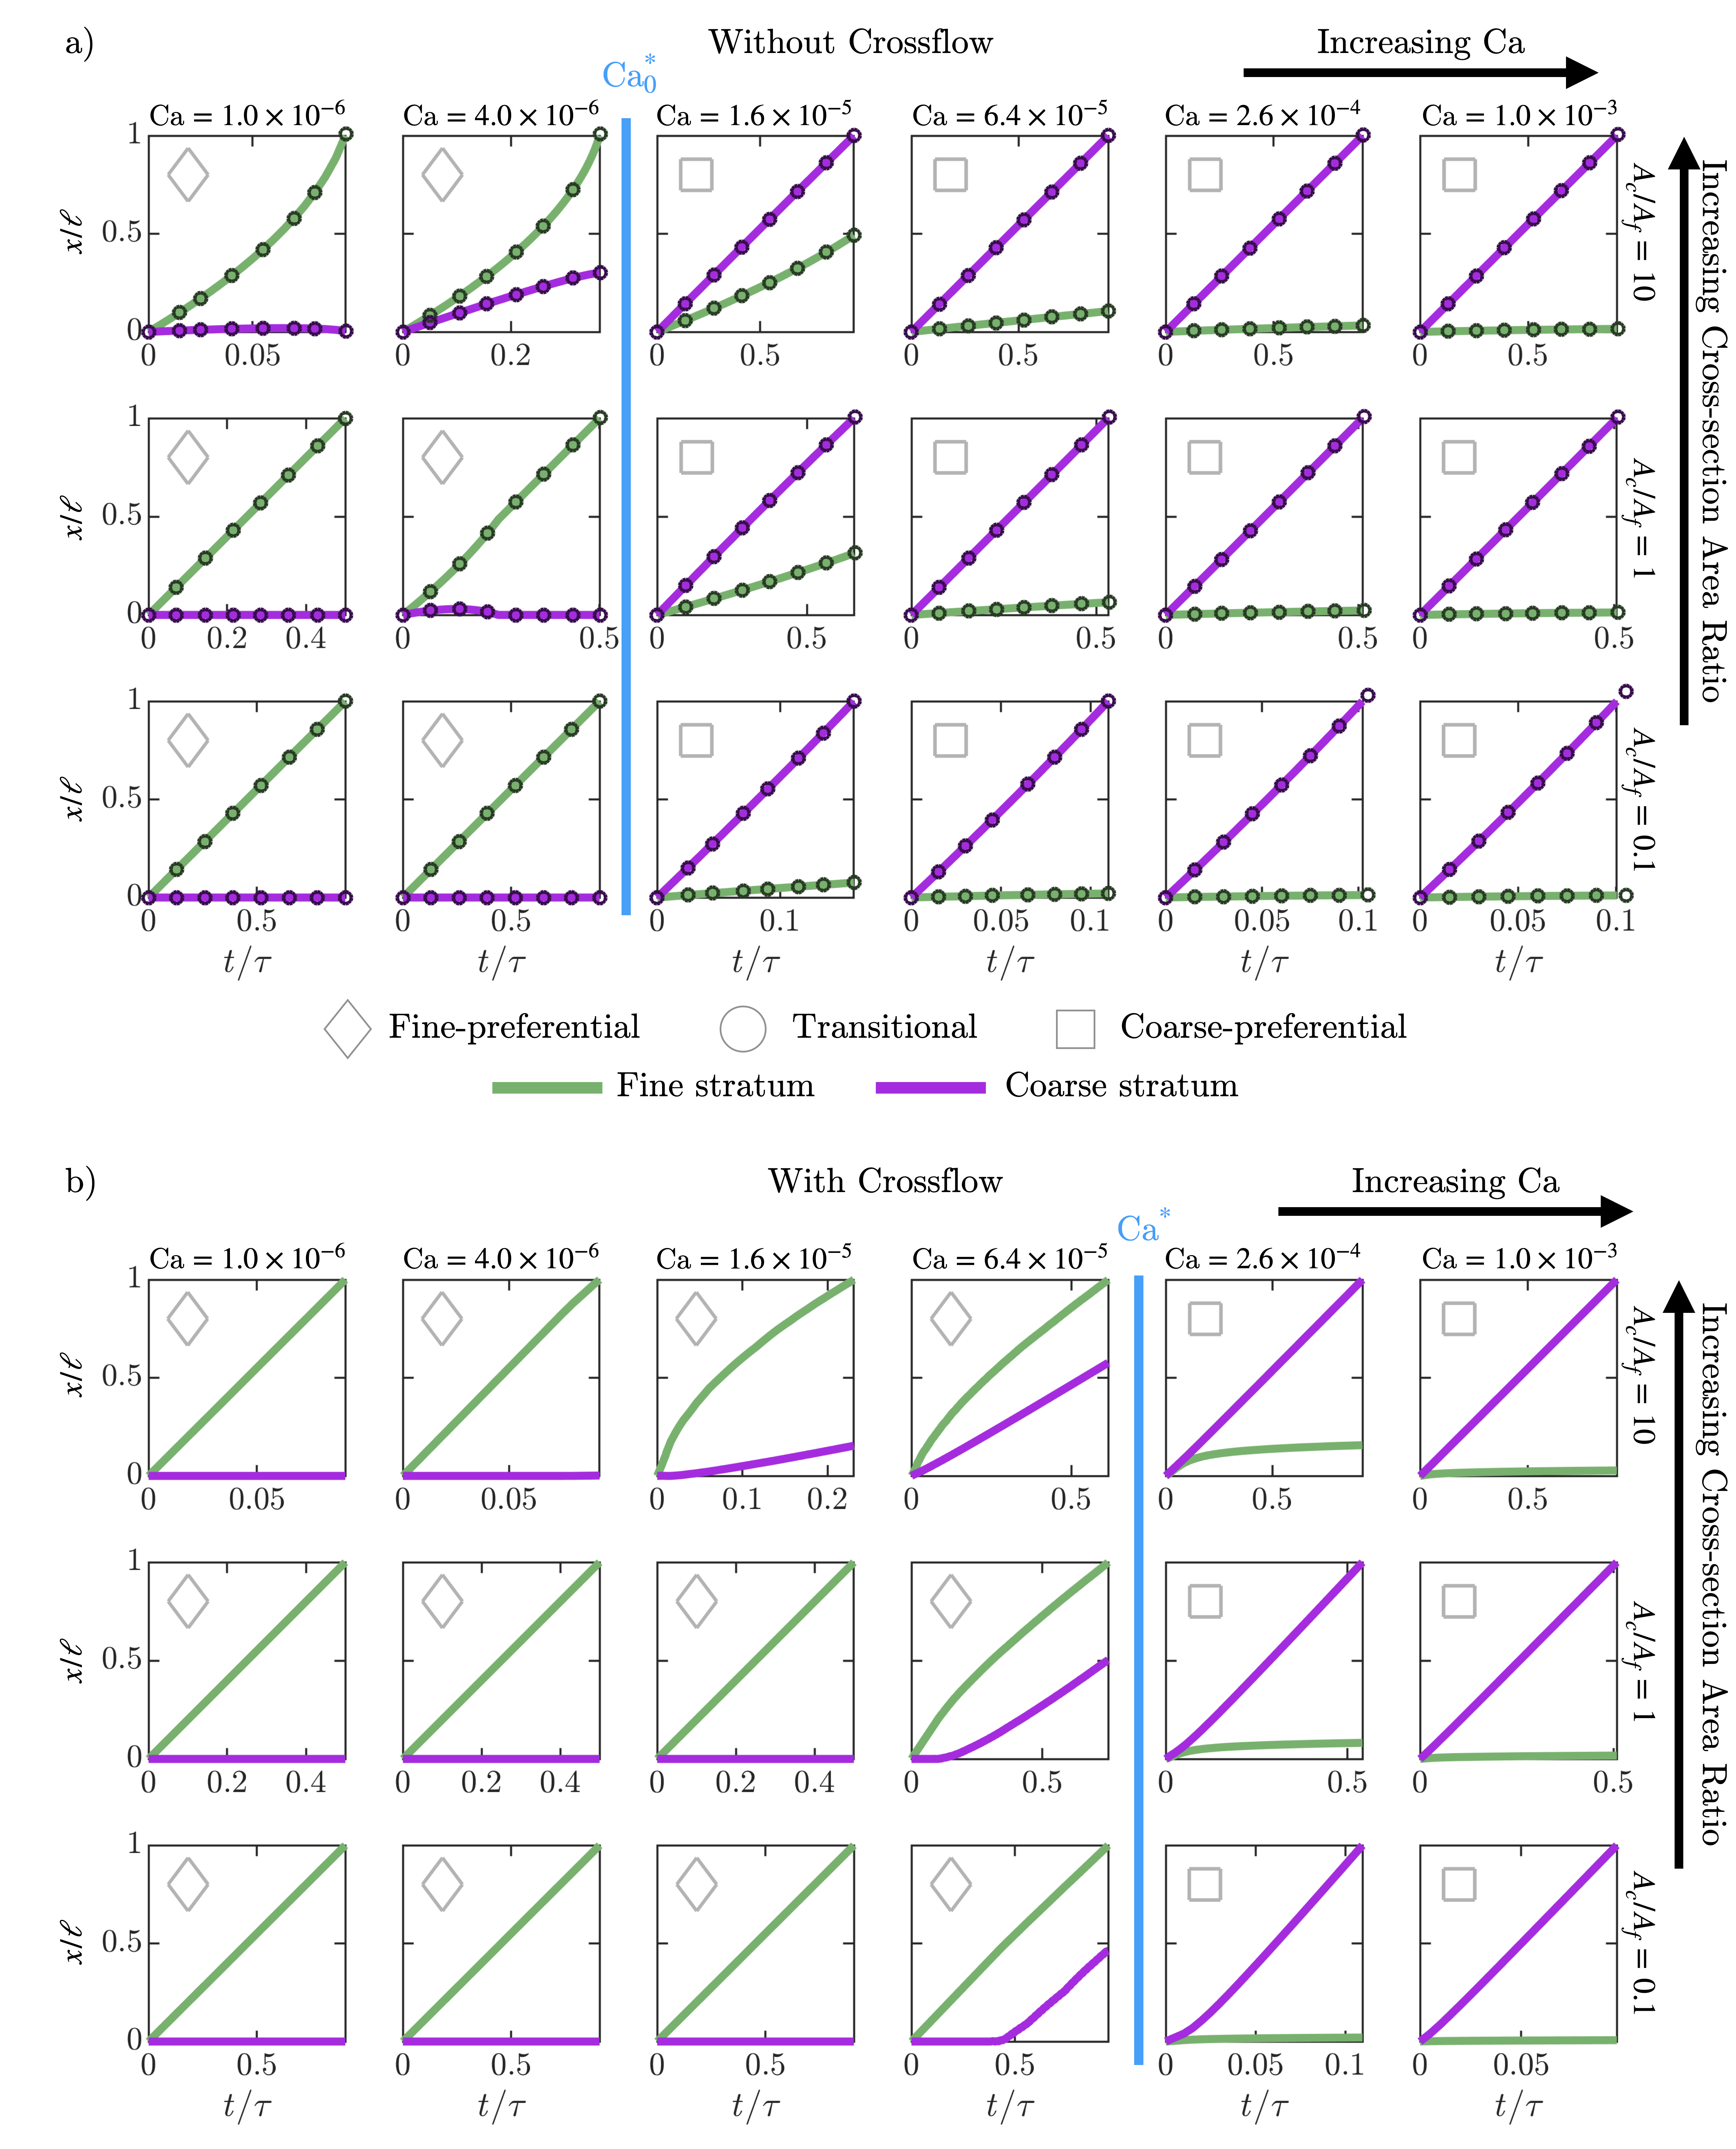
Dynamics with crossflow: Incorporating crossflow into the model yields qualitatively similar invasion dynamics; compare Fig. 4(b) to (a). In particular, in all cases, we observe a similar transition between fine- and coarse-preferential invasion around the Ca∗ predicted by Eq. 11, as shown by the blue line in Fig. 4(b). Again, in all cases: crossflow suppresses, but does not eliminate, the transition to coarse-preferential invasion. Furthermore, we again find that incorporating crossflow removes the non-monotonic “pore doublet” dynamics.
Breakthrough time: The breakthrough times determined from the numerical simulations, both without and with crossflow incorporated, are shown in Figs. 5(a) and (b), respectively. We again observe similar results in both cases, but with the results below the transition Ca shifted to higher values of Ca when crossflow is incorporated, reflecting the shift in the transition to Ca∗. As intuitively expected, for a given , the breakthrough time monotonically decreases with Ca. Intriguingly, however, we observe different dependencies on for a given Ca below or above the transition value (Ca or Ca∗); for Ca below the transition, decreases with increasing , while conversely for Ca above the transition, increases with increasing . These differing dynamics reflect the difference in invasion behaviors; in the case of fine-preferential invasion at low Ca, increasing reduces the volume of the fine stratum, and therefore the volume of fluid needed to be displaced, while for coarse-preferential invasion at high Ca, increasing increases the volume of the fluid that needs to be displaced from the coarse stratum. Thus, processes that only seek to minimize breakthrough time should maximize the imposed Ca and, if possible, minimize .
Breakthrough saturation: The breakthrough nonwetting fluid saturation determined from the numerical simulations, both without and with crossflow incorporated, are shown in Figs. 5(c) and (d), respectively. We again observe similar results in both cases, but with the results shifted to higher values of Ca when crossflow is incorporated, reflecting the shift in the transition from Ca to Ca∗. Furthermore, we again observe different dependencies on below or above the transition value (Ca or Ca∗), reflecting the difference in invasion behaviors. In the case of fine-preferential invasion at low Ca, increasing reduces the volume of the fine stratum from which nonwetting fluid is displaced, while in the case of coarse-preferential invasion at high Ca, increasing increases the volume of the coarse stratum from which nonwetting fluid is displaced. As a result, contrary to the conventional belief that Ca should be maximized to minimize , we find that breakthrough saturation is minimized near the transition capillary number Ca or Ca∗ — again reflecting the improved displacement of nonwetting fluid from both strata during transitional invasion. Thus, processes that seek to minimize both breakthrough time and breakthrough saturation should not maximize the imposed Ca. Instead, they should be tuned to be near the capillary number that describes the transition between invasion behaviors, independent of .
IV.3 Influence of Medium Length
The overall length of the medium is another key structural descriptor. For a fixed cross-section , changing the length of a porous medium changes its overall aspect ratio; hence, to describe the length in a non-dimensional form, we normalize it by the characteristic transverse length . The normalized length of typical oil reservoirs can exceed 100 (Table 1). Hence, we vary the normalized length from 0.67 to 67 while keeping the total cross-section area constant, which corresponds to varying from 0.2 to 20 cm.
Dynamics without crossflow: For the case of imbibition wihtout crossflow as shown in Fig. 6(a), we observe fine-preferential invasion at the lowest Ca, reflecting the dominance of pore-scale capillarity; by contrast, at sufficiently large Ca, we observe coarse-preferential invasion, reflecting the increasing influence of macroscopic viscous forces. Just above the transition (Ca ) for the longest medium , shown in the top row and first column of Fig. 6(a), we again observe apparent transitional invasion and long-time “pore doublet” dynamics. This case is still classified as coarse invasion based on the initial invasion speeds—again highlighting that a classification based only on the incipient invasion behavior misses interesting subsequent dynamics during imbibition. In all cases, the transition between fine- and coarse-preferential invasion behaviors again coincides with the predicted transition capillary number Ca, as shown by the blue line, confirming our theoretical prediction (Eq. 9). In particular, because , longer media — for which the macroscopic viscous pressure drop is larger — exhibit the transition to coarse-preferential invasion at lower Ca.
Dynamics with crossflow: Incorporating crossflow into the model again yields qualitatively similar invasion dynamics; compare Fig. 6(b) to (a). In all cases, we observe a similar transition between fine- and coarse-preferential invasion around the Ca∗ predicted by Eq. 11, as shown by the blue line in Fig. 6(b). Again, in all cases: crossflow suppresses, but does not eliminate, the transition to coarse-preferential invasion. Furthermore, we again find that incorporating crossflow removes the non-monotonic “pore doublet” dynamics.
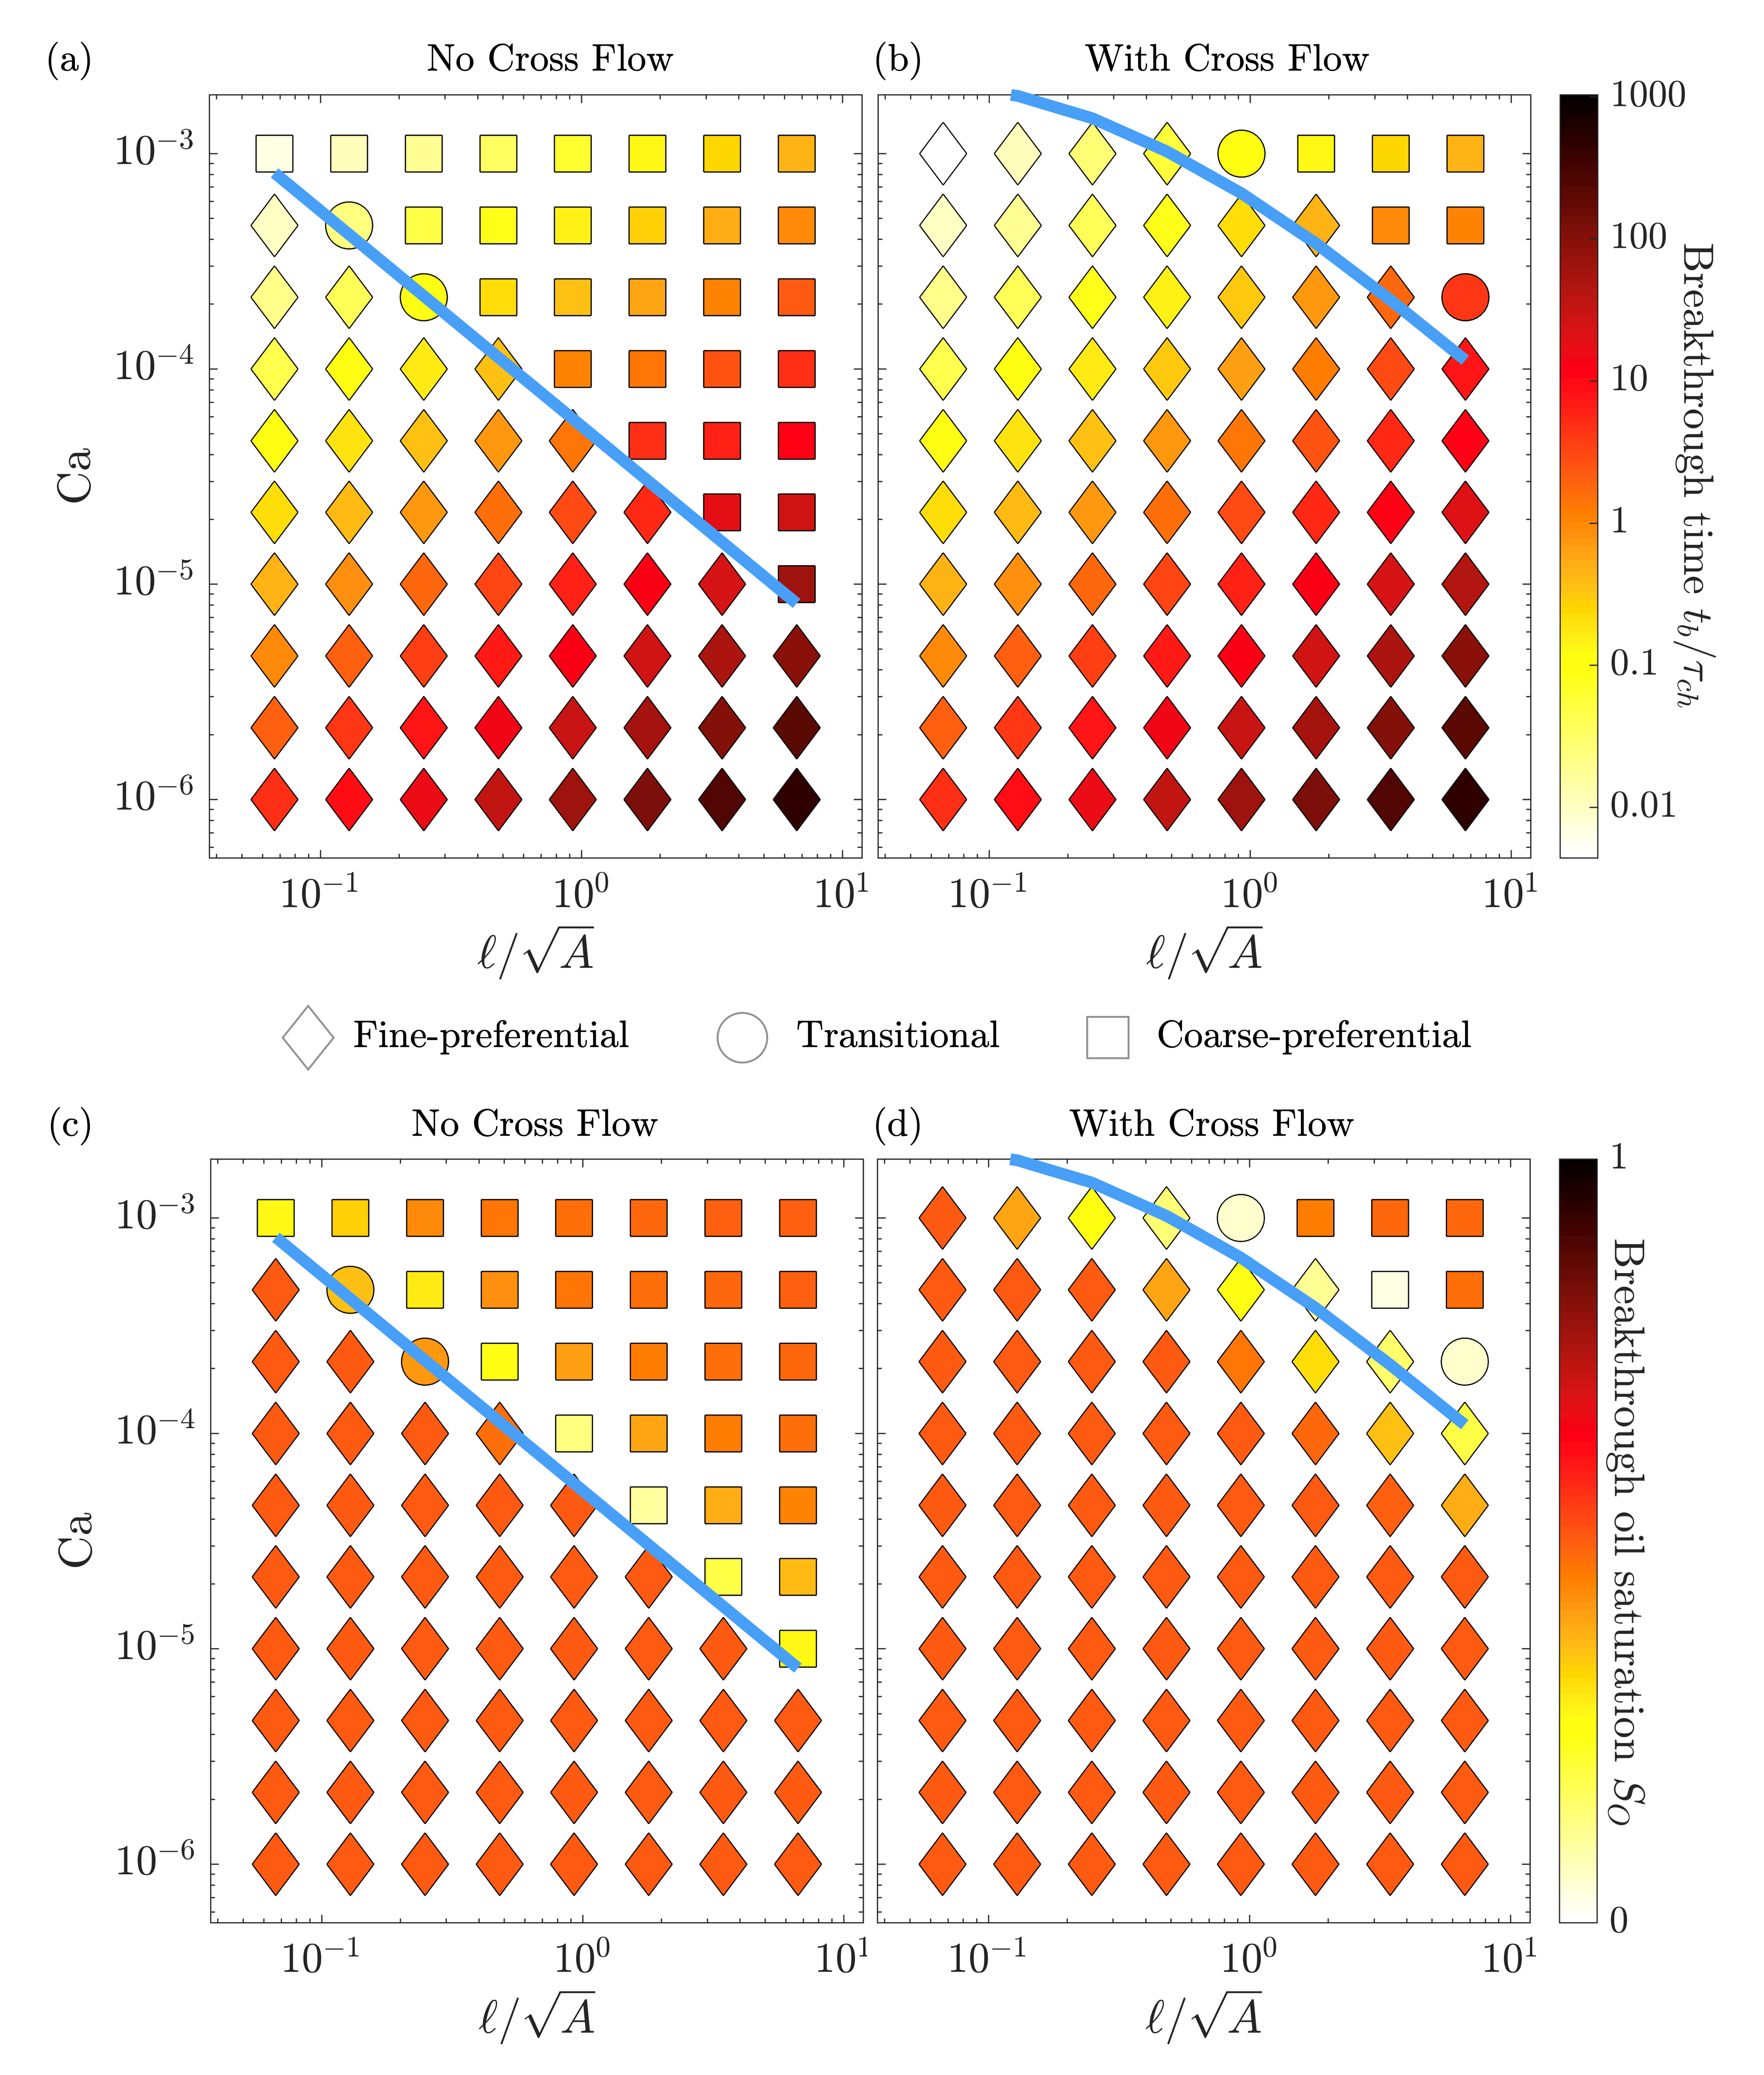
Breakthrough time: The breakthrough times determined from the numerical simulations, both without and with crossflow incorporated, are shown in Figs. 7(a) and (b), respectively. We again observe similar results in both cases. For a given value of Ca, fastest breakthrough occurs at smaller as intuitively expected – the medium is shorter and thus will be invaded faster. Moreover, for a given , fastest breakthrough occurs at at higher Ca, again as intuitively expected. Thus, processes that only seek to minimize breakthrough time should maximize the imposed Ca and, if possible, minimize .
Breakthrough saturation: The breakthrough nonwetting fluid saturation determined from the numerical simulations, both without and with crossflow incorporated, are shown in Figs. 7(c) and (d), respectively. Contrary to the conventional belief that Ca should be maximized to minimize , we find that in both cases, the breakthrough saturation exhibits a non-monotonic dependence on Ca: is again minimized near the transition capillary number Ca or Ca∗, once more reflecting the improved displacement of nonwetting fluid from both strata during transitional invasion. Thus, processes that seek to minimize both breakthrough time and breakthrough saturation should not maximize the imposed Ca. Instead, they should be tuned to be near the capillary number that describes the transition between invasion behaviors. The value of this transition capillary number decreases with increasing normalized medium length, again highlighting the critical role played by the geometry of the medium in influencing performance during fluid imbibition.
IV.4 Influence of Viscosity Ratio
Another key control parameter is the viscosity ratio between the nonwetting and wetting fluids, ; for example, groundwater remediation and oil recovery operations often tune this parameter over a wide range for conformance control (Table 1). Hence, we probe ranging from 0.1 to 10. Here, we accomplish this by holding constant and varying ; the reverse case yields identical results (not shown). We reiterate that, while our results help to highlight the critical role played by stratification in influencing imbibition, they do not capture the full physics associated with interfacial instabilities that can arise during flow, particularly at large values of [31]. Incorporating these effects will be an important extension of our work.
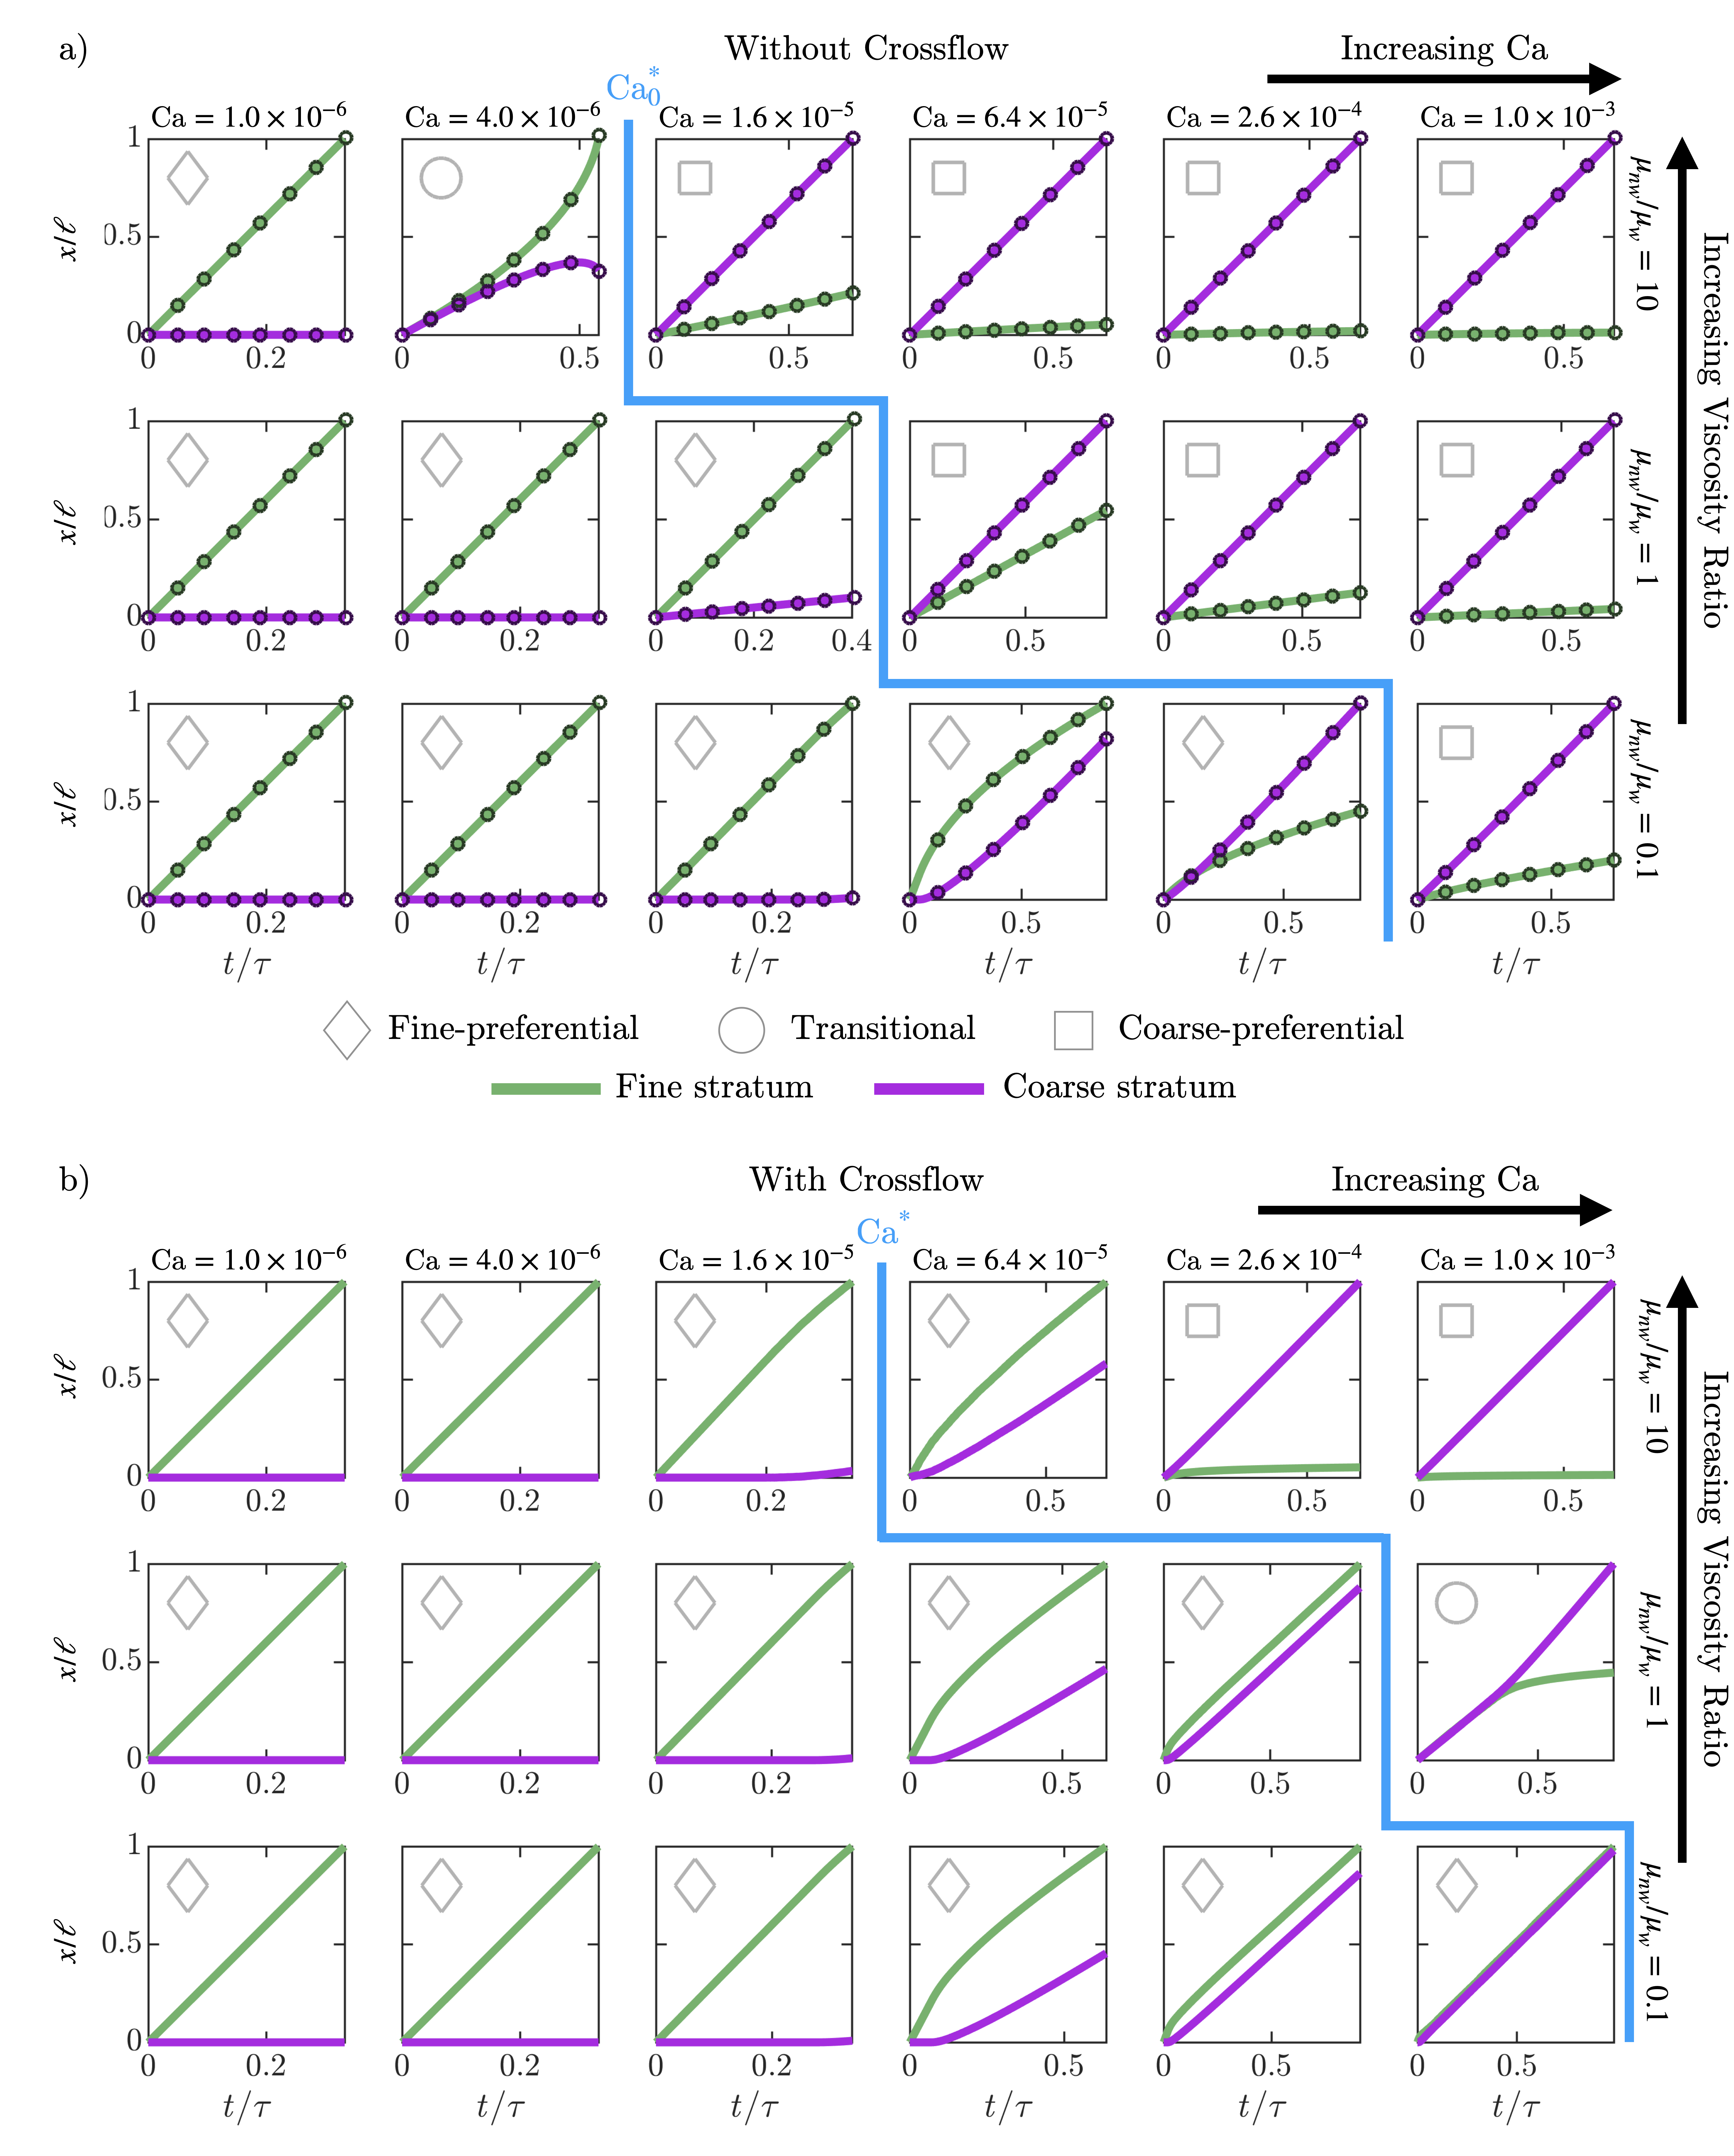
Dynamics without crossflow: We first consider the dynamics of imbibition without crossflow, as shown in Fig. 8(a). At the lowest and highest Ca, we again observe fine- and coarse-preferential invasion, respectively, reflecting the competition between pore-scale capillarity and macroscopic viscous forces. Just below the transition for the smallest and largest viscosity ratios and , shown by the bottom and top rows, respectively, we again observe apparent transitional invasion and long-time “pore doublet” dynamics. In all cases, the transition between fine- and coarse-preferential invasion behaviors again coincides with the predicted transition capillary number Ca, as shown by the blue line, confirming our theoretical prediction (Eq. 9). In particular, because , increasing the fluid viscosity ratio shifts the transition to coarse-preferential invasion at lower Ca: while capillary suction guides the initial invasion of the wetting fluid into the pores, viscous forces exerted by the invading fluid increasingly limit invasion into the lower-permeability fine stratum.
Dynamics with crossflow: Incorporating crossflow into the model again yields qualitatively similar invasion dynamics; compare Fig. 8(b) to (a). In all cases, we observe a similar transition between fine- and coarse-preferential invasion around the Ca∗ predicted by Eq. 11, as shown by the blue line in Fig. 8(b). Again, in all cases: crossflow suppresses, but does not eliminate, the transition to coarse-preferential invasion. Furthermore, we again find that incorporating crossflow removes the non-monotonic “pore doublet” dynamics.
Breakthrough time: The breakthrough times determined from the numerical simulations, both without and with crossflow incorporated, are shown in Figs. 9(a) and (b), respectively. We again observe similar results in both cases: monotonically decreases with Ca, with no strong dependence on or crossflow. Thus, within the assumptions of our model, processes that only seek to minimize breakthrough time should maximize the imposed Ca.
Breakthrough saturation: The breakthrough nonwetting fluid saturation determined from the numerical simulations, both without and with crossflow incorporated, are shown in Figs. 9(c) and (d), respectively. Contrary to the conventional belief that Ca should be maximized to minimize , we find that in both cases, the breakthrough saturation exhibits a non-monotonic dependence on Ca: is again minimized near the transition capillary number Ca or Ca∗, again reflecting the improved displacement of nonwetting fluid from both strata during transitional invasion. Additionally, for a fixed , decreases with increasing Ca up to the transition — reflecting the broad range of capillary numbers over which increasingly transitional invasion arises. Thus, within the assumptions of our model, processes that seek to minimize both breakthrough time and breakthrough saturation should not maximize the imposed Ca. Instead, they should be tuned to be near the capillary number that describes the transition between invasion behaviors, whose value decreases with increasing viscosity ratio, highlighting the key role played by fluid formulation in influencing performance during imbibition.
IV.5 Comparison to an averaged model
In practice, imbibition dynamics are often modeled by treating stratified porous media as being non-stratified, with homogeneous, strata-averaged properties – thus treating imbibition as being homogeneous across different strata. The work presented in this paper has revealed how such averaging can yield erroneous predictions. As a final illustration of this point, we compare the predictions of our model explicitly incorporating heterogeneous invasion dynamics for media of different pore throat size ratios (Fig. 2) to the predictions of a stratum-averaged model, in which the medium has a single effective permeability given by the area-weighted permeabilities of the separate strata: . Because of the heterogeneous flow arising from stratification, in all cases, fluid breakthrough is considerably faster in the stratified medium than one would expect for a homogeneous medium — as shown in Fig. 10. Compare, for example, the black curves (imbibition in a homogeneous medium) to the green and magenta curves (imbibition in the fine and coarse strata, respectively) in the top row of Fig. 10b. At the lowest Ca, fluid barely enters the coarse stratum; as a result, it breaks through the fine stratum rapidly, whereas at the same time, it would only have invaded of a homogeneous medium. Conversely, at the highest Ca, fluid barely enters the fine stratum, and breaks through the coarse stratum rapidly, whereas it would have only invaded of a homogeneous medium. Moreover, in both cases, the bypassing of either the coarse or fine stratum leaves behind of the defending nonwetting fluid—a considerable amount that is completely missed by the averaged model, which does not capture any of the heterogeneous invasion behaviors that arise in stratified media, and therefore only approximates the flow behavior near the transitional invasion regime.
V Discussion and Conclusion
Our theoretical analysis and numerical simulations of the full dynamics of forced imbibition in a stratified medium quantify two distinct heterogeneous invasion behaviors, consistent with our and others’ previous experimental results [59, 50, 51, 52, 53, 47, 54, 55, 56, 57, 47, 58]: at small imposed capillary number Ca, the wetting fluid preferentially invades the fine stratum, while at large Ca, the wetting fluid instead preferentially invades the coarse stratum. We find that the transition between these behaviors is well described by the transition capillary number Ca (Eq. 9) or Ca∗ (Eq. 11) – describing imbibition without and with crossflow between the strata, respectively – as predicted by our previous linear stability analysis [59]. Furthermore, our results suggest that crossflow between adjacent strata shifts the invasion dynamics to higher values of Ca, reflecting the shift in the transition from Ca to Ca∗. Our numerical simulations enable us to examine how two key performance metrics – the wetting fluid breakthrough time and the nonwetting fluid breakthrough saturation – depend on injection conditions as well as the structure of the medium. In a homogeneous, averaged model, both quantities are minimized, as is often desirable, by simply maximizing the imposed Ca. Our work makes a starkly different prediction: to minimize both breakthrough time and breakthrough nonwetting fluid saturation, practitioners should tune Ca to near the transition capillary number, thereby preventing one stratum from being bypassed. Thus, we anticipate that this work will help guide imbibition processes in energy, environmental, and industrial applications that seek to control both and . Two prominent examples include pump-and-treat remediation of contaminated groundwater aquifers [40, 82] and enhanced oil/gas recovery [43, 83, 84, 40, 41]; in both cases, injected wetting fluids are used to displace nonwetting fluid from heterogeneous subsurface media as quickly and effectively as possible. Other examples include controlling moisture wicking in building materials [21, 22, 23], layered microporous fabrics [85, 86, 87], and paper microfluidics [20, 88, 89, 90],
Together, this work highlights how stratification fundamentally alters the dynamics of forced imbibition in a porous medium. It represents a first step toward capturing all the physics underlying these complex dynamics, and necessarily involves some simplifying assumptions and approximations. For example, we treat the nonwetting/wetting fluid interface in each stratum as being sharp; incorporating the influence of pore-scale heterogeneities and interfacial instabilities will be an important extension of our work. Moreover, our model describes crossflow across strata within a given fluid using a Darcy’s law model of transverse flow localized near the interface between the strata; more detailed studies of this crossflow, and incorporating crossflow with different fluids into the model, will be a useful direction for future work. Finally, while our work focuses on a porous medium with two adjacent strata as a model system, the results motivate further studies of flow in media with even more strata.
Acknowledgements.
It is a pleasure to acknowledge Amir Pahlavan and Howard Stone, as well as Gary Hunter, Hubert King, and Jeremy Brandman from ExxonMobil Corporate Strategic Research, for stimulating discussions. This work was supported by ExxonMobil through its membership in the Princeton E-filliates Partnership of the Andlinger Center for Energy and the Environment and in part by the Grand Challenges Initiative of the High Meadows Environmental Institute, and in part by funding from the Princeton Center for Complex Materials, a Materials Research Science and Engineering Center supported by NSF grant DMR-2011750. N.B.L. was also supported in part by the Mary and Randall Hack Graduate Award of the High Meadows Environmental Institute. Author contributions — N.B.L. and S.S.D. designed the study; N.B.L. numerically solved the theoretical model; D.B.A. designed and performed simulations of the pore network model; N.B.L. and S.S.D. analyzed the data; and S.S.D. designed and supervised the overall project. All authors discussed the results and wrote the manuscript.References
- Morrow and Mason [2001] N. R. Morrow and G. Mason, Recovery of oil by spontaneous imbibition, Current Opinion in Colloid & Interface Science 6, 321 (2001).
- Mattax et al. [1962] C. C. Mattax, J. Kyte, et al., Imbibition oil recovery from fractured, water-drive reservoir, Society of Petroleum Engineers Journal 2, 177 (1962).
- Li et al. [2000] K. Li, R. N. Horne, et al., Characterization of spontaneous water imbibition into gas-saturated rocks, in SPE/AAPG Western Regional Meeting (Society of Petroleum Engineers, 2000).
- Nicolaides et al. [2015] C. Nicolaides, B. Jha, L. Cueto-Felgueroso, and R. Juanes, Impact of viscous fingering and permeability heterogeneity on fluid mixing in porous media, Water Resources Research 51, 2634 (2015).
- Forner-Cuenca et al. [2016] A. Forner-Cuenca, J. Biesdorf, A. Lamibrac, V. Manzi-Orezzoli, F. Büchi, L. Gubler, T. J. Schmidt, and P. Boillat, Advanced water management in PEFCs: Diffusion layers with patterned wettability: II. Measurement of capillary pressure characteristic with neutron and synchrotron imaging, Journal of The Electrochemical Society 163, F1038 (2016).
- Bennion et al. [2006] D. B. Bennion, S. Bachu, et al., Supercritical CO2 and H2S-brine drainage and imbibition relative permeability relationships for intercrystalline sandstone and carbonate formations, in SPE Europec/EAGE Annual Conference and Exhibition (Society of Petroleum Engineers, 2006).
- Bennion et al. [2010] D. B. Bennion, S. Bachu, et al., Drainage and imbibition CO2/brine relative permeability curves at reservoir conditions for high-permeability carbonate rocks, in SPE Annual Technical Conference and Exhibition (Society of Petroleum Engineers, 2010).
- Hatiboglu and Babadagli [2008] C. U. Hatiboglu and T. Babadagli, Pore-scale studies of spontaneous imbibition into oil-saturated porous media, Physical Review E 77, 066311 (2008).
- Celia et al. [2015] M. A. Celia, S. Bachu, J. Nordbotten, and K. Bandilla, Status of CO2 storage in deep saline aquifers with emphasis on modeling approaches and practical simulations, Water Resources Research 51, 6846 (2015).
- Schaefer et al. [2000] C. Schaefer, D. DiCarlo, and M. Blunt, Experimental measurement of air-water interfacial area during gravity drainage and secondary imbibition in porous media, Water Resources Research 36, 885 (2000).
- Esposito and Benson [2011] A. Esposito and S. M. Benson, Remediation of possible leakage from geologic CO2 storage reservoirs into groundwater aquifers, Energy Procedia 4, 3216 (2011).
- Penvern et al. [2020] H. Penvern, M. Zhou, B. Maillet, D. Courtier-Murias, M. Scheel, J. Perrin, T. Weitkamp, S. Bardet, S. Caré, and P. Coussot, How bound water regulates wood drying, Phys. Rev. Applied 14, 054051 (2020).
- Zhou et al. [2019] M. Zhou, S. Caré, A. King, D. Courtier-Murias, S. Rodts, G. Gerber, P. Aimedieu, M. Bonnet, M. Bornert, and P. Coussot, Wetting enhanced by water adsorption in hygroscopic plantlike materials, Phys. Rev. Research 1, 033190 (2019).
- Weisbrod et al. [2002] N. Weisbrod, M. R. Niemet, and J. S. Selker, Imbibition of saline solutions into dry and prewetted porous media, Advances in Water Resources 25, 841 (2002).
- Tesoro et al. [2007] F. Tesoro, E. Choong, and O. Kimbler, Relative permeability and the gross pore structure of wood, Wood and Fiber Science 6, 226 (2007).
- Hassanein et al. [2006] R. Hassanein, H. Meyer, A. Carminati, M. Estermann, E. Lehmann, and P. Vontobel, Investigation of water imbibition in porous stone by thermal neutron radiography, Journal of Physics D: Applied Physics 39, 4284 (2006).
- Attou and Ferschneider [1999] A. Attou and G. Ferschneider, A two-fluid model for flow regime transition in gas–liquid trickle-bed reactors, Chemical Engineering Science 54, 5031 (1999).
- Tang et al. [2015a] K. Tang, K. Chau, C. Kan, and J. Fan, Characterizing the transplanar and in-plane water transport properties of fabrics under different sweat rate: Forced flow water transport tester, Scientific Reports 5, 17012 (2015a).
- Tang et al. [2015b] K. Tang, Y. Wu, K. Chau, C. Kan, and J. Fan, Characterizing the transplanar and in-plane water transport of textiles with gravimetric and image analysis technique: Spontaneous uptake water transport tester, Scientific Reports 5, 9689 (2015b).
- Castro et al. [2017] C. Castro, C. Rosillo, and H. Tsutsui, Characterizing effects of humidity and channel size on imbibition in paper-based microfluidic channels, Microfluidics and Nanofluidics 21, 21 (2017).
- Fourmentin et al. [2016] M. Fourmentin, P. Faure, P. Pelupessy, V. Sarou-Kanian, U. Peter, D. Lesueur, S. Rodts, D. Daviller, and P. Coussot, Nmr and mri observation of water absorption/uptake in hemp shives used for hemp concrete, Construction and Building Materials 124, 405 (2016).
- Rahman et al. [2015] M. A. Rahman, M. A. Imteaz, A. Arulrajah, J. Piratheepan, and M. M. Disfani, Recycled construction and demolition materials in permeable pavement systems: Geotechnical and hydraulic characteristics, Journal of Cleaner Production 90, 183 (2015).
- Takahashi et al. [1996] D. Takahashi, K. Sakagami, and M. Morimoto, Acoustic properties of permeable membranes, The Journal of the Acoustical Society of America 99, 3003 (1996).
- Abdelouahab et al. [2019] N. B. Abdelouahab, A. Gossard, C. Marlière, P. Faure, S. Rodts, and P. Coussot, Controlled imbibition in a porous medium from a soft wet material (poultice), Soft matter 15, 6732 (2019).
- Hong and Kim [2015] S. Hong and W. Kim, Dynamics of water imbibition through paper channels with wax boundaries, Microfluidics and Nanofluidics 19, 845 (2015).
- Lenormand et al. [1984] R. Lenormand, C. Zarcone, et al., Role of roughness and edges during imbibition in square capillaries, in SPE Annual Technical Conference and Exhibition (Society of Petroleum Engineers, 1984).
- Chang et al. [2009] L.-C. Chang, J.-P. Tsai, H.-Y. Shan, and H.-H. Chen, Experimental study on imbibition displacement mechanisms of two-phase fluid using micro model, Environmental Earth Sciences 59, 901 (2009).
- Sun et al. [2016] Y. Sun, A. Kharaghani, and E. Tsotsas, Micro-model experiments and pore network simulations of liquid imbibition in porous media, Chemical Engineering Science 150, 41 (2016).
- Hughes and Blunt [2000] R. G. Hughes and M. J. Blunt, Pore scale modeling of rate effects in imbibition, Transport in Porous Media 40, 295 (2000).
- Lenormand et al. [1988] R. Lenormand, E. Touboul, and C. Zarcone, Numerical models and experiments on immiscible displacements in porous media, Journal of Fluid Mechanics 189, 165 (1988).
- Lenormand [1990] R. Lenormand, Liquids in porous media, Journal of Physics: Condensed Matter 2, SA79 (1990).
- Sahimi [1993] M. Sahimi, Flow phenomena in rocks: From continuum models to fractals, percolation, cellular automata, and simulated annealing, Reviews of Modern Physics 65, 1393 (1993).
- Alava et al. [2004] M. Alava, M. Dubé, and M. Rost, Imbibition in disordered media, Advances in Physics 53, 83 (2004).
- Stokes et al. [1986] J. Stokes, D. Weitz, J. P. Gollub, A. Dougherty, M. Robbins, P. Chaikin, and H. Lindsay, Interfacial stability of immiscible displacement in a porous medium, Physical Review Letters 57, 1718 (1986).
- Weitz et al. [1987] D. Weitz, J. Stokes, R. Ball, and A. Kushnick, Dynamic capillary pressure in porous media: Origin of the viscous-fingering length scale, Physical Review Letters 59, 2967 (1987).
- Hultmark et al. [2011] M. Hultmark, J. M. Aristoff, and H. A. Stone, The influence of the gas phase on liquid imbibition in capillary tubes, Journal of Fluid Mechanics 678, 600 (2011).
- Zhao et al. [2016] B. Zhao, C. W. MacMinn, and R. Juanes, Wettability control on multiphase flow in patterned microfluidics, Proceedings of the National Academy of Sciences 113, 10251 (2016).
- Tanino et al. [2018] Y. Tanino, X. Zacarias-Hernandez, and M. Christensen, Oil/water displacement in microfluidic packed beds under weakly water-wetting conditions: Competition between precursor film flow and piston-like displacement, Experiments in Fluids 59, 35 (2018).
- Odier et al. [2017] C. Odier, B. Levaché, E. Santanach-Carreras, and D. Bartolo, Forced imbibition in porous media: A fourfold scenario, Physical Review Letters 119, 208005 (2017).
- Bear [2013] J. Bear, Dynamics of Fluids in Porous Media (Courier Corporation, 2013).
- Galloway and Hobday [2012] W. E. Galloway and D. K. Hobday, Terrigenous Clastic Depositional Systems: Applications to Fossil Fuel and Groundwater Resources (Springer Science & Business Media, 2012).
- Gasda and Celia [2005] S. Gasda and M. A. Celia, Upscaling relative permeabilities in a structured porous medium, Advances in Water Resources 28, 493 (2005).
- King et al. [2018] H. King, M. Sansone, P. Kortunov, Y. Xu, N. Callen, S. Chhatre, H. Sahoo, A. Buono, et al., Microstructural investigation of stress-dependent permeability in tight-oil rocks, Petrophysics 59, 35 (2018).
- Datta and Weitz [2013] S. S. Datta and D. A. Weitz, Drainage in a model stratified porous medium, EPL (Europhysics Letters) 101, 14002 (2013).
- Reyssat et al. [2009] M. Reyssat, L. Sangne, E. Van Nierop, and H. A. Stone, Imbibition in layered systems of packed beads, EPL (Europhysics Letters) 86, 56002 (2009).
- Zhou et al. [1997] D. Zhou, F. Fayers, F. Orr Jr, et al., Scaling of multiphase flow in simple heterogeneous porous media, SPE Reservoir Engineering 12, 173 (1997).
- Zapata et al. [1981] V. J. Zapata, L. W. Lake, et al., A theoretical analysis of viscous crossflow, in SPE Annual Technical Conference and Exhibition (Society of Petroleum Engineers, 1981).
- Ashraf et al. [2017] S. Ashraf, G. Visavale, S. Bahga, and J. Phirani, Spontaneous imbibition in parallel layers of packed beads, The European Physical Journal E 40, 39 (2017).
- Ashraf and Phirani [2019] S. Ashraf and J. Phirani, Capillary displacement of viscous liquids in a multi-layered porous medium, Soft Matter 15, 2057 (2019).
- Cinar et al. [2004] Y. Cinar, K. Jessen, R. Berenblyum, R. Juanes, F. Orr Jr, et al., An experimental and numerical investigation of crossflow effects in two-phase displacements, in SPE Annual Technical Conference and Exhibition (Society of Petroleum Engineers, 2004).
- Dong et al. [2005] M. Dong, F. A. Dullien, L. Dai, and D. Li, Immiscible displacement in the interacting capillary bundle model: Development of interacting capillary bundle model, Transport in Porous Media 59, 1 (2005).
- Dawe et al. [1992] R. Dawe, M. Wheat, and M. Bidner, Experimental investigation of capillary pressure effects on immiscible displacement in lensed and layered porous media, Transport in Porous Media 7, 83 (1992).
- Dong et al. [1998] M. Dong, J. Zhou, et al., Characterization of waterflood saturation profile histories by the ‘complete’ capillary number, Transport in Porous Media 31, 213 (1998).
- Ahmed et al. [1988] G. Ahmed, L. M. Castanier, W. E. Brigham, et al., An experimental study of waterflooding from a two-dimensional layered sand model, SPE Reservoir Engineering 3, 45 (1988).
- Yokoyama et al. [1981] Y. Yokoyama, L. W. Lake, et al., The effects of capillary pressure on immiscible displacements in stratified porous media, in SPE Annual Technical Conference and Exhibition (Society of Petroleum Engineers, 1981).
- Debbabi et al. [2017a] Y. Debbabi, M. D. Jackson, G. J. Hampson, P. J. Fitch, and P. Salinas, Viscous crossflow in layered porous media, Transport in Porous Media 117, 281 (2017a).
- Debbabi et al. [2017b] Y. Debbabi, M. D. Jackson, G. J. Hampson, and P. Salinas, Capillary heterogeneity trapping and crossflow in layered porous media, Transport in Porous Media 120, 183 (2017b).
- Ambekar et al. [2018] A. S. Ambekar, V. V. Buwa, and J. Phirani, Interface dynamics during two phase flow in stratified porous medium, in International Conference on Nanochannels, Microchannels, and Minichannels, Vol. 51197 (American Society of Mechanical Engineers, 2018) p. V001T02A018.
- Lu et al. [2020] N. B. Lu, A. A. Pahlavan, C. A. Browne, D. B. Amchin, H. A. Stone, and S. S. Datta, Forced imbibition in stratified porous media, Physical Review Applied 14, 054009 (2020).
- King et al. [1999] P. R. King, J. S. Andrade Jr, S. V. Buldyrev, N. Dokholyan, Y. Lee, S. Havlin, and H. E. Stanley, Predicting oil recovery using percolation, Physica A: Statistical Mechanics and its Applications 266, 107 (1999).
- Abrams et al. [1975] A. Abrams et al., The influence of fluid viscosity, interfacial tension, and flow velocity on residual oil saturation left by waterflood, Society of Petroleum Engineers Journal 15, 437 (1975).
- Maji et al. [2008] S. K. Maji, A. Pal, and T. Pal, Arsenic removal from real-life groundwater by adsorption on laterite soil, Journal of Hazardous Materials 151, 811 (2008).
- Neukum and Azzam [2009] C. Neukum and R. Azzam, Quantitative assessment of intrinsic groundwater vulnerability to contamination using numerical simulations, Science of the Total Environment 408, 245 (2009).
- Lenormand et al. [1983] R. Lenormand, C. Zarcone, and A. Sarr, Mechanisms of the displacement of one fluid by another in a network of capillary ducts, Journal of Fluid Mechanics 135, 337 (1983).
- Princen [1969a] H. Princen, Capillary phenomena in assemblies of parallel cylinders: Capillary rise between two cylinders, Journal of Colloid and Interface Science 30, 69 (1969a).
- Princen [1969b] H. Princen, Capillary phenomena in assemblies of parallel cylinders: Capillary rise in systems with more than two cylinders, Journal of Colloid and Interface Science 30, 359 (1969b).
- Princen [1970] H. Princen, Capillary phenomena in assemblies of parallel cylinders: Liquid columns between horizontal parallel cylinders, Journal of Colloid and Interface Science 34, 171 (1970).
- Mason and Morrow [1986] G. Mason and N. Morrow, Meniscus displacement curvatures of a perfectly wetting liquid in capillary pore throats formed by spheres, Journal of Colloid and Interface Science 109, 46 (1986).
- Er et al. [2016] C. Er, Y. Li, J. Zhao, R. Wang, and Z. Wei, Characteristics of lacustrine organic-rich shale: A case study of the chang 7 member, triassic yanchang formation, ordos basin, china, Journal of Natural Gas Geoscience 1, 173 (2016).
- Satter and Iqbal [2016] A. Satter and G. M. Iqbal, 12 - determination of oil and gas in place: conventional and unconventional reservoirs, in Reservoir Engineering, edited by A. Satter and G. M. Iqbal (Gulf Professional Publishing, Boston, 2016) pp. 195–210.
- Yu et al. [2014] W. Yu, H. Lashgari, K. Sepehrnoori, et al., Simulation study of co2 huff-n-puff process in bakken tight oil reservoirs, in SPE Western North American and Rocky Mountain Joint Meeting (Society of Petroleum Engineers, 2014).
- Arab et al. [2020] D. Arab, A. Kantzas, and S. L. Bryant, Water flooding of oil reservoirs: Effect of oil viscosity and injection velocity on the interplay between capillary and viscous forces, Journal of Petroleum Science and Engineering 186, 106691 (2020).
- Iglauer et al. [2010] S. Iglauer, S. Favretto, G. Spinelli, G. Schena, and M. J. Blunt, X-ray tomography measurements of power-law cluster size distributions for the nonwetting phase in sandstones, Physical Review E 82, 056315 (2010).
- Iglauer et al. [2012] S. Iglauer, M. Fernø, P. Shearing, and M. Blunt, Comparison of residual oil cluster size distribution, morphology and saturation in oil-wet and water-wet sandstone, Journal of Colloid and Interface Science 375, 187 (2012).
- Georgiadis et al. [2013] A. Georgiadis, S. Berg, A. Makurat, G. Maitland, and H. Ott, Pore-scale micro-computed-tomography imaging: Nonwetting-phase cluster-size distribution during drainage and imbibition, Physical Review E 88, 033002 (2013).
- Wilkinson [1984] D. Wilkinson, Percolation model of immiscible displacement in the presence of buoyancy forces, Physical Review A 30, 520 (1984).
- Datta et al. [2014] S. S. Datta, T. Ramakrishnan, and D. A. Weitz, Mobilization of a trapped non-wetting fluid from a three-dimensional porous medium, Physics of Fluids 26, 022002 (2014).
- Krummel et al. [2013] A. T. Krummel, S. S. Datta, S. Münster, and D. A. Weitz, Visualizing multiphase flow and trapped fluid configurations in a model three-dimensional porous medium, AIChE Journal 59, 1022 (2013).
- Blunt [2017] M. J. Blunt, Multiphase flow in permeable media: A pore-scale perspective (Cambridge University Press, 2017).
- Philipse and Pathmamanoharan [1993] A. P. Philipse and C. Pathmamanoharan, Liquid permeation (and sedimentation) of dense colloidal hard-sphere packings, Journal of Colloid and Interface Science 159, 96 (1993).
- Sorbie et al. [1995] K. Sorbie, Y. Wu, and S. McDougall, The extended washburn equation and its application to the oil/water pore doublet problem, Journal of Colloid and Interface Science 174, 289 (1995).
- Rabideau and Miller [1994] A. J. Rabideau and C. T. Miller, Two-dimensional modeling of aquifer remediation influenced by sorption nonequilibrium and hydraulic conductivity heterogeneity, Water Resources Research 30, 1457 (1994).
- Ingham [2010] J. Ingham, Geomaterials under the microscope: A colour guide (CRC Press, 2010).
- Tanino and Blunt [2012] Y. Tanino and M. J. Blunt, Capillary trapping in sandstones and carbonates: Dependence on pore structure, Water Resources Research 48 (2012).
- Elnashar [2005] E. Elnashar, Volume porosity and permeability in double-layer woven fabrics, AUTEX Research Journal 5, 207 (2005).
- Adams and Rebenfeld [1991] K. L. Adams and L. Rebenfeld, Permeability characteristics of multilayer fiber reinforcements. part i: Experimental observations, Polymer Composites 12, 179 (1991).
- Ahn et al. [1991] K. Ahn, J. Seferis, and J. Berg, Simultaneous measurements of permeability and capillary pressure of thermosetting matrices in woven fabric reinforcements, Polymer Composites 12, 146 (1991).
- Martinez et al. [2008] A. W. Martinez, S. T. Phillips, and G. M. Whitesides, Three-dimensional microfluidic devices fabricated in layered paper and tape, Proceedings of the National Academy of Sciences 105, 19606 (2008).
- Conn et al. [2014] C. A. Conn, K. Ma, G. J. Hirasaki, and S. L. Biswal, Visualizing oil displacement with foam in a microfluidic device with permeability contrast, Lab on a Chip 14, 3968 (2014).
- Jang and Song [2015] I. Jang and S. Song, Facile and precise flow control for a paper-based microfluidic device through varying paper permeability, Lab on a Chip 15, 3405 (2015).