The discovery of the largest gas filament in our Galaxy, or a new spiral arm?
Abstract
Using the Five-hundred-meter Aperture Spherical radio Telescope (FAST), we detect a giant H I filamentary structure in the sky region of 3077 3110 and 409 434. The structure has a velocity range of 170 km s-1 to 130 km s-1, and a mean velocity of 150 km s-1, putting it to a Galactocentric distance of 22 kpc. The H I structure has a length of 1.1 kpc, which appears to be so far the furthest and largest giant filament in the Galaxy and we name it Cattail. Its mass is calculated to be 6.5 104 M⊙ and the linear mass density is 60 M⊙ pc-1. Its width is 207 pc, corresponding to an aspect ratio of 5:1. Cattail possesses a small velocity gradient (0.02 km s-1 pc-1) along its major axis. Together with the HI4PI data, we find that Cattail could have an even larger length, up to 5 kpc. We also identify another new elongated structure to be the extension into the Galactic first quadrant of the Outer Scutum-Centaurus (OSC) arm, and Cattail appears to be located far behind the OSC. The question about how such a huge filament is produced at the extreme Galactic location remains open. Alternatively, Cattail might be part of a new arm beyond the OSC, though it is puzzling that the structure does not fully follow the warp of the Galactic disk.
1 Introduction
It has been realized that filaments are one of the basic structures in the interstellar medium (ISM) (Myers, 2009; André et al., 2014). With high spatial resolutions and sensitivities in the sub-millimeter regime, Herschel observations reveal the ubiquitous presence of filaments in the dense parts of molecular clouds, which are also most closely related to star formation (André et al., 2010; Men’shchikov et al., 2010; Schneider et al., 2012, 2013; Gong et al., 2018; Zhang et al., 2019). The largest elongated molecular cloud structures are called giant (molecular) filaments with lengths greater than 10 pc. Jackson et al. (2010) have identified an archetype giant filament “Nessie” with an extreme aspect ratio (80 pc 0.5 pc) and claimed the dense cores within it to be the birthplaces of massive stars. Goodman et al. (2014) claimed that Nessie has a much larger length of 430 pc and referred it as the “bone” of the Scutum-Centaurus arm. After Nessie, a large number of observational studies aimed at identifying and characterizing giant filaments have been performed in various tracers, ranging from extinction maps at mid-infrared (Ragan et al., 2014; Zucker et al., 2015) to far-infrared/submillimeter dust emission (Wang et al., 2015; Abreu-Vicente et al., 2016) and CO line emissions (Su et al., 2015; Xiong et al., 2017; Li et al., 2018a, 2020).
Zucker et al. (2018) have performed a comprehensive analysis of the physical properties of large-scale filaments in the literature. Possibly related to the mechanisms shaping the structure and dynamics of the Milky Way (Smith et al., 2014a), together with the spatial resolution and sensitivity limitations of the observations, no giant filament is found in the Extreme Outer Galaxy (EOG) where the Galactocentric distance (Rgc) is greater than 15 kpc. 85% of giant filaments lie mostly parallel to ( 45∘), and in close proximity to ( 30 pc), the Galactic plane. There are 30%-45% of giant filaments being associated with spiral arms. The lengths of the giant filaments range from 11 pc to 269 pc and the furthest filament is located at Rgc12 kpc, well within the most remote spiral arms (Rgc20 kpc) (Dame & Thaddeus, 2011; Sun et al., 2015; Reid et al., 2016) and the furthest molecular clouds (Rgc30 kpc) (Digel et al., 1994; Matsuo et al., 2017).
Compared to giant molecular filaments, H I filaments are not well studied. Using the large-scale H I surveys GASS (McClure-Griffiths et al., 2009) and THOR (Beuther et al., 2016; Wang et al., 2020), Kalberla et al. (2016) and Soler et al. (2020) systemically searched for H I filaments in the Galaxy, respectively. Most of the H I filaments are aligned with the Galactic plane, which is similar to the situation of giant molecular filaments. Combined with the Planck all-sky map of the linearly polarized dust emission at 353 GHz, Kalberla et al. (2016) found that H I filaments tend to be associated with dust ridges and aligned with magnetic fields. They claim that the cold neutral medium (CNM) is mostly organized in sheets and they are observed as filaments due to the projection effects. The H I filaments are normally cold with a typical excitation temperature Tex50 K and often associated with CO dark molecular gas (Kalberla et al., 2020). However, detailed physical properties of H I filaments, as well as their distribution in the Galaxy, are not well characterized. A specific case is presented in Soler et al. (2020): using the 40 resolution observations in the THOR survey, they identified a very long H I filament “Magdalena” in the inner Galaxy (Rgc12 kpc) with the length exceeding 1 kpc (see Figure 9 in their paper).
In this work we present Five-hundred-meter Aperture Spherical radio Telescope (FAST) observations of a newly detected giant filamentary H I structure “Cattail”, which is possibly the furthest (Rgc22 kpc) and largest (1.1 kpc) filament to date. Together with the archival HI4PI data, we find that Cattail could have an even much larger length of 5 kpc. A new extension of the Outer Scutum-Centaurus (OSC) arm between 70∘ 100∘ is also identified. The observations are described in Section 2 and the results and discussion are presented in Section 3.
2 Observation and data reduction
2.1 FAST Data
Using the FAST, the sky region of Right Ascension of 3077 3110 and Declination of 409 434 was observed on 2019 August 24. The observations of H I 1420.4058 MHz transition were carried out with the 19-beam L band receiver (Li et al., 2018b). The ROACH back-end contains 65536 channels in 32 MHz bandwidth, corresponding to a channel resolution of 0.476 kHz and a velocity resolution of 0.1 km s-1 at 1.420 GHz. The sky region was scanned along the Right Ascension in multibeam On-the-fly (OTF) mode with a scanning rate of 15 per second and a dump time of 1 s. The rotating angle, which represents the cross angle between the 19-beam focal plan array and line of Declination, is set to be 23.4 degrees for smooth super-Nyquist sampling.
During the observations, a 1.1 K noise from the diode was injected with a period of 2 s, which is synchronized with the sampling rate. Based on an absolute measurement of noise dipole and a factor derived by the difference between noise ON and OFF data for each beam, the observed data were calibrated into antenna temperature TA in K. Taking the beam width (Full Width at Half Maximum; FWHM) and aperture efficiency from Jiang et al. (2020), we convert the antenna temperature (TA) into brightness temperature (TB). The aperture efficiency curves were obtained by repeating observations of the calibrator 3C286 at different zenith angles.
Using a Gaussian smoothing kernel, the raw data are re-grided and converted to FITS data cube. The beam width is 3 and the pixel size of the FITS data cube is 1 1. The typical system temperature during the observation is about 20 K and the RMS sensitivity of our observation is estimated to be around 70 mK per channel. The pointing of the telescope has an RMS accuracy of 79. We have compared the results of our data reduction with those of HI4PI (HI4PI Collaboration et al., 2016), the HI4PI and FAST H I emission profiles agree well with each other and the spectra LSR velocities are consistent.
2.2 HI4PI Data
This work makes use of data from all-sky (4 sr) H I survey (HI4PI Collaboration et al., 2016). The HI4PI survey combines H I data of the Northern hemisphere from EBHIS (Kerp et al., 2011; Winkel et al., 2016) obtained with the 100-m Effelsberg radio telescope with the data of the Southern hemisphere from GASS (McClure-Griffiths et al., 2009; Kalberla et al., 2010; Kalberla & Haud, 2015) taken with the 64-m Parkes radio telescope. The angular and velocity resolutions of the final combined data are 162 and 1.5 km s-1, respectively. The RMS sensitivity of HI4PI H I data is about 43 mK. The LSR velocity coverage is about 600 km s-1 in the Northern hemisphere and 480 km s-1 in the Southern hemisphere.
3 Results and discussion
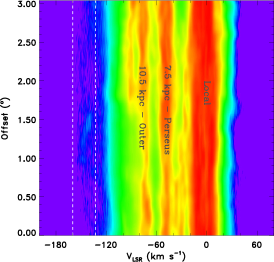
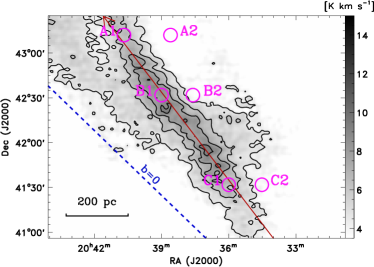
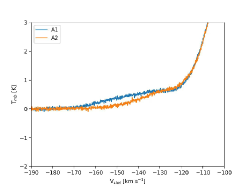
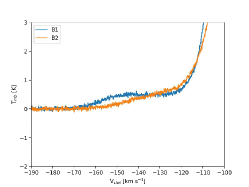
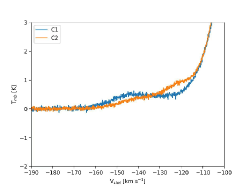
The sky region of 20h30m48s RA 20h44m04s and 409 Dec 434 covers the main part of the Cygnus-X North molecular cloud, which has a velocity range of 30 km s-1 to 20 km s-1 (Schneider et al., 2010) and is located 1.4 kpc away from the Sun (Rygl et al., 2012; Xu et al., 2013). In Figure 1, however, there remains abundant atomic gas with velocities 30 km s-1, implying the presence of H I gas far behind Cygnus-X. In the velocity range 170 km s-1 to 130 km s-1, there appears to be H I emission not connected to the main velocity components of the Outer arm. The central velocity of the outermost gas is 151.1 km s-1. According to the rotation model of Reid et al. (2014, 2016), the heliocentric distance of such an H I cloud is 21 kpc, corresponding to the distance from the Galactic center of 22 kpc. The outermost cloud exhibits a filamentary structure and lies approximately parallel to the Galactic mid-plane (b=0, right panel of Figure 1). Its length is about 1.1 kpc, much larger than the giant molecular filament Nessie, and well comparable with the large H I filament Magdalena. If the structure lies at the kinematic distance, it is located far beyond all known giant gas filaments (Rgc12 kpc), molecular and atomic, in the previous researches (Zucker et al., 2018). Here we name it “Cattail”. Figure 2 presents the spectra of six positions located within (A1, B1, C1) and immediately outside of Cattail (A2, B2, C2). Compared to A2, B2, C2, the spectra of Cattail (A1, B1, C1) have an additional emission from 170 to 130 km s-1. There is no self-absorption feature in the spectra.
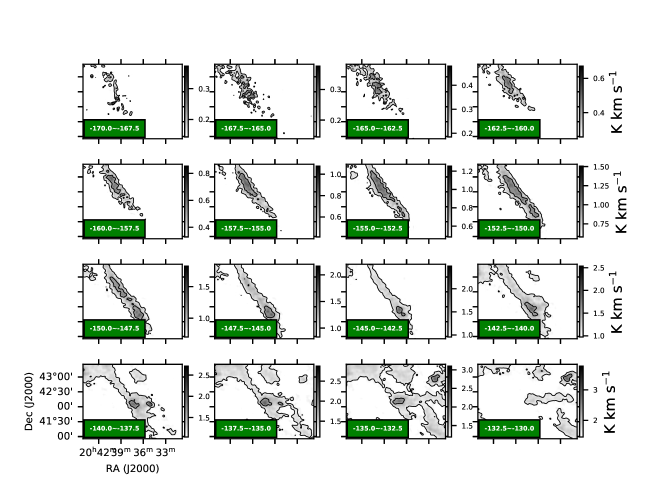
Figure 3 shows the velocity channel map in H I 21-cm emission of Cattail. It can be seen that the filament exhibits an overall velocity gradient along its major axis. The southwest end of Cattail has a less negative velocity compared to that of the northeast end. Most of the atomic gas of the filament has velocities in the range from 160 km s-1 to 140 km s-1, with the mean velocity of approximately 150 km s-1. The intensity distribution and the width of the filament are almost uniform from northeast to southwest. The velocity gradient along the filament is estimated to be 0.02 km s-1 pc-1.
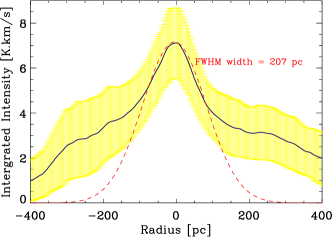
Similar to Suri et al. (2019), we extract the radial profile of Cattail from the intensity map. Firstly, we derive the direction of the filament spine, which is indicated by a red arrow in the right panel of Figure 1. Then, we extract the perpendicular intensity profile for each pixel along the filament spine. Finally, we average the profiles of all pixels along the filament and apply Gaussian fitting to the mean radial profile. In addition to the emission of Cattail, there is residual emission in the sky region which comes from the velocity distribution of the closer arms (Figure 2). In this case, the calculated width would increase with the fitting range (Smith et al., 2014b; Panopoulou et al., 2017). To be less influenced by this bias, we apply Gaussian fitting to the inner part of the radial profile. The intensity radial profile of Cattail is almost symmetrical (Figure 4). The width (FWHM) of the filament is 207 pc, which means that the aspect ratio of Cattail is about 5:1. Given that the width is comparable to the scale height of gas in a spiral arm (Kalberla & Kerp, 2009), Cattail could also be a density enhancement along a spiral arm, we will come back to this point later.
Considering that the peak antenna temperature is about 1 K (Figure 2) and there is no H I narrow self-absorption feature in the spectra (see Figure 2), the emission should be optically thin and the column density can be calculated according to the following formula (Wilson et al., 2009)
| (1) |
We calculated the mass of Cattail to be 6.5 104 M⊙. The linear mass density is 60 M⊙ pc-1. The peak column density of Cattail is 1.7 1019 cm-2 (0.1 M⊙ pc-2), which is close to the median value of H I filaments with latitudes b 20∘ (Kalberla et al., 2016) and lower than the threshold (N 1 1022 cm-2) for high column density gas adopted by Zucker et al. (2018). Assuming the depth to be the same as the width (207 pc), the peak volume density of the filament is calculated to be 0.03 cm-3, which is close to the average Galactic mid-plane volume density at =22 kpc (0.01 cm-3) (Kalberla & Kerp, 2009). The physical parameters of Cattail are listed in Table 1.
Both simulations (Inutsuka & Miyama, 1992, 1997) and observations (André et al., 2010; Men’shchikov et al., 2010; Schneider et al., 2012, 2013) have shown that filaments tend to be unstable to radial collapse if the line mass is greater than the critical value defined as (Fiege & Pudritz, 2000). The total velocity dispersion can be obtained by the FWHM line width (), which is 12 km s-1 for Cattail. H I filaments are normally cold with a typical excitation temperature Tex50 K (Kalberla et al., 2020), corresponding to an isothermal sound speed of approximately 0.65 km s-1. Therefore, the turbulence may be supersonic in Cattail. The critical line mass Mvir is calculated to be 1.1 104 pc-1, which is much larger than the linear mass density Mline (60 M⊙ pc-1). Thus, Cattail is gravitationally unbound and may be in an expanding state, unless confined by an external pressure (Fischera & Martin, 2012).
| parameter | value |
|---|---|
| Galactic longitude: l | 8149 |
| Galactic latitude: b | 065 |
| Right ascension: J2000 | 20h37m54s |
| Declination: J2000 | +42d14m40s |
| Center velocity: | 151.1 km/s |
| Kinematic distance: D | 21 kpc |
| Galactocentric radius: Rgc | 22 kpc |
| Length | 1.1 kpc |
| Width (FWHM) | 207 pc |
| Aspect ratio | 5:1 |
| Mass | 6.5 104 M⊙ |
| Linear Mass | 60 M⊙ pc-1 |
| Line width: | 12 km/s |
| Peak column density | 1.7 1019 cm-2 (0.1 M⊙ pc-2) |
| Peak volume density | 0.03 cm-3 |
Note. — Rows 1-5 give the central positions in the PPV space. The kinematic distance is derived according to the Galactic rotation model A5 of Reid et al. (2014). The volume density is defined as NHI/depth, where depth is assumed to be the same as width.
A velocity range of 90 km s-1 is generally used to separate high-velocity clouds (HVC) from gas at low and intermediate velocities. However, this operational definition is insufficient considering that the velocities of some clouds can be well understood in terms of Galactic rotation but exceed 90 km s-1 (Reid et al., 2016). Similarly with Wakker (1991), we adopt a “forbidden velocity” of 50 km s-1 to identify HVCs, where is the rotation curve of the Milky Way. In the direction of Cattail, the filament can be a HVC only when its heliocentric distance is within 12.5 kpc (R kpc). However, the Galactic Latitude of Cattail is 065, which would put it within the flaring FWHM of the disk when R kpc (Kalberla & Kerp, 2009). As HVCs travel through hot halo gas, they would be heated and photon ionized, which causes thermal instabilities between the skin and the inner region of the clouds (Putman et al., 2012). Moreover, the headwind pressures can induce dynamical instabilities, e.g., shear-driven disturbance in HVCs, which makes them fragment into head-tail clouds (Butler Burton et al., 2004) and increase their line widths (Putman et al., 2011). The H I 21-cm line width of Cattail is 12 km s-1, significantly smaller than the typical value of 20-30 km s-1 for HVCs (Lockman, 2003; Tumlinson et al., 2017; Barger et al., 2020). The cloud does not seem to be fragmenting. Also, Cattail has a filamentary morphology parallel to the Galactic mid-plane with a mass less than 105 M⊙, and if it is a HVC, it would have been fully ionized during passing through the Galaxy halo (Bland-Hawthorn et al., 2007; Heitsch & Putman, 2009; Kwak et al., 2011). Therefore, the properties of Cattail do not appear to be compatible with that of a HVC.
Assuming that the velocity of Cattail is attributed to the Galactic rotation, the structure is located beyond all the known spiral arms in the first quadrant. We then examine other possible origins of the extreme velocity of the Cattail. We have discussed above that Cattail does not seem to be an HVC. Combining the results of Anderson et al. (2014); Green (2014), there are no SNRs or H II regions with regular sizes 25 near Cattail. There is no dwarf satellite galaxy near Cattail either (McConnachie, 2012). Hence, there is no evidence for Cattail’s velocity coming from the influences of stellar feedback or a tidal stream, and the most likely explanation is the Galactic rotation. Moreover, taking the column density and the depth of Cattail to be 1.7 1019 cm-2 and 05, respectively, the volume density of Cattail would be significantly lower than the typical value of the Milky Way when it is located at Rgc 15 kpc (Kalberla & Kerp, 2009). Both a filament and a spiral arm should have a large density contrast compared to the surrounding medium. Therefore, we consider that Cattail is located at a heliocentric distance and Galactocentric distance of both 20 kpc.
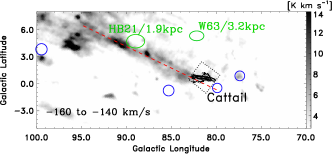
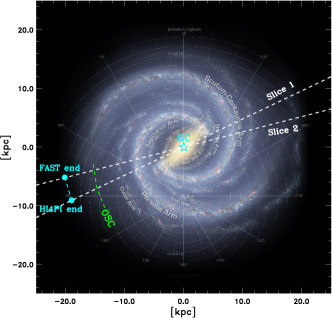
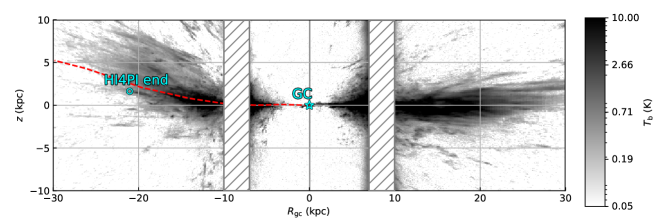
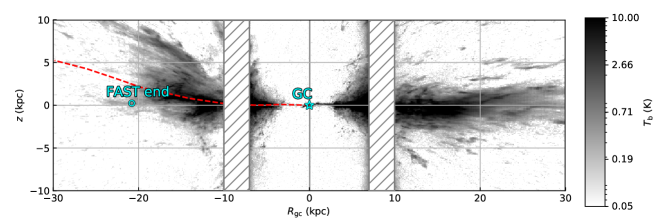
Using the HI4PI data, we have investigated the complete morphology of Cattail (Figure 5). Cattail exhibits an even much larger dimension while retaining a coherent velocity of 160 km s-1 to 140 km s-1. The FAST observations cover the southwest end of the full structure while the northeast end is located at about 93∘ and 55. We designate them as the FAST end and HI4PI end in this work, respectively. The full length of the complete Cattail reachs 15∘ (5 kpc).
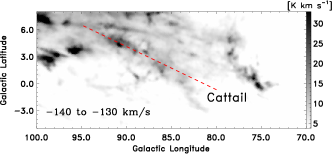
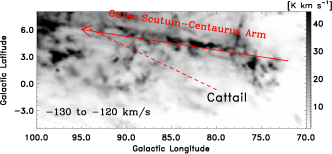
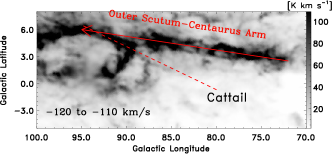
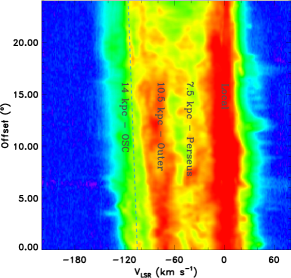
In the velocity range from 130 km s-1 to 110 km s-1, there is another new elongated structure between 70∘ 100∘. From its morphology (Figure 5) and velocity (Figure 6), it is apparently the extension of the OSC arm previously only seen at 0∘ 70∘ (Dame & Thaddeus, 2011). The full structure of the OSC in the first Galactic quadrant is then seen for the first time. In projection, Cattail is connected to the OSC at about . However, Cattail does not appear to be physically connected to the OSC arm. First, the velocity of Cattail is different from that of the OSC by 30 km s-1. Second, if Cattail is connected to the OSC at a Galactic Longitude of about and extends to about , it means that Cattail joins the OSC arm at the downstream end with respect to the Galactic rotation and leaves the arm toward the upstream end, i.e., in a pattern opposite to the inertial direction of the Galactic rotation; such a structure is inconsistent with the picture of a spur originating from a spiral arm (e.g., Dobbs & Bonnell, 2006). Thus, combining the large scale map of HI4PI, Cattail may have a much larger dimension but still appears to be located well above the OSC.
Based on the above analysis, we suggest two possible explanations for Cattail: it is a giant filament with a length of 5 kpc, or part of a new arm in the EOG (Figure 7). Only until recently, simulations of giant filaments appeared in the literature. As the numerical simulations show, the shear from Galactic rotation plays a critical role in the formation of large-scale filaments (Smith et al., 2014a; Duarte-Cabral & Dobbs, 2016). Since the shearing motion tends to stretch out and align gas with spiral arms, giant filaments tend to form in spiral arms and interarm regions. Unlike most of the giant molecular filaments which are associated with spiral arms and lie within 30 pc from the physical Galactic mid-plane (Wang et al. 2016; Zucker et al. 2018), Cattail is far beyond the outermost arm OSC. Figure 7 shows that the Galactic disk is significantly warped in the first quadrant of the EOG, which is in line with the forecasts from Levine et al. (2006); Kalberla et al. (2007); Kalberla & Kerp (2009). The scale height of the HI4PI end is about 2 kpc, which approximates the warped scale of the physical Galactic mid-plane at that Galactocentric distance. Comparatively, the FAST end of Cattail is located at the Galactic Latitude of 065, corresponding to about 200 pc upon the IAU defined mid-plane (), which is flat from the Galactic center to the edge of the Galaxy. Thus, the complete Cattail may originate from the warped physical Galactic mid-plane at a longitude of and extend to a longitude of with 200 pc. If Cattail is a gas filament located beyond the OSC, how is such a huge structure formed? Alternatively, if Cattail is part of a new spiral arm in the EOG, it is also puzzling that the new arm does not fully follow the Galactic warp, given that the FAST end is about 1.8 kpc away from the warped Galactic disk mid-plane. While these questions remain open with the existing data, the observations provide new insights into our understanding of the Galactic structure.
4 Acknowledgements
This work is supported by National Key RD Program of China No. 2017YFA0402600 and the National Natural Science Foundation of China (NSFC) grant U1731237. C.L. acknowledges the supports by China Postdoctoral Science Foundation No. 2021M691532 and Jiangsu Postdoctoral Research Funding Program No. 2021K179B. Y.C. is partially supported by the Scholarship No. 201906190105 of the China Scholarship Council and the Predoctoral Program of the Smithsonian Astrophysical Observatory (SAO). We thank the referee for his/her thoughtful comments which improved this paper. We would like to thank the FAST staff for their supports during the observation and thank Junzhi Wang, Zhiyu Zhang, and Bing Liu for the helpful discussions on data reduction. This work makes use of publicly released data from the HI4PI survey which combines the EBHIS in the Northern hemisphere with the GASS in the Southern hemisphere. EBHIS is based on observations with the 100-m telescope of the MPIfR (Max-Planck-Institut fur Radioastronomie) at Effelsberg. The Parkes Radio Telescope is part of the Australia Telescope which is funded by the Commonwealth of Australia for operation as a National Facility managed by CSIRO.
References
- Abreu-Vicente et al. (2016) Abreu-Vicente, J., Ragan, S., Kainulainen, J., et al. 2016, A&A, 590, A131
- Anderson et al. (2014) Anderson, L. D., Bania, T. M., Balser, D. S., et al. 2014, ApJS, 212, 1
- André et al. (2014) André, P., Di Francesco, J., Ward-Thompson, D., et al. 2014, Protostars and Planets VI, 27
- André et al. (2010) André, P., Men’shchikov, A., Bontemps, S., et al. 2010, A&A, 518, L102
- Barger et al. (2020) Barger, K. A., Nidever, D. L., Huey-You, C., et al. 2020, ApJ, 902, 154
- Beuther et al. (2016) Beuther, H., Bihr, S., Rugel, M., et al. 2016, A&A, 595, A32
- Bland-Hawthorn et al. (2007) Bland-Hawthorn, J., Sutherland, R., Agertz, O., & Moore, B. 2007, ApJ, 670, L109
- Butler Burton et al. (2004) Butler Burton, W., Braun, R., & de Heij, V. 2004, Compact, Isolated High-Velocity Clouds, ed. H. van Woerden, B. P. Wakker, U. J. Schwarz, & K. S. de Boer, Vol. 312, 313
- Dame & Thaddeus (2011) Dame, T. M., & Thaddeus, P. 2011, ApJ, 734, L24
- Digel et al. (1994) Digel, S., de Geus, E., & Thaddeus, P. 1994, ApJ, 422, 92
- Dobbs & Bonnell (2006) Dobbs, C. L., & Bonnell, I. A. 2006, MNRAS, 367, 873
- Duarte-Cabral & Dobbs (2016) Duarte-Cabral, A., & Dobbs, C. L. 2016, MNRAS, 458, 3667
- Fiege & Pudritz (2000) Fiege, J. D., & Pudritz, R. E. 2000, MNRAS, 311, 85
- Fischera & Martin (2012) Fischera, J., & Martin, P. G. 2012, A&A, 542, A77
- Gong et al. (2018) Gong, Y., Li, G. X., Mao, R. Q., et al. 2018, A&A, 620, A62
- Goodman et al. (2014) Goodman, A. A., Alves, J., Beaumont, C. N., et al. 2014, ApJ, 797, 53
- Green (2014) Green, D. A. 2014, Bulletin of the Astronomical Society of India, 42, 47
- Heitsch & Putman (2009) Heitsch, F., & Putman, M. E. 2009, ApJ, 698, 1485
- HI4PI Collaboration et al. (2016) HI4PI Collaboration, Ben Bekhti, N., Flöer, L., et al. 2016, A&A, 594, A116
- Inutsuka & Miyama (1992) Inutsuka, S.-I., & Miyama, S. M. 1992, ApJ, 388, 392
- Inutsuka & Miyama (1997) Inutsuka, S.-i., & Miyama, S. M. 1997, ApJ, 480, 681
- Jackson et al. (2010) Jackson, J. M., Finn, S. C., Chambers, E. T., Rathborne, J. M., & Simon, R. 2010, ApJ, 719, L185
- Jiang et al. (2020) Jiang, P., Tang, N.-Y., Hou, L.-G., et al. 2020, Research in Astronomy and Astrophysics, 20, 064
- Kalberla et al. (2007) Kalberla, P. M. W., Dedes, L., Kerp, J., & Haud, U. 2007, A&A, 469, 511
- Kalberla & Haud (2015) Kalberla, P. M. W., & Haud, U. 2015, A&A, 578, A78
- Kalberla & Kerp (2009) Kalberla, P. M. W., & Kerp, J. 2009, ARA&A, 47, 27
- Kalberla et al. (2020) Kalberla, P. M. W., Kerp, J., & Haud, U. 2020, A&A, 639, A26
- Kalberla et al. (2016) Kalberla, P. M. W., Kerp, J., Haud, U., et al. 2016, ApJ, 821, 117
- Kalberla et al. (2010) Kalberla, P. M. W., McClure-Griffiths, N. M., Pisano, D. J., et al. 2010, A&A, 521, A17
- Kerp et al. (2011) Kerp, J., Winkel, B., Ben Bekhti, N., Flöer, L., & Kalberla, P. M. W. 2011, Astronomische Nachrichten, 332, 637
- Kwak et al. (2011) Kwak, K., Henley, D. B., & Shelton, R. L. 2011, ApJ, 739, 30
- Levine et al. (2006) Levine, E. S., Blitz, L., & Heiles, C. 2006, ApJ, 643, 881
- Li et al. (2018a) Li, C., Wang, H., Zhang, M., et al. 2018a, ApJS, 238, 10
- Li et al. (2020) Li, C., Wang, H., Zhang, M., Ma, Y., & Lin, L. 2020, ApJS, 249, 27
- Li et al. (2018b) Li, D., Wang, P., Qian, L., et al. 2018b, IEEE Microwave Magazine, 19, 112
- Lockman (2003) Lockman, F. J. 2003, ApJ, 591, L33
- Matsuo et al. (2017) Matsuo, M., Nakanishi, H., Minamidani, T., et al. 2017, PASJ, 69, L3
- McClure-Griffiths et al. (2009) McClure-Griffiths, N. M., Pisano, D. J., Calabretta, M. R., et al. 2009, ApJS, 181, 398
- McConnachie (2012) McConnachie, A. W. 2012, AJ, 144, 4
- Men’shchikov et al. (2010) Men’shchikov, A., André, P., Didelon, P., et al. 2010, A&A, 518, L103
- Myers (2009) Myers, P. C. 2009, ApJ, 700, 1609
- Panopoulou et al. (2017) Panopoulou, G. V., Psaradaki, I., Skalidis, R., Tassis, K., & Andrews, J. J. 2017, MNRAS, 466, 2529
- Putman et al. (2012) Putman, M. E., Peek, J. E. G., & Joung, M. R. 2012, ARA&A, 50, 491
- Putman et al. (2011) Putman, M. E., Saul, D. R., & Mets, E. 2011, MNRAS, 418, 1575
- Ragan et al. (2014) Ragan, S. E., Henning, T., Tackenberg, J., et al. 2014, A&A, 568, A73
- Reid et al. (2016) Reid, M. J., Dame, T. M., Menten, K. M., & Brunthaler, A. 2016, ApJ, 823, 77
- Reid et al. (2014) Reid, M. J., Menten, K. M., Brunthaler, A., et al. 2014, ApJ, 783, 130
- Rygl et al. (2012) Rygl, K. L. J., Brunthaler, A., Sanna, A., et al. 2012, A&A, 539, A79
- Schneider et al. (2010) Schneider, N., Csengeri, T., Bontemps, S., et al. 2010, A&A, 520, A49
- Schneider et al. (2012) Schneider, N., Csengeri, T., Hennemann, M., et al. 2012, A&A, 540, L11
- Schneider et al. (2013) —. 2013, A&A, 551, C1
- Smith et al. (2014a) Smith, R. J., Glover, S. C. O., Clark, P. C., Klessen, R. S., & Springel, V. 2014a, MNRAS, 441, 1628
- Smith et al. (2014b) Smith, R. J., Glover, S. C. O., & Klessen, R. S. 2014b, MNRAS, 445, 2900
- Soler et al. (2020) Soler, J. D., Beuther, H., Syed, J., et al. 2020, A&A, 642, A163
- Su et al. (2015) Su, Y., Zhang, S., Shao, X., & Yang, J. 2015, ApJ, 811, 134
- Sun et al. (2015) Sun, Y., Xu, Y., Yang, J., et al. 2015, ApJ, 798, L27
- Suri et al. (2019) Suri, S., Sánchez-Monge, Á., Schilke, P., et al. 2019, A&A, 623, A142
- Tumlinson et al. (2017) Tumlinson, J., Peeples, M. S., & Werk, J. K. 2017, ARA&A, 55, 389
- Wakker (1991) Wakker, B. P. 1991, A&A, 250, 499
- Wang et al. (2015) Wang, K., Testi, L., Ginsburg, A., et al. 2015, MNRAS, 450, 4043
- Wang et al. (2020) Wang, Y., Beuther, H., Rugel, M. R., et al. 2020, A&A, 634, A83
- Wilson et al. (2009) Wilson, T. L., Rohlfs, K., & Hüttemeister, S. 2009, Tools of Radio Astronomy
- Winkel et al. (2016) Winkel, B., Kerp, J., Flöer, L., et al. 2016, A&A, 585, A41
- Xiong et al. (2017) Xiong, F., Chen, X., Yang, J., et al. 2017, ApJ, 838, 49
- Xu et al. (2013) Xu, Y., Li, J. J., Reid, M. J., et al. 2013, ApJ, 769, 15
- Zhang et al. (2019) Zhang, M., Kainulainen, J., Mattern, M., Fang, M., & Henning, T. 2019, A&A, 622, A52
- Zucker et al. (2015) Zucker, C., Battersby, C., & Goodman, A. 2015, ApJ, 815, 23
- Zucker et al. (2018) —. 2018, ApJ, 864, 153