Pressure-induced ferromagnetism in the topological semimetal EuCd2As2
Abstract
The antiferromagnet and semimetal EuCd2As2 has recently attracted a lot of attention due to a wealth of topological phases arising from the interplay of topology and magnetism. In particular, the presence of a single pair of Weyl points is predicted for a ferromagnetic configuration of Eu spins along the -axis in EuCd2As2. In the search for such phases, we investigate here the effects of hydrostatic pressure in EuCd2As2. For that, we present specific heat, transport and SR measurements under hydrostatic pressure up to GPa, combined with ab initio density functional theory (DFT) calculations. Experimentally, we establish that the ground state of EuCd2As2 changes from in-plane antiferromagnetic (AFMab) to ferromagnetic at a critical pressure of 2 GPa, which is likely characterized by the moments dominantly lying within the plane (FMab). The AFMab-FMab transition at such a relatively low pressure is supported by our DFT calculations. Furthermore, our experimental and theoretical results indicate that EuCd2As2 moves closer to the sought-for FMc state (moments ) with increasing pressure further. We predict that a pressure of 23 GPa will stabilize the FMc state, if Eu remains in a 2+ valence state. Thus, our work establishes hydrostatic pressure as a key tuning parameter that (i) allows for a continuous tuning between magnetic ground states in a single sample of EuCd2As2 and (ii) enables the exploration of the interplay between magnetism and topology and thereby motivates a series of future experiments on this magnetic Weyl semimetal.
pacs:
xxxI Introduction
Topological materials have been at the center of many research activities in recent years due to the presence of a plethora of exotic phenomena, of relevance not only from a fundamental perspective 1 but for applications 2, 3, 4, 5, 6 as well. In this context, Weyl semimetals 3, 7, 4 have emerged as particularly multifaceted realizations of topological materials displaying anomalous transport phenomena, including the anomalous Hall effect, 8, 9 negative longitudinal magnetoresistance 10 and non-local transport 11.
A Weyl semimetal can be created from a Dirac semimetal by breaking either inversion symmetry 12 or time reversal symmetry 3, 7, 4, 13. Thus, Weyl nodes can only be found either in non-centrosymmetric crystals or in magnetic materials, providing a seemingly straight-forward path to identify new Weyl semimetals. However, in real materials, the observation of the intriguing features of Weyl physics is often complicated 14, 15 by (i) additional non-topological Fermi surface pockets and (ii) the occurrence of multiple Weyl nodes. To overcome the latter issue, research is recently focussing on magnetic systems, since the breaking of time-reversal symmetry allows, in principle, the realization of a single pair of Weyl nodes 7, which, in the presence of inversion symmetry, have to be located at the same energy. In contrast, when the crystal structure breaks inversion symmetry, the minimal number of Weyl nodes is 4, although often is found to be higher, such as 24 in the TaAs structural family of compounds 3, 16, 17.
Whereas several magnetic Weyl semimetals were proposed and studied experimentally 18, 19, 20, 21, 22, 23, there is a continuing interest in identifying new candidate materials, which display unambiguous signatures of Weyl physics, free from the above-mentioned complexities. Surveys of space groups 24 and band structure calculations 25 have conditionally identified EuCd2As2 (centrosymmetric space group 1 26) as a candidate for magnetic Weyl semimetal if it orders ferromagnetically (FM) with the moments parallel to the axis. In such a FM state, EuCd2As2 would show the minimal number of Weyl nodes in close proximity to the Fermi level without any further manipulation, such as the application of magnetic field.
However, experimental studies indicate that the Eu spins in EuCd2As2 order antiferromagnetically (AFM) at ambient pressure below K 27, 28. Although controversially discussed, most papers refer to the AFM structure as the A-type, i.e., FM layers which stack in an AFM fashion along the axis, with the moment direction confined in the plane 28, 29. Albeit this order breaks the in-plane three-fold symmetry and thus hinders the formation of Weyl nodes, there are several experimental observations that indicate that Weyl physics can manifest itself in EuCd2As2 due to the proximity to ferromagnetism. Among those are, e.g., the report of a single pair of Weyl nodes in EuCd2As2 in the polarized state that is stabilized by very moderate magnetic fields 29, as well as the claim of Weyl nodes in the paramagnetic state whose presence was attributed to quasi-static and quasi-long range ferromagnetic fluctuations 30. Overall, these results underline that EuCd2As2 is a promising host for investigations of the interplay of topology and magnetism 31. This notion has been further supported by transport measurements at temperatures around the antiferromagnetic transition 32.
Actually, it was recently shown that small differences in the synthesis procedure of this compound can result in samples of EuCd2As2 with FM order and moments lying in the plane 33, 34, 35. Whereas this explicitly demonstrates that a FM state in EuCd2As2 is very close (in some compositional space) to the AFM one, and suggests a high degree of tunability of the magnetic properties of EuCd2As2, this also can cause severe complications in comparing published results on different crystals grown via different routes.
Here, we report the effect of hydrostatic pressure, , up to 2.5 GPa on the magnetic properties of AFM EuCd2As2 by presenting specific heat, transport and SR measurements, combined with DFT calculations of total energies of different magnetic configurations up to 25 GPa. Our experiments unambiguously identify a transition to an order with a pronounced FM component, which we refer to as FM order hereafter, at GPa. This FM order is likely characterized by an in-plane orientation of the magnetic moments, as supported by our DFT calculations. Further, our calculations predict a change of the moment orientation at 23 GPa to an out-of-plane configuration, which is the required ground state for realizing a single pair of Weyl nodes in this material. Our results therefore clearly identify pressure as an experimental tuning parameter that allows for studies of the correlation of the topological properties of EuCd2As2 with a change of its magnetic ground state in a single sample.
The paper is organized as follows. Section II summarizes the experimental settings and theoretical methods used in this work. In Section III, we discuss our results, starting with a discussion of experimental phase diagram (Sec. III.1, followed by a presentation of our SR data (Sec. III.2) and anisotropic magnetoresistance data (Sec. III.3) and concluded by a discussion of our results from DFT calculations (Sec. III.4). Finally in Section IV, we present our conclusions and an outlook.
II Methods
Single crystals of EuCd2As2 were grown out of Sn flux with the following procedure; The elements with an initial stoichiometry of Eu:Cd:As:Sn = 1:2:2:10 were put into a fritted alumina crucible 36 (sold by LSP Ceramics as a Canfield Crucible Set 37) and sealed in fused silica tube under a partial pressure of argon. The thus prepared ampoule was heated up to 900∘C over 24 hours, and held there for 20 hours. This was followed by a slow cooling to 550∘C over 200 hours, and decanting of the excess flux using a centrifuge 38. The crystals were characterized by the means of powder x-ray diffraction as well as magnetic measurements. The latter measurements confirmed that these crystals undergo an AFM transition33 at K.
Specific heat under pressure was measured on a single crystal using the AC calorimetry technique, as described in detail in Ref. [39]. Resistance under pressure was measured in a four-point configuration. Contacts were made using Epo-tek H20E silver epoxy. Unfortunately, despite using different contact materials and routes of surface preparation, it was not possible to get two-point resistances smaller than several tens of Ohms. Given that we are mostly interested in tracking anomalies in the temperature- and field dependence of , which we carefully measure by reducing the measurement current, we refrain from correcting the presented transport data for geometrical factors. For specific heat as well as transport measurements, the cryogenic environment was provided by a Quantum Design Physical Property Measurement System. Pressure was generated in a piston-cylinder double-wall pressure cell with the outer cylinder made out of CuBe and the inner cylinder out of Ni-Cr-Al alloy (see Ref. [40] for a very similar design). A mixture of 4:6 light mineral oil:n-pentane was used as a pressure-transmitting medium. This medium solidifies at GPa at room temperature41, thus ensuring hydrostatic pressure application over the available pressure range. Pressure at low temperatures was determined from the shift of the superconducting transition temperature of elemental lead (Pb)42.
SR measurements under pressure were performed in a 3He cryostat at the E1 beamline at the Paul-Scherrer-Institute in Villigen, Switzerland, by using the GPD spectrometer. Typically, positron events were counted for each data point. A large number of single crystals of total mass of g were placed inside a pressure cell with arbitrary orientations. Both, the inner and the outer cylinder of the pressure cell are made out of MP35N alloy43. Daphne 7373 oil was used as a pressure-transmitting medium, which solidifies at room temperature close to 2.5 GPa41. The pressure at low temperatures was determined from the shift of the superconducting transition of elemental indium44, which was also placed in the pressure cell and measured in an independent ac susceptibility experiment.
Total energies for EuCd2As2 with various Eu spin configurations were calculated in DFT 45, 46 including spin-orbit coupling (SOC) with the Perdew–Burke–Ernzerhof (PBE) exchange-correlation functional 47. We employed a plane-wave basis set and projector augmented wave (PAW) 48, 49 method as implemented in VASP 50, 51, 52. To account for the half-filled strongly localized Eu 4f orbitals, a Hubbard-like parameter of 4.4 eV was used which places the f-states in the region of -0.8 eV to -1.4 eV, as observed experimentally in photoemission experiments 30. The analysis of the magnetism as a function of pressure was done by performing equation of state (EOS) calculations of both A-type antiferromagnetic and in-plane ferromagnetic EuCd2As2 with the primitive hexagonal unit cell doubled along the c-axis (Note that the energies of different moment directions in the plane were so close that differences could not be resolved within DFT). The corresponding reciprocal lattice was sampled on a -centered Monkhorst-Pack 53 (11113) k-point mesh with a Gaussian smearing of 0.05 eV. We used a kinetic energy cutoff of 318 eV to relax the shape of the unit cell and atomic positions at selected volumes until the absolute force on each atom is below 0.01 eV/Å. Specifically for obtaining the crystalline magneto-anisotropy calculations, we increased the -point mesh to (), the kinetic energy cutoff was set to 500 eV and the absolute force threshold was set to 0.001 eV/Å per atom. In Appendix VI.4 we present a discussion on the effects that the choice of initial settings in the DFT calculations have on the final relaxed structures.
III Results and Discussion
III.1 Zero-field temperature-pressure phase diagram
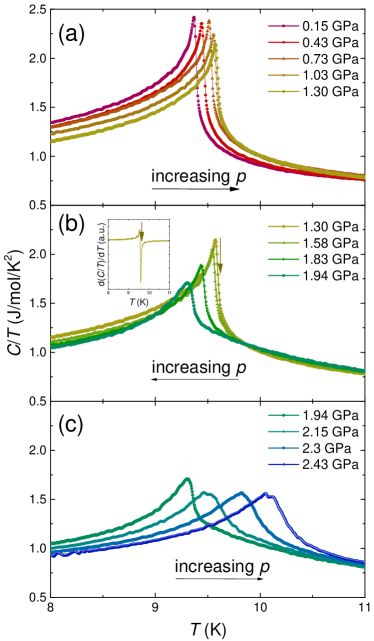
First, we discuss our determination of the temperature-pressure phase diagram of EuCd2As2 in zero field from specific heat, , and resistance, , measurements. Figure 1 shows data as a function of temperature in three pressure ranges up to 2.43 GPa. Close to ambient pressure, as represented by the 0.15 GPa data in Fig. 1 (a), we observe a sharp transition at K which signals the onset of antiferromagnetic order, consistent with literature 33. Upon increasing pressure up to 1.30 GPa (Fig. 1 (a)), this feature shifts to higher temperatures, whereas almost no change can be found in the shape of the feature, i.e., in the sharpness and the maximum value of at the transition. Further increasing pressure beyond 1.30 GPa (Fig. 1 (b)) results in a clear decrease of the transition temperature up to 1.94 GPa. Concurrently, the specific heat feature starts to broaden slightly and the maximum value decreases, implying that the associated entropy release with the magnetic ordering is distributed over a wider temperature range. At even higher pressures, up to the maximum pressure of our experiment of 2.43 GPa (Fig. 1 (c)), the transition temperature increases again and the increase takes place at a faster rate, compared to lower pressures. The specific heat feature is significantly broadened, indicating that fluctuations might play a role in a wider temperature range above the transition temperature. The observations described above, such as the sharp feature in the temperature-pressure phase diagram at 2 GPa (see also Fig. 3 below), suggest a change of the magnetic structure of EuCd2As2 with hydrostatic pressure.
To complement our thermodynamic analysis of the phase diagram, we also performed measurements of the resistance, , as a function of temperature at different pressures. The data of , normalized to the room-temperature value at zero pressure , is displayed in Fig. 2 and split into three pressure ranges, similar to the specific heat data. Overall, the -dependent behavior of is consistent with the literature at ambient pressure27, 28, 30. Initially, upon cooling, decreases, consistent with a semimetallic behavior27 (see inset of Fig. 2 (a)). Below K, starts to increase rapidly 27. Upon entering the magnetically-ordered state at low temperatures, decreases due to loss of spin-disorder scattering, resulting in a peak of at the transition temperature. Over the entire pressure range up to 2.42 GPa, the peak value of increases with pressure with the strongest increase observed in the intermediate pressure range 1.4 GPa GPa (see inset of Fig. 2 (b)), while the room-temperature value of changes by less than 25 %. Similar to the specific heat data, we find that the peak in remains sharp for 1.4 GPa (Fig. 2 (a)), starts to broaden for intermediate (Fig. 2 b) and remains broad while clearly shifting to higher temperatures beyond 1.95 GPa (Fig. 2 c).
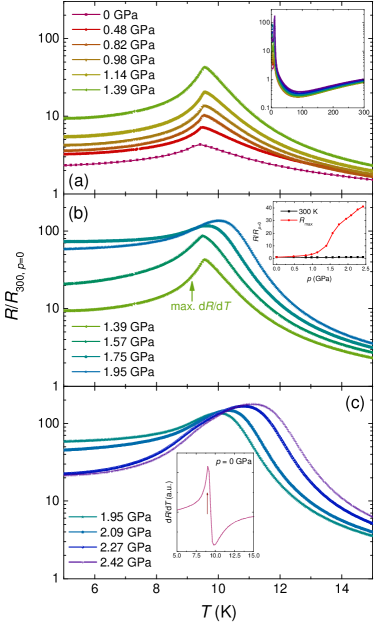
In order to construct the temperature-pressure phase diagram of EuCd2As2 from the data above, we used the following criteria. For the specific heat data, we determined the position of the minimum in d()/d, as exemplarily shown in the inset of Fig. 1 (b). This criterion is close to the one obtained in isentropic constructions (see arrow in the main panel of Fig. 1 (b)). For the resistance measurements, we refer to the Fisher-Langer relation 54 for magnetic transitions in metals and chose the maximum of d/d (see arrow in Fig. 2 (b) and inset in Fig. 2 (c)).
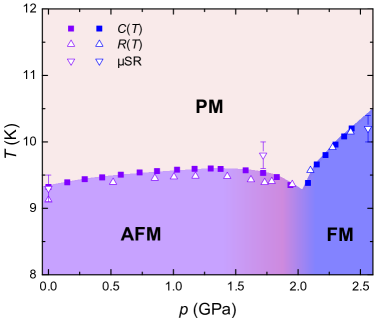
The resulting phase diagram is presented in Fig. 3. Pressure-dependent transition temperature data from both () and () runs agree with each other well and show an initial, slow increase in (1.30 GPa) with pressure followed by a gradual decrease of with further increase in pressure (1.30 GPa2.0 GPa). For 2.0 GPa we observe a comparatively sharp increase in the magnetic ordering temperature. This sharp change in the pressure dependence of the ordering temperature strongly suggests that a different magnetic phase has been stabilized above the critical pressure GPa. Indeed, our SR data, shown and discussed below, provide the basis for our determination that the high pressure phase has a ferromagnetic (FM) component to it.
III.2 Microscopic study of magnetism under pressure
To probe the magnetic properties under pressure, we used SR measurements. In these experiments, approximately half of the muons stop in the sample and half in the pressure cell wall. The latter muons are sensitive to the magnetic fields that are generated by the sample inside the pressure cell. Thus, the signal from the muons stopping in the pressure cell wall will be measurably distorted 43, 55, 56 for ferromagnetic samples. A detailed description of the analysis procedure of the SR data under hydrostatic pressure can be found in Appendix Sec. VI.1.1.
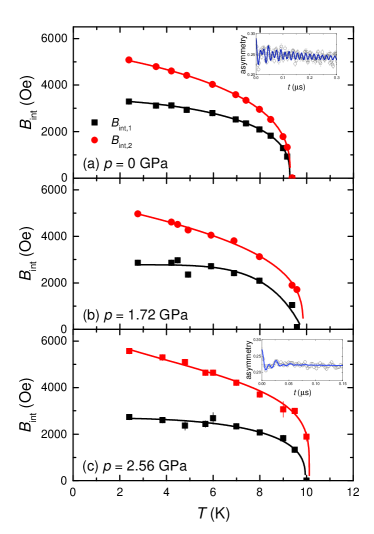
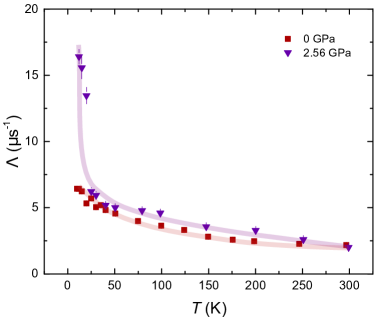
First, we present in Fig. 4 the evolution of the internal field of EuCd2As2 with temperature and pressure, which can be inferred from the zero-field SR spectra (see insets in (a) and (c) for the asymmetry data at 0 GPa and 2.56 GPa). In total, we took high-statistics zero field data sets for 0 GPa (Fig. 4 (a)), 1.72 GPa (Fig. 4 (b)) and 2.56 GPa (Fig. 4 (c)). For all pressures, clear oscillations were observed below the respective pressure-dependent ordering temperature, signalling the presence of a finite internal field below the respective transition temperature. In each case, our data is best modeled by using two muon stopping sites with internal fields and . For the 0 GPa data, the best fit was obtained by using a ratio of 60:40 for the two stopping sites, whereas for higher pressures we fixed the ratio to 50:50. The transition temperatures from SR, which are included in the phase diagram in Fig. 3, were determined by fitting the data with the empirical formula , with , , and being free parameters ( corresponds to the respective transition temperature). Interestingly, the ratio of internal fields at K increases significantly with pressure from 1.5 at 0 GPa to 1.7 at 1.72 GPa to 2 at 2.56 GPa. Even though we lack precise information on the muon stopping sites in EuCd2As2, the change of the ratio of internal fields suggests that there is some change of the magnetic structure, for example by rotation of the moments at a muon stopping site, with pressure 57.
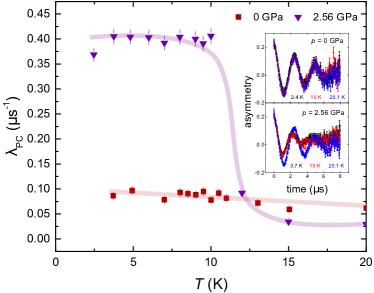
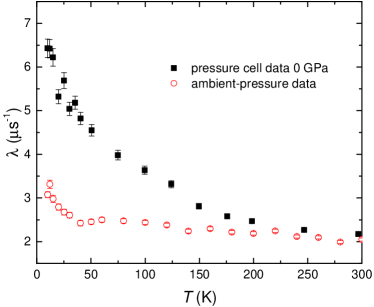
Next, we discuss our results of the type of magnetic order under pressure. To this end, we show in Fig. 5 the pressure cell relaxation rate, , at two different pressures, which were obtained from measuring the muon asymmetry in a weak transverse field of 30 Oe. As already evident from the raw data shown in the insets, there is no additional depolarization below the ordering temperature K at ambient pressure (), whereas there is a clear additional depolarization below K at 2.56 GPa (). As depicted in the main panel, the former data correspond to a weak temperature dependence of , the size of which equals the known relaxation rate of the pressure cell 43 (see Appendix Sec. VI.1.1). This behavior is expected for antiferromagnetic order (see also our discussion of ambient-pressure SR data on oriented single crystals in Appendix Sec. VI.1.3). In contrast, for 2.56 GPa, suddenly increases below and levels off for lower temperatures, which can only be attributed to the presence of an additional field created by the sample. Importantly, this central result of our work represents compelling evidence for the realization of a FM state at high pressures. This conclusion is further supported by an increase of ferromagnetic fluctuations above the ordering temperature with pressure (see Appendix Sec. VI.1.2). Based on the presented SR data on an aggregate of randomly oriented single crystals, we cannot make any statement on whether the FM state is fully polarized along a crystallographic direction or whether there is only a ferromagnetic component to the order. Below, based on anisotropic magnetoresistance data, we argue that the high-pressure FM state is likely almost in-plane polarized, and thus we refer here to the notion of FM order.
III.3 Anisotropic magnetoresistance data
Now that we have established a change of the magnetic ground state from AFM to FM by hydrostatic pressure in EuCd2As2, we want to discuss transport measurements under pressure in finite magnetic field in the ordered states. The aim of these experiments is to identify the moment direction in the high-pressure state.
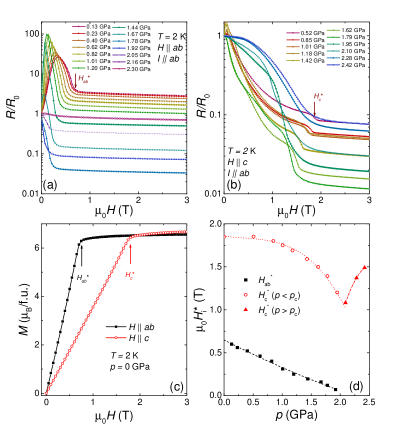
In Figs. 6 (a) and (b), we show our data of the pressure-dependent magnetoresistance (MR) data at K, taken in a longitudinal and in a transverse configuration, i.e., , (a) and (b). At lowest pressures (0.13 GPa and 0.52 GPa, respectively), the longitudinal goes through a maximum and becomes almost field-independent above 0.7 T (Fig. 6 (a)), whereas the transverse shows a step-like change around 1.8 T (c,d). Those field scales coincide very well with the saturation fields for the specific field orientations, determined from magnetization measurements at ambient pressure 33 (see Fig. 6 (c)).
As clearly visible in the raw data (a), decreases rapidly with increasing pressure. As shown in Fig. 6 (d), extrapolates to zero at 2 GPa, i.e., at . For 2.3 GPa, the data is essentially field-independent. These results strongly suggest that the high-pressure FM state has its moments aligned in the plane, i.e., a pure FM state: With pressure, we suppress to zero, implying full moment alignment along the in-plane direction.
Whereas is suppressed to zero with increasing pressure, is also suppressed, but remains finite at 2 GPa. For 2 GPa, no step-like change can be observed. Instead, we observe a broad crossover feature in the field-dependent data, the position of which increases with increasing pressure (see Fig. 6 (d)). The absence of a metamagnetic transition for out-of-plane fields is consistent with the notion of FM order with moments oriented in the -plane. The decrease in for is nonetheless remarkable, as it suggests that the energy difference to the FM state with moments along the axis is also reduced with pressure. We will further discuss the proximity to this FM state based on DFT calculations below. We note that our Hall data under pressure, presented in Appendix Sec. VI.2, indicate the possibility that the change of magnetic structure across is associated with a change of charge carrier density.
III.4 Results of DFT calculations under pressure
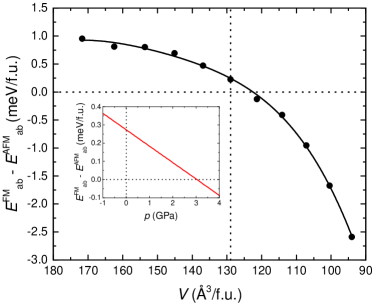
In this section we study the pressure-dependent evolution of magnetic order in EuCd2As2 and the possible transition from in-plane AFM (denoted by AFMab in the following) to in-plane FM order (denoted by FMab) for low pressures with the help of DFT calculations. To this end, we constructed the EOS for both AFMab and FMab spin configurations around the equilibrium volume and fitted it to the Birch-Murnaghan equation58, 59. The optimized equilibrium lattice constants using the PBE exchange-correlation functional and = 4.4 eV without spin-orbit coupling (SOC) for A-type antiferromagnetic (i.e., AFMab) spin configuration are = 4.49 Å and = 7.37 Å. These values agree with the experimental data of 4.4336 and 7.2925 Å at K respectively, just above (see Appendix Sec. VI.3) within about 1%, which can be considered as a very good agreement for DFT-PBE calculations 60. For EOS calculations, at each volume, the cell shape and atomic positions are fully relaxed for both AFMab and FMab with SOC, with the magnetic moment pointing in the in-plane direction to the nearest-neighbor (NN) Eu or equivalently along - or -axis. The fitted equilibrium volumes from EOS are 129.78 and 129.76 Å3/f.u. for AFMab and FMab with SOC, respectively, having an energy difference of 0.3 meV/f.u. in favor of the AFMab state. This agrees well with the 0.22 meV/f.u. preference to AFMab from the direct DFT calculation at the initial AFM equilibrium volume of 128.96 Å3/f.u. With such small differences in equilibrium volume and energy, the two fully-relaxed EOS of the competing magnetic phases are aligned very closely together to have almost the same bulk modulus of 46.7 GPa. To obtain the critical pressure for the AFM-FM magnetic phase transition, the difference between the two EOS, vs. volume is plotted in Fig.7. At the initial AFMab equilibrium volume, AFMab is preferred by 0.22 meV/f.u. This preference is increased at larger volume, but decreased for smaller volume, i.e., with increasing hydrostatic pressure. This leads to a AFMab-FMab magnetic phase transition under hydrostatic pressure, as observed in experiment. The transition region is shown on enlarged scales in the inset of Fig.7 with the x-axis converted to pressure using the calculated bulk modulus. The dashed line of = 0.0 gives the critical pressure 3.0 GPa, in good agreement with the experimental data of 2.0 GPa. To firmly establish the pressure-induced AFMab-FMab in EuCd2As2 within DFT, we have also tested different exchange-correlation functionals, PAW potentials and computational settings, including using the same relaxed crystal structures for AFMab and FMab at each volume from either the non-magnetic or AFMab configuration. All calculations confirm a AFMab-FMab, with values in the range from 2.7 to 4.2 GPa (see App. VI.4 for a detailed discussion on different initial conditions).
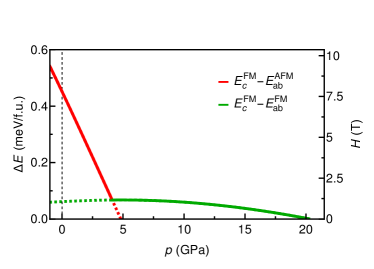
Next, we calculated the crystalline magneto-anisotropy energy (MAE), defined by the required energy to switch the crystal magnetization from the low pressure basal plane magnetic order and direction to, in this case explicitly, FMc order, at increasing pressure. Such a calculation provides information about the proximity of EuCd2As2 to the FMc state, which, according to recent work, is able to host a single pair of Weyl nodes 24, 25. This calculation was done in various steps. First, we relaxed the unit cell of EuCd2As2 at different volumes by treating the Eu2+ 4f states completely as core states and by performing non-spin polarized calculations with the PBE exchange correlation functional. The former warrants that no spurious Eu f states appear near the Fermi level and the latter ensures a fully non-magnetic setting since no magnetic moments/spins are invoked in the calculation. Such a relaxation guarantees a uniform change in the lattice without being influenced by the nature of the assumed magnetism for the Eu2+ 4f states. The resulting optimized non-magnetic equilibrium lattice parameters are given by Åand Å, which are closer to the experimental data (see Appendix VI.3) than the magnetically relaxed structures, due to the absence of long-range magnetic order at the measured K. In a second step, we took the optimized non-magnetic crystal structures and calculated total energies for different Eu magnetic configurations, by including the Eu2+ 4f states as valence electrons with eV and SOC and with the Eu moments aligned either antiferromagnetically or ferromagnetically and moments pointing in the plane for AFMab and FMab, respectively, as well as aligned ferromagnetically along the -axis, denoted as FMc. The DFT results were fitted to the Birch-Murnagham EOS, yielding the MAE by subtracting the corresponding fits. After fitting, the equilibrium volume increases from Åf.u. for the non-magnetic configuration to Åf.u. for both FM orders and to Åf.u. for AFMab. Note that throughout all performed calculations we keep the valence of Eu fixed to 2+, so that we cannot exclude the possibility of a valence transition (Eu2+ to Eu3+) at the simulated higher pressures. This goes beyond the scope of the present work.
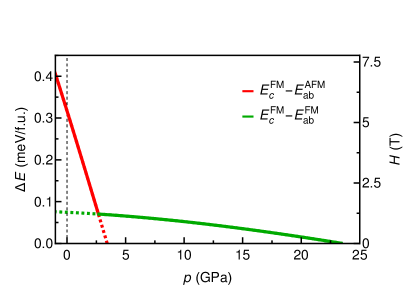
In Fig. 8 we show the results of these MAE calculations as a function of hydrostatic pressure. The MAE is directly proportional to the field that is measured in experiment. At ambient pressure, the theoretical calculations overestimate the experimental value, which is expected in the framework of DFT and Birch-Munagham EOS, which we use. Nevertheless, the tendencies as a function of pressure are robust. Here, we find that the MAE or decrease rapidly with increasing pressure for , consistent with our experimental observations, shown in Fig. 6 (d). Above , the MAE still continues to decrease with increasing pressure, however at a slower rate. This trend is opposite to what is observed for our experimental data for pressures close to . However, we note that the details of our theoretical prediction close to depend on the details of the relaxation (The result of a different relaxation is shown in Fig. 14). Thus, experimental data to higher pressures is needed for a meaningful comparison between theory and experiment in the FMab ground state region.
The decrease of MAE with pressures beyond GPa does not depend on details of the relaxation. Thus, there will eventually be a transition to the FMc state at sufficiently high pressures, as long as Eu does not change its valency. We predict that this transition to an FMc state occurs at GPa. Whereas this pressure is larger than the experimentally-used pressures in this work, it is nevertheless experimentally feasible to realize those pressures. Thus, based on our theoretical calculations, it might be possible to stabilize the desired FMc state in EuCd2As2 in experiment as a result of pressure effects and without application of an external magnetic field, and, to study key transport quantities with respect to topology. At the same time, it will be very interesting to perform further studies to understand the microscopic origin of the high tunability of the magnetic properties of EuCd2As2.
IV Conclusions
In summary, we presented an experimental study of the temperature-pressure phase diagram up to GPa of the magnetic Weyl semimetal EuCd2As2 by means of specific heat, transport and SR measurements and performed DFT calculations up to pressures of 25 GPa. Our results clearly show that this compound undergoes a transition from an antiferromagnetic state at low pressures to a ferromagnetic state above 2 GPa, in which moments are dominantly oriented within the plane. In addition, we find that pressure also drives EuCd2As2 closer to the sought-for FM state, in which moments are oriented along the axis. We predict that a hydrostatic pressure of 23 GPa will stabilize this FMc state, if no valence transition of Eu2+ intervenes. Overall, our study identifies a clear and experimentally-accessible tuning route to change the magnetic ground state in EuCd2As2 in a single sample and investigate the interplay of magnetism and topological non-trivial phases. Our results motivate further experimental and theoretical studies on EuCd2As2 under pressure, which is a very powerful parameter to tune the properties of this magnetic Weyl semimetal.
V Acknowledgments
We thank Na Hyun Jo and Young-Joon Song for useful discussions. SLB and PCC thank B. Schweinsteiger for inspiring research group members. Work at the Ames Laboratory was supported by the U.S. Department of Energy, Office of Science, Basic Energy Sciences, Materials Sciences and Engineering Division. The Ames Laboratory is operated for the U.S. Department of Energy by Iowa State University under Contract No. DEAC02-07CH11358. E.G. and L.X. were funded, in part, by the Gordon and Betty Moore Foundation’s EPiQS Initiative through Grant No. GBMF4411. B.K. and L.-L.W. were funded by the Center for Advancement of Topological Semimetals, an Energy Frontier Research Center funded by the U.S. Department of Energy Office of Science, Office of Basic Energy Sciences, through the Ames Laboratory under its Contract No. DE-AC02-07CH11358. Research of R.G. is supported by the Swiss National Science Foundation (SNF-Grant No. 200021-175935). AV and RV acknowledge support by the Deutsche Forschungsgemeinschaft (DFG, German Research Foundation) for funding through TRR 288 - 422213477 (project B05).
VI Appendix
VI.1 Additional discussion of SR data under pressure
VI.1.1 Analysis of SR data inside a pressure cell
Zero field data analysis - The zero-field SR data was analyzed by taking two independent contributions to the total asymmetry, , into account
| (1) |
with () being the contribution from the sample (the pressure cell). The sample contribution for EuCd2As2 was found to be best described by considering two stopping sites with different internal field, resulting in
| (2) |
with the magnetic fraction of the -th component, the gyromagnetic ratio of the muon, the internal field, the transverse relaxation rate, the longitudinal relaxation rate, and the relaxation rate of the paramagnetic portion of the sample. The 2/3 and 1/3 components arise from averaging over a large aggregate of arbitrarily-oriented single crystals.
The background contribution from the pressure cell can be determined in an independent set of experiment and can be described by two depolarization channels (one originating from nuclear moments and one from electronic moments) following a damped Kubo-Toyabe form
| (3) |
with () the relaxation rate associated with the nuclear (electronic) moments.
Weak transverse field data analysis - As mentioned in the main text, there exists an additional depolarization of the muons stopping in the pressure cell when the sample inside the cell exhibits a strong magnetization. We note that the muons which stop in the pressure cell wall mostly stop inside the inner cylinder, i.e., very close to the sample, so that they can be sensitive to stray fields emerging from the sample, as shown in recent calculations of the muon stopping profile for pressure-cell experiments with this particular muon energy 61. In the case of weak-transverse field experiments with finite , the pressure cell contribution thus reads as
| (4) |
Here, refers to the relaxation rate caused by nuclear moments, whereas is relaxation rate determined by the electronic moments as well as the influence of the field that is created by a sample with macroscopic magnetization. The electronic contribution to is typically almost temperature-independent43 and s (see also data above the ordering temperature in Fig. 5).
VI.1.2 Evolution of SR relaxation above the ordering temperature with pressure
We now discuss the relaxation rate, , of EuCd2As2 above the ordering temperature, as shown in Fig. 9. For ambient pressure, we find a moderate increase of with lowering temperature, which is fully consistent with the expectations for paramagnetism stemming from the large Eu2+ moments. Importantly, we note that we do not find any indications for the step-like change of at K, which Ma et al. 30 observed and which was taken as a strong evidence for quasi-long range and quasi-static magnetic order below 100 K that stabilizes Weyl physics even without spontaneous breaking of time-reversal symmetry (see Appendix VI.1.3 for supporting data on a well-oriented single crystal at ambient pressure outside the pressure cell). Instead, the large contribution from the Eu paramagnetism does not allow for any conclusion about the presence or nature of magnetic correlations. However, upon increasing pressure to GPa, we find that increases much faster below 20 K, reflecting a strong enhancement of FM fluctuations in the proximity of the FM ground state.
VI.1.3 SR data at ambient pressure
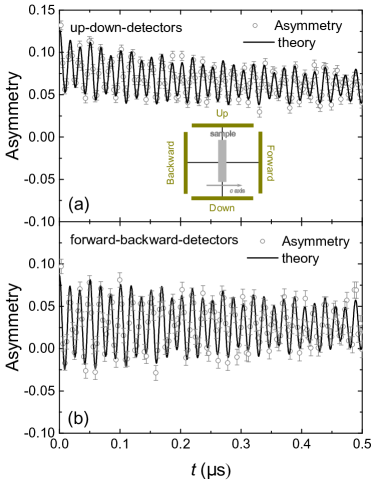
So as to characterize the magnetic order at ambient pressure in more detail, we performed SR measurements in zero-field on an oriented single crystal in the GPS spectrometer. Given that the sample is oriented, information on the orientation of the magnetic order can be inferred from differences in counts in the forward- and backward vs. the up- and down-detectors (see Fig. 10 for a schematic sketch of the experimental setup). Clear oscillations are seen in the asymmetry evaluated from the difference between the up- and down-detectors (Fig. 10 (a)) as well as the forward-backward-detectors (Fig. 10 (b)). This implies that the moments are not aligned out-of-plane at ambient pressure, consistent with earlier literature results 28, 29. The data is best described by taking two muon stopping sites into account and the respective internal fields inferred from these ambient-pressure measurements agree very well with the ones plotted in Fig. 4, which were inferred from the data inside the pressure cell at 0 GPa.
In Fig. 11, we show the relaxation rate, above the ordering temperature inferred from the GPS experiment on the oriented single crystal and compare it with the data inferred from the randomly-oriented aggregate of single crystals inside the pressure cell at ambient pressure. Whereas the overall magnitude of differs between the two experiments, which likely can be attributed to a directional-dependent size of the relaxation, none of the data reveal a clear feature at 100 K, as previously stated in Ref. 30.
VI.2 Hall effect measurements under pressure
Hall effect measurements were made by carefully painting two current contacts to cover the two opposite ends of the crystal to ensure as uniform of a current density as possible and two voltage contact on the remaining two side surfaces of the crystal. Current was applied along an in-plane direction, the magnetic field aligned perpendicular to it within the plane and voltage measured along the axis.
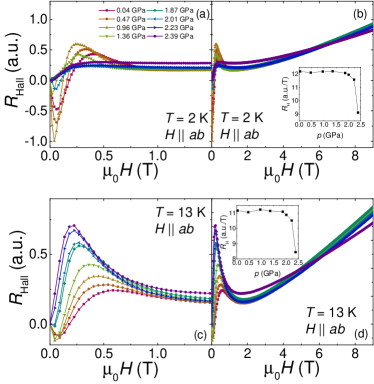
Here, we want to discuss our results of changes of Hall resistance across the critical pressure. In Fig. 12 we show the Hall resistance, , as a function of pressure for K (a,b) and K (c,d), i.e., below and above the magnetic transition temperatures and . At 2 K and low pressures, goes through a minimum followed by a maximum in a very narrow field range up to 0.8 T. The ordinary Hall effect cannot account for this behavior of below T as it is almost linear (see Fig. 12 (b) for data up to higher fields). In addition, this field scale matches with the one observed in the MR measurements above as well as magnetization measurements at ambient pressure 33. Thus, this indicates that the low-field Hall effect data are dominated by the anomalous Hall effect contribution. At high pressures, in the FM state, the pronounced maxima and minima are absent and the anomalous contribution to is distinctly smaller, but nonetheless finite. A full disentanglement of the various contributions to the Hall resistance in a magnetic material is unfortunately not possible on the basis of the present data set, given the lack of magnetization data under pressure.
For sufficiently large fields, T, the data at 2 K and 13 K are linear in field (see Figs. 12 (b) and (d)), and thus reflects the ordinary Hall contribution. The slope, , obtained from linear fits of the Hall data up to maximum field, is plotted as a function for pressure in the insets of Figs. 12 (b) and (d). For each temperature (2 K and 13 K), is constant up to GPa and starts to decrease slightly above. Even though the number of data points at very high pressures, where the decrease becomes pronounced, is limited, our data might indicate a change of charge carrier density across the critical pressure. It will be interesting to investigate the microscopic origin of the change of the magnetic properties with pressure in the future from experimental and theoretical point of view in more detail.
VI.3 Low-temperature lattice parameters of EuCd2As2 at ambient pressure
So as to better compare experimental and theoretical lattice parameters, we determined the lattice parameters of EuCd2As2 experimentally at low temperatures, given that our DFT calculations are performed at zero temperature. Single crystal X-ray diffraction measurements were performed on an in-house four-circle diffractometer using Cu radiation from a rotating anode X-ray source, using germanium (1 1 1) monochromator. A He closed-cycle refrigerator was used for temperature dependence measurements between 11 and 300 K. Three Be domes were used as a vacuum shroud, heat shield, and the last innermost dome containing the sample. The innermost dome was filled with a small amount of He gas to improve thermal contact to the sample surface. Measurements were carried out on a single crystal of 0.087 g attached to a flat copper sample holder that is attached to the cold finger. The mosaicities of the sample were less than 0.04∘ for both the (0, 0, 5) and (3, 0, 5) reflections at all measured temperatures. The positions of the reflections were fit using a Lorentzian lineshape, and used to determine the lattice parameters of the sample from 11-300 K, which are shown in Fig. 13.
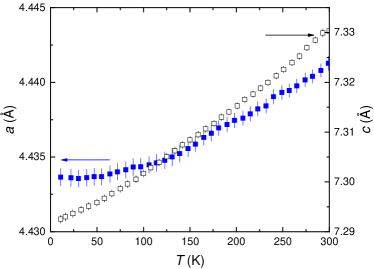
As discussed in the main text, the experimental lattice parameters at 11 K are within 1 % of the calculated values for both the magnetic and the non-magnetic relaxation. Based on previous works 60, this can be considered as a very good agreement between experiment and theory.
VI.4 Effect of lattice parameter relaxation in the calculation of energies
To justify the validity of our calculated data, we used several slightly different calculation settings. Whereas the different calculations resulted in slightly different estimates of the critical pressures, they always resulted in the AFMab-FMab-FMc transition sequence with increasing pressure. Thus, the key message of our paper is stable with respect to different calculation settings. In the following, we discuss the spread of values obtained from different calculation procedures. The order of magnitude for the difference in energy of possible magnetic ground states is already below meV at ambient pressure, for the MAE even below meV. Therefore, tiny structural changes, caused by different methods of relaxing the unit cell or pseudo potential files, affect the resulting critical pressure measurably. Independent of all previously shown calculations, we performed a relaxation using the magnetic space groups , corresponding to the AFMab, and , FMab, as starting points for the initial crystal structure. Fixing the Wyckoff positions with regard to the magnetic space groups guarantees no loss of symmetry information. Thereby, we also included SOC and a Hubbard eV. Apart from this, the input parameters are identical to the non-magnetic case.
Figure 14 illustrates the outcome of this method. Similar to Fig. 8 in the main text, this figure describes the difference of the corresponding ground state energy to the FMc state as a function of pressure on the left axis and the corresponding magnetic field. The critical pressure for the transition from AFMab order (red curve) to FMab (green curve), given by the crossing point of the red and green curve, is shifted to a slightly larger pressure of GPa relative to what is shown in Fig. 8. The predicted transition to FMc, occurs at a lower pressure of GPa.
References
- Wan et al. [2011] X. Wan, A. M. Turner, A. Vishwanath, and S. Y. Savrasov, Phys. Rev. B 83, 205101 (2011).
- Hasan and Kane [2010] M. Z. Hasan and C. L. Kane, Rev. Mod. Phys. 82, 3045 (2010).
- Yan and Felser [2017] B. Yan and C. Felser, Annual Review of Condensed Matter Physics 8, 337 (2017).
- Burkov [2016] A. Burkov, Nature Materials 15, 1146 (2016).
- Zhang et al. [2019] S. S.-L. Zhang, A. A. Burkov, I. Martin, and O. G. Heinonen, Phys. Rev. Lett. 123, 187201 (2019).
- Šmejkal et al. [2017] L. Šmejkal, T. Jungwirth, and J. Sinova, physica status solidi (RRL) 11, 1700044 (2017).
- Armitage et al. [2018] N. P. Armitage, E. J. Mele, and A. Vishwanath, Rev. Mod. Phys. 90, 015001 (2018).
- Burkov and Balents [2011] A. A. Burkov and L. Balents, Phys. Rev. Lett. 107, 127205 (2011).
- Xu et al. [2011] G. Xu, H. Weng, Z. Wang, X. Dai, and Z. Fang, Phys. Rev. Lett. 107, 186806 (2011).
- Son and Spivak [2013] D. T. Son and B. Z. Spivak, Phys. Rev. B 88, 104412 (2013).
- Parameswaran et al. [2014] S. A. Parameswaran, T. Grover, D. A. Abanin, D. A. Pesin, and A. Vishwanath, Phys. Rev. X 4, 031035 (2014).
- Liu and Vanderbilt [2014] J. Liu and D. Vanderbilt, Phys. Rev. B 90, 155316 (2014).
- Heinsdorf et al. [2021] N. Heinsdorf, M. H. Christensen, M. Iraola, S. Zhang, F. Yang, T. Birol, C. D. Batista, R. Valentí, and R. M. Fernandes, arXiv preprint arXiv:2101.05301 (2021).
- Chang et al. [2018] G. Chang, B. Singh, S.-Y. Xu, G. Bian, S.-M. Huang, C.-H. Hsu, I. Belopolski, N. Alidoust, D. S. Sanchez, H. Zheng, et al., Phys. Rev. B 97, 041104 (2018).
- Arnold et al. [2016] F. Arnold, C. Shekhar, S.-C. Wu, Y. Sun, R. D. dos Reis, N. Kumar, M. Naumann, M. O. Ajeesh, M. Schmidt, A. G. Grushin, et al., Nat. Commun. 7, 11615 (2016).
- Weng et al. [2015] H. Weng, C. Fang, Z. Fang, B. A. Bernevig, and X. Dai, Phys. Rev. X 5, 011029 (2015).
- Huang et al. [2015] S.-M. Huang, S.-Y. Xu, I. Belopolski, C.-C. Lee, G. Chang, B. Wang, N. Alidoust, G. Bian, M. Neupane, C. Zhang, et al., Nat. Commun. (2015).
- Borisenko et al. [2019] S. Borisenko, D. Evtushinsky, Q. Gibson, A. Yaresko, K. Koepernik, T. Kim, M. Ali, J. van den Brink, M. Hoesch, A. Fedorov, et al., Nat. Commun. 10, 3424 (2019).
- Liu et al. [2018] E. Liu, Y. Sun, N. Kumar, L. Muechler, A. Sun, L. Jiao, S.-Y. Yang, D. Liu, A. Liang, Q. Xu, et al., Nat. Phys. 14 (2018).
- Ye et al. [2018] L. Ye, M. Kang, J. Liu, F. von Cube, C. R. Wicker, T. Suzuki, C. Jozwiak, A. Bostwick, E. Rotenberg, D. C. Bell, et al., Nature 555 (2018).
- Kang et al. [2020] M. Kang, L. Ye, S. Fang, J.-S. You, A. Levitan, M. Han, J. I. Facio, C. Jozwiak, A. Bostwick, E. Rotenberg, et al., Nat. Mat. (2020).
- Guguchia et al. [2020] Z. Guguchia, J. A. T. Verezhak, D. J. Gawryluk, S. S. Tsirkin, J.-X. Yin, I. Belopolski, H. Zhou, G. Simutis, S.-S. Zhang, T. A. Cochran, et al., Nat. Commun. 11 (2020).
- Destraz et al. [2020] D. Destraz, L. Das, S. S. Tsirkin, Y. Xu, T. Neupert, J. Chang, A. Schilling, A. G. Grushin, J. Kohlbrecher, L. Keller, et al., npj Quantum Materials 5 (2020).
- Hua et al. [2018] G. Hua, S. Nie, Z. Song, R. Yu, G. Xu, and K. Yao, Phys. Rev. B 98, 201116 (2018).
- Wang et al. [2019] L.-L. Wang, N. H. Jo, B. Kuthanazhi, Y. Wu, R. J. McQueeney, A. Kaminski, and P. C. Canfield, Phys. Rev. B 99, 245147 (2019).
- Artmann et al. [1996] A. Artmann, A. Mewis, M. Roepke, and G. Michels, Zeitschrift für anorganische und allgemeine Chemie 622, 679 (1996).
- Wang et al. [2016] H. P. Wang, D. S. Wu, Y. G. Shi, and N. L. Wang, Phys. Rev. B 94, 045112 (2016).
- Rahn et al. [2018] M. C. Rahn, J.-R. Soh, S. Francoual, L. S. I. Veiga, J. Strempfer, J. Mardegan, D. Y. Yan, Y. F. Guo, Y. G. Shi, and A. T. Boothroyd, Phys. Rev. B 97, 214422 (2018).
- Soh et al. [2019] J.-R. Soh, F. de Juan, M. G. Vergniory, N. B. M. Schröter, M. C. Rahn, D. Y. Yan, J. Jiang, M. Bristow, P. Reiss, J. N. Blandy, et al., Phys. Rev. B 100, 201102 (2019).
- Ma et al. [2019] J.-Z. Ma, S. M. Nie, C. J. Yi, J. Jandke, T. Shang, M. Y. Yao, M. Naamneh, L. Q. Yan, Y. Sun, A. Chikina, et al., Science Advances 5, eaaw4718 (2019).
- Niu et al. [2019] C. Niu, N. Mao, X. Hu, B. Huang, and Y. Dai, Phys. Rev. B 99, 235119 (2019).
- Xu et al. [2021] Y. Xu, L. Das, J. Z. Ma, C. J. Yi, S. M. Nie, Y. G. Shi, A. Tiwari, S. S. Tsirkin, T. Neupert, M. Medarde, et al., Phys. Rev. Lett. 126, 076602 (2021).
- Jo et al. [2020] N. H. Jo, B. Kuthanazhi, Y. Wu, E. Timmons, T.-H. Kim, L. Zhou, L.-L. Wang, B. G. Ueland, A. Palasyuk, D. H. Ryan, et al., Phys. Rev. B 101, 140402 (2020).
- Sanjeewa et al. [2020] L. D. Sanjeewa, J. Xing, K. M. Taddei, D. Parker, R. Custelcean, C. dela Cruz, and A. S. Sefat, Phys. Rev. B 102, 104404 (2020).
- Taddei et al. [2020] K. Taddei, L. Lin, L. Sanjeewa, J. Xing, C. dela Cruz, A. Sefat, and D. Parker, arXiv: 2012.01555 (2020).
- Canfield et al. [2016] P. C. Canfield, T. Kong, U. S. Kaluarachchi, and N. H. Jo, Philosophical Magazine 96, 84 (2016).
- [37] URL https://lspceramics.com/canfield-crucible-sets-2/.
- Canfield [2019] P. C. Canfield, Reports on Progress in Physics 83, 016501 (2019).
- Gati et al. [2019] E. Gati, G. Drachuck, L. Xiang, L.-L. Wang, S. L. Bud’ko, and P. C. Canfield, Rev. Sci. Instrum. 90, 023911 (2019).
- Bud’ko et al. [1984] S. L. Bud’ko, A. N. Voronovskii, A. G. Gapotchenko, and E. S. ltskevich, Zh. Eksp. Teor. Fiz. 86, 778 (1984).
- Torikachvili et al. [2015] M. S. Torikachvili, S. K. Kim, E. Colombier, S. L. Bud’ko, and P. C. Canfield, Rev. Sci. Instrum. 86, 123904 (2015).
- Eiling and Schilling [1981] A. Eiling and J. S. Schilling, Journal of Physics F: Metal Physics 11, 623 (1981).
- Khasanov et al. [2016] R. Khasanov, Z. Guguchia, A. Maisuradze, D. Andreica, M. Elender, A. Raselli, Z. Shermadini, T. Goko, F. Knecht, E. Morenzoni, et al., High Pressure Research 36, 140 (2016).
- Smith and Chu [1967] T. F. Smith and C. W. Chu, Phys. Rev. 159, 353 (1967).
- Hohenberg and Kohn [1964] P. Hohenberg and W. Kohn, Phys. Rev. 136, B864 (1964).
- Kohn and Sham [1965] W. Kohn and L. J. Sham, Phys. Rev. 140, A1133 (1965).
- Perdew et al. [1996] J. P. Perdew, K. Burke, and M. Ernzerhof, Phys. Rev. Lett. 77, 3865 (1996).
- Blöchl [1994] P. E. Blöchl, Phys. Rev. B 50, 17953 (1994).
- Kresse and Joubert [1999] G. Kresse and D. Joubert, Phys. Rev. B 59, 1758 (1999).
- Kresse and Hafner [1993] G. Kresse and J. Hafner, Phys. Rev. B 47, 558 (1993).
- Kresse and Furthmüller [1996] G. Kresse and J. Furthmüller, Phys. Rev. B 54, 11169 (1996).
- Kresse and Furthmüller [1996] G. Kresse and J. Furthmüller, Computational Materials Science 6, 15 (1996).
- Monkhorst and Pack [1976] H. J. Monkhorst and J. D. Pack, Phys. Rev. B 13, 5188 (1976).
- Fisher and Langer [1968] M. E. Fisher and J. S. Langer, Phys. Rev. Lett. 20, 665 (1968).
- Taufour et al. [2016] V. Taufour, U. S. Kaluarachchi, R. Khasanov, M. C. Nguyen, Z. Guguchia, P. K. Biswas, P. Bonfà, R. De Renzi, X. Lin, S. K. Kim, et al., Phys. Rev. Lett. 117, 037207 (2016).
- Gati et al. [2021] E. Gati, J. M. Wilde, R. Khasanov, L. Xiang, S. Dissanayake, R. Gupta, M. Matsuda, F. Ye, B. Haberl, U. Kaluarachchi, et al., Phys. Rev. B 103, 075111 (2021).
- Khasanov et al. [2017] R. Khasanov, A. Amato, P. Bonfà, Z. Guguchia, H. Luetkens, E. Morenzoni, R. D. Renzi, and N. D. Zhigadlo, Journal of Physics: Condensed Matter 29, 164003 (2017).
- Birch [1947] F. Birch, Phys. Rev. 71, 809 (1947).
- Murnaghan [1944] F. D. Murnaghan, Proceedings of the National Academy of Sciences 30, 244 (1944).
- Harl et al. [2010] J. Harl, L. Schimka, and G. Kresse, Phys. Rev. B 81, 115126 (2010).
- Shermadini et al. [2017] Z. Shermadini, R. Khasanov, M. Elender, G. Simutis, Z. Guguchia, K. Kamenev, and A. Amato, High Pressure Research 37, 449 (2017).