Probing the nucleosynthetic contribution of low-metallicity, low-mass star companions of CEMP stars 111Based on data collected using HCT/HESP and SUBARU/HDS
Abstract
The observed abundance diversities among the CEMP stars can shed light on the formation and evolution of elements in the early Galaxy. In this work, we present results obtained from a detailed abundance analysis of a sample of seven extrinsic carbon stars. The analysis is based on high-resolution spectra obtained with HCT/HESP (R60,000) and SUBARU/HDS (R50,000). We present, for the first time, the elemental abundance results for the objects BD19 132, BD19 290, HE 13042111, HE 13542257, and BD+19 3109. Abundances of a few elements are available in literature for HE 11570518 and HD 202851, we present an update on the abundances of these elements along with new abundance estimates for several other elements. Our analysis confirms the object HD 202851 to be a CH star. While BD19 132, HE 13542257, and BD+19 3109 are found to be CEMP-s stars, the objects BD19 290, HE 11570518, and HE 13042111 are found to belong to CEMP-r/s group. The observed abundance patterns of the three CEMP-r/s stars are well reproduced with the i-process model predictions. While the objects BD+19 3109 and HD 202851 are confirmed binaries, the binary status of the remaining objects are not known. Analysis based on different elemental abundance ratios confirms low-mass former AGB companions for all the objects. Kinematic analysis shows that BD19 290, HE 11570518, HE 13542257, and BD+19 3109 belong to the Galactic halo, whereas BD19 132, HE 13042111, and HD 202851 are members of Galactic thin disk.
1 Introduction
Being enriched with carbon (and neutron-capture elements), the atmospheres of the low-mass, metal-poor stars in the Galaxy bear the fingerprints of the chemical evolution history of the Galaxy. They are the window to the early Galaxy, as they preserve in their atmosphere the chemical imprints of the gas clouds from which they were formed. For this reason, metal-poor stars such as CH stars and Carbon-Enhanced Metal-Poor (CEMP) stars, have been extensively studied in the last few decades for the information they provide on the origin and evolution of elements in the early Galaxy. A number of large sky survey programs to identify the most metal-poor stars were conducted in the past such as HK survey (Beers et al., 1985, 1992, 2007; Beers, 1999), Hamburg/ESO Survey (HES; Christlieb et al. 2001a, b; Christlieb 2003; Christlieb et al. 2008), Sloan Digital Sky Survey (SDSS; York et al. 2000), and LAMOST (Large Sky Area Multi-Object Fiber Spectroscopic Telescope) survey (Cui et al., 2012; Deng et al., 2012; Zhao et al., 2012). These surveys have revealed that a significant fraction (20%) of Very Metal-Poor ([Fe/H]2) stars in the Galaxy are CEMP stars (Rossi et al., 1999; Christlieb, 2003; Lucatello et al., 2006; Carollo et al., 2012). The fraction of carbon-enhanced stars increases with decreasing metallicity; 40% for [Fe/H]3 and 75% for [Fe/H]4 (Aoki et al., 2013; Lee et al., 2013; Yong et al., 2013; Placco et al., 2014; Frebel & Norris, 2015).
CH stars (2[Fe/H]0.2) are characterized by the strong CH and C2 molecular bands, C/O1 and strong features due to the neutron-capture elements (Keenan, 1942). CEMP stars are more metal-poor counterparts of CH stars ([Fe/H]1; Lucatello et al. 2005; Abate et al. 2016) which has been traditionally defined as the stars with [C/Fe]1 (Beers & Christlieb, 2005). However, the definition of CEMP stars is being revised and [C/Fe]0.70 (Aoki et al., 2007; Carollo et al., 2012; Lee et al., 2013; Norris et al., 2013b; Skúladóttir et al., 2015) and [C/Fe]0.90 (Jonsell et al., 2006; Masseron et al., 2010) are also used.
Based on the level of relative enrichment of neutron-capture elements, CEMP stars are classified into different sub-classes; CEMP-s (show enhanced abundances of s-process elements), CEMP-r (show strong enhancement of r-process elements), CEMP-r/s (show simultaneous enhancement of both s- and r-process elements) and CEMP-no (does not show any enhanced abundance of neutron-capture elements). This diverse abundance pattern observed in the CEMP stars points to different formation scenarios. The CEMP-s stars are considered as the metal-poor analog of Ba and CH stars, and the binary mass transfer from an evolved low-mass AGB companion is the most accepted scenario for their abundance peculiarity (Herwig, 2005). The long-term radial velocity monitoring studies have shown that most of the CEMP-s stars are binaries (Lucatello et al., 2005; Starkenburg et al., 2014; Jorissen et al., 2016; Hansen et al., 2016b), supporting the pollution from companion AGB. Comparison of observed abundances in the CEMP-s stars with theoretical model predictions also confirms the binary mass-transfer from the AGB companion (Bisterzo et al., 2011; Placco et al., 2013; Hollek et al., 2015).
There exist several proposed scenarios for the abundance pattern in CEMP-r/s stars that show enhancement in both s- and r-process elements that are ascribed to different astrophysical sites. The proposed scenarios for CEMP-r/s stars include; binary system formed out of r-enriched ISM, pollution of binary system from a massive tertiary, pollution from the binary companion exploded as Type 1.5 SNe (Accretion Induced Collapse, AIC) etc. (Jonsell et al. 2006 and references therein). However, none of these proposed scenarios is able to reproduce the observed abundance trend and frequency of CEMP-r/s stars (Abate et al., 2016). Since most of the CEMP-r/s stars are also found to be binaries just like CEMP-s stars, binary mass transfer from the AGB companion is thought to be the reason for their origin as well, however the presence of r-process component posed a challenge (Jonsell et al., 2006; Herwig et al., 2011; Abate et al., 2016). The i-process, intermediate neutron-capture process, with neutron density between s- and r- process can produce both s- and r- process elements at a single stellar site (Cowan & Rose, 1977). Many studies in literature have successfully used model yields of i-process in low-mass low-metallicity AGB stars to account for the observed abundance patterns in CEMP-r/s stars (Hampel et al., 2016, 2019; Goswami et al., 2021; Shejeelammal et al., 2021). Although there are several suggestions for the i-process sites (super-massive AGB stars (Doherty et al., 2015; Jones et al., 2016), low-mass low-meatllicity stars (Campbell & Lattanzio, 2008; Campbell et al., 2010; Cruz et al., 2013; Cristallo et al., 2016), Rapidly Accreting White Dwarfs (Herwig et al., 2014; Denissenkov et al., 2017) etc.) the exact astrophysical site for the i-process is not yet confirmed (Frebel, 2018; Koch et al., 2019).
The origins of CEMP-no and CEMP-r stars are also not clearly understood. CEMP-r stars are rare among all the CEMP sub-classes. Analysis of Hansen et al. (2011) and Hansen et al. (2015a) have shown that the abundance peculiarity of CEMP-r stars is not resulted from a binary mass transfer, instead due to the enrichment of their birth cloud from other external sources. Various suggested progenitors of the CEMP-r stars that polluted the ISM with r-elements are core-collapse SNe (Qian, 2000; Argast et al., 2004; Arcones & Thielemann, 2013), fallback SNe (Fryer et al., 2006), neutron star mergers (Tanvir et al., 2013; Rosswog et al., 2014; Drout et al., 2017; Lippuner et al., 2017) or nuetron star - black hole mergers (Surman et al., 2008). The observations of more such stars are required to constrain their exact origin. Similar to CEMP-r stars, the observed carbon enhancement in CEMP-no stars is also believed to be from the pre-enriched ISM (Norris et al., 2013a; Cooke & Madau, 2014; Frebel & Norris, 2015). The suggested progenitors of CEMP-no stars include faint SNe (Umeda & Nomoto, 2005; Nomoto et al., 2013; Tominaga et al., 2014), spinstar (Meynet et al., 2010; Chiappini, 2013), metal-free massive stars (Heger & Woosley, 2010). A recent study by Arentsen et al. (2019a) have shown that the binary mass-transfer from an extremely metal-poor AGB companion could also be a possible progenitor of the CEMP-no stars.
In this study, we have carried out a detailed spectroscopic analysis of seven carbon stars selected from various sources in literature, in order to understand their formation history from a detailed abundance analysis. The structure of this paper is as follows. Section 2. describes the stellar sample, source of the spectra and the data reduction. The derivation of stellar atmospheric parameter, radial velocity estimation and stellar mass determination are discussed in Section 3. The details of abundance determination is described in Section 4 and a discussion on abundance uncertainties is presented in Section 5. Section 6. provides the details of kinematic analysis. In Section 7, the classification of program stars based on the observed abundances is presented. Section 8 presents a discussion on various elemental abundance ratios and their interpretations. A discussion on the binary status of the program stars and on the individual stars along with the parametric model based analysis are also given in this section. Finally, conclusions are drawn in Section 9.
2 STELLAR SAMPLE: SELECTION, OBSERVATION/DATA ACQUISITION AND DATA REDUCTION
Out of the total seven objects analyzed in this study, four objects, BD19 132, BD19 290, BD+19 3109, and HD 202851 are selected from the catalog of CH star by Bartkevicius (1996). The other three objects, HE 11570518, HE 13042111, and HE 13542257 are selected from the candidate metal-poor stars identified in Hamburg/ESO survey (HES) (Christlieb, 2003) and in the HK survey of Beers et al. (1992). The stars HE 11570518 and HE 13542257 are also listed in the catalog of carbon stars identified from Hamburg/ESO survey (HES) by Christlieb et al. (2001a). The spectra of the objects BD19 132, BD19 290, BD+19 3109, and HD 202851 at a resolution () 60,000 are obtained using high-resolution Hanle Echelle SPectrograph (HESP) attached to the 2m Himalayan Chandra Telescope (HCT) operated at the Indian Astronomical Observatory, Hanle. For all these four objects, we have taken three frames each with an exposure of 2700 sec and then co-added to improve the quality (S/N ratio) of the resulting spectra. This S/N ratio enhanced spectra are then used for further analysis. The wavelength span of HCT/HESP spectra is 3530 - 9970 Å. The spectra of the objects HE 11570518, HE 13042111, and HE 13542257 at a resolution () 50,000 were taken from the SUBARU/HDS archive (http://jvo.nao.ac.jp/portal/v2/). The High Dispersion Spectrograph (HDS) is an echelle spectrograph of 8.2m SUBARU telescope (Noguchi et al., 2002) at Hawaii, operated by National Astronomical Observatory of Japan (NAOJ). The SUBARU spectra covers 4100 - 6850 Å in wavelength with a wavelength gap between 5440 and 5520 Å due to the separation between the two CCDs used. The data is further reduced using IRAF222IRAF (Image Reduction and Analysis Facility) is distributed by the National Optical Astronomical Observatories, which is operated by the Association for Universities for Research in Astronomy, Inc., under contract to the National Science Foundation software. The basic information of the program stars are given in Table 1 and some sample spectra of the program stars are shown in Figure 1.
| Star | RA | Dec. | B | V | J | H | K | Exposure | Date of obs. | Source | S/N | ||
|---|---|---|---|---|---|---|---|---|---|---|---|---|---|
| (seconds) | of spectrum | 4200 Å | 5500 Å | 7700 Å | |||||||||
| BD19 132 | 00 50 24.16 | 19 04 40.19 | 13.25 | 10.73 | 8.083 | 7.354 | 7.070 | 2700(3) | 07/11/2017 | HESP | 11.37 | 30.71 | 40.93 |
| BD19 290 | 01 40 34.11 | 18 56 51.52 | 12.41 | 11.07 | 8.710 | 8.102 | 7.914 | 2700(3) | 08/11/2017 | HESP | 6.41 | 23.59 | 47.07 |
| HE 11570518 | 12 00 08.06 | 05 34 43.12 | 16.273 | 15.120 | 13.418 | 12.917 | 12.846 | 1800 | 25/05/2003 | SUBARU | 9.32 | 25.15 | - |
| HE 13042111 | 13 07 27.26 | 21 27 34.24 | 14.547 | 13.061 | 9.651 | 9.009 | 8.764 | 1200 | 25/05/2003 | SUBARU | 5.21 | 21.53 | - |
| HE 13542257 | 13 57 43.30 | 23 12 34.55 | 15.22 | 14.00 | 11.809 | 11.290 | 11.110 | 1800 | 26/05/2003 | SUBARU | 6.39 | 35.56 | - |
| BD+19 3109 | 16 29 26.99 | +19 30 34.46 | 11.88 | 10.29 | 8.051 | 7.40 | 7.253 | 2700(3) | 23/05/2018 | HESP | 7.80 | 48.27 | 95.90 |
| HD 202851 | 21 18 43.49 | 01 32 03.34 | 10.89 | 9.67 | 7.711 | 7.174 | 7.029 | 2700(3) | 07/11/2017 | HESP | 17.01 | 31.82 | 54.57 |
The number of frames taken are given with exposure time, in parenthesis.

3 STELLAR ATMOSPHERIC PARAMETERS AND RADIAL VELOCITY
The radial velocities of the program stars are calculated from the Doppler equation using the measured wavelength shift of a set of clean spectral lines of several elements. Our radial velocity estimates along with that from Gaia DR2 (Gaia Collaboration et al., 2018) are presented in Table 2. Radial velocity data are not available in literature for the stars HE 11570518 and HE 13542257. While the objects BD19 290, HE 11570518, HE 13542257 and BD+19 3109 are found to be high velocity objects with Vr in the range 181.8 to +289.4 km s-1, BD19 132, HE 13042111, and HD 202851 are low velocity objects with Vr in the range 2.1 to +22.2 km s-1. The objects BD+19 3109 and HD 202851 are confirmed binaries with periods of 212913 and 12956 days respectively (Sperauskas et al., 2016). The estimated radial velocities of these two objects differ by 5 km s-1 from the literature values available in Gaia archive. For the objects BD19 132, BD19 290, and HE 13042111 our estimates show a difference of 13, 6, and 17 km s-1 respectively from those listed in Gaia archive. This may be an indication that these stars could possibly be binaries.
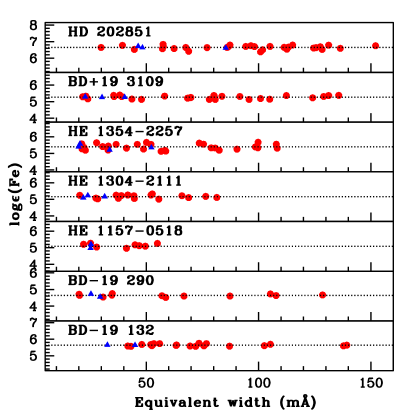
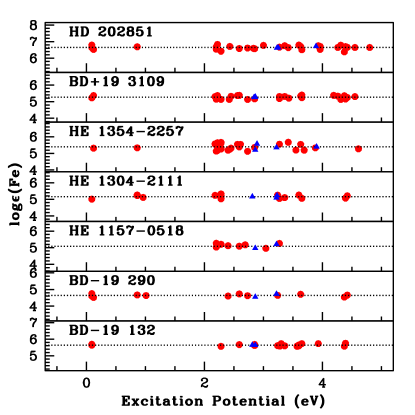
The procedure adopted for deriving the atmospheric parameters of the program stars is explained in detail in our previous papers Shejeelammal et al. (2020, 2021). Here we briefly mention a few relevant points. The equivalent width measured from a set of clean Fe I and Fe II lines are used for the derivation of the stellar atmospheric parameters. The lines are selected such that they have equivalent width and excitation potential in the range 8 - 180 mÅ and 0 - 6 eV respectively. We have used the most recent version of the radiative transfer code MOOG by Sneden (Sneden, 1973) employing Local Thermodynamic Equilibrium (LTE) for our analysis. The photometric temperatures of the program stars are calculated using the color-temperature calibration equations of Alonso et al. (1999, 2001) and used as initial guess of effective temperatures for model calculation. With this temperature estimate and a guess of log g value typical of giants, the initial model atmospheres are selected from the Kurucz grid of model atmosphere with no convective overshooting (http://kurucz.harvard.edu/grids.html). The excitation balance of Fe I lines is employed to fix the final effective temperature. The zero slope between the measured equivalent widths and the abundances of Fe I lines gives the microturbulent velocity. Finally, the ionization balance between the Fe I and Fe II gives the surface gravity. The final model atmosphere is adopted from the initial one through an iterative process until these three conditions are satisfied simultaneously. Once this is achieved, [Fe/H] is estimated from the derived iron abundance. The abundances derived from Fe I and Fe II lines as functions of excitation potentials and equivalent widths are shown in Figure 2. The derived atmospheric parameters along with the available literature values of the program stars are given in Table 2.
| Star | Teff | log g | [Fe I/H] | [Fe II/H] | Vr | Vr | Reference | |
|---|---|---|---|---|---|---|---|---|
| (K) | cgs | (km s-1) | (km s-1) | (km s-1) | ||||
| 100 | 0.2 | 0.2 | (This work) | (Gaia) | ||||
| BD19 132 | 4005 | 1.13 | 2.02 | 1.860.06 | 1.860.01 | +3.940.81 | +16.970.79 | 1 |
| BD19 290 | 4315 | 0.61 | 3.10 | 2.860.07 | 2.860.13 | +106.280.90 | +111.990.73 | 1 |
| HE 11570518 | 5050 | 2.52 | 2.15 | 2.420.15 | 2.420.16 | +116.020.70 | - | 1 |
| 4900 | 2.00 | – | 2.40 | - | - | - | 2 | |
| HE 13042111 | 4325 | 1.06 | 0.63 | 2.340.10 | 2.340.07 | +2.140.34 | +19.330.59 | 1 |
| HE 13542257 | 4700 | 1.13 | 1.86 | 2.110.17 | 2.110.15 | +289.461.80 | - | 1 |
| BD+19 3109 | 4035 | 0.75 | 2.05 | 2.230.09 | 2.230.02 | 181.891.38 | 187.091.55 | 1 |
| HD 202851 | 4900 | 2.20 | 1.54 | 0.850.11 | 0.850.05 | +22.220.90 | +17.381.22 | 1 |
| 4800 | 2.10 | 1.50 | 0.70 | - | - | - | 3 | |
| 4733 | 1.60 | - | 0.88 | - | - | - | 4 |
We have also estimated the log g value using the standard equation
log (g/g⊙)= log (M/M⊙) + 4log (Teff/Teff⊙) - log (L/L⊙)
We have adopted the solar values log g⊙ = 4.44, Teff⊙ = 5770K and Mbol⊙ = 4.74 mag.
The detailed procedure is given in Shejeelammal et al. (2020).
The luminosity, log (L/L⊙), is calculated using the
V magnitudes taken from SIMBAD astronomical database and the parallaxes () taken from
Gaia DR2 (Gaia Collaboration et al. 2018, https://gea.esac.esa.int/archive/).
The bolometric correction and the interstellar extinction required for the calculation
of luminosity are estimated using the calibration equation of Alonso et al. (1999)
and Chen et al. (1998) respectively. With this calculated luminosity and spectroscopic
temperature estimate, the mass is found from the position of the star
on Hertzsprung - Russell (HR) diagram (log Teff v/s log (L/L⊙)).
The HR diagram is generated using the stellar evolutionary tracks of Girardi et al. (2000).
Thus log g is calculated with this mass using the above equation.
We have used z = 0.0004 tracks for the objects BD19 290 and HE 11570518
and z=0.004 tracks for HD 202851. These HR diagrams are shown
in Figure 3. For the objects BD19 132, HE 13042111,
HE 13542257, and BD+19 3109, we could not determine their masses as the tracks corresponding to their
luminosity and temperatures are not available. The mass estimates and log g values
estimated from the parallax method are given in Table 3.
For our analysis, we have used the spectroscopic log g values.


| Star name | Parallax | log(L/L⊙) | Mass(M⊙) | log g | log g (spectroscopic) | |
|---|---|---|---|---|---|---|
| (mas) | (cgs) | (cgs) | ||||
| BD19 132 | 0.35560.0560 | 2.3950.345 | 2.8540.138 | – | – | 1.13 |
| BD19 290 | 0.14490.0417 | 3.7450.334 | 3.3900.260 | 1.000.40 | 0.540.07 | 0.61 |
| HE 11570518 | 0.07780.0397 | 0.7251.222 | 2.1860.490 | 1.000.60 | 2.020.25 | 2.52 |
| HE 13042111 | 22.75580.040 | 9.2290.004 | 1.7970.002 | – | – | 1.06 |
| HE 13542257 | 0.01500.0514 | 5.6383.231 | 4.1511.292 | – | – | 1.13 |
| BD+19 3109 | 0.37640.0284 | 2.7650.165 | 3.0000.060 | – | – | 0.75 |
| HD 202851 | 2.21600.0982 | 0.9550.999 | 1.5140.040 | 1.050.05 | 2.660.02 | 2.20 |
4 Abundance determination
The elemental abundances are derived by two methods; from the measured equivalent widths of spectral lines due to several elements and the spectral synthesis calculation. The spectral lines of different elements are identified by comparing the spectrum of Arcturus with the spectra of the program stars. The line parameters, excitation potential and oscillator strength (log gf) values, are taken from Kurucz database of atomic line lists (https://lweb.cfa.harvard.edu/amp/ampdata/kurucz23/sekur.html). The abundances from the molecular bands are derived using the spectral synthesis calculation. For the elements showing the hyper-fine splitting (HFS), spectral synthesis calculation is performed in addition to the abundance derived from the equivalent width measurements. In the case of elements with NLTE effects, appropriate NLTE corrections have been applied to the estimated abundances. The details of the abundance derivation of each element along with the details of HFS and the NLTE corrections used are discussed in the following. The derived elemental abundances of the program stars are presented in Table 4 and 5 and the lines used are given in Table 11 and 12. The abundance ratios are calculated with respect to solar value (Asplund et al., 2009).
| BD19 132 | BD19 290 | HE 11570518 | HE 13042111 | |||||||||||
|---|---|---|---|---|---|---|---|---|---|---|---|---|---|---|
| Z | solar log | log | [X/H] | [X/Fe] | log | [X/H] | [X/Fe] | log | [X/H] | [X/Fe] | ||||
| C (C2 band 5165 Å) | 6 | 8.43 | - | - | - | 7.35(syn) | 1.08 | 1.78 | 8.18(syn) | 0.25 | 2.17 | – | – | – |
| C (C2 band 5635 Å) | 6 | 8.43 | 7.27(syn) | 1.16 | 0.70 | 7.58(syn) | 0.85 | 2.01 | 8.45(syn) | 0.02 | 2.44 | 8.33(syn) | 0.10 | 2.24 |
| 12C/13C | – | – | – | – | 18 | – | – | 4 | – | – | – | – | – | – |
| N | 7 | 7.83 | 7.43(syn)(3) | 0.40 | 1.46 | 6.86(syn)(3) | 0.97 | 1.89 | 6.93(syn) | 0.90 | 1.52 | – | – | – |
| O | 8 | 8.69 | 7.06(syn)(1) | 1.63 | 0.23 | 7.17(syn)(1) | 1.52 | 1.34 | – | – | – | – | – | – |
| Na I | 11 | 6.24 | 5.470.07(2) | 0.77 | 1.09 | 4.560.13(2) | 1.68 | 1.18 | – | – | – | 6.730.12(2) | 0.49 | 2.83 |
| Mg I | 12 | 7.60 | 6.320.02(2) | 1.28 | 0.58 | 5.35(1) | 2.25 | 0.61 | 5.45(1) | 2.15 | 0.27 | 5.46(1) | 2.12 | 0.22 |
| Si I | 14 | 7.51 | – | – | – | – | – | – | – | – | – | 5.910.01(2) | 1.60 | 0.74 |
| Ca I | 20 | 6.34 | 5.210.11(4) | 1.13 | 0.73 | 3.930.05(4) | 2.41 | 0.45 | 4.070.13(4) | 2.27 | 0.15 | 4.490.16(2) | 1.85 | 0.49 |
| Sc II | 21 | 3.15 | 2.09(syn)(1) | 1.06 | 0.80 | 1.100.07(syn)(2) | 2.05 | 0.81 | 1.35(syn)(1) | 1.80 | 0.62 | 1.45(syn)(1) | 1.70 | 0.64 |
| Ti I | 22 | 4.95 | 3.680.14(7) | 1.27 | 0.59 | 2.280.0(2) | 2.67 | 0.19 | 2.36(1) | 2.59 | 0.17 | 3.070.14(3) | 1.88 | 0.46 |
| Ti II | 22 | 4.95 | 3.420.13(7) | 1.53 | 0.33 | 2.170.03(3) | 2.78 | 0.08 | 2.590.17(3) | 2.36 | 0.06 | 2.54(1) | 2.41 | 0.07 |
| V I | 23 | 3.93 | 1.93(syn)(1) | 2.00 | 0.14 | 2.13(syn)(1) | 1.80 | 1.06 | 1.75(syn)(1) | 2.18 | 0.24 | 2.990.23(syn)(2) | 0.94 | 1.40 |
| Cr I | 24 | 5.64 | – | – | – | – | – | – | 3.180.11(2) | 2.46 | 0.04 | 4.430.11(4) | 1.21 | 1.13 |
| Cr II | 24 | 5.64 | – | – | – | 3.800.10(2) | 1.84 | 1.02 | – | – | – | – | – | – |
| Mn I | 25 | 5.43 | 3.50(syn)(1) | 1.93 | 0.07 | 3.68(syn)(1) | 1.75 | 1.11 | 3.250.08(syn)(2) | 2.18 | 0.24 | 3.70(syn)(1) | 1.73 | 0.61 |
| Fe I | 26 | 7.50 | 5.640.06(19) | 1.86 | - | 4.640.07(12) | 2.86 | - | 5.080.15(8) | 2.42 | - | 5.160.10(16) | 2.34 | - |
| Fe II | 26 | 7.50 | 5.640.01(2) | 1.86 | - | 4.640.13(2) | 2.86 | - | 5.080.16(2) | 2.42 | - | 5.160.07(3) | 2.34 | - |
| Co I | 27 | 4.99 | 3.01(syn)(1) | 1.98 | 0.12 | – | – | – | – | – | – | – | – | – |
| Ni I | 28 | 6.22 | 4.220.18(4) | 2.00 | 0.14 | 4.120.04(3) | 2.10 | 0.76 | 3.970.10(3) | 2.25 | 0.17 | 4.150.15(4) | 2.07 | 0.27 |
| Cu I | 29 | 4.19 | – | – | – | – | – | – | – | – | – | 1.40(syn)(1) | 2.81 | 0.47 |
| Zn I | 30 | 4.56 | 3.00(1) | 1.56 | 0.30 | 2.33(1) | 2.23 | 0.63 | – | – | – | – | – | – |
| Rb I | 37 | 2.52 | 0.75(syn)(1) | 1.77 | 0.09 | 0.72(syn)(1) | 1.80 | 1.06 | – | – | – | – | – | – |
| Sr INLTE | 38 | 2.87 | 3.07(syn)(1) | 0.20 | 2.06 | – | – | – | – | – | – | – | – | – |
| Y I | 39 | 2.21 | 2.43(syn)(1) | 0.22 | 2.08 | – | – | – | – | – | – | – | – | – |
| Y II | 39 | 2.21 | 2.710.13(3) | 0.50 | 2.36 | 0.380.10(2) | 1.83 | 1.03 | 0.580.08(4) | 1.63 | 0.79 | 0.750.12(2) | 1.46 | 0.88 |
| Zr I | 40 | 2.58 | 2.88(syn)(1) | 0.30 | 2.16 | 1.030.10(2) | 1.55 | 1.31 | – | – | – | 1.770.03(2) | 0.81 | 1.53 |
| Zr II | 40 | 2.58 | 2.290.07(2) | 0.29 | 1.57 | 0.78(syn)(1) | 1.80 | 1.06 | 1.20(syn)(1) | 1.38 | 1.04 | 1.32(syn)(1) | 1.26 | 1.08 |
| Ba IILTE | 56 | 2.18 | 2.66(syn)(1) | 0.48 | 2.34 | 1.03(syn)(1) | 1.15 | 1.71 | 1.50(syn)(2) | 0.68 | 1.74 | 1.420.05(syn)(1) | 0.76 | 1.58 |
| Ba IINLTE | 56 | 2.18 | 2.58(syn)(1) | 0.40 | 2.26 | – | – | – | 1.51(syn)(1) | 0.67 | 1.75 | – | – | – |
| La II | 57 | 1.10 | 1.90(syn)(2) | 0.80 | 2.66 | 0.22(syn)(1) | 0.88 | 1.98 | – | – | – | 0.30(syn)(2) | 0.80 | 1.54 |
| Ce II | 58 | 1.58 | 2.200.13(3) | 0.62 | 2.48 | 0.630.13(4) | 0.95 | 1.91 | 1.000.14(4) | 0.58 | 1.84 | 0.750.12(2) | 0.83 | 1.51 |
| Pr II | 59 | 0.72 | 1.430.11(3) | 0.71 | 2.57 | 0.140.12(2) | 0.86 | 2.00 | 0.180.11(4) | 0.54 | 1.88 | 0.06(1) | 0.90 | 1.44 |
| Nd II | 60 | 1.42 | 2.200.14(6) | 0.78 | 2.64 | 0.530.13(6) | 0.89 | 1.97 | 0.990.14(13) | 0.43 | 1.99 | 0.690.03(2) | 0.73 | 1.61 |
| Sm II | 62 | 2.41 | 1.170.11(6) | 0.21 | 2.07 | 0.190.02(3) | 0.77 | 2.09 | 0.590.19(2) | 0.37 | 2.05 | 0.060.02(2) | 0.90 | 1.44 |
| Eu IILTE | 63 | 0.52 | 0.05(syn)(1) | 0.57 | 1.29 | 1.02(syn)(1) | 1.54 | 1.32 | 0.62(syn)(1) | 1.14 | 1.28 | 0.70(syn)(1) | 1.22 | 1.12 |
Asplund et al. (2009), The number of lines used for abundance determination are given within the parenthesis.
| HE 13542257 | BD+19 3109 | HD 202851 | |||||||||
|---|---|---|---|---|---|---|---|---|---|---|---|
| Z | solar log | log | [X/H] | [X/Fe] | log | [X/H] | [X/Fe] | log | [X/H] | [X/Fe] | |
| C (C2 band 5165 Å) | 6 | 8.43 | 8.40(syn) | 0.03 | 2.08 | 8.69 | 0.26 | 2.49 | 8.30(syn) | 0.13 | 0.72 |
| C (C2 band 5635 Å) | 6 | 8.43 | 8.30(syn) | 0.13 | 1.98 | 8.65 | 0.22 | 2.45 | 8.45(syn) | 0.02 | 0.87 |
| 12C/13C | – | – | – | – | – | – | – | 9 | – | – | 42 |
| N | 7 | 7.83 | 6.23(syn) | 1.60 | 0.51 | 7.83(syn)(3) | 0.00 | 2.23 | 8.400.02(syn)(3) | 0.57 | 1.42 |
| O | 8 | 8.69 | 7.09(syn)(1) | 1.60 | 0.51 | – | – | – | 8.19(syn)(1) | 0.50 | 0.35 |
| Na I | 11 | 6.24 | 4.710.06(2) | 1.53 | 0.58 | 4.130.02(2) | 2.11 | 0.12 | 5.920.08(3) | 0.32 | 0.53 |
| Mg I | 12 | 7.60 | 5.47(1) | 2.13 | 0.02 | 6.130.14(3) | 1.47 | 0.76 | 7.020.10(2) | 0.58 | 0.27 |
| Si I | 14 | 7.51 | 5.890.16(2) | 1.62 | 0.49 | – | – | – | 6.63(1) | 0.88 | 0.03 |
| Ca I | 20 | 6.34 | 4.450.13(7) | 1.89 | 0.22 | 4.200.11(7) | 2.14 | 0.09 | 5.460.14(8) | 0.88 | 0.03 |
| Sc II | 21 | 3.15 | 1.05(syn)(1) | 2.10 | 0.01 | 1.45(syn)(1) | 1.70 | 0.53 | 2.86(syn)(1) | 0.29 | 0.56 |
| Ti I | 22 | 4.95 | 2.60(1) | 2.35 | 0.24 | 3.450.10(6) | 1.50 | 0.73 | 4.370.15(13) | 0.58 | 0.27 |
| Ti II | 22 | 4.95 | 2.700.07(4) | 2.25 | 0.14 | 3.140.13(5) | 1.81 | 0.42 | 4.400.17(9) | 0.55 | 0.30 |
| V I | 23 | 3.93 | 2.95(syn)(2) | 0.98 | 1.13 | 1.83(syn)(1) | 2.10 | 0.13 | 2.75(syn)(1) | 1.18 | 0.33 |
| Cr I | 24 | 5.64 | – | – | – | 2.830.09(7) | 2.81 | 0.58 | 5.250.13(9) | 0.39 | 0.46 |
| Cr II | 24 | 5.64 | 4.300.08(2) | 1.34 | 0.77 | – | – | – | 5.200.19(3) | 0.44 | 0.41 |
| Mn I | 25 | 5.43 | 3.59(syn)(1) | 1.84 | 0.27 | 3.13(syn)(2) | 2.30 | 0.07 | 4.71(syn)(1) | 0.72 | 0.13 |
| Fe I | 26 | 7.50 | 5.390.17(20) | 2.11 | - | 5.270.09(27) | 2.23 | - | 6.650.01(30) | 0.85 | - |
| Fe II | 26 | 7.50 | 5.390.15(4) | 2.11 | - | 5.270.02(3) | 2.23 | - | 6.650.07(3) | 0.85 | - |
| Co I | 27 | 4.99 | 3.59(syn)(1) | 1.40 | 0.71 | 3.200.07(3) | 1.79 | 0.44 | 4.30(syn)(1) | 0.69 | 0.16 |
| Ni I | 28 | 6.22 | 3.810.20(3) | 2.41 | 0.30 | 4.460.12(3) | 1.76 | 0.47 | 5.800.12(11) | 0.42 | 0.43 |
| Cu I | 29 | 4.19 | – | – | – | – | – | – | 2.85(syn)(1) | 1.34 | 0.49 |
| Zn I | 30 | 4.56 | 2.50(1) | 2.06 | 0.05 | 2.48(1) | 2.08 | 0.15 | 3.48(1) | 1.08 | 0.23 |
| Rb I | 37 | 2.52 | – | – | – | 0.20(syn)(1) | 2.32 | 0.09 | 1.49(syn)(1) | 1.03 | 0.18 |
| Sr INLTE | 38 | 2.87 | 2.44(syn)(1) | 0.43 | 1.68 | – | – | – | 3.12(syn)(1) | 0.25 | 1.10 |
| Y I | 39 | 2.21 | 2.18(syn)(1) | 0.03 | 2.08 | 1.16(syn)(1) | 1.05 | 1.18 | 2.44(syn)(1) | 0.23 | 1.08 |
| Y II | 39 | 2.21 | – | – | – | 1.420.16(3) | 0.79 | 1.44 | 3.050.08(4) | 0.84 | 1.69 |
| Zr I | 40 | 2.58 | 2.27(syn)(1) | 0.37 | 1.80 | 0.98(syn)(1) | 1.60 | 0.63 | 3.50(syn)(1) | 0.92 | 1.77 |
| Zr II | 40 | 2.58 | – | – | – | 1.28(1)(1) | 1.30 | 0.93 | 3.79(syn)(1) | 1.21 | 2.06 |
| Ba IILTE | 56 | 2.18 | 1.70(syn)(2) | 0.48 | 1.63 | 1.68(syn)(1) | 0.60 | 1.73 | 3.50(syn)(1) | 1.32 | 2.17 |
| Ba IINLTE | 56 | 2.18 | – | – | – | – | – | – | 3.15(syn)(1) | 0.97 | 1.82 |
| La II | 57 | 1.10 | 0.40(syn)(1) | 0.70 | 1.41 | 0.50(syn)(1) | 0.60 | 1.63 | 1.85(syn)(2) | 0.75 | 1.60 |
| Ce II | 58 | 1.58 | 1.170.07(4) | 0.41 | 1.70 | 0.920.11(7) | 0.66 | 1.57 | 2.620.14(8) | 1.04 | 1.89 |
| Pr II | 59 | 0.72 | 0.140.09(3) | 0.58 | 1.53 | 0.230.12(4) | 0.49 | 1.74 | 2.040.14(4) | 1.32 | 2.17 |
| Nd II | 60 | 1.42 | 0.980.13(9) | 0.44 | 1.67 | 0.820.09(14) | 0.60 | 1.63 | 2.380.11(9) | 0.96 | 1.81 |
| Sm II | 62 | 2.41 | 0.500.08(3) | 0.46 | 1.65 | 0.380.11(8) | 0.58 | 1.65 | 1.830.09(6) | 0.87 | 1.72 |
| Eu IILTE | 63 | 0.52 | 1.12(syn)(1) | 1.64 | 0.47 | 0.99(syn)(1) | 1.51 | 0.72 | 0.56(syn)(1) | 0.04 | 0.89 |
| Eu IINLTE | 63 | 0.52 | 1.16(syn)(1) | 1.68 | 0.43 | – | – | – | – | – | – |
Asplund et al. (2009), The number of lines used for abundance determination are given within the parenthesis.
4.1 Light elements: C, N, O, 12C/13C, Na, -, and -peak elements
The abundance of oxygen is derived from the spectral synthesis calculation of [O I] 6300.304 Å line. This line is insensitive to NLTE effect. The other oxygen forbidden line at 6363.776 Å is not usable for the abundance determination in any of the program stars. The O I triplet lines around 7770 Å was not good in the stars BD19 132, BD19 290, BD+19 3109, and HD 202851. In the other three stars this region is absent as the SUBARU spectra is limited up to 6850 Å. We could determine the oxygen abundance only in four stars: BD19 132, BD19 290, HE 13542257, and HD 202851, with BD19 290 showing the highest enhancement of [O/Fe]1.34. In other three stars [O/Fe] ranges from 0.23 to 0.51.
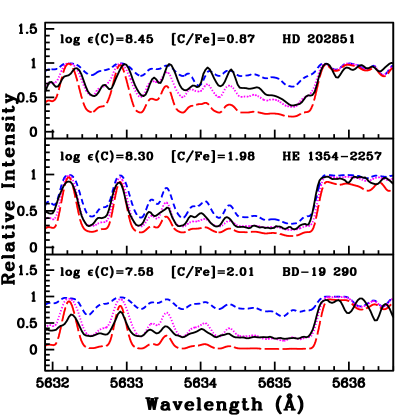
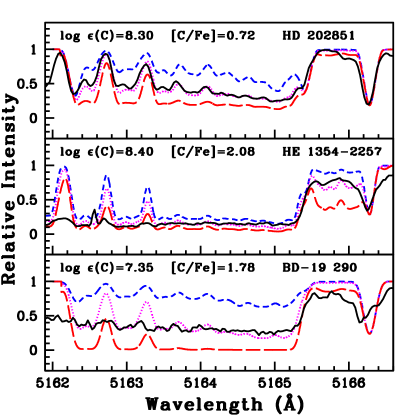
Once the oxygen abundance is determined, the carbon abundance is derived from the C2 molecular bands at 5165 and 5635 Å by spectral synthesis calculation. The spectral synthesis fits for these two regions for a few program stars are shown in Figure 4. The C2 bands at 5165 Å is noisy in the spectra of BD19 132 and HE 13042111; so we could not use this region in these stars. In all other stars, we derived the carbon abundance from both the regions. The abundances derived from these two bands are consistent within 0.3 dex. The average abundance from these two C2 regions is taken as the final carbon abundance. All the stars except BD19 132 and HD 202851 show [C/Fe]1, with BD+19 3109 being the most carbon enhanced with [C/Fe]2.47.
The nitrogen abundance is derived from the 12CN lines at 8000 Å region in the program stars that are observed with HESP and from 12CN band at 4215 Å region in the spectra obtained with SUBARU. We could determine nitrogen abundance in all the stars except HE 13042111. Except HE 13542257, all other stars show [N/Fe]1. Once the carbon, nitrogen, and oxygen abundances are derived, we re-derived the oxygen abundance. Then with this oxygen abundance carbon and then nitrogen abundances are re-estimated. This iterative process is done until a convergence is obtained.
The 12CN lines at 8003.292, 8003.553, 8003.910 Å, and 13CN lines at 8004.554, 8004.728, 8004.781 Å are used to derive the carbon isotopic ratio, 12C/13C in the HSEP spectra of the stars that cover these regions. The SUBARU spectra used for three objects, however extend only till 6800 Å in the wavelength region. The values obtained for this ratio in BD19 132, BD19 290, BD+19 3109, and HD 202851 are 18, 4, 9, and 42 respectively. These estimates are consistent with what is expected from the evolutionary stages of the program stars and also consistent with the values in the range 2.5 - 40 (Bisterzo et al., 2011) for CEMP-s and CEMP-r/s stars.
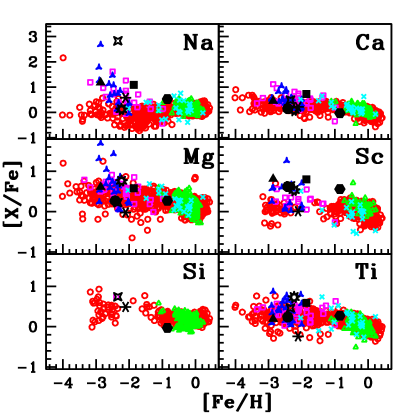
The equivalent width measurement of several lines listed in Table 12 are used to derive the abundance of Na, Mg, Si, Ca, Ti, Cr, Ni, and Zn. We could not estimate sodium abundance in HE 11570518. The star HE 13042111 shows the largest enhancement of Na with [Na/Fe]2.83. The lines used to derive the Na abundance in this star were very strong, so this abundance may not be reliable. The NLTE corrections of these lines were not available. The stars, BD19 132 and BD19 290 have [Na/Fe]1. The Mg abundance of the program stars are in the range 0.02[Mg/Fe]0.61, similar to that observed in the normal stars in the Galaxy (Figure 5).
The elements Sc, V, Mn, Co, and Cu show HFS. The abundances of these elements are derived using the spectral synthesis calculation, taking the hyper-fine components into account. The hyper-fine components of these elements are taken from Prochaska & McWilliam (2000) and Prochaska et al. (2000). Sc abundance is derived mainly from the Sc II lines at 6245.637, 6309.920, and 6604.601 Å. It shows solar value in the star HE 13542257, while it is enhanced in all other stars with values ranging from 0.53 to 0.81. Spectral synthesis calculation of the V I lines at 4864.731, 5727.048, and 6251.827 Å are used to derive the vanadium abundance. Three objects in our sample, BD19 290, HE 13042111, and HE 13542257 show [V/Fe]1, whereas it is slightly under-abundant in HD 202851 and near-solar in the other stars. The Mn abundance is estimated from the Mn I lines at 4761.530, 6013.513, and 6021.89 Å. We have derived the Co abundance from Co I lines at 5342.695, and 5483.344 Å and Cu abundance from Cu I line at 5105.537 Å. In the case of BD+19 3109, cobalt abundance is derived from the lines Co I 4792.846, 4867.872, and 4792.846 Å. A comparison of the light element abundances observed in our program stars with their counterparts in normal stars and other classes of chemically peculiar stars are shown in Figure 5. While the estimated abundances of the elements Mg, Si, Ca, Sc, Ti, Co, Ni, and Zn in all the program stars follow the Galactic trend (similar to that observed in normal stars), Na, V, Cr, and Mn are enhanced in a few program stars. Such enhancements of Na and Fe-peak elements are observed in a few CEMP stars such as HE 13272326 (Aoki et al., 2006; Frebel et al., 2008) and SMSS J031300.36670839.3 (Bessell et al., 2015). The models of spinstar (Maeder et al., 2015; Maeder & Meynet, 2015), faint SNe (Iwamoto et al., 2005; Tominaga et al., 2007; Bessell et al., 2015) have been used to reproduce their observed abundance pattern. According to Aoki et al. (2006), either faint SNe or AGB-binary mass transfer along with the accretion of metals from ISM might explain the observed abundance pattern of HE 13272326. Choplin et al. (2017) have suggested that spinstar could also have played a role in the formation of some CEMP-s stars and the abundance patterns of CEMP-s stars may be resulting from several sources. From these facts, the observed enhanced abundances of Na, V, Cr, and Mn in the program stars BD19 290, HE 13042111 and HE 13542257 may be attributed to the pre-enriched ISM from which they were formed. Also, some of the CEMP-(s&r/s) stars show enhanced abundances of Na at low metallicities (Bisterzo et al. 2011 and references therein, Allen et al. 2012, Karinkuzhi et al. 2021). A discussion on the Na abundance is provided in section 8.3.
4.2 Heavy elements
4.2.1 The light s-process elements: Rb, Sr, Y, Zr
The spectral synthesis calculation of Rb I 7800.259 Å resonance line is used to derive the rubidium abundance in the program stars, by taking the hyper-fine components from Lambert & Luck (1976). Rb I 7947.597 Å was blended and could not be used for the abundance determination. We could determine Rb abundance only in the stars whose spectra are from HCT/HESP. It is enhanced in BD19 290 with [Rb/Fe]1, shows near-solar value in other three stars: BD19 132, BD+19 3109, and HD 202851.
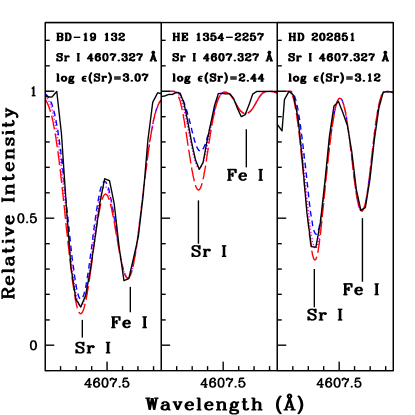
Strontium abundance is derived from the spectral synthesis calculation of Sr I 4607.327 Å line with log value taken from Bergemann et al. (2012). We could estimate strontium abundance only in three objects; BD19 132, HE 13542257, and HD 202851 and they show [Sr/Fe]1. It has been proven that the Sr I lines are affected by NLTE effects (Barklem & O’Mara, 2000; Short & Hauschildt, 2006). The NLTE corrections of Sr I 4607.327 Å line is adopted from Bergemann et al. (2012). They have calculated the NLTE corrections for different combinations of stellar atmospheric parameters for four different stars. For the star HD 122563, the NLTE correction is +0.47 dex, which has got similar atmospheric parameters (Teff = 4600 K, log g = 1.60, = 1.80 km s-1, [Fe/H] = 2.50) as BD19 132 and HE 13542257. For these two stars, we have applied this correction term to our estimated abundance of Sr. For the star HD 202851, the NLTE correction (+0.32 dex) has been taken from the Table 3 of Bergemann et al. (2012) which corresponds to a similar combination of atmospheric parameters as HD 202851. The spectrum synthesis fit for Sr I 4607.327 Å line for the program stars are shown in Figure 6
The yittrium abundance is derived from Y I 6435.004 Å line and the equivalent width measurement of the Y II lines listed in Table 12. We could not estimate Y I abundances in BD19 290, HE 11570518, and HE 13042111 and Y II abundance in HE 13542257 as no good lines are detected in their spectra due to these species. The abundance derived from Y II lines are higher than that estimated from Y I lines wherever we could use both the species. It is enhanced in all the program stars with [X/Fe]0.79. The zirconium abundance is estimated using the spectral synthesis calculation of Zr I 6134.585 Å and Zr II 5112.297 Å and equivalent width measurement of several Zr I and Zr II lines whenever available. We could not estimate Zr I abundance in HE 11570518 and Zr II abundance in HE 13542257. The abundance estimated from Zr I lines are in the range 0.63 - 2.16 and that from Zr II lines are in the range 0.93 - 2.06.
4.2.2 The heavy s-process elements: Ba, La, Ce, Pr, Nd
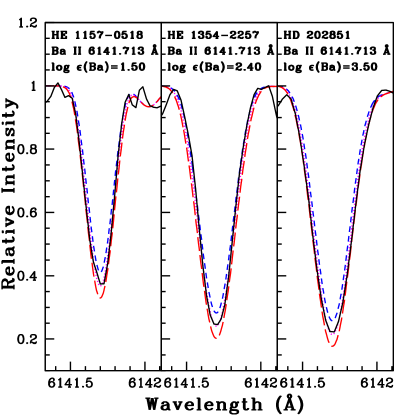
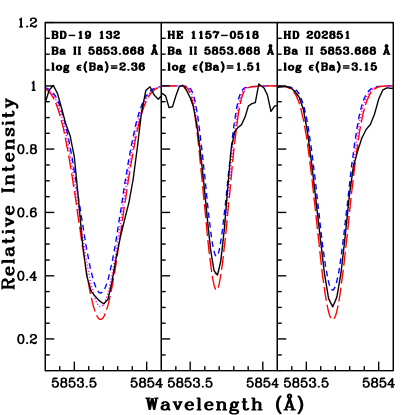
The barium abundance is derived from the spectral synthesis calculation of Ba II 5853.668 Å line in BD19 132, HE 11570518, and HD 202851. This line is blended in all other stars and could not be used for abundance determination. This line is known to be affected by NLTE effect. The NLTE correction to the abundance derived from this line is adopted from Andrievsky et al. (2009), which are +0.22, +0.41, and +0.35 dex respectively for the above objects. The Ba II 6141.713, 4934.076, and 6496.897 Å lines are also used for the estimation of Ba abundance. The line list for Ba II 6496.897 Å line is taken from linemake 333linemake contains laboratory atomic data (transition probabilities, hyperfine and isotopic substructures) published by the Wis- consin Atomic Physics and the Old Dominion Molecular Physics groups. These lists and accompanying line list assembly software have been developed by C. Sneden and are curated by V. Placco at https://github.com/vmplacco/linemake. atomic and molecular line database (Placco et al., 2021). The hyper-fine components of other lines are taken from McWilliam (1998). Barium is enhanced in all the program stars with [Ba/Fe]1. The spectral synthesis fits for Ba II 5853.668 and 6141.713 Å lines are shown in Figure 7.
Spectral synthesis calculation of La II 4748.726, 5259.379, 4921.776, 5301.969, 5303.528 Å lines, whenever available, is used to derive the abundance of lanthanum in the program stars. The hyper-fine components of La II 4921.776 Å line are taken from Jonsell et al. (2006) and 5301.969, 5303.528 Å lines from Lawler et al. (2001), whereas it is not available for 4748.726 and 5259.379 Å lines. We could not find any useful lines due to La in the star HE 11570518 for abundance determination. In all other stars it is enhanced with [La/Fe]1.41 with BD19 132 showing the highest enhancement of [La/Fe]2.66. Equivalent width measurement of several spectral lines were used to derive the abundances of Ce, Pr, and Nd. All these elements are enhanced in all our program stars with [X/Fe]1.40.
Finally, the [ls/Fe], [hs/Fe], and [hs/ls] ratios of the program stars are estimated, where ls is the light s-process elements; Sr, Y, and Zr and hs is the heavy s-process elements; Ba, La, Ce, and Nd. We have also estimated [s/Fe] ratio, an indicator of total s-process content of the star (s refers to the s-process elements Sr, Y, Zr, Ba, La, Ce, and Nd). The neutron-density dependent [Rb/Zr] ratio is also estimated. The values for these ratios are given in Table 6. These ratios are discussed in section 8.
| Star name | [Fe/H] | [ls/Fe] | [hs/Fe] | [s/Fe] | [hs/ls] | [Rb/Zr] |
|---|---|---|---|---|---|---|
| BD19 132 | 1.86 | 1.38 | 2.52 | 2.34 | 1.14 | 2.07 |
| BD19 290 | 2.86 | 1.05 | 1.89 | 1.61 | 0.84 | 0.25 |
| HE 11570518 | 2.42 | 1.27 | 1.86 | 1.37 | 0.59 | – |
| HE 13042111 | 2.34 | 0.98 | 1.56 | 1.37 | 0.58 | – |
| HE 13542257 | 2.11 | 1.85 | 1.61 | 1.71 | 0.24 | – |
| BD+19 3109 | 2.23 | 0.91 | 1.64 | 1.40 | 0.73 | 0.72 |
| HD 202851 | 0.85 | 1.31 | 1.83 | 1.61 | 0.52 | 1.95 |
4.2.3 The r-process elements: Sm, Eu
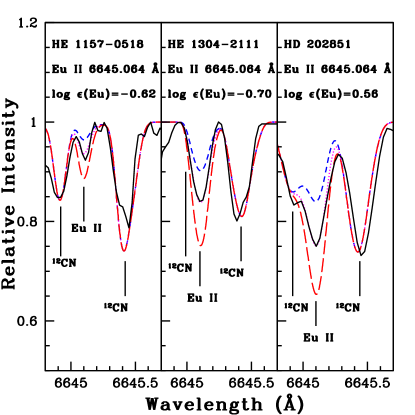
The abundance of samarium is derived from the equivalent width measurement of Sm II lines listed in Table 12. The [Sm/Fe] values in our program stars are in the range 1.44 - 2.09. The europium abundance is derived from the spectral synthesis calculation of Eu II 6645.064 Å line in all our program stars. In HE 13542257, we could use Eu II 4129.725 Å line also. In all other program stars, this line is not usable for abundance determination. This line shows NLTE effect and the appropriate correction (+0.16) has been adopted from Mashonkina et al. (2008). None of the stars has good Eu II 6437.640 Å line usable for abundance determination. The hyper-fine components of Eu are taken from Worley et al. (2013). All the stars show enhancement of Eu with [Eu/Fe]0.7 except the star HE 13542257 where it is moderately enhanced with [Eu/Fe]0.47. The spectral synthesis fits for Eu II 6645.064 Å line are shown in Figure 8.
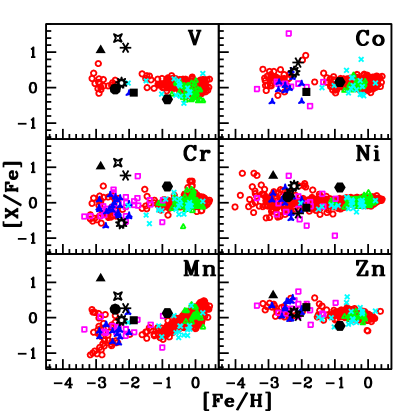
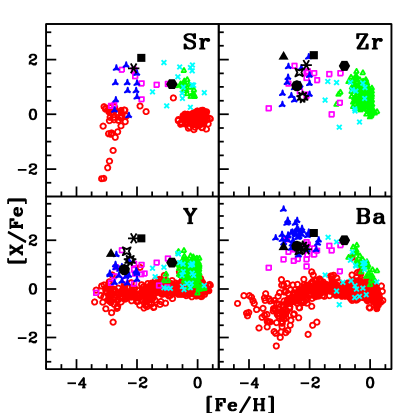
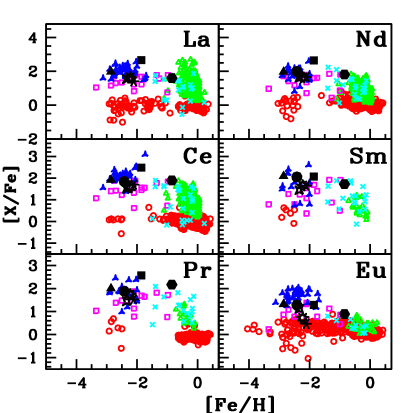
In Tables 4 ad 5, the abundances derived from the lines showing NLTE effect are given separately after the NLTE correction. Figure 9 shows a comparison of the observed abundances of heavy elements in our program stars with their counterparts in normal stars and other chemically peculiar stars. From the figure, it is clear that our program stars show clear over-abundance of heavy elements with respect to the normal stars. A comparison of the elemental abundances in the program stars with the literature value is given in Table 7.
| Star name | [Fe /H] | [C/Fe] | [N/Fe] | [Mg/Fe] | [Ca/Fe] | [Ti/Fe] | [Cr/Fe] | Ref. |
|---|---|---|---|---|---|---|---|---|
| HE 11570518 | 2.42 | 2.31 | 1.52 | 0.27 | 0.15 | 0.06 | 0.04 | 1 |
| 2.40 | 2.15 | 1.56 | 0.50 | 0.16 | 0.09 | 0.28 | 2 | |
| HD 202851 | 0.85 | 0.72 | 1.42 | 0.27 | 0.03 | 0.30 | 0.46 | 1 |
| 0.70 | - | - | - | - | 0.00 | 0.20 | 3 |
| Star name | [Fe /H] | [Y/Fe] | [Ba/Fe] | [La/Fe] | [Ce/Fe] | [Nd/Fe] | Ref. |
|---|---|---|---|---|---|---|---|
| HE 11570518 | 2.42 | 0.79 | 1.75 | - | 1.84 | 1.99 | 1 |
| 2.40 | - | 2.14 | - | - | - | 2 | |
| HD 202851 | 0.85 | 1.08 | 2.00 | 1.60 | 1.89 | 1.81 | 1 |
| 0.70 | 1.30 | 1.60 | 1.40 | 1.30 | 1.60 | 3 |
5 ABUNDANCE UNCERTAINTIES
The uncertainties on the abundances of all the elements, log, are
calculated following the detailed procedure in Shejeelammal et al. (2020).
The uncertainty in the abundance of an element is given by;
= + + + +
where Teff 100 K, log g 0.2 dex,
0.2 km s-1, and [Fe/H] 0.1 dex are the typical uncertainties
in the atmospheric parameters. The = ,
is the random error in the elemental abundance which arises from the line-to-line
scatter (standard deviation, ) of the abundances of a particular
element species derived from N number of lines.
Finally, total uncertainty in [X/Fe] is calculated by;
= + .
In order to simplify the calculation, we made the assumption that the uncertainties due to different parameters are independent, following de Castro et al. (2016), Karinkuzhi et al. (2018), Cseh et al. (2018). However, since most of the stellar atmospheric parameters are correlated, our estimates are to be taken as upper limits. The differential abundances, log, for the variations in each stellar atmospheric parameters calculated for the star HD 202851 is given in Table 8.
| Element | Teff | log g | [Fe/H] | ()1/2 | ||
|---|---|---|---|---|---|---|
| (100 K) | (0.2 dex) | (0.2 kms-1) | (0.1 dex) | |||
| C | 0.07 | 0.10 | 0.10 | 0.10 | 0.19 | 0.24 |
| N | 0.13 | 0.03 | 0.00 | 0.02 | 0.14 | 0.20 |
| O | 0.00 | 0.04 | 0.02 | 0.00 | 0.05 | 0.15 |
| Na I | 0.06 | 0.02 | 0.06 | 0.01 | 0.10 | 0.17 |
| Mg I | 0.07 | 0.06 | 0.07 | 0.01 | 0.10 | 0.17 |
| Si I | 0.01 | 0.01 | 0.07 | 0.01 | 0.07 | 0.16 |
| Ca I | 0.09 | 0.02 | 0.09 | 0.01 | 0.14 | 0.20 |
| Sc II | 0.03 | 0.08 | 0.10 | 0.03 | 0.14 | 0.21 |
| Ti I | 0.13 | 0.01 | 0.07 | 0.02 | 0.16 | 0.21 |
| Ti II | 0.01 | 0.07 | 0.11 | 0.03 | 0.15 | 0.21 |
| V I | 0.15 | 0.01 | 0.04 | 0.02 | 0.16 | 0.21 |
| Cr I | 0.12 | 0.01 | 0.09 | 0.01 | 0.16 | 0.21 |
| Cr II | 0.07 | 0.08 | 0.03 | 0.02 | 0.16 | 0.22 |
| Mn I | 0.10 | 0.03 | 0.13 | 0.01 | 0.17 | 0.22 |
| Fe I | 0.09 | 0.01 | 0.11 | 0.00 | 0.14 | – |
| Fe II | 0.09 | 0.09 | 0.07 | 0.05 | 0.16 | – |
| Co I | 0.09 | 0.01 | 0.03 | 0.00 | 0.10 | 0.17 |
| Ni I | 0.07 | 0.01 | 0.08 | 0.00 | 0.11 | 0.18 |
| Cu I | 0.14 | 0.01 | 0.18 | 0.01 | 0.23 | 0.27 |
| Zn I | 0.04 | 0.05 | 0.09 | 0.02 | 0.11 | 0.18 |
| Rb I | 0.10 | 0.00 | 0.03 | 0.00 | 0.11 | 0.18 |
| Sr I | 0.14 | 0.02 | 0.16 | 0.02 | 0.22 | 0.26 |
| Y I | 0.16 | 0.00 | 0.01 | 0.01 | 0.16 | 0.22 |
| Y II | 0.00 | 0.05 | 0.14 | 0.03 | 0.16 | 0.22 |
| Zr I | 0.11 | 0.01 | 0.10 | 0.02 | 0.15 | 0.21 |
| Zr II | 0.01 | 0.06 | 0.19 | 0.02 | 0.20 | 0.26 |
| Ba II | 0.03 | 0.02 | 0.07 | 0.05 | 0.10 | 0.19 |
| La II | 0.02 | 0.08 | 0.09 | 0.03 | 0.13 | 0.20 |
| Ce II | 0.01 | 0.07 | 0.13 | 0.03 | 0.16 | 0.22 |
| Pr II | 0.02 | 0.08 | 0.11 | 0.03 | 0.16 | 0.22 |
| Nd II | 0.02 | 0.07 | 0.14 | 0.03 | 0.16 | 0.23 |
| Sm II | 0.01 | 0.08 | 0.08 | 0.03 | 0.12 | 0.20 |
| Eu II | 0.02 | 0.08 | 0.02 | 0.03 | 0.09 | 0.18 |
6 Kinematic Analysis
It is equally as important as the chemical composition of a star to understand its kinematics and the Galactic population to which it belongs. We have calculated the components of the spatial velocities of the program stars with respect to the Local Standard of Rest (LSR), ULSR, VLSR, and WLSR, following the procedures discussed in Johnson & Soderblom (1987) and Bensby et al. (2003).
The spatial velocity components with respect to the LSR is given by;
km/s.
(U, V, W)⊙ = (11.1, 12.2, 7.3) km/s is the solar motion with respect to LSR (Schönrich et al., 2010).
Total space velocity is calculated as;
.
The membership of the stars to each Galactic population is determined following the probability calculations given in Mishenina et al. (2004), Bensby et al. (2003, 2004), and Reddy et al. (2006). The proper motions in RA and DEC ( and ), parallax () are taken from SIMBAD astronomical database and Gaia DR2 (Gaia Collaboration et al. 2018, https://gea.esac.esa.int/archive/). The detailed procedure can be found in Shejeelammal et al. (2021). The components of the spatial velocity, total space velocity and probability that a star belongs to a particular Galactic population are presented in Table 9. While the stars BD19 290, HE 11570518, HE 13542257, and BD+19 3109 belong to the Galactic halo, BD19 132, HE 13042111, and HD 202851 belong to the Galactic thin disk.
| Star name | ULSR | VLSR | WLSR | Vspa | Pthin | Pthick | Phalo |
|---|---|---|---|---|---|---|---|
| (kms-1) | (kms-1) | (kms-1) | (kms-1) | ||||
| BD19 132 | 13.661.06 | 69.1312.91 | 6.751.79 | 70.7912.56 | 0.90 | 0.10 | 0.00 |
| BD19 290 | 252.6068.56 | 573.19168.57 | 38.0016.68 | 627.56182.56 | 0.00 | 0.00 | 1.00 |
| HE 11570518 | 113.9669.93 | 449.47202.19 | 154.28130.96 | 488.68241.24 | 0.00 | 0.00 | 1.00 |
| HE 13042111 | 2.680.18 | 41.470.25 | 32.030.27 | 52.470.35 | 0.92 | 0.08 | 0.00 |
| HE 13542257 | 695.993045.67 | 1855.035913.33 | 295.051636.19 | 2003.144853.64 | 0.00 | 0.00 | 1.00 |
| BD+19 3109 | 122.651.87 | 253.6413.83 | 41.6611.43 | 284.8011.44 | 0.00 | 0.01 | 0.99 |
| HD 202851 | 64.351.90 | 38.172.92 | 40.821.68 | 85.230.68 | 0.72 | 0.28 | 0.00 |
7 Classification of the program stars
All the stars analyzed here are metal-poor objects with [Fe/H]1, except
HD 202851 which has a metallicity of [Fe/H]0.85. Five objects
in the sample are very metal-poor with [Fe/H]2.
All the stars in our sample show enhanced abundance of carbon with
[C/Fe]0.70. According to Beers & Christlieb (2005), the stars
with [Fe/H]2 and [C/Fe]1 are Carbon Enhanced Metal-Poor (CEMP) stars.
However, a number of stars with [Fe/H]1 are identified as CEMP stars in literature
(Jonsell et al., 2006; Goswami et al., 2006; Aoki et al., 2007; Goswami & Aoki, 2010; Masseron et al., 2010; Abate et al., 2016; Shejeelammal et al., 2021; Karinkuzhi et al., 2021) etc..
Several authors have adopted different lower limits for [C/Fe] ratio to define the CEMP
stars, for instance, [C/Fe]0.7 (Carollo et al., 2012; Lee et al., 2013; Norris et al., 2013a; Skúladóttir et al., 2015),
[C/Fe]0.9 (Jonsell et al., 2006; Masseron et al., 2010), [C/Fe]1
(Abate et al., 2016; Hansen et al., 2019). However, in the case of
evolved metal-poor giants, the carbon abundance will be lower compared to their
earlier evolutionary stages due to the internal mixing of the CNO processed
material from the stellar interiors (Gratton et al., 2000; Spite et al., 2005, 2006; Aoki et al., 2007; Placco et al., 2014).
This will be discussed in detail in the next section.
So while setting the limit for the [C/Fe] ratio of CEMP stars, the evolutionary stage of the
star should also be taken care of. Aoki et al. (2007) have taken into consideration the
luminosity of the star, which represents the evolutionary stage,
to account for the depletion of surface carbon to
set a threshold [C/Fe] that defines CEMP star population.
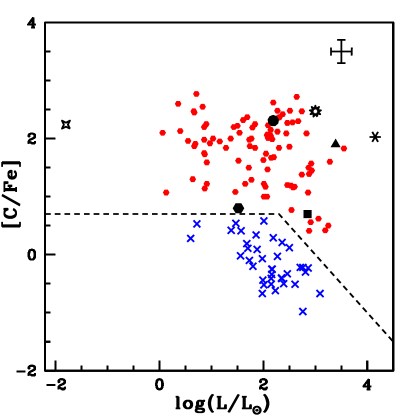
The following empirical definition is given by Aoki et al. (2007) for the CEMP stars;
(i) [C/Fe]+0.7; if log(L/L2.3
(ii) [C/Fe]+3.0log(L/L; if log(L/L2.3
We have adopted this criteria to define the CEMP stars in our sample, which is demonstrated in Figure 10. It is clear from the figure that CEMP stars and non-carbon-enhanced metal-poor stars belong to two different regions of the diagram. Even though the star HD 202851 shows a [C/Fe] value that resembles CEMP stars according to this definition, because of its higher metallicity, [Fe/H]0.85, we classify it as a CH star, whereas all other six stars in our sample are CEMP stars.
There exist a number classification scheme in literature
for the sub-classification of CEMP stars (Abate et al., 2016; Frebel, 2018; Hansen et al., 2019), the Beers & Christlieb (2005) being
the pioneering one. Beers & Christlieb (2005) and Abate et al. (2016) considered
[Ba/Fe], [Eu/Fe], and [Ba/Eu] ratios to define CEMP sub-classes,
Hansen et al. (2019) considered [Sr/Ba] ratio, and Frebel (2018) considered [Sr/Ba], [Sr/Eu],
[Ba/Pb], and [La/Eu] ratios. Goswami et al. (2021) revisited
all these classification schemes and came up with a slightly modified criteria in terms of
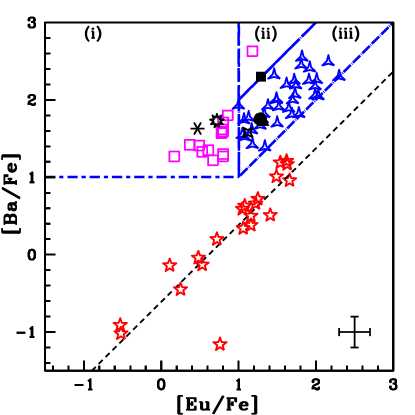
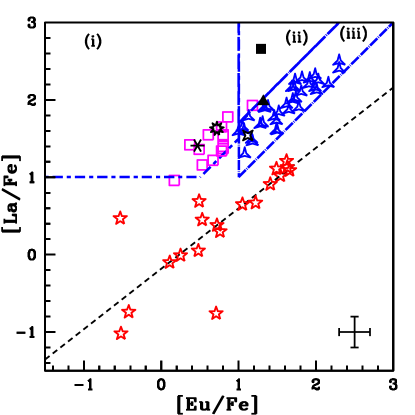
[Ba/Eu] and [La/Eu]. We adopted this scheme to sub-classify our CEMP stars which is as follows;
-CEMP-s; [Ba/Fe]1
(i) [Eu/Fe]1, [Ba/Eu]0 and/or [La/Eu]0.5
(ii) [Eu/Fe]1, [Ba/Eu]1 and/or [La/Eu]0.7
-CEMP-r/s; [Ba/Fe]1, [Eu/Fe]1
(i) 0[Ba/Eu]1 and/or 0[La/Eu]0.7
Figure 11 depicts this classification scheme. The regions marked as (i) and (ii) are two CEMP-s star regions corresponding to the above mentioned conditions (i) and (ii) respectively and the region marked as (iii) corresponds to CEMP-r/s stars. In this figure, the stars BD19 290, HE 11570518, and HE 13042111 occupy the region (iii), and they are found to be CEMP-r/s stars. We could not locate the position of the star HE 11570518 in the [La/Fe] - [Eu/Fe] plot as La abundance could not be estimated in this star. The objects HE 13542257 and BD+19 3109 clearly lie in the region (i) in both the panels and they are CEMP-s stars. The star BD19 132 lies marginally in region (ii) in the [Ba/Fe] - [Eu/Fe] plot, but it clearly lies in the region (ii) in the [La/Fe] - [Eu/Fe] plot; hence it is identified as a CEMP-s star. The estimated [Ba/Eu], [La/Eu] ratios of the program stars are given in Table 10.
| Star name | [Fe/H] | [C/Fe] | [Ba/Fe] | [Eu/Fe] | [Ba/Eu] | [La/Eu] |
|---|---|---|---|---|---|---|
| BD19 132 | 1.86 | 0.70 | 2.30 | 1.29 | 1.01 | 1.37 |
| BD19 290 | 2.86 | 1.90 | 1.71 | 1.32 | 0.39 | 0.60 |
| HE 11570518 | 2.42 | 2.31 | 1.75 | 1.28 | 0.47 | – |
| HE 13042111 | 2.34 | 2.24 | 1.58 | 1.12 | 0.46 | 0.42 |
| HE 13542257 | 2.11 | 2.03 | 1.63 | 0.47 | 1.16 | 0.94 |
| BD+19 3109 | 2.23 | 2.47 | 1.73 | 0.72 | 1.01 | 0.85 |
| HD 202851 | 0.85 | 0.80 | 2.00 | 0.89 | 1.11 | 0.71 |
8 abundance analysis and discussion
The detailed analysis of the abundance profiles of the program stars and their interpretation are discussed here.
8.1 CNO abundances
As mentioned in the previous section, the surface carbon abundance (as well as nitrogen and oxygen abundances) of a star is related to its evolutionary stage. When a star evolves into a red giant, the surface carbon abundance decreases due to the internal mixing that brings the CNO processed material from the stellar interiors to the surface, known as First Dredge-Up (FDU). Some extra mixing processes in addition to the internal mixing is also found to operate in more evolved giants. Here the mixing between the surface and the hydrogen burning layer where C is converted to N through CNO cycle in the upper RGB stars tends to decrease the carbon abundance further (Charbonnel, 1995). This has been observed in more evolved metal-poor field giants (Charbonnel et al., 1998; Gratton et al., 2000; Spite et al., 2005, 2006) and Globular and open cluster giants (Gilroy, 1989; Grundahl et al., 2002; Shetrone, 2003; Jacobson et al., 2005). This internal mixing processes result in an increase of nitrogen abundance at the expense of carbon and oxygen (CN and ON cycles).
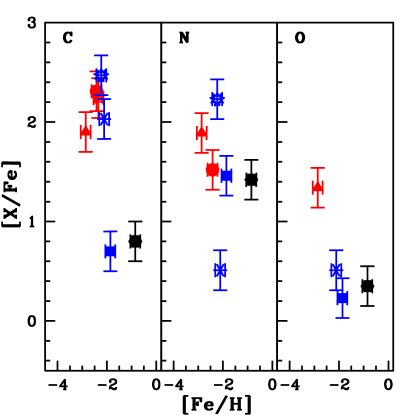
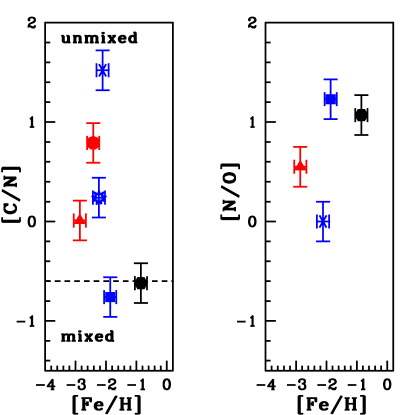
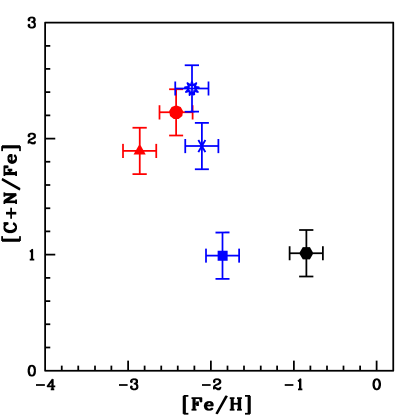
Among our program stars, HE 11570518 and HD 202851 are found to be on the ascend of Red Giant Branch (RGB) (Figure 3, log g = 2.52 and 2.20 respectively), and all other stars are evolved giants (0.60log g1.13). The observed [C/Fe], [N/Fe], and [O/Fe] ratios of the program stars are shown in Figure 12. Carbon abundance is available for all the program stars, nitrogen abundance for six stars and oxygen abundance for four stars. Five out of the seven program stars show [C/Fe], [N/Fe]1 and one star show [O/Fe]1. While the five objects in our sample show similar [C/Fe] ratio, two objects BD19 132 and HD 202851, show lowest (but similar) [C/Fe]. From the Figure 12, it is clear that, these two stars are enhanced in nitrogen and shows lowest [O/Fe], may be an indication of CNO cycle and internal mixing. If that is the case, these stars are expected to show low [C/N] and high [N/O] ratio. According to Spite et al. (2005), the stars with [C/N]0.6 are mixed stars and that with [C/N]0.6 are unmixed stars. These two stars lie in the region of mixed stars and show higher [N/O] ratio (Figure 13). The Figure 12 combined with Figure 13 suggest that both CN and ON cycle might have operated in these two stars which altered the surface CNO abundances through mixing. If the nitrogen abundance is altered only due to the CN processing, then the [C+N/Fe] ratios of the mixed and unmixed stars will be similar, with lower 12C/13C ratio for the mixed stars and if ON cycle also contributed to the N enhancement, such stars show [C+N] excess compared to the unmixed stars (Spite et al., 2005, 2006). But, both BD19 132 and HD 202851 show lower [C+N/Fe] ratio compared to the other stars (Figure 14) and have relatively higher 12C/13C ratio (18 and 42 respectively) (Table 4 and 5). This suggests that the nitrogen over abundance in these two stars may not have been resulted from an in-situ enhancement; it may be either the signature of a massive AGB companion with Hot-Bottom Burning (HBB) or the nitrogen enhanced primordial matter from which these stars have formed. We explore the possibility of HBB using different abundance ratios in the next few sections.
8.2 The [hs/ls] ratio
The [hs/ls] ratio, heavy s-process elements to light s-process elements abundance ratio, is an indicator of s-process efficiency. At higher neutron exposures, second peak (hs) s-process elements are produced over the first peak (ls), resulting in high [hs/ls] ratio. As the neutron exposure increases with decreasing metallicity, the [hs/ls] ratio is anti-correlated with metallicity. Also the neutron source 13C(, n)16O is found to be anti-correlated with metallicity (Clayton, 1988; Wallerstein et al., 1997). Hence positive values for [hs/ls] ratio could be seen in low-mass, low metallicity AGB stars (Goriely & Mowlavi, 2000; Busso et al., 2001). Whereas, in the case of massive AGB stars (5 - 8M⊙), where the neutron source is 22Ne(, n)25Mg, negative values for this ratio is observed (Goriely & Siess, 2005; Karakas, 2010; Karakas et al., 2012; van Raai et al., 2012; Karakas & Lattanzio, 2014).
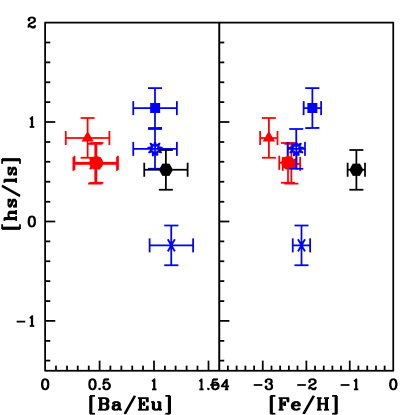
The CEMP-r/s stars generally show higher [hs/ls] value compared to the CEMP-s stars (Abate et al., 2015; Hollek et al., 2015), however there is no clear distinction observed between the [hs/ls] ratios of the CEMP-r/s and CEMP-s stars. Analysis of Goswami et al. (2021) have shown that CEMP-s stars and CEMP-r/s stars peak at [hs/ls] values 0.650.35 and 1.060.32 respectively with an overlap between them in the range 0[hs/ls]1.5. Karinkuzhi et al. (2021) also noted in their sample of CEMP stars the overlap of [hs/ls] ratio between CEMP-s and CEMP-r/s stars. The [hs/ls] ratio observed in our program stars are below 1.50 (Table 6), and we could not see any distinction between these two classes of stars in terms of [hs/ls] ratio (Figure 15). All the three CEMP-r/s stars in our sample show positive values of [hs/ls] and they are more metal-poor than the CEMP-s stars (right panel, Figure 15), as also noted by Karinkuzhi et al. (2021). All the stars except HE 13542257 show positive [hs/ls] ratio indicating a low-mass AGB companion. The star HE 13542257 has [hs/ls]0.24, indicating a clear over production of ls elements over hs elements, a trend observed in massive AGB stars. There are a few CEMP-s stars in literature that show negative values for [hs/ls] ratio; for instance, Hansen et al. (2019) present a star HE 21585134 that shows [hs/ls]0.15 and Aoki et al. (2002) noted a value 0.36 for the object CS 22942019. Analysis of Bisterzo et al. (2011) have shown that the abundance pattern in CS 22942019 could be reproduced with 1.5 M⊙ AGB model.
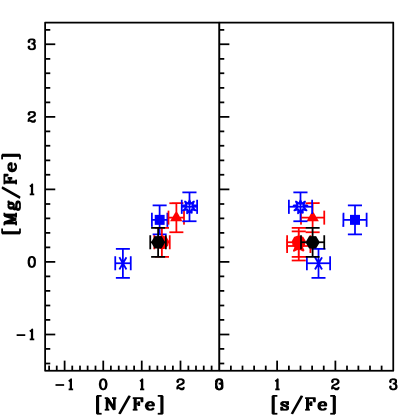
8.3 Na, Mg, and heavy elements
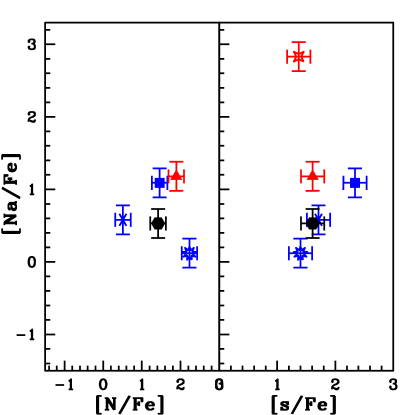
Three out of the six program stars for which we could estimate the Na abundance are enhanced in Na with [Na/Fe]1 and HE 13042111 being the most enhanced with [Na/Fe]2.83. Similar value of sodium enhancement is observed in a CEMP-r/s star CS 29528028 which shows [Na/Fe]2.68 (Aoki et al., 2007). They considered this star to be an extreme case of Ba-enhanced CEMP star. The Na enhancement through Ne-Na cycle is expected in massive AGB stars where HBB operates. HBB also results in an increased surface abundance of N through the CN cycle (Sugimoto, 1971; Lattanzio et al., 1996; Goriely & Siess, 2005; Karakas & Lattanzio, 2003, 2014; Ventura & D’Antona, 2005). Since the HBB is responsible for the over-production of N and Na in massive stars, they should be correlated if the abundance peculiarity is the result of massive-AGB stars nucleosynthesis. But we could not see any such trend in our sample of program stars (Figure 16, top panel, left column). The diffusive mixing and H-burning in these massive-AGB stars can reduce the s-process efficiency and it should be anti-correlated with the products of HBB (Goriely & Siess, 2005). However, we have not noticed any such behaviour among our program stars (Figure 16, top panel, right column). Enhanced Mg is also expected in them, resulting from the -capture reaction of 22Ne, and hence, similar behaviour as seen in the case of Na, is also expected for Mg. A slight trend could be noted in [Mg/Fe] v/s [N/Fe] plot (Figure 16, bottom panel, left column), however the scatter in the [Mg/Fe] v/s [s/Fe] plot (Figure 16, bottom panel, right column) suggests, that the trend may not be real. So these facts together with the positive [hs/ls] ratio observed in three Na enhanced stars as discussed in the previous section, rules out the possibility of the HBB and massive AGB star pollution.
The object HE 13542257 with negative [hs/ls], as discussed in section 8.2, does not show any N, Na, and Mg enhancement. So this discards the possibility of a massive AGB star companion. Similarly, for the objects BD19 132 and HD 202851 discussed in section 8.1, we rule out the possibility of massive AGB star companions.
The AGB models of Bisterzo et al. (2010) predict higher Na abundances at lower metallicities. They have studied the nucleosyntheis in low-mass AGB stars (M 1.3 - 2 M⊙) of metalliicities [Fe/H]1 for different 13C pocket efficiencies. The major neutron source here is 13C(, n)16O reaction during the inter-pulse phase. The source 22Ne(, n)25Mg is also considered to be partially activated during the TP. This models include the production of primary 23Na produced through a chain of TP/TDU/IP events from the 12C. The primary 12C produced by the 3-reaction are brought to the surface from the inter-shell region by the TDU. During the following inter-pulse, the 12C is transformed into 14N through CNO cycle by the H-burning shell and accumulated in the top layers of the inter-shell-region. This 14N is converted to 22Ne during the early phase of next thermal instability via 14N(,)18F()18O(,)22Ne (Mowlavi, 1999; Gallino et al., 2006). This 22Ne results in the primary production of the 23Na via the n-capture reaction 22Ne(n, )23Ne()23Na that are significant at low-metallicities (Gallino et al., 2006; Bisterzo et al., 2011). The amount of the primary Na produced increases with decreasing metallicity and/or increasing M (Figure 15 of Bisterzo et al. 2010). Bisterzo et al. (2011) performed a comparison of abundance patterns of a sample of 100 CEMP-s stars collected from literature with the AGB nucleosynthesis models of Bisterzo et al. (2010). Among this sample, nine stars show [Na/Fe]1 with two stars showing [Na/Fe]2, CS 29528028 ([Fe/H]2.86, [Na/Fe]2.68 Aoki et al. 2007) and SDSS 1707+58 ([Fe/H]2.52, [Na/Fe]2.71 Aoki et al. 2008). Their analysis have shown that, the AGB models with M1.5 M⊙ could reproduce the Na abundances observed in them, but not the entire observed abundances.
8.4 The [Rb/Zr] ratio
The [Rb/Zr] ratio is an important indicator of neutron density at the s-process site and the mass of the companion AGB stars. In massive AGB stars (M 4 M⊙), where the neutron source is 22Ne(, n)25Mg reaction (n108 neutrons/cm3), a higher Rb abundance and hence a positive value for [Rb/Zr] ratio are predicted (Abia et al., 2001; van Raai et al., 2012), whereas, in the low-mass AGB stars (M 3 M⊙) where 13C(, n)16O is the major neutron source (n1013 neutrons/cm3), a negative [Rb/Zr] ratio is predicted (Karakas et al., 2012). This has been supported by the observations of low- and intermediate-mass AGB stars of the Galaxy and Magellanic Clouds. (Plez et al., 1993; Lambert et al., 1995; Abia et al., 2001; García-Hernández et al., 2006, 2007, 2009). We have presented a detailed discussion on this ratio in Shejeelammal et al. (2020). The estimated values of the neutron density dependent [Rb/Zr] ratio for our program stars are given in Table 6. All the four stars where we could estimate this ratio show a negative value, indicating a low-mass AGB companion. The observed range of [Rb/Fe] and [Zr/Fe] in our program stars along with that in the massive AGB stars is shown in Figure 17 for a comparison.

8.5 Binary status of the program stars
The analysis of Spite et al. (2013) for a sample of dwarf and main-sequence turn-off CEMP stars (50) from literature ([Fe/H]1.80) have shown that the CEMP stars show bimodality in the absolute carbon abundance, that is, they show two distinct absolute carbon abundance A(C), values. The stars with [Fe/H]3.4 (CEMP-s and CEMP-r/s) populate the high carbon region at A(C)8.25 and the stars with [Fe/H]3.4 (CEMP-no) populate the low carbon region at A(C)6.80. This analysis did not consider any giants so as to avoid any carbon dilution resulting from any mixing processes. Later, Bonifacio et al. (2015) confirmed the bimodality of CEMP stars from an extended sample of CEMP stars that included dwarfs and main-sequence turn-off stars along with a few sub-giants and lower RGB giants. In both the studies, they noted a clear separation between the two carbon bands. Their interpretation of this bimodality is that, the carbon in the stars of these two carbon bands have different astrophysical origin. The carbon in the high carbon band stars are of extrinsic origin - resulting from the mass transfer from a low-mass AGB companion and that in the low carbon band stars owe to an intrinsic origin - C-enriched ISM from which they were formed despite a few of them are binaries as noted by Starkenburg et al. (2014) (Bonifacio et al., 2015). Subsequently, Hansen et al. (2015b) also noted the bimodal carbon distribution for their sample of (64) CEMP stars. However they found a smooth transition between the two carbon bands, in contrast to the well separated bands reported by Spite et al. (2013) and Bonifacio et al. (2015), with three CEMP-no stars occupying the high carbon band. This observation pointed to the importance of the knowledge of the binary status of the CEMP stars in order to better constrain the accurate origin of the observed abundances in the CEMP sub-classes.
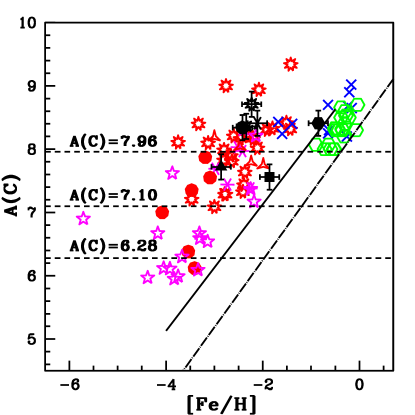
In an attempt to address this question, Yoon et al. (2016) have compiled an extensive set of 305 CEMP stars from literature with [Fe/H]1 and [C/Fe]0.70. The sample comprised of 147 CEMP-s and CEMP-r/s stars (together they denoted as CEMP-s stars) and 127 CEMP-no stars, out of which, the binary status of 35 CEMP-s and 22 CEMP-no stars are known. They also noted the carbon bimodality, but at A(C) values lower than that noted by Spite et al. (2013); the low- and high- carbon bands peaking at A(C)6.28 and 7.96 respectively. Based on the behaviour of A(C) with respect to [Fe/H], these stars were grouped into three groups; CEMP-s stars being the members of Group I and CEMP-no stars being Group II and III objects. Their analysis have confirmed the interpretation put forward by Spite et al. (2013) and Bonifacio et al. (2015) for the origin of carbon. Also they presented A(C) - [Fe/H] diagram as a powerful tool to distinguish between the CEMP-no and CEMP-s/(r/s) sub-classes. According to this study, the absolute carbon abundance A(C)7.1 separates majority of binary stars, which lie above this carbon abundance, from single stars despite of a few outliers. Also, stars with A(C)7.1 are classified as CEMP-no stars and that with A(C)7.1 are classified as CEMP-s/(r/s) stars.
We have used A(C) - [Fe/H] plot to understand the binary nature of our program stars. Before using this diagram for this purpose, the carbon abundance should be corrected to account for any internal mixing. Placco et al. (2014) have calculated the corrections to the carbon abundance for 0.0log g 5.0, 5.5[Fe/H]0.00, and 1.0[C/Fe]3.0. We have obtained the corrections to the estimated carbon abundances of our program stars using the public online tool (http://vplacco.pythonanywhere.com/) developed by Placco et al. (2014). The necessary corrections have been applied to our estimates of carbon abundance and then used in the Figure 18. The star HD 202851 lie among the CH stars and other program stars lie among the CEMP-s/(r/s) stars, with all the stars lying in the high carbon band. It is also noted that all our program stars lie in the region of binary stars that bear the signatures of binary mass transfer from the low-mass AGB companions according to Bonifacio et al. (2015). As discussed in section 3, the stars BD+19 3109 and HD 202851 are confirmed binaries. The difference in the estimated radial velocities of the stars BD19 132, BD19 290, and HE 13042111 from the literature values discussed in section 3 along with their position in the A(C) - [Fe/H] diagram suggest that these stars are possible binaries.
8.6 Parametric model based analysis
CEMP-s stars are known to be the products of binary mass transfer from low-mass AGB companion which now evolved into an invisible White Dwarf. However, a number of scenarios have been proposed till date to explain the origin of CEMP-r/s stars, enriched in both s- and r- process elements. Detailed discussions on several scenarios are available in many places (i.e., Jonsell et al. 2006; Goswami et al. 2021 and references therein). Most of these scenarios suggested an independent origin for the s- an r- process enrichment in CEMP-r/s stars. Analysis of Abate et al. (2016) have shown that these proposed scenarios have failed to reproduce the observed frequency (54%) and higher [hs/ls] ratio of the CEMP-r/s stars. From the analysis of a sample of CEMP stars (18), Allen et al. (2012) argued that CEMP-r/s stars have the same astrophysical origin as CEMP-s stars.
The overlap of [hs/ls] ratio between the CEMP-s and CEMP-r/s stars indicates that the origin of both the groups of stars owe a common astrophysical site and process but under different conditions. The higher [hs/ls] ratio, more precisely the higher [hs/Fe] ratio of the CEMP-r/s stars compared to the CEMP-s stars indicate a high neutron density process for their formation than the classical s-process. The tight correlation between the observed [Eu/Fe] and [hs/Fe] ratios in CEMP-r/s stars (Figure 13(c) of Goswami et al. 2021) also points towards a single stellar site where both the s- and r- process elements could be produced simultaneously. The low-metallicity and high [hs/Fe] ratio suggest the extreme conditions of low-mass and low-metallicity s-process. The intermediate neutron-capture process, i-process, originally proposed by Cowan & Rose (1977), has been explored recently by several authors to explain the CEMP-r/s phenomena (Dardelet et al., 2014; Hampel et al., 2016, 2019; Hansen et al., 2016b). A higher neutron densities than that required for the classical s-process, of the order of 1015 - 1017 cm-3, intermediate between the s- and r-process neutron densities, could be achieved as a result of proton Ingestion Episodes (PIEs; mixing of hydrogen rich material to the intershell region) in evolved red giants (Cowan & Rose, 1977). There are several proposed sites for the PIEs that include low-metallicity low-mass AGB stars (z 10-4, M 2M⊙) (Fujimoto et al., 2000; Campbell & Lattanzio, 2008; Lau et al., 2009; Cristallo et al., 2009; Campbell et al., 2010; Stancliffe et al., 2011; Cruz et al., 2013) etc., massive super-AGB stars (Doherty et al., 2015; Jones et al., 2016), post-AGB stars (Herwig et al., 2011, 2014; Bertolli et al., 2013; Woodward et al., 2015), Rapidly Accreting White Dwarfs (RAWD; Denissenkov et al. 2019) etc. A discussion on the several proposed sites of PIEs is given in Goswami et al. (2021).
Hampel et al. (2016) successfully used the simulations based on the i-process occurring in the
low-mass low-metallicity (1 M⊙, z10-4) AGB stars
to reproduce the observed abundance pattern of 20 CEMP-r/s stars. Later, this method has been extended
successfully to a sample of seven low-Pb post-AGB stars in the magellanic cloud (Hampel et al., 2019).
We have used the i-process model yields [X/Fe], from Hampel et al. (2016) and compared with the
observed [X/Fe] of our program stars for the neutron densities ranging from 109 to 1015 cm-3.
The observed abundances are fitted with the parametric model function;
X = Xi . (1-d) + X⊙ . d
where X represents the final abundance, Xi the i-process abundance, d is the dilution factor and
X⊙ is the solar-scaled abundance. Here d is a free parameter that can be varied to find the best fit
between the model and the observational data for each constant neutron density.
The best fit model is found using min method, where is defined as;
=
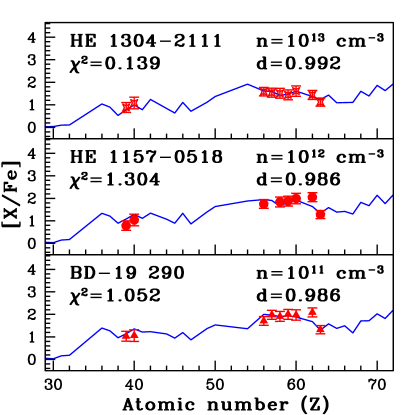
where [XZ/Fe]obs, [XZ/Fe]mod the observed and model abundances of the element with atomic number Z and , the observational uncertainty on [XZ/Fe]obs. The best fit model is selected in such a way that it shows least deviation from the observation, that is by minimizing the . The best fits obtained for the CEMP-r/s stars are shown in Figure 19. The neutron density responsible for the observed abundances in the stars BD19 290, HE 11570518, and HE 13042111 are found to be n 1011, 1012, and 1013 respectively.
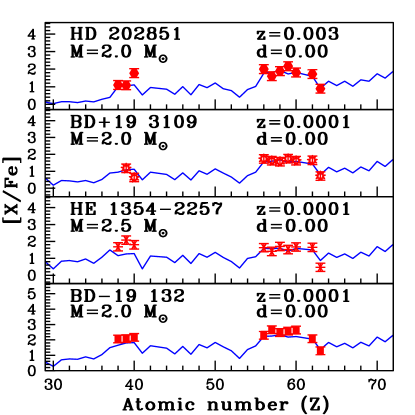
We have also conducted a parametric model based analysis for the CEMP-s and CH stars in our sample to find the mass of their AGB companion stars. The observed abundances in these stars are compared with the predicted abundances for AGB stars from FRUITY (FRANEC Repository of Updated Isotopic Tables & Yields) models (Cristallo et al., 2009, 2011, 2015). The best fitting mass of the companion AGB is derived by fitting the observed abundance with the parametric model function of Husti et al. (2009) by minimizing the value. The detailed procedure is given in Shejeelammal et al. (2020). The best fits obtained for these stars are given in Figure 20. The object HE 13542257 is found to have a companion of mass M 2.5 M⊙ while the other three objects, BD19 132, BD+19 3109, and HD 202851 have companions with mass M 2.0 M⊙.
8.7 Discussion on individual stars
In this section we provide a discussion on the individual stars summarizing the results of the above analyses.
BD19 132, BD19 290, BD+19 3109: These object are listed in the CH star catalogue of
Bartkevicius (1996). We present, the first time abundance analysis results for these objects.
Our analysis have shown that BD19 132 and BD+19 3109 are CEMP-s stars and
BD19 290 is a CEMP-r/s star.
BD+19 3109 is a confirmed binary with a period of
212913 days (Sperauskas et al., 2016). We found that BD19 290 and BD+19 3109 are high radial velocity
objects (Vr100 km s-1) and BD19 132 is a low radial
velocity (Vr17 km s-1) object.
Yamashita (1975) classified BD+19 3109 as CH like star.
Kinematic analysis have shown that BD19 132 belongs to the Galactic thin disk and BD19 290 and BD+19 3109
belong to the Galactic halo populations. From the neutron density dependent [Rb/Zr] ratio,
these objects are found to have low-mass AGB companions.
HE 11570518: This object is a VMP star with [Fe/H]2.42.
This object is listed among the faint high latitude carbon stars identified from
the HES survey (Christlieb et al., 2001a). Aoki et al. (2007) could not determine
the Eu abundance for this object, however, they have classified it as a
CEMP-s star. Our analysis shows this star to be a CEMP-r/s star.
Our estimates of atmospheric parameters
are in agreement with that of Aoki et al. (2007) except for log g which is 0.5 dex
lower than our estimate. The abundances of C, N, Mg, Ca, Ti, and Cr also match well
within the error limits. However, our estimate [Ba/Fe]1.75 is 0.40 dex
lower than their estimate. This object is found to be a member of Galactic halo with
a probability of 100%. It is a high spatial velocity and high radial velocity object.
HE 13042111, HE 13542257: Both these objects are found to be
very metal poor stars with [Fe/H]2.34 and 2.11 respectively. Ours is the
first time abundance analysis for these objects. HE 13042111 is found to be a
CEMP-r/s star whereas the latter is a CEMP-s star.
While HE 13042111 is a disk object, HE 13542257 is found to belong to the Galactic
halo population.
HD 202851: This object is listed in the CH star catalogue of Bartkevicius (1996). Our analysis shows this star to be a CH giant with [Fe/H]0.85. Sperauskas et al. (2016) confirmed this object to be a binary with a period of 12956 days from radial velocity studies. HD 202851 is found to be a low velocity object that belongs to the Galactic thin disk with 72% probability. The estimated atmospheric parameters of this star by Sperauskas et al. (2016) (Teff, log g, , [Fe/H]) (4800 K, 2.1, 1.5, 0.70) are in close agreement with our estimates, (4900 K, 2.2, 1.54, 0.85). Arentsen et al. (2019b) determined the atmospheric parameters of this star from medium-resolution (( 10,000) spectra obtained with X-shooter spectrograph (Vernet et al., 2011) of Very Large Telescope (VLT). Their estimates for Teff, log g, and [Fe/H] are 4733 K, 1.6, and 0.88. The negative value obtained for the [Rb/Zr] ratio in this star confirms low-mass AGB companion for HD 202851.
9 conclusions
Detailed spectroscopic analyses of seven potential CH/CEMP stars are carried out based on the high-quality, high-resolution spectra obtained with HCT/HESP and SUBARU/HDS. We have estimated the abundances of twenty eight elements including both light and neutron-capture process elements and carbon isotopic ratio. We present the first time abundance analysis for the objects BD19 132, BD19 290, HE 13042111, HE 13542257, and BD+19 3109.
The objects BD+19 3109 and HD 202851 are confirmed binaries. The difference in the estimated radial velocities of the stars BD19 132, BD19 290, and HE 13042111 from the Gaia values may be a robust indication that they are likely binaries. In the A(C) - [Fe/H] diagram, all the program stars fall in the region occupied by the binary stars. The kinematic analysis shows that the three low radial velocity objects in our sample BD19 132, HE 13042111, and HD 202851, are members of Galactic disk population and the rest four high radial velocity objects belong to the Galactic halo population. From the position on the HR diagram, the objects BD19 290, HE 11570518, and HD 202851 are found to be low mass objects (1M⊙).
All the objects in our sample are bona-fide CEMP stars, except HD 202851 which is found be a CH star. Three objects BD19 132, HE 13542257, and BD+19 3109 are CEMP-s stars, whereas BD19 290, HE 11570518, and HE 13042111 are found to be CEMP-r/s stars. Our analysis based on different abundance ratios and abundance profiles confirmed low-mass AGB companions of the program stars. The i-process models could successfully reproduce the observed abundances of the CEMP-r/s stars. The parametric model based analysis performed for the CEMP-s and CH stars confirms former low-mass AGB companions with mass M 2.5 M⊙.
10 ACKNOWLEDGMENT
We thank the staff at IAO and at the remote control station at
CREST, Hosakotte for assisting during the observations.
Funding from the DST SERB project No. EMR/2016/005283 is gratefully
acknowledged. We are thankful to Partha Pratim
Goswami for generating the model fits used in Figure 19.
This work made use of the SIMBAD astronomical database, operated
at CDS, Strasbourg, France, and the NASA ADS, USA.
This work has made use of data from the European Space Agency (ESA)
mission Gaia (https://www.cosmos.esa.int/gaia), processed by the Gaia
Data Processing and Analysis Consortium
(DPAC, https://www.cosmos.esa.int/web/gaia/dpac/consortium).
This research is based [in part] on data collected at Subaru Telescope,
which is operated by the National Astronomical Observatory of Japan.
We are honored and grateful for the opportunity of observing the Universe from Maunakea,
which has the cultural, historical and natural significance in Hawaii.
Data Availability
The data underlying this article will be shared on reasonable request to the authors.
References
- Abate et al. (2015) Abate, C., Pols, O. R., Izzard, R. G., & Karakas, A. I. 2015, A&A, 581, A22
- Abate et al. (2016) Abate, C., Stancliffe, R. J., & Liu, Z.-W. 2016, A&A, 587, A50
- Abia et al. (2001) Abia, C., Busso, M., Gallino, R., et al. 2001, ApJ, 559, 1117
- Allen & Barbuy (2006) Allen, D. M., & Barbuy, B. 2006, A&A, 454, 895
- Allen et al. (2012) Allen, D. M., Ryan, S. G., Rossi, S., Beers, T. C., & Tsangarides, S. A. 2012, A&A, 548, A34
- Alonso et al. (1999) Alonso, A., Arribas, S., & Martínez-Roger, C. 1999, A&AS, 140, 261
- Alonso et al. (2001) —. 2001, A&A, 376, 1039
- Andrievsky et al. (2009) Andrievsky, S. M., Spite, M., Korotin, S. A., et al. 2009, A&A, 494, 1083
- Aoki et al. (2007) Aoki, W., Beers, T. C., Christlieb, N., et al. 2007, ApJ, 655, 492
- Aoki et al. (2002) Aoki, W., Ryan, S. G., Norris, J. E., et al. 2002, ApJ, 580, 1149
- Aoki et al. (2005) Aoki, W., Honda, S., Beers, T. C., et al. 2005, ApJ, 632, 611
- Aoki et al. (2006) Aoki, W., Frebel, A., Christlieb, N., et al. 2006, ApJ, 639, 897
- Aoki et al. (2008) Aoki, W., Beers, T. C., Sivarani, T., et al. 2008, ApJ, 678, 1351
- Aoki et al. (2013) Aoki, W., Beers, T. C., Lee, Y. S., et al. 2013, AJ, 145, 13
- Arcones & Thielemann (2013) Arcones, A., & Thielemann, F. K. 2013, Journal of Physics G Nuclear Physics, 40, 013201
- Arentsen et al. (2019a) Arentsen, A., Starkenburg, E., Shetrone, M. D., et al. 2019a, A&A, 621, A108
- Arentsen et al. (2019b) Arentsen, A., Prugniel, P., Gonneau, A., et al. 2019b, A&A, 627, A138
- Argast et al. (2004) Argast, D., Samland, M., Thielemann, F. K., & Qian, Y. Z. 2004, A&A, 416, 997
- Asplund et al. (2009) Asplund, M., Grevesse, N., Sauval, A. J., & Scott, P. 2009, ARA&A, 47, 481
- Barklem & O’Mara (2000) Barklem, P. S., & O’Mara, B. J. 2000, MNRAS, 311, 535
- Bartkevicius (1996) Bartkevicius, A. 1996, Baltic Astronomy, 5, 217
- Beers (1999) Beers, T. C. 1999, in Astronomical Society of the Pacific Conference Series, Vol. 165, The Third Stromlo Symposium: The Galactic Halo, ed. B. K. Gibson, R. S. Axelrod, & M. E. Putman, 202
- Beers & Christlieb (2005) Beers, T. C., & Christlieb, N. 2005, ARA&A, 43, 531
- Beers et al. (1985) Beers, T. C., Preston, G. W., & Shectman, S. A. 1985, AJ, 90, 2089
- Beers et al. (1992) —. 1992, AJ, 103, 1987
- Beers et al. (2007) Beers, T. C., Flynn, C., Rossi, S., et al. 2007, ApJS, 168, 128
- Bensby et al. (2003) Bensby, T., Feltzing, S., & Lundström, I. 2003, A&A, 410, 527
- Bensby et al. (2004) —. 2004, A&A, 415, 155
- Bergemann et al. (2012) Bergemann, M., Hansen, C. J., Bautista, M., & Ruchti, G. 2012, A&A, 546, A90
- Bertolli et al. (2013) Bertolli, M. G., Herwig, F., Pignatari, M., & Kawano, T. 2013, arXiv e-prints, arXiv:1310.4578
- Bessell et al. (2015) Bessell, M. S., Collet, R., Keller, S. C., et al. 2015, ApJ, 806, L16
- Bisterzo et al. (2010) Bisterzo, S., Gallino, R., Straniero, O., Cristallo, S., & Käppeler, F. 2010, MNRAS, 404, 1529
- Bisterzo et al. (2011) —. 2011, MNRAS, 418, 284
- Bonifacio et al. (2015) Bonifacio, P., Caffau, E., Spite, M., et al. 2015, A&A, 579, A28
- Busso et al. (2001) Busso, M., Gallino, R., Lambert, D. L., Travaglio, C., & Smith, V. V. 2001, ApJ, 557, 802
- Campbell & Lattanzio (2008) Campbell, S. W., & Lattanzio, J. C. 2008, A&A, 490, 769
- Campbell et al. (2010) Campbell, S. W., Lugaro, M., & Karakas, A. I. 2010, A&A, 522, L6
- Carollo et al. (2012) Carollo, D., Beers, T. C., Bovy, J., et al. 2012, ApJ, 744, 195
- Cayrel et al. (2004) Cayrel, R., Depagne, E., Spite, M., et al. 2004, A&A, 416, 1117
- Charbonnel (1995) Charbonnel, C. 1995, ApJ, 453, L41
- Charbonnel et al. (1998) Charbonnel, C., Brown, J. A., & Wallerstein, G. 1998, A&A, 332, 204
- Chen et al. (1998) Chen, B., Vergely, J. L., Valette, B., & Carraro, G. 1998, A&A, 336, 137
- Chiappini (2013) Chiappini, C. 2013, Astronomische Nachrichten, 334, 595
- Choplin et al. (2017) Choplin, A., Hirschi, R., Meynet, G., & Ekström, S. 2017, A&A, 607, L3
- Christlieb (2003) Christlieb, N. 2003, Reviews in Modern Astronomy, 16, 191
- Christlieb et al. (2001a) Christlieb, N., Green, P. J., Wisotzki, L., & Reimers, D. 2001a, A&A, 375, 366
- Christlieb et al. (2008) Christlieb, N., Schörck, T., Frebel, A., et al. 2008, A&A, 484, 721
- Christlieb et al. (2001b) Christlieb, N., Wisotzki, L., Reimers, D., et al. 2001b, A&A, 366, 898
- Clayton (1988) Clayton, D. D. 1988, MNRAS, 234, 1
- Cooke & Madau (2014) Cooke, R. J., & Madau, P. 2014, ApJ, 791, 116
- Cowan & Rose (1977) Cowan, J. J., & Rose, W. K. 1977, ApJ, 212, 149
- Cristallo et al. (2016) Cristallo, S., Karinkuzhi, D., Goswami, A., Piersanti, L., & Gobrecht, D. 2016, ApJ, 833, 181
- Cristallo et al. (2009) Cristallo, S., Straniero, O., Gallino, R., et al. 2009, ApJ, 696, 797
- Cristallo et al. (2015) Cristallo, S., Straniero, O., Piersanti, L., & Gobrecht, D. 2015, ApJS, 219, 40
- Cristallo et al. (2011) Cristallo, S., Piersanti, L., Straniero, O., et al. 2011, ApJS, 197, 17
- Cruz et al. (2013) Cruz, M. A., Serenelli, A., & Weiss, A. 2013, A&A, 559, A4
- Cseh et al. (2018) Cseh, B., Lugaro, M., D’Orazi, V., et al. 2018, A&A, 620, A146
- Cui et al. (2012) Cui, X.-Q., Zhao, Y.-H., Chu, Y.-Q., et al. 2012, Research in Astronomy and Astrophysics, 12, 1197
- Dardelet et al. (2014) Dardelet, L., Ritter, C., Prado, P., et al. 2014, in XIII Nuclei in the Cosmos (NIC XIII), 145
- de Castro et al. (2016) de Castro, D. B., Pereira, C. B., Roig, F., et al. 2016, MNRAS, 459, 4299
- Deng et al. (2012) Deng, L.-C., Newberg, H. J., Liu, C., et al. 2012, Research in Astronomy and Astrophysics, 12, 735
- Denissenkov et al. (2017) Denissenkov, P. A., Herwig, F., Battino, U., et al. 2017, ApJ, 834, L10
- Denissenkov et al. (2019) Denissenkov, P. A., Herwig, F., Woodward, P., et al. 2019, MNRAS, 488, 4258
- Doherty et al. (2015) Doherty, C. L., Gil-Pons, P., Siess, L., Lattanzio, J. C., & Lau, H. H. B. 2015, MNRAS, 446, 2599
- Drout et al. (2017) Drout, M. R., Piro, A. L., Shappee, B. J., et al. 2017, Science, 358, 1570
- Frebel (2018) Frebel, A. 2018, Annual Review of Nuclear and Particle Science, 68, 237
- Frebel et al. (2008) Frebel, A., Collet, R., Eriksson, K., Christlieb, N., & Aoki, W. 2008, ApJ, 684, 588
- Frebel & Norris (2015) Frebel, A., & Norris, J. E. 2015, ARA&A, 53, 631
- Fryer et al. (2006) Fryer, C. L., Herwig, F., Hungerford, A., & Timmes, F. X. 2006, ApJ, 646, L131
- Fujimoto et al. (2000) Fujimoto, M. Y., Ikeda, Y., & Iben, Icko, J. 2000, ApJ, 529, L25
- Gaia Collaboration et al. (2018) Gaia Collaboration, Katz, D., Antoja, T., et al. 2018, A&A, 616, A11
- Gallino et al. (2006) Gallino, R., Bisterzo, S., Husti, L., et al. 2006, in International Symposium on Nuclear Astrophysics - Nuclei in the Cosmos, ed. A. Mengoni, J. Cederkall, J. D’Auria, L. Fraile, H. Fynbo, M. Hass, M. M. Jeanne, M. Hjorth Jensen, F. Kaeppeler, K. L. Kratz, M. Lindroos, M. Menna, G. Meynet, & K. Riisager, 100.1
- García-Hernández et al. (2006) García-Hernández, D. A., García-Lario, P., Plez, B., et al. 2006, Science, 314, 1751
- García-Hernández et al. (2007) —. 2007, A&A, 462, 711
- García-Hernández et al. (2009) García-Hernández, D. A., Manchado, A., Lambert, D. L., et al. 2009, ApJ, 705, L31
- Gilroy (1989) Gilroy, K. K. 1989, ApJ, 347, 835
- Girardi et al. (2000) Girardi, L., Bressan, A., Bertelli, G., & Chiosi, C. 2000, A&AS, 141, 371
- Goriely & Mowlavi (2000) Goriely, S., & Mowlavi, N. 2000, A&A, 362, 599
- Goriely & Siess (2005) Goriely, S., & Siess, L. 2005, in From Lithium to Uranium: Elemental Tracers of Early Cosmic Evolution, ed. V. Hill, P. Francois, & F. Primas, Vol. 228, 451–460
- Goswami & Aoki (2010) Goswami, A., & Aoki, W. 2010, MNRAS, 404, 253
- Goswami et al. (2006) Goswami, A., Aoki, W., Beers, T. C., et al. 2006, MNRAS, 372, 343
- Goswami et al. (2016) Goswami, A., Aoki, W., & Karinkuzhi, D. 2016, MNRAS, 455, 402
- Goswami et al. (2021) Goswami, P. P., Rathour, R. S., & Goswami, A. 2021, A&A, 649, A49
- Gratton et al. (2000) Gratton, R. G., Sneden, C., Carretta, E., & Bragaglia, A. 2000, A&A, 354, 169
- Grundahl et al. (2002) Grundahl, F., Briley, M., Nissen, P. E., & Feltzing, S. 2002, A&A, 385, L14
- Hampel et al. (2019) Hampel, M., Karakas, A. I., Stancliffe, R. J., Meyer, B. S., & Lugaro, M. 2019, ApJ, 887, 11
- Hampel et al. (2016) Hampel, M., Stancliffe, R. J., Lugaro, M., & Meyer, B. S. 2016, ApJ, 831, 171
- Hansen et al. (2019) Hansen, C. J., Hansen, T. T., Koch, A., et al. 2019, A&A, 623, A128
- Hansen et al. (2016a) Hansen, C. J., Nordström, B., Hansen, T. T., et al. 2016a, A&A, 588, A37
- Hansen et al. (2011) Hansen, T., Andersen, J., Nordström, B., Buchhave, L. A., & Beers, T. C. 2011, ApJ, 743, L1
- Hansen et al. (2015a) Hansen, T., Hansen, C. J., Christlieb, N., et al. 2015a, ApJ, 807, 173
- Hansen et al. (2015b) —. 2015b, ApJ, 807, 173
- Hansen et al. (2016b) Hansen, T. T., Andersen, J., Nordström, B., et al. 2016b, A&A, 588, A3
- Heger & Woosley (2010) Heger, A., & Woosley, S. E. 2010, ApJ, 724, 341
- Herwig (2005) Herwig, F. 2005, ARA&A, 43, 435
- Herwig et al. (2011) Herwig, F., Pignatari, M., Woodward, P. R., et al. 2011, ApJ, 727, 89
- Herwig et al. (2014) Herwig, F., Woodward, P. R., Lin, P.-H., Knox, M., & Fryer, C. 2014, ApJ, 792, L3
- Hollek et al. (2015) Hollek, J. K., Frebel, A., Placco, V. M., et al. 2015, ApJ, 814, 121
- Honda et al. (2004) Honda, S., Aoki, W., Kajino, T., et al. 2004, ApJ, 607, 474
- Husti et al. (2009) Husti, L., Gallino, R., Bisterzo, S., Straniero, O., & Cristallo, S. 2009, PASA, 26, 176
- Iwamoto et al. (2005) Iwamoto, N., Umeda, H., Tominaga, N., Nomoto, K., & Maeda, K. 2005, Science, 309, 451
- Jacobson et al. (2005) Jacobson, H. R., Pilachowski, C. A., & Friel, E. D. 2005, in American Astronomical Society Meeting Abstracts, Vol. 207, American Astronomical Society Meeting Abstracts, 71.16
- Johnson & Soderblom (1987) Johnson, D. R. H., & Soderblom, D. R. 1987, AJ, 93, 864
- Jones et al. (2016) Jones, S., Ritter, C., Herwig, F., et al. 2016, MNRAS, 455, 3848
- Jonsell et al. (2006) Jonsell, K., Barklem, P. S., Gustafsson, B., et al. 2006, A&A, 451, 651
- Jorissen et al. (2016) Jorissen, A., Van Eck, S., Van Winckel, H., et al. 2016, A&A, 586, A158
- Karakas (2010) Karakas, A. I. 2010, MNRAS, 403, 1413
- Karakas et al. (2012) Karakas, A. I., García-Hernández, D. A., & Lugaro, M. 2012, ApJ, 751, 8
- Karakas & Lattanzio (2003) Karakas, A. I., & Lattanzio, J. C. 2003, PASA, 20, 279
- Karakas & Lattanzio (2014) —. 2014, PASA, 31, e030
- Karinkuzhi & Goswami (2014) Karinkuzhi, D., & Goswami, A. 2014, MNRAS, 440, 1095
- Karinkuzhi & Goswami (2015) —. 2015, MNRAS, 446, 2348
- Karinkuzhi et al. (2021) Karinkuzhi, D., Van Eck, S., Goriely, S., et al. 2021, A&A, 645, A61
- Karinkuzhi et al. (2018) Karinkuzhi, D., Van Eck, S., Jorissen, A., et al. 2018, A&A, 618, A32
- Keenan (1942) Keenan, P. C. 1942, ApJ, 96, 101
- Koch et al. (2019) Koch, A., Reichert, M., Hansen, C. J., et al. 2019, A&A, 622, A159
- Lambert & Luck (1976) Lambert, D. L., & Luck, R. E. 1976, The Observatory, 96, 100
- Lambert et al. (1995) Lambert, D. L., Smith, V. V., Busso, M., Gallino, R., & Straniero, O. 1995, ApJ, 450, 302
- Lattanzio et al. (1996) Lattanzio, J., Frost, C., Cannon, R., & Wood, P. R. 1996, Mem. Soc. Astron. Italiana, 67, 729
- Lau et al. (2009) Lau, H. H. B., Stancliffe, R. J., & Tout, C. A. 2009, MNRAS, 396, 1046
- Lawler et al. (2001) Lawler, J. E., Bonvallet, G., & Sneden, C. 2001, ApJ, 556, 452
- Lee et al. (2013) Lee, Y. S., Beers, T. C., Masseron, T., et al. 2013, AJ, 146, 132
- Lippuner et al. (2017) Lippuner, J., Fernández, R., Roberts, L. F., et al. 2017, MNRAS, 472, 904
- Lucatello et al. (2006) Lucatello, S., Beers, T. C., Christlieb, N., et al. 2006, ApJ, 652, L37
- Lucatello et al. (2005) Lucatello, S., Tsangarides, S., Beers, T. C., et al. 2005, ApJ, 625, 825
- Luck (2017) Luck, R. E. 2017, AJ, 153, 21
- Luck & Heiter (2007) Luck, R. E., & Heiter, U. 2007, AJ, 133, 2464
- Maeder & Meynet (2015) Maeder, A., & Meynet, G. 2015, A&A, 580, A32
- Maeder et al. (2015) Maeder, A., Meynet, G., & Chiappini, C. 2015, A&A, 576, A56
- Mashonkina et al. (2008) Mashonkina, L., Zhao, G., Gehren, T., et al. 2008, A&A, 478, 529
- Masseron et al. (2010) Masseron, T., Johnson, J. A., Plez, B., et al. 2010, A&A, 509, A93
- McWilliam (1998) McWilliam, A. 1998, AJ, 115, 1640
- Meynet et al. (2010) Meynet, G., Hirschi, R., Ekstrom, S., et al. 2010, A&A, 521, A30
- Mishenina et al. (2004) Mishenina, T. V., Soubiran, C., Kovtyukh, V. V., & Korotin, S. A. 2004, A&A, 418, 551
- Mowlavi (1999) Mowlavi, N. 1999, A&A, 344, 617
- Noguchi et al. (2002) Noguchi, K., Aoki, W., Kawanomoto, S., et al. 2002, PASJ, 54, 855
- Nomoto et al. (2013) Nomoto, K., Kobayashi, C., & Tominaga, N. 2013, ARA&A, 51, 457
- Norris et al. (2013a) Norris, J. E., Bessell, M. S., Yong, D., et al. 2013a, ApJ, 762, 25
- Norris et al. (2013b) Norris, J. E., Yong, D., Bessell, M. S., et al. 2013b, ApJ, 762, 28
- Placco et al. (2013) Placco, V. M., Frebel, A., Beers, T. C., et al. 2013, ApJ, 770, 104
- Placco et al. (2014) Placco, V. M., Frebel, A., Beers, T. C., & Stancliffe, R. J. 2014, ApJ, 797, 21
- Placco et al. (2021) Placco, V. M., Sneden, C., Roederer, I. U., et al. 2021, Research Notes of the American Astronomical Society, 5, 92
- Plez et al. (1993) Plez, B., Smith, V. V., & Lambert, D. L. 1993, ApJ, 418, 812
- Prochaska & McWilliam (2000) Prochaska, J. X., & McWilliam, A. 2000, ApJ, 537, L57
- Prochaska et al. (2000) Prochaska, J. X., Naumov, S. O., Carney, B. W., McWilliam, A., & Wolfe, A. M. 2000, AJ, 120, 2513
- Purandardas et al. (2019) Purandardas, M., Goswami, A., Goswami, P. P., Shejeelammal, J., & Masseron, T. 2019, MNRAS, 486, 3266
- Qian (2000) Qian, Y. Z. 2000, ApJ, 534, L67
- Reddy et al. (2006) Reddy, B. E., Lambert, D. L., & Allende Prieto, C. 2006, MNRAS, 367, 1329
- Rossi et al. (1999) Rossi, S., Beers, T. C., & Sneden, C. 1999, in Astronomical Society of the Pacific Conference Series, Vol. 165, The Third Stromlo Symposium: The Galactic Halo, ed. B. K. Gibson, R. S. Axelrod, & M. E. Putman, 264
- Rosswog et al. (2014) Rosswog, S., Korobkin, O., Arcones, A., Thielemann, F. K., & Piran, T. 2014, MNRAS, 439, 744
- Schönrich et al. (2010) Schönrich, R., Binney, J., & Dehnen, W. 2010, MNRAS, 403, 1829
- Shejeelammal et al. (2020) Shejeelammal, J., Goswami, A., Goswami, P. P., Rathour, R. S., & Masseron, T. 2020, MNRAS, 492, 3708
- Shejeelammal et al. (2021) Shejeelammal, J., Goswami, A., & Shi, J. 2021, MNRAS, 502, 1008
- Shetrone (2003) Shetrone, M. D. 2003, ApJ, 585, L45
- Short & Hauschildt (2006) Short, C. I., & Hauschildt, P. H. 2006, ApJ, 641, 494
- Skúladóttir et al. (2015) Skúladóttir, Á., Tolstoy, E., Salvadori, S., et al. 2015, A&A, 574, A129
- Sneden (1973) Sneden, C. A. 1973, PhD thesis, THE UNIVERSITY OF TEXAS AT AUSTIN.
- Sperauskas et al. (2016) Sperauskas, J., Začs, L., Schuster, W. J., & Deveikis, V. 2016, ApJ, 826, 85
- Spite et al. (2013) Spite, M., Caffau, E., Bonifacio, P., et al. 2013, A&A, 552, A107
- Spite et al. (2005) Spite, M., Cayrel, R., Plez, B., et al. 2005, A&A, 430, 655
- Spite et al. (2006) Spite, M., Cayrel, R., Hill, V., et al. 2006, A&A, 455, 291
- Stancliffe et al. (2011) Stancliffe, R. J., Dearborn, D. S. P., Lattanzio, J. C., Heap, S. A., & Campbell, S. W. 2011, ApJ, 742, 121
- Starkenburg et al. (2014) Starkenburg, E., Shetrone, M. D., McConnachie, A. W., & Venn, K. A. 2014, MNRAS, 441, 1217
- Sugimoto (1971) Sugimoto, D. 1971, Progress of Theoretical Physics, 45, 761
- Surman et al. (2008) Surman, R., McLaughlin, G. C., Ruffert, M., Janka, H. T., & Hix, W. R. 2008, ApJ, 679, L117
- Tanvir et al. (2013) Tanvir, N. R., Levan, A. J., Fruchter, A. S., et al. 2013, Nature, 500, 547
- Tominaga et al. (2014) Tominaga, N., Iwamoto, N., & Nomoto, K. 2014, ApJ, 785, 98
- Tominaga et al. (2007) Tominaga, N., Umeda, H., & Nomoto, K. 2007, ApJ, 660, 516
- Umeda & Nomoto (2005) Umeda, H., & Nomoto, K. 2005, ApJ, 619, 427
- van Raai et al. (2012) van Raai, M. A., Lugaro, M., Karakas, A. I., García-Hernández, D. A., & Yong, D. 2012, A&A, 540, A44
- Vanture (1992) Vanture, A. D. 1992, AJ, 104, 1997
- Venn et al. (2004) Venn, K. A., Irwin, M., Shetrone, M. D., et al. 2004, AJ, 128, 1177
- Ventura & D’Antona (2005) Ventura, P., & D’Antona, F. 2005, A&A, 431, 279
- Vernet et al. (2011) Vernet, J., Dekker, H., D’Odorico, S., et al. 2011, A&A, 536, A105
- Wallerstein et al. (1997) Wallerstein, G., Iben, Icko, J., Parker, P., et al. 1997, Reviews of Modern Physics, 69, 995
- Woodward et al. (2015) Woodward, P. R., Herwig, F., & Lin, P.-H. 2015, ApJ, 798, 49
- Worley et al. (2013) Worley, C. C., Hill, V., Sobeck, J., & Carretta, E. 2013, A&A, 553, A47
- Yamashita (1975) Yamashita, Y. 1975, PASJ, 27, 325
- Yang et al. (2016) Yang, G.-C., Liang, Y.-C., Spite, M., et al. 2016, Research in Astronomy and Astrophysics, 16, 19
- Yong et al. (2013) Yong, D., Norris, J. E., Bessell, M. S., et al. 2013, ApJ, 762, 27
- Yoon et al. (2016) Yoon, J., Beers, T. C., Placco, V. M., et al. 2016, ApJ, 833, 20
- York et al. (2000) York, D. G., Adelman, J., Anderson, John E., J., et al. 2000, AJ, 120, 1579
- Zhao et al. (2012) Zhao, G., Zhao, Y.-H., Chu, Y.-Q., Jing, Y.-P., & Deng, L.-C. 2012, Research in Astronomy and Astrophysics, 12, 723
Appendix A Linelist
| Wavelength(Å) | El | (eV) | log gf | BD19 132 | BD19 290 | HE 11570518 | HE 13042111 | HE 13542257 | BD+19 3109 | HD 202851 | |
|---|---|---|---|---|---|---|---|---|---|---|---|
| 4445.471 | Fe I | 0.087 | 5.38 | 105.3(5.69) | 34.9(4.75) | - | - | - | - | 77.1(6.64) | |
| 4466.551 | 2.832 | 0.59 | - | - | - | - | - | - | 136.4(6.59) | ||
| 4484.22 | 3.603 | 0.72 | - | - | - | 41.8(5.26) | - | - | - | ||
| 4489.739 | 0.121 | 3.966 | - | - | - | - | 108.3(5.31) | - | 128.3(6.53) | ||
| 4595.358 | 3.301 | 1.72 | 56.0(5.73) | - | - | - | - | - | - | ||
| 4619.288 | 3.603 | 1.12 | 63.5(5.65) | - | - | - | - | - | 87.3(6.79) | ||
| 4625.045 | 3.241 | 1.34 | - | 20.3(4.64) | - | 36.6(5.25) | - | - | - | ||
| 4630.12 | 2.278 | 2.6 | - | - | - | 28.4(5.03) | 50.1(5.66) | - | - | ||
| 4635.846 | 2.845 | 2.42 | 48.0(5.68) | - | - | - | - | 24.0(5.17) | 57.2(6.57) | ||
| 4637.503 | 3.283 | 1.39 | 69.5(5.59) | - | - | - | - | - | - | ||
| 4643.464 | 3.654 | 1.29 | 53.4(5.73) | - | - | - | - | 38.2(5.40) | - | ||
| 4787.827 | 2.998 | 2.77 | - | - | - | - | - | - | 39.4(6.77) | ||
| 4788.751 | 3.236 | 1.81 | 52.5(5.61) | - | - | - | - | - | - | ||
| 4789.651 | 3.546 | 0.91 | - | - | - | - | 33.0(5.20) | - | - | ||
| 4924.77 | 2.278 | 2.22 | - | - | 22.1(5.20) | 52.7(5.32) | 48.8(5.26) | - | - | ||
| 4930.315 | 3.959 | 1.35 | - | - | - | - | - | - | 44.7(6.53) | ||
| 4939.687 | 0.859 | 3.34 | - | 128.5(4.67) | - | - | 99.7(5.33) | - | - | ||
| 4967.89 | 4.191 | 0.622 | - | - | - | - | - | 35.5(5.38) | - | ||
| 4985.253 | 3.93 | 0.56 | 76.8(5.73) | - | - | - | - | - | 96.6(6.75) | ||
| 5001.863 | 3.882 | 0.01 | - | - | 32.8(4.84) | - | 78.9(5.33) | - | - | ||
| 5028.126 | 3.573 | 1.474 | 41.8(5.59) | - | - | - | - | - | - | ||
| 5044.211 | 2.851 | 2.15 | 63.3(5.62) | - | - | - | 22.3(5.36) | - | - | ||
| 5049.819 | 2.278 | 1.42 | - | - | - | 76.5(5.17) | - | - | - | ||
| 5079.223 | 2.2 | 2.067 | - | - | 27.9(5.04) | - | - | - | 112.6(6.54) | ||
| 5083.338 | 0.958 | 2.958 | - | - | - | 81.4(5.11) | - | - | - | ||
| 5127.359 | 0.915 | 3.307 | - | - | 32.8(4.89) | - | - | - | - | ||
| 5141.739 | 2.424 | 2.15 | - | - | - | - | - | 78.1(5.14) | - | ||
| 5151.911 | 1.011 | 3.32 | - | 107.8(4.63) | - | - | - | - | - | ||
| 5198.711 | 2.222 | 2.135 | - | - | - | - | 58.3(5.18) | 112.4(5.37) | - | ||
| 5215.179 | 3.266 | 0.933 | 102.6(5.61) | - | - | - | - | 91.7(5.31) | 113.3(6.67) | ||
| 5242.491 | 3.634 | 0.84 | - | 20.1(4.71) | - | - | 46.0(5.54) | 58.2(5.33) | 94.3(6.71) | ||
| 5247.05 | 0.087 | 4.946 | 139.3(5.64) | 66.8(4.60) | - | 55.6(5.01) | - | 124.1(5.23) | 115.2(6.79) | ||
| 5250.209 | 0.121 | 4.938 | - | 58.7(4.52) | - | - | - | 131.2(5.37) | - | ||
| 5263.305 | 3.265 | 0.97 | - | - | - | 44.7(5.05) | 75.5(5.55) | - | - | ||
| 5281.79 | 3.038 | 1.02 | - | - | 41.2(4.96) | - | - | - | - | ||
| 5322.04 | 2.28 | 2.84 | 72.0(5.57) | - | - | - | - | 47.9(5.14) | 68.9(6.42) | ||
| 5339.93 | 3.27 | 0.68 | - | - | 55.0(5.26) | - | - | 100.9(5.19) | - | ||
| 5365.399 | 3.573 | 1.44 | 43.2(5.57) | - | - | - | - | - | - | ||
| 5367.479 | 4.415 | 0.35 | - | 34.7(4.66) | - | 44.5(5.21) | - | 69.9(5.25) | 111.4(6.66) | ||
| 5369.961 | 4.37 | 0.35 | 87.1(5.58) | 30.8(4.54) | - | - | - | 80.2(5.36) | 100.9(6.38) | ||
| 5383.369 | 4.312 | 0.5 | - | - | - | - | - | 80.7(5.13) | 131.2(6.78) | ||
| 5445.042 | 4.39 | 0.02 | 73.5(5.75) | - | - | 27.6(5.07) | - | 43.6(5.16) | 98.2(6.70) | ||
| 5569.62 | 3.42 | 0.49 | - | - | - | - | 99.8(5.67) | - | 125.6(6.64) | ||
| 5576.09 | 3.43 | 0.851 | - | - | - | - | - | 68.4(5.21) | - | ||
| 5586.756 | 3.368 | 0.21 | 137.8(5.60) | - | - | 68.9(5.10) | - | - | 152.1(6.75) | ||
| 5615.644 | 3.332 | 0.14 | - | - | - | - | - | 129.0(5.31) | - | ||
| 5701.544 | 2.559 | 2.216 | - | - | - | - | 52.1(5.54) | 80.1(5.37) | - | ||
| 5753.12 | 4.26 | 0.76 | - | - | - | - | - | 23.1(5.33) | 67.6(6.65) | ||
| 5883.813 | 3.959 | 1.36 | - | - | - | - | - | - | 57.6(6.71) | ||
| 5956.692 | 0.859 | 4.605 | - | - | - | 38.9(5.22) | - | - | 86.5(6.69) | ||
| 6024.049 | 4.548 | 0.12 | - | - | - | - | - | 35.7(5.30) | 86.0(6.65) | ||
| 6082.71 | 2.222 | 3.573 | - | - | - | - | - | 21.7(5.29) | 57.5(6.83) | ||
| 6137.694 | 2.588 | 1.403 | - | 105.3(4.73) | - | - | 98.6(5.39) | 135.7(5.38) | - | ||
| 6151.62 | 2.18 | 3.29 | - | - | - | 20.4(5.24) | 21.3(5.57) | 39.1(5.30) | - | ||
| 6173.34 | 2.22 | 2.88 | - | - | - | - | 30.6(5.41) | - | - | ||
| 6200.314 | 2.608 | 2.437 | - | - | - | - | 36.6(5.54) | - | - | ||
| 6219.279 | 2.198 | 2.433 | - | - | 25.2(5.27) | - | - | - | - | ||
| 6240.646 | 2.222 | 3.38 | - | - | - | - | 27.9(5.64) | - | - | ||
| 6246.318 | 3.603 | 0.96 | 75.7(5.60) | - | - | - | - | - | - | ||
| 6252.554 | 2.404 | 1.687 | - | 87.3(4.60) | 46.9(5.12) | - | 82.5(5.19) | - | - | ||
| 6254.258 | 2.279 | 2.48 | - | - | - | - | 73.6(5.62) | - | - | ||
| 6280.617 | 0.859 | 4.39 | - | - | - | 52.1(5.26) | - | - | - | ||
| 6301.5 | 3.654 | 0.672 | - | - | - | 37.6(5.06) | - | 69.6(5.24) | 101.8(6.51) | ||
| 6318.018 | 2.453 | 2.33 | - | - | - | - | 41.2(5.31) | 83.7(5.32) | - | ||
| 6322.69 | 2.588 | 2.426 | - | - | - | - | 33.1(5.44) | - | - | ||
| 6335.328 | 2.198 | 2.23 | - | - | - | - | 58.7(5.14) | 105.0(5.15) | 127.5(6.69) | ||
| 6336.823 | 3.686 | 1.05 | - | - | - | - | 22.9(5.19) | - | - | ||
| 6393.602 | 2.432 | 1.62 | - | - | - | - | 90.4(5.25) | - | - | ||
| 6416.933 | 4.796 | 0.885 | - | - | - | - | - | - | 29.9(6.65) |
The numbers in the parenthesis in columns 5 - 11 give the derived abundances from the respective line.
| Wavelength(Å) | El | (eV) | log gf | BD19 132 | BD19 290 | HE 11570518 | HE 13042111 | HE 13542257 | BD+19 3109 | HD 202851 | |
|---|---|---|---|---|---|---|---|---|---|---|---|
| 6421.349 | 2.278 | 2.027 | - | - | - | 65.9(5.21) | 80.7(5.32) | - | - | ||
| 6430.85 | 2.18 | 2.01 | - | - | - | - | 107.9(5.55) | - | - | ||
| 6575.019 | 2.588 | 2.82 | 52.0(5.67) | - | - | - | - | - | 62.4(6.58) | ||
| 6592.91 | 2.72 | 1.47 | - | 57.0(4.62) | - | - | 56.6(5.12) | 95.8(5.13) | 124.5(6.61) | ||
| 6593.871 | 2.432 | 2.422 | - | - | - | - | - | - | 105.1(6.71) | ||
| 6677.989 | 2.692 | 1.47 | - | - | 45.0(5.17) | - | - | - | - | ||
| 4491.405 | Fe II | 2.855 | 2.7 | - | - | - | - | 33.7(5.21) | 22.8(5.29) | - | |
| 4508.288 | 2.855 | 2.21 | 45.0(5.64) | 29.5(4.55) | 25.2(4.97) | - | - | 40.4(5.27) | - | ||
| 4515.339 | 2.84 | 2.48 | - | - | - | - | - | 30.3(5.26) | - | ||
| 4520.224 | 2.81 | 2.6 | 32.7(5.65) | - | - | - | - | - | - | ||
| 4629.339 | 2.807 | 2.28 | - | - | - | 31.5(5.16) | - | - | - | ||
| 4731.453 | 2.891 | 3.36 | - | - | - | - | 20.5(5.58) | - | - | ||
| 5197.56 | 3.23 | 2.25 | - | - | - | 24.0(5.23) | - | - | 85.4(6.62) | ||
| 5234.62 | 3.22 | 2.24 | - | 25.4(4.73) | 25.4(5.20) | 22.0(5.09) | 52.3(5.35) | - | - | ||
| 5534.83 | 3.25 | 2.77 | - | - | - | - | - | - | 48.3(6.64) | ||
| 6247.55 | 3.89 | 2.34 | - | - | - | - | - | - | 46.4(6.72) | ||
| 6456.383 | 3.903 | 2.075 | - | - | - | - | 19.9(5.40) | - | - |
The numbers in the parenthesis in columns 5 - 11 give the derived abundances from the respective line. The line information are taken from Kurucz database of atomic line lists (https://lweb.cfa.harvard.edu/amp/ampdata/kurucz23/sekur.html).
| Wavelength(Å) | El | (eV) | log gf | BD19 132 | BD19 290 | HE 11570518 | HE 13042111 | HE 13542257 | BD+19 3109 | HD 202851 | |
|---|---|---|---|---|---|---|---|---|---|---|---|
| 5682.633 | Na I | 2.102 | 0.7 | 120.0(5.52) | 31.5(4.65) | - | 129.8(6.65) | 27.3(4.76) | 21.5(4.14) | 93.0(5.90) | |
| 5688.205 | 2.1 | 0.45 | 130.5(5.42) | 35.4(4.47) | - | 170.5(6.81) | 35.5(4.67) | 31.8(4.11) | 104.3(5.84) | ||
| 6160.747 | 2.104 | 1.26 | - | - | - | - | - | - | 66.4(6.00) | ||
| 4702.991 | Mg I | 4.346 | 0.666 | - | - | - | - | - | 115.9(6.05) | 151.9(6.95) | |
| 4730.029 | 4.346 | 2.523 | 37.1(6.30) | - | - | - | - | 28.4(6.29) | - | ||
| 5528.405 | 4.346 | 0.62 | - | 89.4(5.35) | 67.0(5.45) | 68.5(5.46) | - | 141.5(6.06) | 171.8(7.09) | ||
| 5711.088 | 4.346 | 1.833 | 92.4(6.33) | - | - | - | 12.4(5.47) | - | - | ||
| 5948.541 | Si I | 5.083 | 1.23 | - | 110.0(6.99) | - | 24.8(5.91) | 25.7(6.01) | - | 90.8(6.63) | |
| 6237.319 | 5.613 | 0.53 | - | 98.7(6.80) | - | 27.0(5.92) | 20.2(5.78) | - | - | ||
| 4425.437 | Ca I | 1.879 | 0.385 | - | - | 66.0(4.60) | - | - | - | - | |
| 4435.679 | 1.89 | 0.52 | - | 57.8(4.00) | - | - | - | - | - | ||
| 4455.887 | 1.899 | 0.51 | - | - | 38.8(4.03) | - | - | - | - | ||
| 5265.56 | 2.52 | 0.11 | - | 40.4(3.90) | - | 50.3(4.38) | - | - | - | ||
| 5581.965 | 2.523 | 1.833 | 116.9(5.13) | - | - | - | - | 56.7(4.36) | - | ||
| 5590.114 | 2.521 | 0.71 | - | - | 12.4(4.22) | - | 23.1(4.38) | 47.4(4.21) | 74.6(5.43) | ||
| 5594.462 | 2.523 | 0.05 | - | 58.7(3.89) | 31.8(3.91) | - | - | - | - | ||
| 5857.451 | 2.932 | 0.23 | - | - | - | - | 44.9(4.35) | 59.7(4.01) | 94.5(5.34) | ||
| 6102.723 | 1.879 | 0.89 | - | - | - | - | 53.4(4.35) | 98.2(4.12) | 115.9(5.63) | ||
| 6162.173 | 1.899 | 0.1 | - | 137.6(3.92) | - | - | 105.7(4.34) | - | - | ||
| 6166.439 | 2.521 | 0.9 | - | - | - | - | - | 37.5(4.16) | 72.1(5.54) | ||
| 6169.042 | 2.523 | 0.55 | - | - | - | - | 36.2(4.47) | - | - | ||
| 6169.563 | 2.523 | 0.27 | - | - | - | - | - | - | 96.0(5.37) | ||
| 6439.075 | 2.525 | 0.47 | - | - | - | - | 103.7(4.66) | 137.5(4.24) | 155.9(5.61) | ||
| 6449.808 | 2.523 | 0.55 | 138.0(5.12) | - | - | - | - | - | 92.6(5.55) | ||
| 6471.662 | 2.525 | 0.59 | 152.7(5.36) | - | - | - | 42.9(4.62) | 68.0(4.28) | - | ||
| 6493.781 | 2.521 | 0.14 | - | - | 69.1(4.12) | - | - | - | 112.0(5.23) | ||
| 4453.312 | Ti I | 1.43 | 0.051 | - | - | - | - | - | - | 59.2(4.34) | |
| 4533.239 | 0.848 | 0.476 | - | - | - | - | 62.2(2.60) | - | - | ||
| 4617.269 | 1.749 | 0.389 | - | - | - | - | - | - | 81.0(4.25) | ||
| 4778.255 | 2.24 | 0.22 | - | - | - | - | - | - | 38.1(4.54) | ||
| 4820.41 | 1.503 | 0.441 | - | - | - | 25.4(3.17) | - | - | - | ||
| 4840.874 | 0.899 | 0.509 | 163.9(3.80) | - | - | - | - | - | 89.1(4.27) | ||
| 4926.147 | 0.818 | 2.17 | 78.8(3.83) | - | - | - | - | - | - | ||
| 4999.5 | 0.83 | 0.31 | - | - | 28.4(2.36) | 82.8(3.13) | - | - | 133.6(4.31) | ||
| 5024.842 | 0.818 | 0.602 | - | - | - | - | - | - | 94.3(4.33) | ||
| 5039.96 | 0.02 | 1.13 | - | 68.4(2.32) | - | - | - | - | 104.5(4.12) | ||
| 5210.386 | 0.047 | 0.884 | - | 84.8(2.24) | - | 77.6(2.90) | - | - | - | ||
| 5471.197 | 1.443 | 1.44 | - | - | - | - | - | 32.6(3.45) | - | ||
| 5739.982 | 2.236 | 0.67 | - | - | - | - | - | - | 23.6(4.62) | ||
| 5918.535 | 1.07 | 1.46 | 103.4(3.64) | - | - | - | - | - | 36.6(4.30) | ||
| 5922.11 | 1.046 | 1.466 | 95.3(3.50) | - | - | - | - | - | 45.0(4.44) | ||
| 5937.811 | 1.067 | 1.89 | - | - | - | - | - | 38.6(3.36) | - | ||
| 5941.751 | 1.05 | 1.51 | 95.8(3.56) | - | - | - | - | - | 31.7(4.24) |
The numbers in the parenthesis in columns 5 - 11 give the derived abundances from the respective line.
| Wavelength(Å) | El | (eV) | log gf | BD19 132 | BD19 290 | HE 11570518 | HE 13042111 | HE 13542257 | BD+19 3109 | HD 202851 | |
|---|---|---|---|---|---|---|---|---|---|---|---|
| 5965.828 | 1.879 | 0.409 | - | - | - | - | - | 57.0(3.38) | - | ||
| 5978.543 | 1.873 | 0.496 | - | - | - | - | - | 52.6(3.39) | - | ||
| 6064.629 | 1.046 | 1.944 | - | - | - | - | - | - | 26.8(4.56) | ||
| 6303.757 | 1.443 | 1.566 | - | - | - | - | - | 43.5(3.64) | - | ||
| 6556.062 | 1.46 | 1.074 | 89.1(3.59) | - | - | - | - | - | 42.5(4.45) | ||
| 6599.133 | 0.9 | 2.085 | - | - | - | - | - | 60.2(3.49) | - | ||
| 4161.535 | Ti II | 1.084 | 2.36 | - | - | - | - | - | - | 92.8(4.35) | |
| 4443.794 | 1.08 | 0.7 | - | - | - | - | - | - | 157.1(4.15) | ||
| 4493.51 | 1.08 | 2.73 | 60.0(3.34) | - | - | - | - | - | - | ||
| 4563.761 | 1.22 | 0.96 | 139.8(3.33) | 114.3(2.20) | - | - | - | 124.4(3.00) | - | ||
| 4568.314 | 1.22 | 2.65 | 61.1(3.47) | - | - | - | - | 42.1(3.03) | - | ||
| 4571.96 | 1.571 | 0.53 | 123.1(4.73) | - | - | - | - | - | - | ||
| 4636.32 | 1.164 | 2.855 | - | - | - | - | - | - | 67.0(4.42) | ||
| 4708.665 | 1.236 | 2.21 | - | - | - | - | - | - | 86.9(4.29) | ||
| 4764.526 | 1.236 | 2.77 | 62.0(3.57) | - | - | - | 22.2(2.80) | - | 76.8(4.61) | ||
| 4779.985 | 2.048 | 1.37 | - | 20.9(2.16) | 18.3(2.75) | - | - | 57.0(3.14) | 97.5(4.64) | ||
| 4798.521 | 1.08 | 2.43 | - | 296(2.14) | - | - | 42.2(2.68) | - | 82.4(4.21) | ||
| 4805.085 | 2.061 | 1.1 | 87.9(3.56) | - | - | 33.2(2.54) | - | - | - | ||
| 4865.612 | 1.116 | 2.61 | 73.7(3.43) | - | - | - | 31.8(2.70) | - | 80.6(4.38) | ||
| 5185.9 | 1.89 | 1.35 | - | - | 21.8(2.61) | 99.50(5.36) | 48.4(2.64) | 87.2(3.32) | - | ||
| 5226.543 | 1.566 | 1.3 | - | - | 32.1(2.42) | - | - | - | - | ||
| 5336.771 | 1.58 | 1.7 | 81.4(3.23) | - | - | - | - | - | 107.4(4.56) | ||
| 5381.015 | 1.566 | 2.08 | - | - | - | - | - | 69.9(3.20) | - | ||
| 5418.751 | 1.581 | 1.999 | - | 50.8(4.42) | - | - | - | - | - | ||
| 4351.05 | Cr I | 0.97 | 1.45 | - | - | 17.3(3.26) | - | - | - | - | |
| 4600.748 | 1.004 | 1.26 | - | - | - | 87.0(4.52) | - | - | - | ||
| 4626.173 | 0.968 | 1.32 | - | - | - | - | - | 73.7(2.71) | - | ||
| 4737.347 | 3.087 | 0.099 | - | - | - | 29.9(4.29) | - | - | 73.5(5.31) | ||
| 4829.372 | 2.544 | 0.81 | - | - | - | - | - | - | 58.8(5.08) | ||
| 4870.801 | 3.079 | 0.05 | - | - | - | 42.0(4.51) | - | - | - | ||
| 4942.49 | 0.941 | 2.294 | - | - | - | - | - | 33.9(2.91) | 99.5(5.55) | ||
| 5247.565 | 0.961 | 1.64 | - | - | - | - | - | 77.3(2.86) | - | ||
| 5296.691 | 0.982 | 1.4 | - | - | - | - | - | - | 114.3(5.18) | ||
| 5298.277 | 0.983 | 1.15 | - | - | - | 100.0(4.39) | - | - | 125.6(5.19) | ||
| 5300.744 | 0.982 | 2.12 | - | - | - | - | - | 46.1(2.92) | - | ||
| 5312.871 | 3.45 | 0.562 | - | - | - | - | - | - | 28.6(5.23) | ||
| 5345.801 | 1.003 | 0.98 | - | - | - | - | - | 122.9(2.91) | 145.7(5.16) | ||
| 5348.312 | 1.003 | 1.29 | - | - | 18.8(3.10) | - | - | 95.6(2.81) | - | ||
| 5409.772 | 1.03 | 0.72 | - | - | - | - | - | 125.4(2.70) | 168.4(5.25) | ||
| 5787.965 | 3.323 | 0.083 | - | - | - | - | - | - | 65.9(5.32) | ||
| 4634.07 | Cr II | 4.072 | 1.24 | - | 25.9(3.87) | - | - | 44.6(4.24) | - | - | |
| 4812.337 | 3.864 | 1.8 | - | 39.4(3.73) | - | - | - | - | - | ||
| 4848.25 | 3.864 | 1.14 | - | - | - | - | 35.9(4.36) | - | - | ||
| 5305.853 | 3.827 | 2.357 | - | - | - | - | - | - | 36.1(5.40) | ||
| 5308.404 | 4.072 | 1.81 | - | - | - | - | - | - | 37.8(5.16) | ||
| 5334.869 | 4.073 | 1.562 | - | - | - | - | - | - | 43.5(5.04) | ||
| 4470.472 | Ni I | 3.399 | 0.31 | 30.8(4.19) | - | - | - | - | - | - | |
| 4686.207 | 3.597 | 0.64 | - | - | - | - | - | 44.7(4.59) | 75.0(5.77) | ||
| 4703.803 | 3.658 | 0.735 | - | - | - | - | - | - | - | ||
| 4714.408 | 3.38 | 0.23 | - | - | - | - | 30.5(3.59) | - | - | ||
| 4731.793 | 3.833 | 0.85 | - | - | - | - | - | - | 61.0(5.92) | ||
| 4752.415 | 3.658 | 0.7 | - | - | - | - | - | - | 76.4(5.91) | ||
| 4756.51 | 3.48 | 0.34 | - | - | - | - | - | - | 90.8(5.69) | ||
| 4980.166 | 3.606 | 0.11 | - | - | - | 28.10(4.00) | - | - | - | ||
| 5035.357 | 3.635 | 0.29 | 78.9(4.21) | - | - | - | - | - | - | ||
| 5081.107 | 3.847 | 0.3 | 52.8(4.02) | - | - | 38.7(4.23) | - | - | - | ||
| 5082.35 | 3.657 | 0.54 | - | - | - | 32.2(4.06) | - | - | - | ||
| 5084.089 | 3.678 | 0.03 | 75.0(4.45) | - | 15.6(3.92) | - | 20.7(3.87) | - | - | ||
| 5099.927 | 3.678 | 0.1 | - | - | - | - | - | - | 97.4(5.78) | ||
| 5102.96 | 1.676 | 2.62 | - | 44.9(4.07) | - | - | - | 89.0(4.45) | - | ||
| 5115.389 | 3.834 | 0.11 | - | - | 11.7(4.09) | - | - | - | 83.3(5.64) | ||
| 5146.48 | 3.706 | 0.12 | - | 55.4(4.15) | - | - | - | - | - | ||
| 6175.36 | 4.089 | 0.53 | - | - | - | - | - | - | 52.0(5.64) | ||
| 6176.807 | 4.088 | 0.26 | - | - | - | - | - | - | 70.5(6.01) | ||
| 6204.6 | 4.088 | 1.13 | - | - | - | - | - | - | 31.3(5.82) | ||
| 6327.593 | 1.676 | 3.15 | - | - | - | - | - | 66.8(4.34) | 75.7(5.84) | ||
| 6378.247 | 4.154 | 0.89 | - | - | - | - | - | - | 37.8(5.79) | ||
| 6643.629 | 1.676 | 2.3 | - | 102.2(4.14) | 14.6(3.89) | 61.3(4.31) | 34.8(3.98) | - | - | ||
| 4722.15 | Zn I | 4.029 | 0.37 | - | 27.4(2.33) | - | - | 29.9(2.50) | - | - | |
| 4810.53 | 4.08 | 0.17 | 48.3(3.00) | - | - | - | - | 29.6(2.48) | 64.1(3.48) | ||
| 4883.684 | Y II | 1.084 | 0.07 | - | - | 73.5(0.67) | - | - | - | 169.0(2.97) | |
| 5087.416 | 1.084 | 0.17 | - | - | - | - | - | - | 164.9(3.12) | ||
| 5119.112 | 0.992 | 1.36 | - | - | - | - | - | 89.2(1.55) | 104.3(3.11) | ||
| 5200.406 | 0.992 | 1.36 | - | - | 35.5(0.55) | - | - | - | - |
The numbers in the parenthesis in columns 5 - 11 give the derived abundances from the respective line.
| Wavelength(Å) | El | (eV) | log gf | BD19 132 | BD19 290 | HE 11570518 | HE 13042111 | HE 13542257 | BD+19 3109 | HD 202851 | |
|---|---|---|---|---|---|---|---|---|---|---|---|
| 5205.724 | 1.033 | 0.34 | - | - | 41.8(0.48) | - | - | - | - | ||
| 5289.815 | 1.033 | 1.85 | - | - | - | - | - | 44.4(1.23) | 78.2(2.99) | ||
| 5402.774 | 1.839 | 0.51 | - | 25.9(0.46) | - | - | - | - | - | ||
| 5544.611 | 1.738 | 1.09 | 101.0(2.64) | - | - | 14.1(0.83) | - | - | - | ||
| 5546.009 | 1.748 | 1.11 | - | - | - | - | - | - | - | ||
| 5662.925 | 1.944 | 0.16 | 156.8(2.64) | 52.7(0.31) | 22.7(0.61) | - | - | - | - | ||
| 6613.733 | 1.748 | 1.1 | 123.5(2.85) | - | - | 12.1(0.67) | - | 54.5(1.47) | - | ||
| 4739.48 | Zr I | 0.651 | 0.23 | - | 8.3(0.95) | - | 30.9(1.80) | - | - | - | |
| 4772.323 | 0.623 | 0.04 | - | 8.3(1.10) | - | - | - | - | - | ||
| 6134.585 | 0 | 1.28 | - | - | - | 19.2(1.75) | - | - | - | ||
| 4317.321 | Zr II | 0.713 | 1.38 | 98.3(2.24) | - | - | - | - | 53.7(1.28) | - | |
| 5112.297 | 1.665 | 0.59 | 88.0(2.34) | - | - | - | - | - | - | ||
| 4336.244 | Ce II | 0.704 | 0.564 | - | 47.3(0.64) | - | - | - | - | - | |
| 4364.653 | 0.495 | 0.201 | - | - | - | - | - | 94.5(1.08) | - | ||
| 4407.273 | 0.701 | 0.741 | - | - | - | 21.6(0.67) | - | - | - | ||
| 4483.893 | 0.864 | 0.01 | - | - | 38.5(0.99) | - | - | - | - | ||
| 4497.846 | 0.958 | 0.349 | - | - | - | - | 48.2(1.11) | - | 80.5(2.90) | ||
| 4508.079 | 0.621 | 1.238 | - | - | - | - | - | 36.1(1.04) | 57.4(2.58) | ||
| 4560.28 | 0.91 | 0 | - | - | 34.4(0.96) | - | - | - | - | ||
| 4562.359 | 0.477 | 0.081 | - | - | 62.9(0.87) | - | 97.8(1.20) | - | 103.5(2.30) | ||
| 4628.161 | 0.516 | 0.008 | 174.3(2.31) | - | - | - | - | 105.1(0.95) | 115.7(2.69) | ||
| 4725.069 | 0.521 | 1.204 | - | 32.1(0.65) | - | - | - | 40.6(0.87) | - | ||
| 4747.167 | 0.32 | 1.246 | - | - | - | - | - | 53.7(0.86) | - | ||
| 4773.941 | 0.924 | 0.498 | - | - | - | - | - | 42.3(0.77) | - | ||
| 4873.999 | 1.107 | 0.892 | - | - | - | 12.5(0.84) | - | - | 53.6(2.67) | ||
| 5187.458 | 1.211 | 0.104 | - | 60.9(0.78) | - | - | 58.5(1.25) | - | 82.9(2.68) | ||
| 5274.229 | 1.044 | 0.323 | - | 89.2(0.46) | 62.2(1.19) | - | - | 89.2(0.84) | - | ||
| 5330.556 | 0.869 | 0.76 | 103.2(2.06) | - | - | - | 39.8(1.12) | - | 70.9(2.60) | ||
| 6034.205 | 1.458 | 1.019 | 53.6(2.23) | - | - | - | - | - | 35.2(2.74) | ||
| 5188.217 | Pr II | 0.922 | 1.145 | 53.4(1.52) | - | - | - | - | - | 36.0(2.17) | |
| 5219.045 | 0.795 | 0.24 | 112.1(1.47) | - | 11.9(0.31) | 21.3(-0.06) | 24.0(0.06) | 60.3(0.37) | - | ||
| 5259.728 | 0.633 | 0.682 | 93.4(1.30) | - | - | - | - | - | 72.7(2.15) | ||
| 5292.619 | 0.648 | 0.3 | - | 53.1(-0.06) | 10.8(0.15) | - | 33.3(0.13) | 54.5(0.10) | 77.3(1.90) | ||
| 5322.772 | 0.482 | 0.315 | - | 55.9(-0.23) | 12.4(0.04) | - | 49.5(0.23) | 79.3(0.28) | 86.9(1.94) | ||
| 6165.891 | 0.923 | 0.205 | - | - | 8.70(0.21) | - | - | 50.3(0.18) | - | ||
| 4446.384 | Nd II | 0.204 | 0.59 | - | - | 49.4(0.84) | - | - | 93.6(0.75) | - | |
| 4451.563 | 0.38 | 0.04 | - | - | - | - | - | 112.6(0.84) | 119.8(2.52) | ||
| 4556.133 | 0.064 | 1.61 | - | - | - | - | - | 58.1(0.76) | - | ||
| 4556.133 | 0.064 | 1.61 | 123.1(2.14) | - | 17.0(0.99) | - | - | - | - | ||
| 4703.572 | 0.38 | 1.07 | - | 58.8(0.50) | - | - | - | - | - | ||
| 4706.543 | 0 | 0.88 | - | - | - | - | - | - | - | ||
| 4797.153 | 0.559 | 0.95 | - | - | - | 29.1(0.67) | 41.7(0.82) | - | - | ||
| 4811.342 | 0.064 | 1.14 | 148.9(2.05) | 90.7(0.50) | - | - | 79.9(1.15) | 85.3(0.68) | 98.4(2.59) | ||
| 4825.478 | 0.182 | 0.86 | - | - | 43.0(0.90) | - | - | - | - | ||
| 4859.039 | 0.32 | 0.83 | - | - | 41.1(0.99) | - | 63.6(0.80) | - | 87.5(2.29) | ||
| 4947.02 | 0.559 | 1.25 | 109.0(2.08) | 28.9(0.40) | - | - | 29.5(0.85) | 56.0(0.96) | 62.3(2.35) | ||
| 4961.387 | 0.631 | 0.71 | - | 58.7(0.40) | 39.0(1.18) | - | 63.0(1.04) | - | - | ||
| 5130.59 | 1.3 | 0.1 | - | - | 37.0(1.09) | - | - | - | - | ||
| 5212.361 | 0.204 | 0.87 | - | 123.9(0.70) | 60.1(1.17) | - | 87.5(1.13) | 103.3(0.80) | 99.6(2.41) | ||
| 5255.506 | 0.204 | 0.82 | - | - | 41.9(0.82) | - | 83.5(0.98) | 105.9(0.78) | - | ||
| 5276.869 | 0.859 | 0.44 | - | - | 22.4(0.82 | - | - | 65.8(0.67) | - | ||
| 5287.133 | 0.744 | 1.3 | 101.5(2.17) | - | - | - | - | 42.4(0.96) | 49.5(2.31) | ||
| 5293.163 | 0.822 | 0.06 | - | - | 46.9(0.86) | - | - | - | - | ||
| 5311.453 | 0.986 | 0.42 | - | - | - | 28.2(0.71) | 49.8(1.04) | 58.1(0.84) | 66.8(2.23) | ||
| 5319.815 | 0.55 | 0.21 | - | - | 63.0(0.94) | - | - | - | - | ||
| 5356.967 | 1.264 | 0.25 | 126.0(2.34) | - | - | - | 30.90(2.51) | - | 72.2(2.38) | ||
| 5361.51 | 0.68 | 0.4 | - | 106.9(0.65) | 51.3(1.10) | - | - | 94.2(0.85) | - | ||
| 5371.927 | 1.412 | 0.003 | - | - | - | - | - | - | - | ||
| 5442.264 | 0.68 | 0.91 | 143.8(2.39) | - | 28.1(1.19) | - | - | 71.0(0.92) | - | ||
| 5718.118 | 1.41 | 0.34 | - | - | - | - | - | 37.4(0.78) | - | ||
| 5825.857 | 1.08 | 0.76 | - | - | - | - | - | 49.4(0.93) | 59.3(2.33) | ||
| 4424.337 | Sm II | 0.485 | 0.26 | - | - | - | 34.7(0.08) | - | - | - | |
| 4434.318 | 0.378 | 0.576 | 108.3(1.14) | 52.8(-0.21) | - | - | - | 80.1(0.50) | - | ||
| 4458.509 | 0.104 | 1.11 | - | 44.3(-0.19) | - | 28.0(0.05) | 56.1(0.51) | 67.7(0.34) | 71.8(1.74) | ||
| 4499.475 | 0.248 | 1.413 | 81.6(1.18) | - | 16.6(0.73) | - | 28.3(0.42) | 51.2(0.52) | 59.4(1.89) | ||
| 4519.63 | 0.543 | 0.751 | - | - | - | - | - | 59.6(0.46) | - | ||
| 4615.444 | 0.544 | 1.262 | - | - | - | - | - | 25.0(0.21) | 53.9(1.94) | ||
| 4674.593 | 0.184 | 1.055 | - | - | - | - | - | 66.3(0.28) | - | ||
| 4676.902 | 0.04 | 1.407 | 94.2(1.04) | - | 16.3(0.46) | - | - | - | - | ||
| 4704.4 | 0 | 1.562 | 99.7(1.23) | - | - | - | - | - | - | ||
| 4726.026 | 0.333 | 1.849 | - | - | - | - | - | 22.6(0.40) | - | ||
| 4791.58 | 0.104 | 1.846 | 84.7(1.35) | - | - | - | 25.6(0.57) | - | 42.5(1.73) | ||
| 4815.805 | 0.185 | 1.501 | - | 23.2(-0.17) | - | - | - | 45.9(0.30) | - | ||
| 4844.209 | 0.277 | 1.558 | - | - | - | - | - | - | 53.2(1.87) | ||
| 4854.368 | 0.379 | 1.873 | 44.4(1.07) | - | - | - | - | - | 29.1(1.79) |
The numbers in the parenthesis in columns 5 - 11 give the derived abundances from the respective line. The line information are taken from Kurucz database of atomic line lists (https://lweb.cfa.harvard.edu/amp/ampdata/kurucz23/sekur.html).