Varstrometry for Off-nucleus and Dual sub-Kpc AGN (VODKA): Hubble Space Telescope Discovers Double Quasars
Abstract
Dual supermassive black holes (SMBHs) at kpc scales are the progenitor population of SMBH mergers and play an important role in understanding the pairing and dynamical evolution of massive black holes in galaxy mergers. Because of the stringent resolution requirement and the apparent rareness of these small-separation pairs, there are scarce observational constraints on this population, with few confirmed dual SMBHs at kpc separations at . Here we present results from a pilot search for kpc-scale dual quasars selected with Gaia Data release 2 (DR2) astrometry and followed up with Hubble Space Telescope (HST) Wide Field Camera 3 dual-band (F475W and F814W) snapshot imaging. Our targets are quasars primarily selected with the varstrometry technique, i.e., light centroid jitter caused by asynchronous variability from both members in an unresolved quasar pair, supplemented by sub-arcsec pairs already resolved by Gaia DR2. We find an overall high fraction of HST-resolved pairs among the varstrometry-selected quasars (unresolved in Gaia DR2), , increasing toward high redshift ( at ). We discuss the nature of the 45 resolved sub-arcsec pairs based on HST and supplementary data. A substantial fraction () of these pairs are likely physical quasar pairs or gravitationally lensed quasars. We also discover a triple quasar candidate and a quadruply lensed quasar, which is among the smallest-separation quadruple lenses. These results provide important guidelines to improve varstrometry selection and follow-up confirmation of kpc-scale dual SMBHs at high redshift.
1 Introduction
Since most massive galaxies harbor a central supermassive black hole (SMBH; Kormendy & Richstone, 1995; Kormendy & Ho, 2013), galaxy mergers should result in the formation of dual SMBHs and eventually binary SMBHs (Begelman et al., 1980). Dual SMBHs are the precursors of binary SMBHs. A binary SMBH is on a compact ( parsec) orbit in its own potential whereas a dual SMBH is on wider orbits and evolving in the potential of the (merged) host galaxy. Theory predicts strong gravitational waves (GWs) from the final coalescence of merging SMBHs – a “standard siren” for cosmology and a direct testbed for strong-field general relativity (Hughes, 2009; Centrella et al., 2010). The presence of gas accretion during the merger process can dramatically change the expectations for the duration of the gravitational-wave-emitting phase (Bogdanovic et al., 2021).
Before the binary SMBH stage, the two black holes spend several hundred million years in the dual SMBH stage as the galaxy merger proceeds. The observational search of close ( kpc) dual quasars at is particularly important for constraining the merger process, because the effects of mergers are believed to be the most significant in the high-redshift, high-luminosity, and close-separation regime (Hopkins et al., 2008). The redshift range is also where we expect the horizon of the stochastic gravitational wave background from the ensemble of SMBH binaries (Arzoumanian et al., 2018).
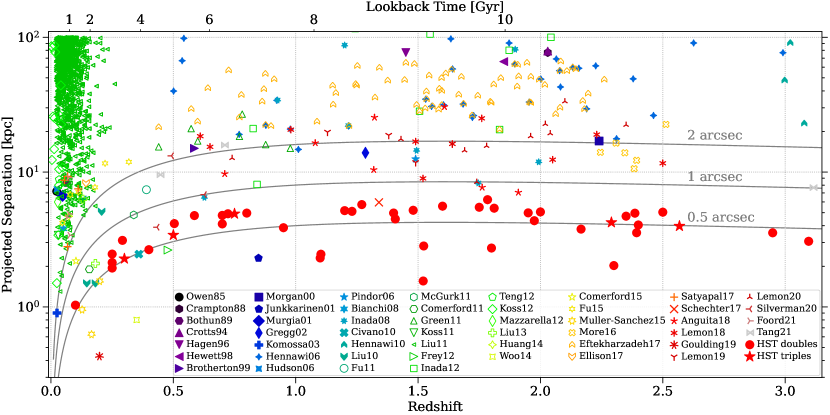
In the past decade, significant progress has been made toward finding concrete evidence for active merging SMBHs in kpc-scale dual active galactic nuclei (AGN) (De Rosa et al., 2020). The majority of known dual AGN are at low redshifts and/or at large physical separations (20 kpc, Figure 1), and many have relatively low luminosities. Little is known about dual SMBHs at the cosmic “high noon” (i.e., ), when both the number density of luminous quasars and the global star formation rate density peak (Richards et al., 2006; Madau & Dickinson, 2014). Finding small-separation dual quasars at high redshifts is extremely difficult observationally due to the typical sizes of the point-spread functions (PSFs) of ground-based optical surveys. There is only one 2.3 kpc dual quasar known at from a serendipitous discovery (Junkkarinen et al., 2001; Shields et al., 2012) and five dual quasars with 6 10 kpc at from systematic searches (Inada et al., 2012; More et al., 2016; Lemon et al., 2018; Silverman et al., 2020; Tang et al., 2021, see Figure 1 for details). From a theoretical perspective, the dynamical evolution of dual SMBHs in merged galaxies can be well described by dynamical friction before entering the GW-dominated regime (Yu, 2002; Merritt, 2013; Chen et al., 2020a), which results in shorter time spans on smaller separations. Therefore, the frequency of kpc dual SMBHs is expected to be substantially lower than those on tens of kpc separations, requiring an efficient targeting scheme to identify candidates for follow-up confirmation.
Although not the focus of this work, searches for binary SMBHs (parsec) are even more challenging. There are only two reported cases of (candidate) binary SMBHs resolved with the Very Long Baseline Array (VLBA) imaging at 7 parsec (Rodriguez et al., 2006) and 0.35 parsec (Kharb et al., 2017) from serendipitous searches. While searches using indirect methods (from periodic light curves or radial velocity shifts of broad emission lines, Eracleous et al., 2012; Shen et al., 2013; Liu et al., 2014; Graham et al., 2015; Charisi et al., 2016; Runnoe et al., 2017; Wang et al., 2017; Guo et al., 2019; Liu et al., 2019; Chen et al., 2020b; Liao et al., 2021) have yielded candidates of sub-pc binary SMBHs, alternative scenarios involving single SMBHs remain possible. Direct imaging confirmation for most of these sub-pc binary candidates is not feasible even with Very Long Baseline Interferometry (VLBI) in radio due to strict angular resolution requirement (Burke-Spolaor, 2011).
Shen et al. (2019) and Hwang et al. (2020) have proposed a new astrometric technique, varstrometry, with Gaia data (Gaia Collaboration et al., 2018) to discover close (sub-arcsecond) dual/lensed quasars (also see Williams & Saha, 1995; Liu, 2015; Springer & Ofek, 2021). It takes advantage of the ubiquitous quasar variability, which in dual or lensed quasars results in an astrometric noise signature when the asynchronous variability from the two quasars causes centroid jitters in the unresolved system. Gaia’s full-sky coverage and depth to mag (reaching extragalactic objects) enable a large-scale systematic search in the poorly explored sub-arcsecond regime at high redshift (Hwang et al., 2020; Shen et al., 2021).
In this work, we report the first results from a pilot HST dual-band imaging program to follow up the Gaia-astrometry-selected dual/lensed quasar candidates. It reveals compact double or triple sources in the 45 targets, 40% of which are possible dual/lensed quasars based on the HST two-band colors. The targets that are not quasar-star superpositions are more likely to be dual quasars instead of lenses, which require very massive lenses at high redshifts given the non-detection of the lens galaxy in the HST image (Shen et al., 2021).
The paper is organized as follows. In §2, we describe the methodology and the data we use for this study. We present our main results in §3 and discuss their implications and future prospects in §4. We summarize our findings in §5. Throughout this paper we focus on optically unobscured, broad-line quasars, for which we can apply this varstrometry technique, and all physical separations are the projected separation. A flat CDM cosmology is adopted throughout with , =0.3, and .
2 Observations and Data Analysis
2.1 Target Selection
Our parent quasar sample includes both spectroscopically confirmed SDSS DR7 quasars (Shen et al., 2011b) and DR14 quasars (Pâris et al., 2018), and photometrically selected quasar candidates based on WISE (Wright et al., 2010; Mateos et al., 2012; Secrest et al., 2015). The target selection criteria are mainly based on Gaia DR2 (Gaia Collaboration et al., 2018). Our targets are selected as Gaia-unresolved quasars with excess astrometric noise (i.e., varstrometry selection) and quasars with a sub-arcsec companion resolved in Gaia data (Hwang et al., 2020). For Gaia-unresolved sources, we use astrometric_excess_noise (Lindegren et al., 2012, 2018) as a surrogate for the astrometric jitters caused by varstrometry (Hwang et al., 2020; Shen et al., 2019). For Gaia-resolved sources, we prioritize pairs with small angular separations (04-07) and use other information (see below) to reduce chance superposition stars. The Gaia-resolved sources are intended to increase the statistics on sub-arcsec pairs in quasars, since HST is able to resolve these pairs and derive color/morphology information, though they are at wider separation due to the minimal separation limit of 04 in Gaia DR2 (Arenou et al., 2018)
The detailed target selection and target categories are:
-
1.
SDSS quasars with a single Gaia match within 3″ (40 targets selected). We use both the SDSS DR7 quasar catalog (Shen et al., 2011b) and the DR14 quasar catalog (Pâris et al., 2018). Because the extended structure of low-redshift host galaxies may also result in a high astrometric_excess_noise (Hwang et al., 2020), we apply a redshift cut of and require that the source is flagged as non-extended in all filters of Pan-STARRS1 (Chambers et al., 2016). To reduce contamination from foreground stars, we exclude sources where the SDSS fiber (2″ or 3″) spectra have obvious stellar features. Then, we select 8 targets that have astrometric_excess_noise mas and Gaia -band magnitude mag, and additional 32 targets that have astrometric_excess_noise mas and Gaia -band magnitude mag. These magnitude cuts restrict the selection to reliable Gaia astrometry.
-
2.
WISE+Pan-STARRS1 quasars with a single Gaia match within 3″ (40 targets selected). We use an all-sky photometric quasar sample selected with WISE data (Mateos et al., 2012; Secrest et al., 2015) and the cross-match catalog provided by Gaia DR2 (Marrese et al., 2019). We further require that the target is flagged as non-extended in all filters in Pan-STARRS1 (Chambers et al., 2016). To reduce contamination from stars misclassified as quasars in the photometric quasar catalog, we exclude targets that have non-zero total proper motions at . Then, we select 40 targets that have the largest astrometric_excess_noise ( mas) with Gaia -band magnitude mag.
-
3.
WISE-only quasars without SDSS and Pan-STARRS1 information and with a single Gaia match within 3″ (20 targets selected). We select WISE quasars (Mateos et al., 2012; Secrest et al., 2015; Marrese et al., 2019) that are not covered by Pan-STARRS1 (Chambers et al., 2016). Without the optical imaging information, this sample has a higher risk of being affected by extended host galaxies at low redshifts. Specifically, we find that if we select the WISE quasars with highest astrometric_excess_noise directly, our sample is dominated by low-redshift, extended galaxies upon inspecting their optical images from the DECam Legacy Survey (DECaLS, Dey et al., 2019).
To improve the selection, we impose an additional criterion on phot_bp_rp_excess_factor, which is a quality indicator for Gaia photometry (Riello et al., 2018). In Gaia DR2, G-band photometry is measured by PSF fitting, while the BP and RP photometry is the sum of fluxes in a window (no de-blending treatment, Riello et al., 2018). Therefore, the ratio between the G-band flux and the sum of BP- and RP-fluxes (phot_bp_rp_excess_factor) can be used as a measure of how PSF-like a target is. Specifically, here we select WISE-only quasars with phot_bp_rp_excess_factor . Then we select the targets with astrometric_excess_noise between 1.5 and 2.5 mas, Gaia proper motions consistent with 0 within 3, and Gaia -band magnitude mag. We avoid astrometric_excess_noise mas because the images from DECaLS (if available) suggest that many of them may still be affected by extended host galaxies. A color cut of BP-RP is also imposed because we find it particularly useful to avoid low-redshift () galaxies. Despite precautions, this WISE-only sample may have a high rate of contamination by stars and/or by low-redshift host galaxies. We thus prioritize the targets with larger astrometric_excess_noise and limit the number of the proposed HST targets to 20.
-
4.
SDSS quasars with multiple Gaia matches (20 targets selected). The selection is similar to the single-matched SDSS quasars, but here the targets have multiple Gaia matches within 3″. To reduce chance projection of foreground stars, we exclude sources that have non-zero parallaxes or non-zero proper motions with significance , and exclude those having obvious stellar features in the SDSS spectra. Two targets have three Gaia matches (J121135.93+354417.6 and J133039.82001035.7), and the other targets have two Gaia matches. We prioritize targets with small angular separations (052–073), which are usually unresolved by ground-based surveys. Since this selection does not involve astrometric_excess_noise, we do not impose any cuts on spectroscopic redshift and G-band magnitude.
-
5.
WISE+Pan-STARRS1 quasars with multiple Gaia matches (20 targets selected). The selection is similar to the single-matched WISE+Pan-STARRS1 quasars, but here the targets have multiple Gaia matches within 3″. We exclude sources that have non-zero parallaxes or proper motions with significance . We prioritize targets with small angular separations (048–066).
-
6.
WISE-only quasars with multiple Gaia matches (10 targets selected). We exclude sources that have non-zero parallaxes or proper motions with significance , and we prioritize targets with small angular separations (046–060).
| Target Category | # targeted | # observed | # multiple |
|---|---|---|---|
| 1. SDSS Single | 40 | 17 | 9 |
| 2. WISE+PS1 Single | 40 | 26 | 7 |
| 3. WISE-only Single | 20 | 13 | 2 |
| 4. SDSS Multiple | 20 | 7 | 7 |
| 5. WISE+PS1 Multiple | 20 | 15 | 15 |
| 6. WISE-only Multiple | 10 | 6 | 5 |
| Total | 150 | 84 | 45 |
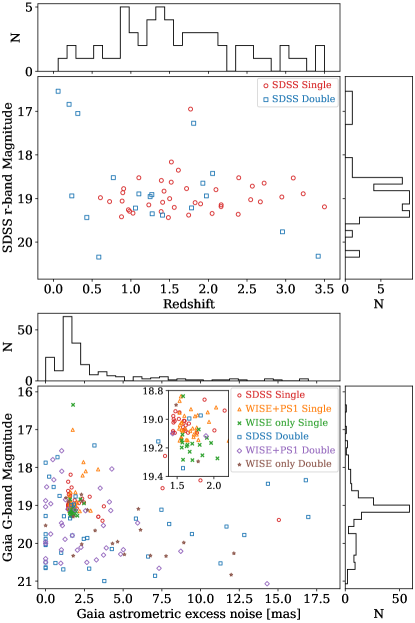
Our final target sample for the HST follow-up observations consists of 150 quasars. Table 1 summarizes the numbers of the proposed targets, the observed targets and the pairs discovered by the HST in each category. The top panel of Figure 2 shows the distributions of redshift and SDSS -band PSF magnitude for the 60 targets selected from SDSS. The bottom panel of Figure 2 shows the distributions of Gaia astrometric_excess_noise and -band magnitude for the final target sample.
2.2 HST/WFC3 F475W and F814W Imaging
We observed 84 out of the 150 targets with the Wide Field Camera 3 (WFC3) on board the HST in Cycle 27 and 28 from 2019 October 9 UT to 2021 September 23 UT (Program ID: SNAP-15900; PI: Hwang). Each target was imaged in the UVIS/F475W (with pivot wavelength 4773Å and effective width of 1344Å ) and UVIS/F814W (with 8024Å and effective width of 1536Å ) filters within a single HST SNAP orbit to help distinguish stars and quasars. The typical net exposure times are 360s in the F475W filter and 400s in the F814W filter for each target and are scaled for fainter targets to reach similar signal-to-noise ratios. Table 2 lists the spectroscopic and photometric properties and the observation details for all the observed targets. Target names are in the form of “hhmmss.ssddmmss.s” based on Gaia DR2; the coordinates of the brightest source are used if multiple sources are detected in Gaia. Magnitudes are reported in ST magnitude ( = 21.1), where is in units of erg s-1 cm-2 Å-1.
The F475W filter covers rest-frame 1600–2200 Å and the F814W filter covers rest-frame 2800-3800 Å at the median redshift of our targets. They sample the ultraviolet part of the quasar spectrum. We use these two bands to derive the F475WF814W color to facilitate the interpretation of resolved pairs.
The WFC3-UVIS charge-coupled device (CCD) has a sampling of 004 pixel-1. The observations were dithered at 4 positions to properly sample the PSF and to reject cosmic rays and bad pixels. A 512512 sub-array was employed, yielding a field of view (FOV) of 20.520.5′′.
We reduced the HST images following standard procedures. We used the calwf3 and MultiDrizzle tasks from the STSDAS package in PyRAF. We processed the images with MultiDrizzle to correct for geometric distortion and pixel area effects. We combined the dithered frames and rejected cosmic rays and hot pixels. The resulting images are photometrically and astrometrically calibrated. MultiDrizzle relies on the positions of guide stars for absolute astrometric calibration. The absolute astrometric accuracy of the reduced images is limited by the positional uncertainty of guide stars (02) and the calibration uncertainty of the fine guidance sensor to the instrument aperture (0015). The image relative astrometric accuracy is limited by the uncertainty in the geometric distortion correction of the camera. The typical relative astrometric accuracy is 0004.
2.3 Surface Brightness Decomposition
We perform 2-dimensional (2-D) surface brightness decomposition with GALFIT (Peng et al., 2010). GALFIT fits the image with 2-D functions including PSF, Srsic profiles and various structures such as rings and spiral arms for galaxies and point sources.
The PSF model is constructed using a nearby isolated star in the same field for each target. For those targets without nearby field stars or when the field stars are too faint, we use a general model made from a bright isolated star in one of the visits.
Since our SNAP observations are generally too shallow to detect faint features, a PSF model is often sufficient to fit each component of the resolved pair. A Srsic component with Srsic index is added in the fit if the residuals show significant extended features.
2.4 Photometric Redshift
For the 60 observed targets without a spectroscopic redshift, we estimate photometric redshifts (photo-s) with Skewt-QSO111https://github.com/qian-yang/Skewt-QSO. Skewt-QSO can achieve a photo- accuracy, defined as the fraction of quasars with the difference between the photo- and the spectroscopic redshift within 0.1, of 72%–79% using optical photometry from Pan-STARRS1 or DECaLS with WISE W1 and W2 data (Yang et al., 2017). We use optical photometric data from Pan-STARRS1, or Gaia if Pan-STARRS1 is not available, in combination with WISE W1 and W2 mid-infrared photometry. The photo-s are labeled with dagger symbols in Table 2 and Table 3.
| Name | Redshift | Ast. excess noise | Std.(Flux) | Obs. date | Exp. time | Cat. | ||
|---|---|---|---|---|---|---|---|---|
| [mag] | [mag] | [mas] | [e- s-1] | [UT] | [s] | |||
| (1) | (2) | (3) | (4) | (5) | (6) | (7) | (8) | (9) |
| J000514.20+702249.2⋆ | 0.7† | 18.54/18.85 | 3.522/1.283 | 72.1/21.6 | 2020-01-24 | 360/320 | 5 | |
| J004127.74734706.4 | 1.3† | 16.35 | 1.771 | 225.1 | 2019-11-14 | 40/40 | 3 | |
| J014859.18553037.5⋆ | 0.1† | 18.71/18.90 | 2.309/1.486 | 33.7/46.7 | 2020-08-24 | 320/320 | 6 | |
| J023959.20190507.5 | 0.75† | 19.11 | 1.766 | 35.1 | 2020-07-15 | 360/600 | 2 | |
| J024134.91+780107.0⋆ | 2.35† | 18.95 | 1.917 | 23.6 | 2020-01-31 | 400/320 | 2 | |
| J024205.24453805.2 | 1.3† | 19.16 | 1.571 | 40.5 | 2020-08-28 | 360/400 | 3 | |
| J024628.63+692234.0⋆ | 0.95† | 18.04/19.12 | 4.272/1.892 | 12.6/16.0 | 2019-10-13 | 1080/80 | 5 | |
| J024804.31281449.9 | 1.9† | 18.98 | 1.598 | 34.4 | 2019-10-20 | 320/400 | 2 | |
| J024929.19002104.3 | 1.428 | 18.84 | 18.71 | 1.497 | 48.4 | 2019-10-19 | 360/320 | 1 |
| J025359.01282653.6 | 2.0† | 19.02 | 1.566 | 48.0 | 2021-08-25 | 520/440 | 2 | |
| J025843.71+690543.4 | 0.1† | 18.92 | 2.031 | 37.9 | 2019-10-12 | 1320/240 | 2 | |
| J025956.93735316.8 | 0.85† | 19.11 | 1.573 | 39.8 | 2019-11-09 | 360/480 | 3 | |
| J032233.97551532.9 | 0.1† | 18.80/19.09aaThough Gaia DR2 detects two sources in J03225515, the HST observations only reveal one source. Recent Gaia EDR3 (Gaia Collaboration et al., 2021) only shows one source in J03225515, which suggests that the second source in Gaia DR2 is an artifact. | 1.314/5.986aaThough Gaia DR2 detects two sources in J03225515, the HST observations only reveal one source. Recent Gaia EDR3 (Gaia Collaboration et al., 2021) only shows one source in J03225515, which suggests that the second source in Gaia DR2 is an artifact. | 98.3/24.6aaThough Gaia DR2 detects two sources in J03225515, the HST observations only reveal one source. Recent Gaia EDR3 (Gaia Collaboration et al., 2021) only shows one source in J03225515, which suggests that the second source in Gaia DR2 is an artifact. | 2020-10-04 | 320/320 | 6 | |
| J034828.66401513.1⋆ | 2.4† | 19.29 | 1.708 | 42.0 | 2020-09-30 | 400/440 | 3 | |
| J045528.99445637.6⋆ | 0.5† | 19.98/20.83 | 8.917/11.975 | 27.7/15.0 | 2020-08-09 | 360/400 | 6 | |
| J045905.23071407.1⋆ | 0.25† | 21.07/20.21 | 14.294/8.723 | 13.5/23.0 | 2020-02-05 | 360/400 | 5 | |
| J053620.23+503826.2⋆ | 1.8† | 17.86 | 2.442 | 94.2 | 2020-08-07 | 320/320 | 2 | |
| J054721.54321309.5 | 0.3† | 19.04 | 1.537 | 50.0 | 2019-11-05 | 360/320 | 2 | |
| J055321.99+374004.5 | 0.35† | 19.12 | 1.556 | 68.5 | 2019-12-14 | 480/400 | 2 | |
| J055455.69+511252.8⋆ | 0.7† | 18.51/20.50 | 0.066/2.661 | 51.8/12.8 | 2020-02-23 | 320/320 | 5 | |
| J060155.15071007.3 | 1.95† | 19.08 | 1.576 | 33.4 | 2019-12-09 | 480/400 | 2 | |
| J060734.57064838.5⋆ | 2.3† | 18.10 | 2.587 | 91.1 | 2020-04-23 | 1320/80 | 2 | |
| J062026.53071144.2 | 0.75† | 19.02 | 1.935 | 33.0 | 2020-01-30 | 360/400 | 2 | |
| J062903.08753642.8⋆ | 0.3† | 19.65/20.02 | 6.126/2.329 | 72.0/25.6 | 2020-05-09 | 360/400 | 6 | |
| J074800.55+314647.4⋆ | 1.407 | 19.32 | 20.25/20.05 | 0.0/1.008 | 27.3/17.9 | 2020-04-18 | 360/400 | 4 |
| J074817.13+191003.0⋆ | 3.096 | 18.49 | 18.94 | 2.147 | 78.8 | 2021-05-06 | 320/320 | 1 |
| J074922.96+225511.7⋆ | 2.166 | 19.11 | 18.62 | 1.452 | 95.4 | 2020-01-05 | 320/400 | 1 |
| J074930.93+505859.7 | 0.907 | 18.77 | 19.06 | 1.581 | 24.7 | 2019-12-01 | 360/480 | 1 |
| J075350.57+424743.9⋆ | 1.523 | 18.14 | 18.19 | 1.613 | 64.5 | 2020-02-05 | 320/320 | 1 |
| J075824.26+145752.4⋆ | 2.568 | 18.75 | 19.30 | 3.400 | 46.7 | 2020-09-28 | 360/400 | 1 |
| J080414.01443515.4 | 1.85† | 19.20 | 1.562 | 25.1 | 2020-07-31 | 360/400 | 3 | |
| J081603.79+430521.1⋆ | 0.586 | 20.08 | 20.86/20.67 | 7.062/2.810 | 32.5/20.2 | 2019-12-08 | 360/400 | 4 |
| J082341.08+241805.6⋆ | 1.811 | 17.17 | 18.24/17.87 | 0.227/0.0 | 84.1/120.5 | 2020-01-16 | 320/320 | 4 |
| J084129.77+482548.4⋆ | 2.949 | 18.87 | 19.30 | 3.399 | 37.4 | 2019-11-30 | 360/400 | 1 |
| J090408.66+333205.2⋆ | 1.103 | 18.50 | 18.55 | 7.546 | 93.7 | 2020-01-24 | 320/320 | 1 |
| J090501.12+585902.5⋆ | 2.386 | 19.33 | 18.53 | 1.676 | 63.6 | 2020-04-29 | 320/320 | 1 |
| J091826.08+351243.1⋆ | 1.521 | 18.64 | 18.77 | 2.845 | 45.7 | 2021-01-13 | 360/320 | 1 |
| J091938.93+621951.1⋆ | 1.270 | 18.81 | 20.52/18.75 | 0.633/0.898 | 12.8/34.5 | 2020-12-13 | 320/320 | 4 |
| J094007.41+334609.5⋆ | 1.784 | 19.04 | 19.49/19.76 | 7.978/9.445 | 89.8/17.3 | 2020-01-07 | 360/400 | 4 |
| J095611.62+425459.7 | 0.968 | 19.26 | 19.01 | 1.602 | 78.5 | 2019-10-09 | 520/600 | 1 |
| J102531.00+414024.0 | 1.746 | 19.37 | 19.08 | 2.008 | 32.2 | 2020-06-16 | 360/400 | 1 |
| J105929.04503739.5⋆ | 0.25† | 18.84 | 2.243 | 32.5 | 2021-08-25 | 320/320 | 3 | |
| J111841.61+220015.9 | 1.394 | 18.59 | 18.98 | 1.448 | 38.3 | 2019-11-02 | 320/400 | 1 |
| J113302.56+475623.0 | 0.984 | 19.29 | 18.95 | 1.531 | 33.8 | 2020-01-25 | 360/400 | 1 |
| J122734.48491202.5⋆ | 0.25† | 20.30/20.01 | 5.086/4.316 | 28.5/37.8 | 2020-07-21 | 360/400 | 6 | |
| J131416.01491218.2⋆ | 2.29 | 19.29/19.53 | 1.787/0.0 | 27.617.6 | 2019-12-26 | 400/440 | 6 | |
| J132614.08+063909.9 | 2.165 | 19.19 | 19.07 | 1.604 | 23.2 | 2020-01-05 | 360/400 | 1 |
| J133040.00125135.7 | 2.4† | 19.06 | 1.609 | 46.2 | 2019-12-18 | 360/480 | 2 | |
| J133952.42074828.6 | 0.6† | 19.07 | 1.562 | 30.7 | 2020-02-24 | 360/400 | 2 | |
| J135531.37084212.1 | 1.05† | 18.02 | 18.84 | 1.551 | 35.5 | 2020-04-10 | 320/320 | 2 |
| J140518.25050607.7 | 1.2† | 19.11 | 1.727 | 50.8 | 2020-02-04 | 520/600 | 2 | |
| J142346.38233844.7 | 0.15† | 18.98 | 1.745 | 31.0 | 2021-04-27 | 360/320 | 2 | |
| J151041.67+022134.3 | 1.232 | 19.15 | 18.94 | 1.477 | 28.3 | 2020-05-19 | 320/400 | 1 |
| J155542.38082826.9 | 0.3† | 19.02 | 1.556 | 30.7 | 2020-08-25 | 360/320 | 2 | |
| J161349.51264432.5⋆ | 1.1† | 19.15 | 2.203 | 84.7 | 2020-01-31 | 480/400 | 2 | |
| J162319.31044703.2 | 1.55† | 18.95 | 1.533 | 50.8 | 2020-06-08 | 360/400 | 2 | |
| J164818.07+415550.1⋆ | 2.393 | 18.50 | 18.38 | 1.456 | 50.3 | 2021-06-03 | 320/320 | 1 |
| J164941.29+081233.5⋆ | 1.4† | 18.32/19.46 | 0.530/1.020 | 76.2/17.4 | 2020-09-10 | 320/320 | 5 | |
| J171139.97161147.9⋆ | 0.75† | 20.29/19.46 | 4.842/5.938 | 14.9/46.5 | 2020-05-06 | 360/400 | 5 | |
| J173222.88133535.2⋆ | 0.292 | 19.08 | 1.762 | 49.1 | 2019-10-22 | 520/400 | 2 | |
| J175543.18+422924.2⋆ | 1.95† | 17.66 | 20.44/17.79 | 3.275/0.464 | 16.2/80.9 | 2020-02-17 | 320/320 | 5 |
| J180409.55+323029.5⋆ | 0.504 | 19.14/19.76 | 4.203/0.327 | 63.8/17.6 | 2020-01-06 | 360/320 | 5 | |
| J183353.81475524.9 | 0.65† | 19.23 | 1.671 | 30.0 | 2020-03-24 | 400/440 | 3 | |
| J184520.85232227.6⋆ | 0.8† | 19.03/19.53 | 0.0/1.081 | 30.9/15.3 | 2021-09-23 | 320/320 | 5 | |
| J185226.10+483315.0⋆ | 1.480 | 19.14 | 2.906 | 30.9 | 2020-02-06 | 360/400 | 2 | |
| J185728.65+704811.3⋆ | 1.230 | 19.53/20.53 | 3.727/0.980 | 23.4/14.9 | 2019-10-20 | 360/400 | 5 | |
| J192843.97+643244.1 | 0.35† | 19.14 | 1.789 | 36.2 | 2019-11-02 | 520/400 | 2 | |
| J193547.95554946.4 | 1.55† | 19.15 | 1.563 | 21.0 | 2020-03-17 | 360/400 | 3 | |
| J193711.89163254.6 | 0.25† | 18.97 | 1.779 | 32.8 | 2020-03-15 | 360/400 | 2 | |
| J193718.81182132.2⋆ | 1.2† | 20.31/20.11 | 3.736/2.279 | 14.0/15.5 | 2020-07-02 | 360/400 | 5 | |
| J194200.49514724.2 | 0.65† | 19.18 | 1.807 | 51.7 | 2020-03-14 | 360/480 | 3 | |
| J194349.74023819.1⋆ | 1.6† | 18.96/20.17 | 0.333/1.018 | 24.4/18.1 | 2020-06-27 | 320/320 | 5 | |
| J194859.87341200.2 | 0.3† | 19.15 | 1.643 | 50.3 | 2020-03-18 | 360/240 | 2 | |
| J204848.00+625858.3⋆ | 2.5† | 20.41/20.18 | 0.0/2.047 | 17.8/16.5 | 2019-10-27 | 360/400 | 5 | |
| J205000.01294721.7⋆ | 1.75† | 20.12/18.91 | 3.913/4.117 | 17.6/51.0 | 2020-03-21 | 360/320 | 5 | |
| J212243.01002653.8 ⋆ | 1.975 | 18.71 | 19.89/19.34 | 0.0/1.580 | 15.0/40.6 | 2019-12-04 | 360/400 | 4 |
| J215444.04+285635.3⋆ | 0.723 | 19.62 | 20.35/19.35 | 6.615/5.831 | 17.4/56.1 | 2019-12-02 | 360/400 | 4 |
| J215732.70510730.4 | 1.15† | 19.25 | 1.844 | 24.0 | 2020-05-10 | 400/440 | 3 | |
| J221849.86332243.6⋆ | 0.35† | 20.66/20.17 | 7.320/5.016 | 19.8/27.6 | 2020-08-21 | 360/400 | 5 | |
| J230223.02423647.8 | 1.0† | 19.13 | 1.906 | 26.9 | 2020-08-22 | 400/400 | 3 | |
| J232157.47113055.2 | 0.75† | 19.12 | 1.724 | 29.2 | 2020-08-24 | 360/480 | 2 | |
| J232412.70+791752.3⋆ | 0.4† | 17.00 | 1.749 | 103.3 | 2020-01-30 | 320/320 | 2 | |
| J233643.38480152.3 | 0.8† | 19.18 | 1.642 | 57.5 | 2020-08-28 | 360/400 | 3 | |
| J235128.30503418.5 | 0.6† | 19.28 | 1.580 | 29.5 | 2020-07-31 | 400/440 | 3 |
Col. 2: Spectroscopic redshift or photometric redshift when denoted with “”. Col. 3: SDSS -band PSF magnitude. Col. 4: Gaia -band mean magnitude. Col. 5: Gaia astrometric_excess_noise. Col. 6: Standard deviation of Gaia -band flux (=phot_g_mean_flux_error(phot_g_n_obs)). Col. 7: HST Observation date. Col. 8: HST Exposure time in F475W and F814W filters, respectively. Col. 9: Target category (see Table 1).
Note. — Col. 1: Coordinate names in the form of “hhmmss.ssddmmss.s” based on Gaia DR2; the coordinates of the brightest source are used when multiple sources are detected in Gaia. Targets with multiple sources in HST are marked with a star.
| Name | Redshift | P.A. | F475W | F814W | Cat. | Classification | ||
|---|---|---|---|---|---|---|---|---|
| [arcsec] | [kpc] | [deg] | [mag] | [mag] | ||||
| (1) | (2) | (3) | (4) | (5) | (6) | (7) | (8) | (9) |
| J000514.20+702249.2 | 0.7† | 0.58 | 4.1 | 279.8 | 19.81/20.08 | 19.02/19.08 | 5 | dual/lensed quasar |
| J014859.18553037.5 | 0.1† | 0.56 | 1.0 | 181.6 | 18.51/20.16 | 19.82/18.88 | 6 | quasar+star |
| J024134.91+780107.0 | 2.35† | 0.58 | 4.7 | 126.8 | 19.44/23.19 | 19.56/21.36 | 2 | quasar+star |
| J024628.63+692234.0 | 0.95† | 0.49 | 3.9 | 49.2 | 20.90/22.59 | 17.93/18.89 | 5 | quasar+star |
| J034828.66401513.1 | 2.4† | 0.50 | 4.1 | 186.7 | 19.26/21.07 | 20.20/21.96 | 3 | dual/lensed quasar |
| J045528.99445637.6 | 0.5† | 0.56 | 3.4 | 93.1 | 20.99/21.10/22.87 | 21.99/22.44/24.00 | 6 | triple quasarddThe targets reveal irregular merger features. |
| J045905.23071407.1 | 0.25† | 0.63 | 2.5 | 154.6 | 21.21/21.98 | 22.34/22.39 | 5 | dual quasarddThe targets reveal irregular merger features. |
| J053620.23+503826.2 | 1.8† | 0.32 | 2.7 | 162.3 | 18.68/20.01 | 18.52/19.90 | 2 | dual/lensed quasar |
| J055455.69+511252.8 | 0.7† | 0.67 | 4.8 | 77.4 | 18.56/21.36 | 19.33/20.94 | 5 | quasar+star |
| J060734.57064838.5 | 2.3† | 0.25 | 2.0 | 196.3 | 21.29/23.87 | 18.11/19.69 | 2 | quasar+star |
| J062903.08753642.8 | 0.3† | 0.51 | 2.3 | 61.1 | 19.96/22.04/24.10 | 21.12/20.61/22.28 | 6 | quasar+stars |
| J074800.55+314647.4 | 1.407 | 0.53 | 4.5 | 171.1 | 20.13/20.54 | 21.04/20.58 | 4 | dual/lensed quasar |
| J074817.13+191003.0 | 3.096 | 0.40 | 3.1 | 52.1 | 18.93/20.92 | 19.78/19.83 | 1 | quasar+star |
| J074922.96+225511.7 | 2.166 | 0.46 | 3.8 | 56.1 | 19.18/20.78 | 20.02/21.39 | 1 | dual quasaraaSee detailed discussion in Shen et al. (2021). |
| J075350.57+424743.9 | 1.523 | 0.33 | 2.8 | 306.9 | 18.06/21.49 | 18.93/20.43 | 1 | quasar+star |
| J075824.26+145752.4 | 2.568 | 0.50 | 4.0 | 69.0 | 19.58/21.90/23.57 | 20.07/21.54/21.93 | 1 | quasar+stars |
| J081603.79+430521.1 | 0.586 | 0.72 | 4.8 | 275.3 | 20.61/22.34 | 21.75/20.65 | 4 | quasar+starccThe classification is based on the unresolved SDSS spectra. |
| J082341.08+241805.6 | 1.811 | 0.64 | 5.4 | 183.2 | 18.19/18.58 | 18.54/18.86 | 4 | dual/lensed quasar |
| J084129.77+482548.4 | 2.949 | 0.46 | 3.5 | 132.0 | 19.48/19.81 | 20.04/20.61 | 1 | dual quasaraaSee detailed discussion in Shen et al. (2021). |
| J090408.66+333205.2 | 1.103 | 0.30 | 2.5 | 104.2 | 18.65/20.69 | 19.75/20.08 | 1 | quasar+star |
| J090501.12+585902.5 | 2.386 | 0.61 | 5.0 | 228.0 | 18.62/22.87 | 19.72/21.36 | 1 | quasar+star |
| J091826.08+351243.1 | 1.521 | 0.18 | 1.6 | 260.3 | 19.13/21.92 | 19.75/20.10 | 1 | quasar+star |
| J091938.93+621951.1 | 1.270 | 0.69 | 5.7 | 333.3 | 19.11/22.61 | 19.65/20.39 | 4 | quasar+star |
| J094007.41+334609.5 | 1.784 | 0.74 | 6.2 | 239.2 | 19.81/20.89 | 20.31/20.07 | 4 | quasar+star |
| J105929.04503739.5 | 0.25† | 0.54 | 2.1 | 223.2 | 19.00/22.62 | 19.45/21.20 | 3 | quasar+star |
| J122734.48491202.5 | 0.25† | 0.50 | 1.9 | 301.8 | 20.71/21.28 | 20.74/20.89 | 6 | quasar+star |
| J131416.01491218.2 | 2.29 | 0.52 | 4.2 | 160.5 | 19.38/20.93/24.26 | 20.13/19.65/22.27 | 6 | quasar+starsbbThe classifications are based on the spatially resolved optical spectra from Gemini. |
| J161349.51264432.5 | 1.1† | 0.28 | 2.3 | 250.5 | 20.02/23.19 | 20.78/21.67 | 2 | quasar+star |
| J164818.07+415550.1 | 2.393 | 0.44 | 3.5 | 39.9 | 18.40/21.02 | 19.44/21.79 | 1 | dual/lensed quasar |
| J164941.29+081233.5 | 1.4† | 0.59 | 5.0 | 1.9 | 19.07/19.73 | 19.55/20.26 | 5 | dual/lensed quasar |
| J171139.97161147.9 | 0.75† | 0.67 | 4.9 | 128.6 | 20.69/20.99/24.87 | 20.34/20.76/22.66 | 5 | dual/lensed quasar+star |
| J173222.88133535.2 | 0.292 | 0.72 | 3.2 | 329.0 | 19.98/21.37 | 19.43/21.08 | 2 | quasar+starbbThe classifications are based on the spatially resolved optical spectra from Gemini. |
| J175543.18+422924.2 | 1.95† | 0.59 | 5.0 | 12.0 | 17.72/21.85 | 18.57/20.86 | 5 | quasar+star |
| J180409.55+323029.5 | 0.504 | 0.68 | 3.6 | 181.2 | 19.09/20.68 | 20.23/20.15 | 5 | quasar+starbbThe classifications are based on the spatially resolved optical spectra from Gemini. |
| J184520.85232227.6 | 0.8† | 0.66 | 5.0 | 170.4 | 19.51/20.04 | 19.88/20.02 | 5 | dual/lensed quasar |
| J185226.10+483315.0 | 1.480 | 0.62 | 5.2 | 190.6 | 18.94/22.49 | 19.80/21.65 | 2 | quasar+starbbThe classifications are based on the spatially resolved optical spectra from Gemini. |
| J185728.65+704811.3 | 1.230 | 0.61 | 5.0 | 160.4 | 19.87/23.15 | 20.47/20.27 | 5 | quasar+starbbThe classifications are based on the spatially resolved optical spectra from Gemini. |
| J193718.81182132.2 | 1.2† | 0.62 | 5.2 | 188.4 | 20.25/20.59 | 21.09/20.98 | 5 | dual/lensed quasar |
| J194349.74023819.1 | 1.6† | 0.66 | 5.6 | 174.7 | 19.25/21.04 | 19.79/20.57 | 5 | quasar+star |
| J204848.00+625858.3 | 2.5† | 0.62 | 5.0 | 297.1 | 20.33/20.87 | 20.58/20.94 | 5 | dual/lensed quasar |
| J205000.01294721.7 | 1.75† | 0.65 | 5.5 | 280.4 | 19.18/20.64 | 19.59/20.67 | 5 | dual/lensed quasar |
| J212243.01002653.8 | 1.975 | 0.52 | 4.4 | 313.8 | 19.20/20.38 | 19.96/20.48 | 4 | dual/lensed quasar |
| J215444.04+285635.3 | 0.723 | 0.68 | 4.9 | 193.0 | 19.53/20.89 | 20.90/20.98 | 4 | quasar+star |
| J221849.86332243.6 | 2.0eeUsing a fiducial redshift of 2.0 for the quadruply lensed quasar. The photo-z is biased due to the contamination of the foreground galaxy | 21.11/21.25/21.89/22.73 | 21.10/21.30/21.77/22.68 | 5 | quad lens | |||
| J232412.70+791752.3 | 0.4† | 0.49 | 2.7 | 310.5 | 17.58/18.93 | 17.55/19.57 | 2 | dual/lensed quasar |
Note. — Col. 1: J2000 coordinates in the form of “hhmmss.ssddmmss.s”. Col. 2: Spectroscopic redshift or photometric redshift when denoted with “”. Col. 3: Angular separation. Col. 4: Projected physical separation based on the redshift. Col. 5: Position Angle between the two brightest sources in degree east of north. Col. 6: HST F475W ST magnitude of each source. Col. 7: HST F814W ST magnitude of each source. Col. 8: Target Category. Col. 9: Best-effort classification. The term “stars” in classification means more than one PSF components with star-like color, instead of an extended source. Targets which are confirmed spectroscopically are marked in bold.
2.5 Initial Optical Spectroscopic Follow-up Observations
We are conducting follow-up observations of HST-resolved pairs, and will present the final results of our follow-up observations in a future paper. Here we present confirmation and redshift measurements from ground-based Gemini optical spectroscopy for the subset of targets that have been followed-up so far.
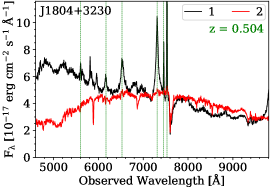
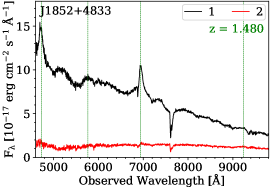
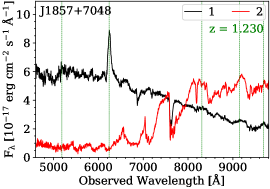
The Gemini GMOS spectroscopic follow-ups (GN-2020A-DD-106 and GS-2020A-DD-106; PI: Liu, GN-2020A-Q-232; PI: Chen) were conducted between February 2020 and August 2020 for seven targets. The spectra cover the observed wavelength of 4000Å–10040Å with a resolving power of 421. We are able to decompose the (marginally) spatially resolved sources and obtain the spectra of each source for six targets, except for J0904+3332 due to its small pair separation of 03. Out of the six targets, one is the a dual quasar reported in Shen et al. (2021) and five are star-quasar superpositions, whose spectra are shown in Figure 7.
3 Results
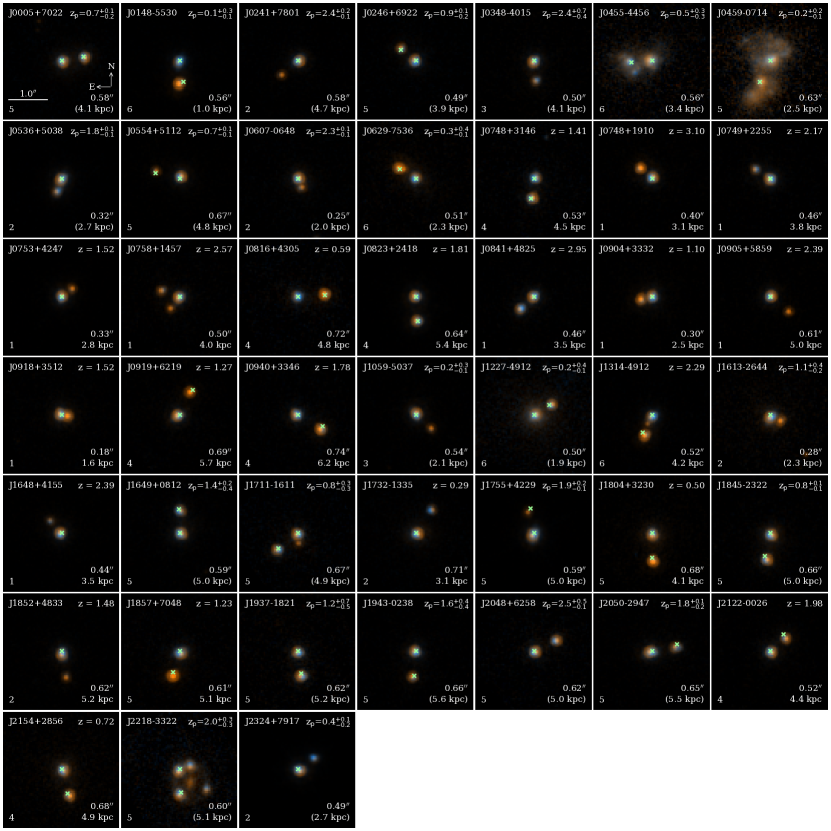
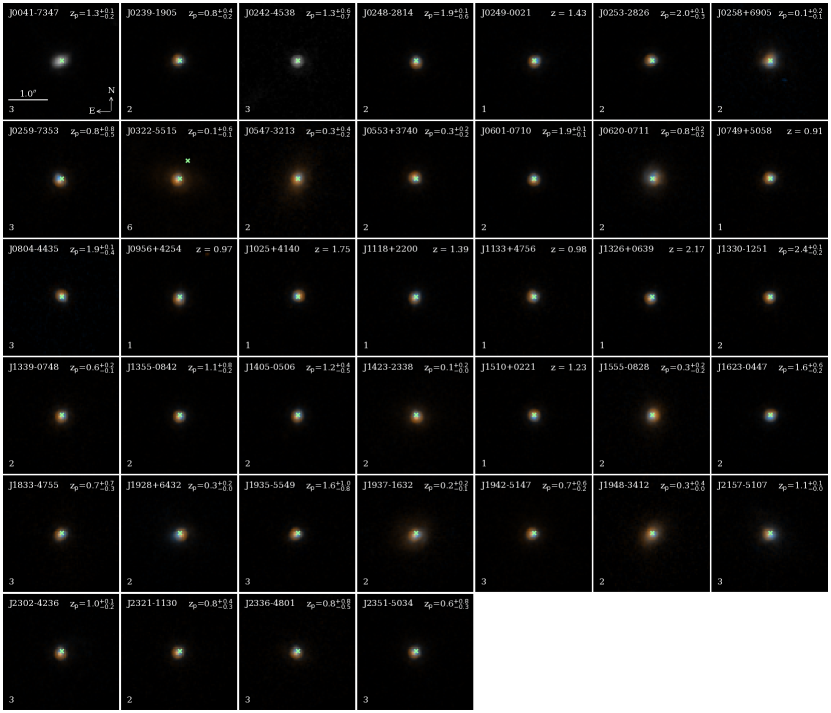
We present our HST follow-up observations of the 84 observed targets. Figure 3 shows the HST color-composite images of the 45 targets that have sub-arcsec multiple cores resolved at the HST resolution. Figure 4 shows the HST images of the remaining 39 targets which have a single unresolved core with HST. Among the 45 quasars with multiple cores in HST, 26 have multiple Gaia source matches and 19 have a single matched source in Gaia.
We perform GALFIT decomposition of the HST-resolved targets, and compile the decomposed PSF fluxes in Table 3. We classify each target based on the morphology, color information as well as follow-up spectroscopy. For the 39 single HST-unresolved sources, the target is classified as “unresolved single” if a single PSF can well fit the surface brightness ( 1.3 in the 6″6″ F814W GALFIT region); otherwise the target is classified as “extended host” when additional Srsic components are needed to reduce . For the 45 quasars showing multiple sources in HST, we use color information of each core to distinguish star-quasar superposition (see §3.1 for details) along with follow-up spectroscopy for several targets. If the system has a red color in either core or has a large color difference, it is classified as “quasar+star” and as “dual/lensed quasar” if the colors of both cores are quasar-like.
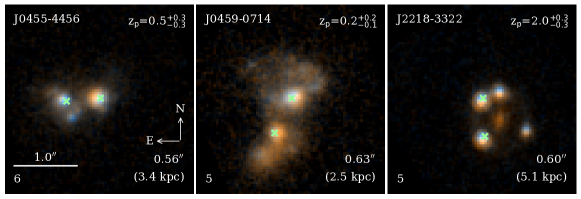
In addition to the classifications defined above, we also add “dual quasar”, which include the two confirmed dual quasars (J0749+2255 and J0841+4825) from Shen et al. (2021) and a dual quasar candidate (J04590714) showing a tidal feature, “triple quasar”, which includes a triple quasar candidate (J04554456) showing a tidal feature, and “quad lens”, which includes a quadruply lensed quasar (J22183322) with the Einstein ring and the central lens galaxy. The classification for each of those targets is discussed in detail in §3.3.
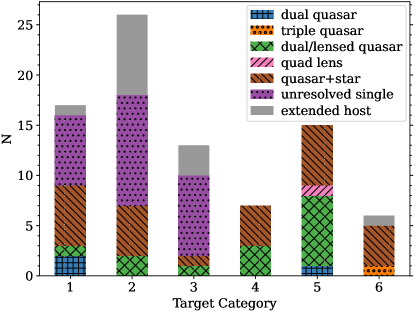
Our HST program has revealed a large fraction of resolved sub-arcsec pairs in our Gaia-selected quasar targets; additional follow-up observations are required to confirm the nature of these resolved pairs. We summarize our source classifications for the six target categories in Figure 5. Below we provide our best effort in classifying these resolved pairs based on the existing data.
3.1 Chance Superposition with Stars
The dual-band HST colors can be used to assess the likelihood of star-quasar superposition. If the resolved pairs have similar optical colors, they are more likely to be both quasars (either a dual quasar or a lensed quasar). However, there are exceptions where the physical quasar pairs can have different colors such as the =1.285 dual quasar (with a separation of 167) SDSS J233646.2010732.6, which consists of a standard quasar with a blue continuum and a broad absorption line (BAL) quasar (Gregg et al., 2002).
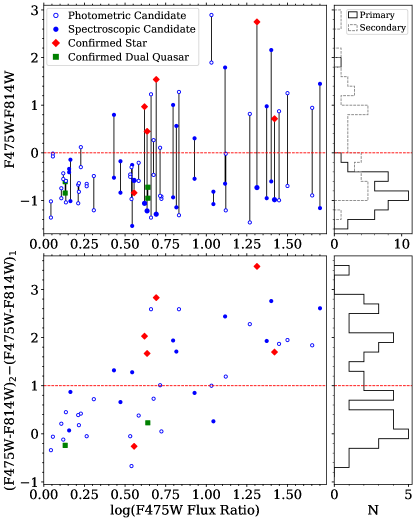
We use the F475WF814W color to identify possible star-quasar superpositions. Given some of the targets are at low Galactic latitudes, we correct for the Galactic extinction with dustmaps (Green, 2018) using the Schlegel, Finkbeiner & Davis (SFD) map of interstellar dust (Schlegel et al., 1998) and convert the values in SFD to extinctions in the HST F475W and F814W filers using Table 6 in Schlafly & Finkbeiner (2011) for . The de-reddened F475WF814W colors of each source for the 45 HST-resolved pairs are shown in the top panel of Figure 6. The color differences (color of the fainter source minus color of the brighter source) within each pair are presented in the bottom panel of Figure 6.
We use two criteria to identify possible star-quasar superpositions:
-
1.
F475WF814W 0 mag, OR
-
2.
(F475WF814W)(F475WF814W) 1 mag,
where 1 is the brightest source in F475W and 2 is the second brightest (or faintest) source in F475W. The system is classified as a star-quasar pair if it meets either criterion. For the few targets with three sources, we use the F475WF814W color of each source and the color difference between the brightest source and the second brightest (or faintest) source to identify possible star contamination.
We convolve quasar’s SED templates from Vanden Berk et al. (2001); Glikman et al. (2006) and stellar templates from Pickles (1998) with HST bandpasses using pysynphot to produce the synthetic F475WF814W colors of canonical quasars and different types of stars. The colors of quasars at are between and mag. The first criterion separates quasars from foreground K and M type stars. Though we cannot separate F and G type stars from quasars due to similar continuum slope, they should be much rarer than K and M type stars (Kroupa et al., 1993; Kirkpatrick et al., 2012; Bovy, 2017). The second criterion removes those with large color discrepancy, which are likely to be star-quasar superpositions. The caveat of the color selections is that it will remove real quasar pairs with different colors such as normal+BAL quasars. It is also noted that some stars might be unresolved compact stellar clusters in a companion galaxy, whose two-band HST colors may be similar to those of single stars.
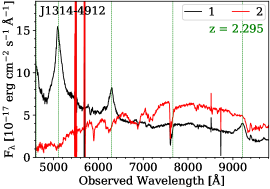
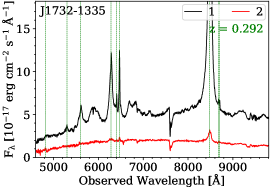
There are five star-quasar superpositions confirmed by Gemini long-slit spectroscopy, shown in Figure 7. The stellar absorption features are seen in the spectra of all the companions. J1857+7048 shows strong metal absorption lines which indicates that the companion is an M type star. The Na i 5890,5896 Å absorption lines as well as the Ca ii 8498,8542,8662 Å lines are seen in J1314+4912, J1804+3230 and J1852+4833, suggesting that their companions are K type stars. Though the interstellar medium in the Milky Way can also produce Na i absorption lines (Murga et al., 2015), we only see Na i lines in the companion’s spectrum but not in the quasars spectrum, which disfavors this scenario. As for J17321335, the narrow H absorption line at 6563Å indicates that the companion is a G type star; the weak emission at 8479Å is the flux leakage from the quasar due to the high flux contrast between the two cores and the marginally resolved spectra. With one additional confirmed case (J0816+4305) from its SDSS unresolved spectrum (missed during our initial HST target selection), six targets have been spectroscopically confirmed as star-quasar superpositions. They are shown as red filled diamonds in Figure 6.
All the spectroscopically confirmed star-quasar superpositions are correctly identified using our color cuts except for J17321335, whose companion is likely a G type star. This test suggests our two color criteria are reasonable in identifying star-quasar pairs with an estimated success rate of 80% (i.e., 5/6). Based on these two color criteria and the follow-up spectroscopic observations, we classify 26 of the 45 HST multiples as (potential) star-quasar superpositions.
3.2 Star-quasar Superposition Probability
We estimate the probability of star-quasar superposition for the SDSS quasars (Category 1) by considering their surrounding stellar density. We start with the parent quasar sample which the HST SDSS targets are selected from (Hwang et al., 2020). Specifically, for this parent quasar sample, we require that there is only a single Gaia match within 3 arcsec with a G-band magnitude , visibility_periods_used, and , resulting in a sample of 79,000 quasars. Then, we offset their declination by 1 arcminute and search for nearby Gaia DR2 sources at the offset positions. All nearby sources around the offset coordinates are considered as star-quasar pairs. Because the star-quasar superposition rate depends on the surrounding stellar density, which further depends on the Galactic coordinates, our test ensures that the offset coordinates have similar Galactic coordinates (differ by only 1 arcmin) and therefore have similar star-quasar superposition rate as the original parent sample.
Our star-quasar superposition test finds that there are 11 offset coordinates that have another fainter source within 05 (given the mean angular separation of 0406 for the single-Gaia-match quasars with HST double cores). We only consider the pairs where the nearby sources are fainter than the quasars in Gaia G-band because a superposition of a quasar with a brighter stellar object would be removed from our sample by their stellar features in SDSS spectra, or is not included in the SDSS quasar catalog in the first place. Since Gaia DR2’s completeness of nearby source identification drops significantly below 07 (Arenou et al., 2018), we expect that most of these 11 pairs would remain unresolved in Gaia DR2 and appear as single-Gaia-match quasars. If these 11 mock pairs all have sufficiently high astrometric excess noise and become our HST targets, then the stellar contamination fraction among the 40 single-Gaia-matched HST targets (i.e., Category 1) is at most 3010% (assuming Poisson noise). This is a hard upper limit because some of them can be excluded by the stellar spectral features when the star is not much fainter than the quasar, and more importantly, star-quasar pairs may not necessarily have high astrometric excess noise that fall into our selection. For comparison, our color criteria identify 6 star-quasar pairs out of the 17 observed targets in Category 1, which results in a contamination rate of 6/17 (), in broad agreement with this shifted position test.
3.3 Dual Quasars versus Lensed Quasars
The primary goal of our program is to discover kpc-scale dual quasars, especially at . As illustrated in Figure 1, our targeted search has the potential to fill a redshift-separation regime largely uncharted by previous searches for dual quasars. We have followed up some promising candidate high-redshift kpc-scale dual quasars from the resolved 45 systems. J0749+2255 and J0841+4825 have been reported in Shen et al. (2021), and favor the dual quasar scenario (although the lensed quasar scenario cannot be entirely ruled out). Based on statistical arguments, Shen et al. (2021) argued that the abundance of high-redshift sub-arcsec gravitational lens is insufficient to account for most of the resolved pairs in our systematic search.
Besides the spectroscopically confirmed dual quasars and star-quasar superpositions, the HST images revealed diagnostic morphology such as tidal features or lens galaxies in several targets (Figure 8). J04554456 is classified as a triple quasar candidate, which shows an irregular tidal feature in the images and the F475WF814W colors of its three sources are consistent with quasar color. Similar tidal features are seen in J04590714, which is likely a dual quasar. On the other hand, a lens galaxy and a weak Einstein ring in J22183322 confirm the lensing scenario. J22183322 is among the smallest-separation quadruply lensed quasars (Blackburne et al., 2008). Besides J04554456, there are also four targets (J06297536, J0758+1457, J13144912 and 17111611) consisting of three components, although not all components are classified as quasars based on their colors in each target. Those four targets are likely a dual/lensed quasar with a star or a quasar with two stars.
For other pairs without distinctive features, the hypothesis of lensed quasars cannot be easily ruled out. Our HST optical imaging is too shallow and inefficient to rule in/out high-redshift lens in individual systems, except in rare cases where a potential lens is detected (e.g. J22183322) or a merger feature is seen (e.g. J04554456 and J04590714), supporting the dual quasar classification. Besides, given the general similarity of quasar spectra, nearly identical spectra do not necessarily imply a lensed quasar. For example, SDSS J1124+5710 and SDSS J1309+5617 in More et al. (2016) have nearly identical spectra, but the slight differences in the emission line shapes and redshifts suggest that they are probably physical pairs. Future high-resolution IR imaging and spatially resolved spectroscopy are essential to distinguish dual quasars from lensed quasars.
4 Discussion
4.1 Varstrometry Selection Efficiency Increases with Redshift
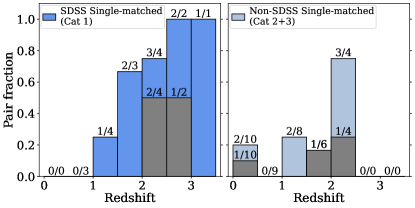
Among the Gaia single-matched targets observed by HST, those with spectroscopic redshifts from SDSS (Category 1) have the highest pair fraction of 53% and those from PS1+WISE (Category 2) have a moderate pair fraction of 27%; in contrast, those with WISE-only selection (Category 3) have the lowest pair fraction of 15% (Table 1). The high success rate of the SDSS targets is expected given that we were able to exclude the low-redshift () targets. As for the PS1+WISE targets, without spectroscopic redshifts, the sample might still contain low- host galaxies that are unresolved in PS1, which slightly reduces the observed pair fraction. The lowest success rate of the WISE-only targets is likely due to the lack of optical imaging information to exclude the contamination from extended host galaxies or the complicated selection criteria to remove the low-z extended galaxy that might also reject possible doubles.
To better demonstrate the host galaxy contamination at low redshift, we show the pair fraction of the Gaia single-matched targets as a function of redshift in Figure 9. The pair fraction is the fraction of doubles/multiples regardless of their physical nature among the observed targets. The targets at low redshift () are more contaminated by extended host emission and have a low success rate of HST-resolved pairs. However, the pair fraction increases dramatically at . The high pair fraction at suggests that the varstrometry technique is highly effective in searching for sub-arcsec quasar pairs at high redshift. While our follow-up observations only produced a small number of confirmed dual quasars, there is evidence (Figure 9) that the varstrometry selection is efficient in discovering genuine double quasars (either physical pairs or lensed quasars).
4.2 Separation predicted from varstrometry
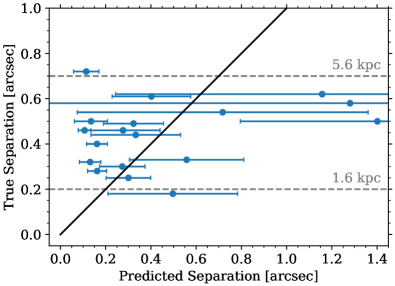
We test if the separations predicted from varstrometry are consistent with the true separations measured in the HST images for the 18 pairs with single Gaia detections. Hwang et al. (2020) gives the relation between astrometric jitter, separation and fractional photometric variability if astrometric jitter is solely due to the asynchronous flux variations of both members in an unresolved pair. For an unresolved double quasar, if both quasars have the similar fractional variability, the predicted separation (using Equation 3 in Hwang et al. 2020) is
| (1) |
where is the separation, is the astrometric jitter, is the flux ratio, is the total flux variability of the system and is the mean flux of the system. For an unresolved star-quasar superposition, in which only one member is variable, the predicted separation (using Equation 5 in Hwang et al. 2020) is
| (2) |
The astrometric jitter is calculated as the root sum of square of astrometric_excess_noise, parallax and proper motion in the 22-month observing period of Gaia DR2. The flux variability is estimated as phot_g_mean_flux_error times the square root of phot_g_n_obs. We subtract the flux variability by the measurement uncertainty (using all sources with similar magnitudes () within a radius of 0.5 degree) to obtain the quasar-induced intrinsic photometric variability. The flux ratio in Gaia -band is estimated from the interpolation of the HST dual-band fluxes. We apply Equation 1 to the targets classified as dual/lensed quasars and Equation 2 to those classified as star-quasar superpositions. Figure 10 shows the comparison between the predicted separations from varstrometry and the true separations for the 18 pairs with single Gaia detections. Two thirds of the targets are within 1- uncertainties. The predicted separations are broadly consistent with the true separations, supporting varstrometry as the origin of astrometric jitters, although the data points are not tight enough to reject other systematics. We found that targets with separations of have larger offsets from the expected values, which is likely because the large pair separation makes the light profile deviate from a single PSF. In practice, it is difficult to predict the separations precisely based on the approximate varstrometry formula. We suspect that the 0.2-0.7 arcsec range is mostly a selection effect. For pairs with separations of 0.8 arcsec, Gaia would likely already resolve the source; on the other hand, HST cannot resolve the pair with separations of 0.2 arcsec), but the expected shorter dynamical time at smaller separations might play some role here as well.
4.3 HST-unresolved Sources
Besides the sub-arcsec doubles/multiples resolved by HST, there are 39 HST unresolved targets. Several possibilities could explain those unresolved sources: varstrometry may be able to detect doubles that are unresolved by HST, extended host emission could contribute extra astrometric noise, or they are caused by Gaia systematics. 13 (33%) of the 39 HST unresolved sources contain significant extended emission from host galaxies (Figure 5) and are at low redshift () based on the SDSS spectra or photo-s. Most of the systems classified as extended hosts fall in the categories without spectroscopic redshifts (Categories 2 and 3), which is expected because these categories mainly rely on the astrometric excess noise; extended host emission can contribute to this astrometric excess noise (Hwang et al., 2020). As for the systems from SDSS (Category 1), since low-redshift targets () had been removed, the point-like targets could either be small-scale ( arcsec) doubles that are unresolved by HST or could be caused by Gaia systematics.
There are some interesting targets that cannot be modeled by a single PSF or a PSF with Srsic components. One such case is J00417347, which shows an elongated ellipse with a similar color profile across the ellipse. However, Leisy & Dennefeld (1996) have identified J00417347 as a carbon-rich planetary nebula based on optical and ultraviolet spectroscopic observations. The other cases are J06200711 and J0258+6905, whose central components deviate from the PSF and show faint offset residuals. The targets with the small offset residuals could be double cores with a separation smaller than the HST resolution (); however the possibility of an imperfect PSF model cannot be excluded.
4.4 Comparison to other methods
There are several other techniques for finding dual quasars at (sub)kpc scales that are unresolved in ground-based observations. One popular method is double-peaked profiles in narrow emission lines in quasar spectra (Wang et al., 2009; Liu et al., 2010b; Smith et al., 2010). However, most dual quasars found from the double-peaked narrow-line samples (Liu et al., 2010a; Fu et al., 2012; Comerford et al., 2015) are at low redshifts (). In addition, in most cases such double-peaked structure is due to the complex kinematics of the narrow-line region such as rotation and outflows (Shen et al., 2011a; Fu et al., 2012; Zakamska & Greene, 2014; Müller-Sánchez et al., 2016); the dual quasar fraction among the double-peaked narrow-line sample is usually few percent (Shen et al., 2011a; Fu et al., 2012). Direct imaging with high-resolution radio interferometers (e.g., VLA and VLBA) is also used to confirm the nature of dual quasar candidates at kpc scales (Fu et al., 2015a, b; Shen et al., 2021) or even at pc scales (Rodriguez et al., 2006) although it requires the source to be radio-bright.
By design, the varstrometry selection technique only applies to (optically) unobscured broad-line (i.e., type 1) quasars, where the AGN variability is detectable by Gaia. It is possible that kpc dual quasars in high-redshift mergers are more likely to be obscured systems, similar to the cases observed in MIR-selected low-redshift dual AGNs (Satyapal et al., 2017; Pfeifle et al., 2019). We will investigate this possibility in future work by comparing our observational results with cosmological hydrodynamic simulations (Blecha et al., 2013, 2018).
Other indirect methods such as the radial velocity shift of the broad emission lines (Eracleous et al., 2012; Shen et al., 2013; Liu et al., 2014; Runnoe et al., 2017; Wang et al., 2017; Guo et al., 2019) and periodicity in the optical light curves (Graham et al., 2015; Charisi et al., 2016; Liu et al., 2019; Chen et al., 2020b; Liao et al., 2021) are sensitive to binary SMBHs at sub-pc scales, where the two SMBHs become gravitationally bound. Both methods require decade-long multi-epoch imaging or spectroscopy. Those candidates are difficult to resolve with radio interferometers even with VLBI; none of them are confirmed by direct imaging so far.
The high pair fraction of 30% in the single-Gaia-matched quasar sample indicates that the varstrometry technique is very effective in finding unresolved pairs. Assuming that 40% of the pairs are dual/lensed quasars, we expect that 12% of the candidates selected from varstrometry are dual/lensed quasars. The fraction is even higher in the spectroscopically confirmed quasar sample (Category 1).
4.5 Refining Targeting and Follow-up Strategy
Building on the results from this pilot HST program, we can refine the targeting strategy to search for dual quasars with high-spatial-resolution imaging/spectroscopy, especially with varstrometry, to improve the success rate:
-
1.
The new Gaia EDR3 (Gaia Collaboration et al., 2021) provides better astrometric measurements overall. The position uncertainties of objects at the faint end decreased by nearly half, for example, from 0.7 mas in DR2 to 0.4 mas in EDR3 at (Lindegren et al., 2021). In addition, EDR3 resolves more sub-arcsec pairs than DR2, has better treatments of extended sources, and the reliability of the astrometric excess noise parameter is generally improved over DR2. From the same varstrometry selection criteria, the 38 HST-unresolved targets (excluding J03225515) show astrometric_excess_noise of 1.660.14 mas, and the 18 HST-resolved pairs show higher values of 2.501.36 mas, a 5 difference. The higher astrometric_excess_noise values of the HST-resolved pairs support the hypothesis of varstrometry technique. For the HST-unresolved targets, the astrometric_excess_noise values in EDR3 decrease by 40% on average compared with those in DR2. The improvement on the astrometric excess noise would be particularly useful to reduce false positives selected with varstrometry (e.g., those appeared unresolved or with extended host emission in HST imaging). We also expect less spurious Gaia source detections such as those in J03225515.
-
2.
Additional IR imaging with HST (or ground-based adaptive optics) is needed to confirm/reject the lensing scenario. The current HST F814W optical imaging data are too shallow to detect the lens galaxies, especially for the high- systems (Shen et al., 2021). Even with spatially-resolved spectroscopy, it is often difficult to rule out the lensing scenario (Shen et al., 2021). High-resolution IR imaging, even at the HST SNAP depth, is highly efficient to rule out the lensing scenario by the non-detection of lens galaxies.
-
3.
High-resolution radio imaging could be used to reject star-quasar superposition. Detecting two flat-spectrum compact radio cores will confirm the candidate as a dual/lensed quasar. In addition, if two radio cores have significantly different spectral indices, it will suggest that the source is a dual quasar instead of a lensed quasar. Shen et al. (2021) reported preliminary VLBA observations of J0749+2255, supporting the dual quasar scenario. A few of our targets have detections in publicly available radio surveys such as FIRST (Becker et al., 1995), NVSS (Condon et al., 1998), and/or VLASS (Lacy et al., 2020), but the angular resolutions of those public radio data are not high enough to resolve the sub-arcsecond pairs.
-
4.
It is more efficient to target spectroscopically confirmed quasars at than photometric quasar candidates, given the redshift information and potential identification of star-quasar superposition in the spectrum. Indeed, the SDSS varstrometry-selected candidates show a high pair detection rate (53%), while the WISE-only candidates only have a pair fraction of 15%, which suggests that the redshift information is crucial to mitigate host galaxy contamination in the astrometric measurements.
-
5.
Wide-field multi-band imaging surveys such as the Dark Energy Survey (Abbott et al., 2018) and DECaLS (Dey et al., 2019) can provide extra morphology and color information. Because of the excellent image qualities (median -band FWHM of 118 in DECaLS and 096 in DES), some pairs with wider separations are marginally resolved and identified. The multi-band colors could also help remove star-quasar superpositions. Among the 14 quasar+star pairs that are covered by DECaLS and DES, we find 8 of them have been identified as two sources, whose separations are . For the rest 4 quasar+star pairs, 2 of them also show significant red emissions in the residual map.
5 Conclusions
In this paper, we present HST dual-band (F475W and F814W) optical imaging for 56 Gaia-unresolved dual quasar candidates selected by varstrometry and 28 Gaia-resolved dual quasar candidates. These dual quasar candidates are in the sub-arcsec regime, and represent the long-sought kpc-scale dual quasar population.
Our HST imaging of the 84 targets reveals 45 resolved pairs (or multiples), among which 17 resolved pairs are from the varstrometry selection. The fraction of resolved pairs among the varstrometry-selected targets is , increasing toward high redshift ( at ), with the highest success rate (80%) in spectroscopically confirmed quasar targets.
We discuss the nature of the 45 HST-resolved quasar targets based on HST and supplementary data. Given that star-quasar superpositions are a significant contaminant for our sample, we develop color criteria that can successfully reject most of them (80%). A substantial fraction (19/45 ) of the HST-resolved pairs are likely physical quasar pairs or gravitationally lensed quasars. It is more probable that most of them are dual quasars instead of lenses, which require very massive lenses at high redshifts given the non-detection of the lens galaxy in the HST image. These systems fill in an important redshift–separation regime of dual SMBHs that has been poorly explored in earlier searches (Figure 1). Besides the candidates selected by colors, we also discover a quadruply lensed quasar, which shows a foreground lens in the HST images.
This program with HST optical imaging demonstrates the potential of using varstrometry and Gaia data to systematically discover genuine kpc-scale dual quasars, especially at . Our results provide important guidelines to significantly refine the targeting and follow-up strategy and to facilitate the classifications (§4.5), with improved astrometric measurements from Gaia EDR3 and future data releases.
References
- Abbott et al. (2018) Abbott, T. M. C., Abdalla, F. B., Allam, S., et al. 2018, ApJS, 239, 18
- Anguita et al. (2018) Anguita, T., Schechter, P. L., Kuropatkin, N., et al. 2018, MNRAS, 480, 5017
- Arenou et al. (2018) Arenou, F., Luri, X., Babusiaux, C., et al. 2018, A&A, 616, A17
- Arzoumanian et al. (2018) Arzoumanian, Z., Baker, P. T., Brazier, A., et al. 2018, ApJ, 859, 47
- Astropy Collaboration et al. (2018) Astropy Collaboration, Price-Whelan, A. M., Sipőcz, B. M., et al. 2018, AJ, 156, 123
- Becker et al. (1995) Becker, R. H., White, R. L., & Helfand, D. J. 1995, ApJ, 450, 559
- Begelman et al. (1980) Begelman, M. C., Blandford, R. D., & Rees, M. J. 1980, Nature, 287, 307
- Bianchi et al. (2008) Bianchi, S., Chiaberge, M., Piconcelli, E., Guainazzi, M., & Matt, G. 2008, MNRAS, 386, 105
- Blackburne et al. (2008) Blackburne, J. A., Wisotzki, L., & Schechter, P. L. 2008, AJ, 135, 374
- Blecha et al. (2013) Blecha, L., Loeb, A., & Narayan, R. 2013, MNRAS, 429, 2594
- Blecha et al. (2018) Blecha, L., Snyder, G. F., Satyapal, S., & Ellison, S. L. 2018, MNRAS, 478, 3056
- Bogdanovic et al. (2021) Bogdanovic, T., Miller, M. C., & Blecha, L. 2021, Living Reviews in Relativity, arXiv:2109.03262
- Bothun et al. (1989) Bothun, G. D., Halpern, J. P., Lonsdale, C. J., Impey, C., & Schmitz, M. 1989, ApJS, 70, 271
- Bovy (2017) Bovy, J. 2017, MNRAS, 470, 1360
- Brotherton et al. (1999) Brotherton, M. S., Gregg, M. D., Becker, R. H., et al. 1999, ApJ, 514, L61
- Burke-Spolaor (2011) Burke-Spolaor, S. 2011, MNRAS, 410, 2113
- Centrella et al. (2010) Centrella, J., Baker, J. G., Kelly, B. J., & van Meter, J. R. 2010, Reviews of Modern Physics, 82, 3069
- Chambers et al. (2016) Chambers, K. C., Magnier, E. A., Metcalfe, N., et al. 2016, arXiv e-prints, arXiv:1612.05560
- Charisi et al. (2016) Charisi, M., Bartos, I., Haiman, Z., et al. 2016, MNRAS, 463, 2145
- Chen et al. (2020a) Chen, Y., Yu, Q., & Lu, Y. 2020a, ApJ, 897, 86
- Chen et al. (2020b) Chen, Y.-C., Liu, X., Liao, W.-T., et al. 2020b, MNRAS, 499, 2245
- Civano et al. (2010) Civano, F., Elvis, M., Lanzuisi, G., et al. 2010, ApJ, 717, 209
- Comerford et al. (2015) Comerford, J. M., Pooley, D., Barrows, R. S., et al. 2015, ApJ, 806, 219
- Comerford et al. (2011) Comerford, J. M., Pooley, D., Gerke, B. F., & Madejski, G. M. 2011, ApJ, 737, L19
- Condon et al. (1998) Condon, J. J., Cotton, W. D., Greisen, E. W., et al. 1998, AJ, 115, 1693
- Crampton et al. (1988) Crampton, D., Cowley, A. P., Hickson, P., et al. 1988, ApJ, 330, 184
- Crotts et al. (1994) Crotts, A. P. S., Bechtold, J., Fang, Y., & Duncan, R. C. 1994, ApJ, 437, L79
- De Rosa et al. (2020) De Rosa, A., Vignali, C., Bogdanović, T., et al. 2020, arXiv e-prints, arXiv:2001.06293
- Dey et al. (2019) Dey, A., Schlegel, D. J., Lang, D., et al. 2019, AJ, 157, 168
- Eftekharzadeh et al. (2017) Eftekharzadeh, S., Myers, A. D., Hennawi, J. F., et al. 2017, MNRAS, 468, 77
- Ellison et al. (2017) Ellison, S. L., Secrest, N. J., Mendel, J. T., Satyapal, S., & Simard, L. 2017, MNRAS, 470, L49
- Eracleous et al. (2012) Eracleous, M., Boroson, T. A., Halpern, J. P., & Liu, J. 2012, ApJS, 201, 23
- Foord et al. (2021) Foord, A., Gültekin, K., Runnoe, J. C., & Koss, M. J. 2021, ApJ, 907, 71
- Frey et al. (2012) Frey, S., Paragi, Z., An, T., & Gabányi, K. É. 2012, MNRAS, 425, 1185
- Fu et al. (2015a) Fu, H., Myers, A. D., Djorgovski, S. G., et al. 2015a, ApJ, 799, 72
- Fu et al. (2015b) Fu, H., Wrobel, J. M., Myers, A. D., Djorgovski, S. G., & Yan, L. 2015b, ApJ, 815, L6
- Fu et al. (2012) Fu, H., Yan, L., Myers, A. D., et al. 2012, ApJ, 745, 67
- Fu et al. (2011) Fu, H., Zhang, Z.-Y., Assef, R. J., et al. 2011, ApJ, 740, L44
- Gaia Collaboration et al. (2018) Gaia Collaboration, Brown, A. G. A., Vallenari, A., et al. 2018, A&A, 616, A1
- Gaia Collaboration et al. (2021) —. 2021, A&A, 649, A1
- Glikman et al. (2006) Glikman, E., Helfand, D. J., & White, R. L. 2006, ApJ, 640, 579
- Goulding et al. (2019) Goulding, A. D., Pardo, K., Greene, J. E., et al. 2019, ApJ, 879, L21
- Graham et al. (2015) Graham, M. J., Djorgovski, S. G., Stern, D., et al. 2015, MNRAS, 453, 1562
- Green (2018) Green, G. 2018, The Journal of Open Source Software, 3, 695
- Green et al. (2011) Green, P. J., Myers, A. D., Barkhouse, W. A., et al. 2011, ApJ, 743, 81
- Gregg et al. (2002) Gregg, M. D., Becker, R. H., White, R. L., et al. 2002, ApJ, 573, L85
- Guo et al. (2019) Guo, H., Liu, X., Shen, Y., et al. 2019, MNRAS, 482, 3288
- Hagen et al. (1996) Hagen, H. J., Hopp, U., Engels, D., & Reimers, D. 1996, A&A, 308, L25
- Hennawi et al. (2006) Hennawi, J. F., Strauss, M. A., Oguri, M., et al. 2006, AJ, 131, 1
- Hennawi et al. (2010) Hennawi, J. F., Myers, A. D., Shen, Y., et al. 2010, ApJ, 719, 1672
- Hewett et al. (1998) Hewett, P. C., Foltz, C. B., Harding, M. E., & Lewis, G. F. 1998, AJ, 115, 383
- Hopkins et al. (2008) Hopkins, P. F., Hernquist, L., Cox, T. J., & Kereš, D. 2008, ApJS, 175, 356
- Huang et al. (2014) Huang, Y., Liu, X. W., Yuan, H. B., et al. 2014, MNRAS, 439, 2927
- Hudson et al. (2006) Hudson, D. S., Reiprich, T. H., Clarke, T. E., & Sarazin, C. L. 2006, A&A, 453, 433
- Hughes (2009) Hughes, S. A. 2009, ARA&A, 47, 107
- Hwang et al. (2020) Hwang, H.-C., Shen, Y., Zakamska, N., & Liu, X. 2020, ApJ, 888, 73
- Inada et al. (2008) Inada, N., Oguri, M., Becker, R. H., et al. 2008, AJ, 135, 496
- Inada et al. (2012) Inada, N., Oguri, M., Shin, M.-S., et al. 2012, AJ, 143, 119
- Junkkarinen et al. (2001) Junkkarinen, V., Shields, G. A., Beaver, E. A., et al. 2001, ApJ, 549, L155
- Kharb et al. (2017) Kharb, P., Lal, D. V., & Merritt, D. 2017, Nature Astronomy, 1, 727
- Kirkpatrick et al. (2012) Kirkpatrick, J. D., Gelino, C. R., Cushing, M. C., et al. 2012, ApJ, 753, 156
- Komossa et al. (2003) Komossa, S., Burwitz, V., Hasinger, G., et al. 2003, ApJ, 582, L15
- Kormendy & Ho (2013) Kormendy, J., & Ho, L. C. 2013, ARA&A, 51, 511
- Kormendy & Richstone (1995) Kormendy, J., & Richstone, D. 1995, ARA&A, 33, 581
- Koss et al. (2012) Koss, M., Mushotzky, R., Treister, E., et al. 2012, ApJ, 746, L22
- Koss et al. (2011) —. 2011, ApJ, 735, L42
- Kroupa et al. (1993) Kroupa, P., Tout, C. A., & Gilmore, G. 1993, MNRAS, 262, 545
- Lacy et al. (2020) Lacy, M., Baum, S. A., Chandler, C. J., et al. 2020, PASP, 132, 035001
- Leisy & Dennefeld (1996) Leisy, P., & Dennefeld, M. 1996, A&AS, 116, 95
- Lemon et al. (2020) Lemon, C., Auger, M. W., McMahon, R., et al. 2020, MNRAS, 494, 3491
- Lemon et al. (2019) Lemon, C. A., Auger, M. W., & McMahon, R. G. 2019, MNRAS, 483, 4242
- Lemon et al. (2018) Lemon, C. A., Auger, M. W., McMahon, R. G., & Ostrovski, F. 2018, MNRAS, 479, 5060
- Liao et al. (2021) Liao, W.-T., Chen, Y.-C., Liu, X., et al. 2021, MNRAS, 500, 4025
- Lindegren et al. (2012) Lindegren, L., Lammers, U., Hobbs, D., et al. 2012, A&A, 538, A78
- Lindegren et al. (2018) Lindegren, L., Hernández, J., Bombrun, A., et al. 2018, A&A, 616, A2
- Lindegren et al. (2021) Lindegren, L., Klioner, S. A., Hernández, J., et al. 2021, A&A, 649, A2
- Liu et al. (2019) Liu, T., Gezari, S., Ayers, M., et al. 2019, ApJ, 884, 36
- Liu et al. (2013) Liu, X., Civano, F., Shen, Y., et al. 2013, ApJ, 762, 110
- Liu et al. (2010a) Liu, X., Greene, J. E., Shen, Y., & Strauss, M. A. 2010a, ApJ, 715, L30
- Liu et al. (2014) Liu, X., Shen, Y., Bian, F., Loeb, A., & Tremaine, S. 2014, ApJ, 789, 140
- Liu et al. (2010b) Liu, X., Shen, Y., Strauss, M. A., & Greene, J. E. 2010b, ApJ, 708, 427
- Liu et al. (2011) Liu, X., Shen, Y., Strauss, M. A., & Hao, L. 2011, ApJ, 737, 101
- Liu (2015) Liu, Y. 2015, A&A, 580, A133
- Madau & Dickinson (2014) Madau, P., & Dickinson, M. 2014, ARA&A, 52, 415
- Marrese et al. (2019) Marrese, P. M., Marinoni, S., Fabrizio, M., & Altavilla, G. 2019, A&A, 621, A144
- Mateos et al. (2012) Mateos, S., Alonso-Herrero, A., Carrera, F. J., et al. 2012, MNRAS, 426, 3271
- Mazzarella et al. (2012) Mazzarella, J. M., Iwasawa, K., Vavilkin, T., et al. 2012, AJ, 144, 125
- McGurk et al. (2011) McGurk, R. C., Max, C. E., Rosario, D. J., et al. 2011, ApJ, 738, L2
- Merritt (2013) Merritt, D. 2013, Dynamics and Evolution of Galactic Nuclei
- More et al. (2016) More, A., Oguri, M., Kayo, I., et al. 2016, MNRAS, 456, 1595
- Morgan et al. (2000) Morgan, N. D., Burley, G., Costa, E., et al. 2000, AJ, 119, 1083
- Müller-Sánchez et al. (2015) Müller-Sánchez, F., Comerford, J. M., Nevin, R., et al. 2015, ApJ, 813, 103
- Müller-Sánchez et al. (2016) Müller-Sánchez, F., Comerford, J. M., Stern, D., & Harrison, F. A. 2016, ArXiv e-prints 1606.07446, arXiv:1606.07446
- Murga et al. (2015) Murga, M., Zhu, G., Ménard, B., & Lan, T.-W. 2015, MNRAS, 452, 511
- Murgia et al. (2001) Murgia, M., Parma, P., de Ruiter, H. R., et al. 2001, A&A, 380, 102
- Owen et al. (1985) Owen, F. N., O’Dea, C. P., Inoue, M., & Eilek, J. A. 1985, ApJ, 294, L85
- Pâris et al. (2018) Pâris, I., Petitjean, P., Aubourg, É., et al. 2018, A&A, 613, A51
- Peng et al. (2010) Peng, C. Y., Ho, L. C., Impey, C. D., & Rix, H.-W. 2010, AJ, 139, 2097
- Pfeifle et al. (2019) Pfeifle, R. W., Satyapal, S., Secrest, N. J., et al. 2019, ApJ, 875, 117
- Pickles (1998) Pickles, A. J. 1998, PASP, 110, 863
- Pindor et al. (2006) Pindor, B., Eisenstein, D. J., Gregg, M. D., et al. 2006, AJ, 131, 41
- Richards et al. (2006) Richards, G. T., Strauss, M. A., Fan, X., et al. 2006, AJ, 131, 2766
- Riello et al. (2018) Riello, M., De Angeli, F., Evans, D. W., et al. 2018, A&A, 616, A3
- Rodriguez et al. (2006) Rodriguez, C., Taylor, G. B., Zavala, R. T., et al. 2006, ApJ, 646, 49
- Runnoe et al. (2017) Runnoe, J. C., Eracleous, M., Pennell, A., et al. 2017, MNRAS, 468, 1683
- Satyapal et al. (2017) Satyapal, S., Secrest, N. J., Ricci, C., et al. 2017, ApJ, 848, 126
- Schechter et al. (2017) Schechter, P. L., Morgan, N. D., Chehade, B., et al. 2017, AJ, 153, 219
- Schlafly & Finkbeiner (2011) Schlafly, E. F., & Finkbeiner, D. P. 2011, ApJ, 737, 103
- Schlegel et al. (1998) Schlegel, D. J., Finkbeiner, D. P., & Davis, M. 1998, ApJ, 500, 525
- Secrest et al. (2015) Secrest, N. J., Dudik, R. P., Dorland, B. N., et al. 2015, ApJS, 221, 12
- Shen et al. (2019) Shen, Y., Hwang, H.-C., Zakamska, N., & Liu, X. 2019, ApJ, 885, L4
- Shen et al. (2011a) Shen, Y., Liu, X., Greene, J. E., & Strauss, M. A. 2011a, ApJ, 735, 48
- Shen et al. (2013) Shen, Y., Liu, X., Loeb, A., & Tremaine, S. 2013, ApJ, 775, 49
- Shen et al. (2011b) Shen, Y., Richards, G. T., Strauss, M. A., et al. 2011b, ApJS, 194, 45
- Shen et al. (2021) Shen, Y., Chen, Y.-C., Hwang, H.-C., et al. 2021, Nature Astronomy, 5, 569
- Shields et al. (2012) Shields, G. A., Rosario, D. J., Junkkarinen, V., et al. 2012, ApJ, 744, 151
- Silverman et al. (2020) Silverman, J. D., Tang, S., Lee, K.-G., et al. 2020, arXiv e-prints, arXiv:2007.05581
- Smith et al. (2010) Smith, K. L., Shields, G. A., Bonning, E. W., et al. 2010, ApJ, 716, 866
- Springer & Ofek (2021) Springer, O. M., & Ofek, E. O. 2021, arXiv e-prints, arXiv:2101.11024
- STScI Development Team (2013) STScI Development Team. 2013, pysynphot: Synthetic photometry software package, , , ascl:1303.023
- Tang et al. (2021) Tang, S., Silverman, J. D., Ding, X., et al. 2021, arXiv e-prints, arXiv:2105.10163
- Teng et al. (2012) Teng, S. H., Schawinski, K., Urry, C. M., et al. 2012, ApJ, 753, 165
- Vanden Berk et al. (2001) Vanden Berk, D. E., Richards, G. T., Bauer, A., et al. 2001, AJ, 122, 549
- Wang et al. (2009) Wang, J., Chen, Y., Hu, C., et al. 2009, ApJ, 705, L76
- Wang et al. (2017) Wang, L., Greene, J. E., Ju, W., et al. 2017, ApJ, 834, 129
- Williams & Saha (1995) Williams, L. L. R., & Saha, P. 1995, AJ, 110, 1471
- Woo et al. (2014) Woo, J.-H., Cho, H., Husemann, B., et al. 2014, MNRAS, 437, 32
- Wright et al. (2010) Wright, E. L., Eisenhardt, P. R. M., Mainzer, A. K., et al. 2010, AJ, 140, 1868
- Yang et al. (2017) Yang, Q., Wu, X.-B., Fan, X., et al. 2017, AJ, 154, 269
- Yu (2002) Yu, Q. 2002, MNRAS, 331, 935
- Zakamska & Greene (2014) Zakamska, N. L., & Greene, J. E. 2014, MNRAS, 442, 784