Spontaneous symmetry breaking in a coherently driven nanophotonic Bose-Hubbard dimer
Abstract
We report on the first experimental observation of spontaneous mirror symmetry breaking (SSB) in coherently driven-dissipative coupled optical cavities. SSB is observed as the breaking of the spatial or mirror symmetry between two symmetrically pumped and evanescently coupled photonic crystal nanocavities, and manifests itself as random intensity localization in one of the two cavities. We show that, in a system featuring repulsive boson interactions (), the observation of a pure pitchfork bifurcation requires negative photon hopping energies (), which we have realized in our photonic crystal molecule. SSB is observed over a wide range of the two-dimensional parameter space of driving intensity and detuning, where we also find a region that exhibits bistable symmetric behavior. Our results pave the way for the experimental study of limit cycles and deterministic chaos arising from SSB, as well as the study of nonclassical photon correlations close to SSB transitions.
The Bose-Hubbard dimer (BHD) is a paradigmatic system featuring quantum dynamics of bosons hopping across sites and interacting on-site Fisher et al. (1989). The competition between these processes in the closed BHD unveiled a wealth of quantum and classical nonlinear phenomena, including self-trapping Albiez et al. (2005) and symmetry breaking Zibold et al. (2010). In most real BHDs, however, particle losses need to be compensated by external driving Carusotto and Ciuti (2013); Schmidt and Koch (2013); Hartmann (2016); Noh and Angelakis (2016). These driven-dissipative BHDs have recently drawn much interest, as they display intriguing classical Coullet and Vandenberghe (2001); Giraldo et al. (2020) and quantum Minganti et al. (2018) phenomena due to the balance between driving and dissipation. Driven-dissipative BHDs have been implemented on light-matter systems like semiconductor microcavities Lagoudakis et al. (2010); Abbarchi et al. (2013); Rodriguez et al. (2016) and superconducting circuits Raftery et al. (2014); Eichler et al. (2014).
SSB is a universal phenomenon occurring when a symmetric system ends up in an asymmetric state. SSB and its applications have attracted significant interest in optics A. E. Kaplan and P. Meystre (1981); 27; M. Liu, D. A. Powell, I. V. Shadrivov, M. Lapine, and Y. S. Kivshar (2014); P. Hamel, S. Haddadi, F. Raineri, P. Monnier, G. Beaudoin, I. Sagnes, A. Levenson, and A. M. Yacomotti (2015); Q.-T. Cao, H. Wang, C.-H. Dong, H. Jing, R.-S. Liu, X. Chen, L. Ge, A. Gong, and Y.-F. Xiao (2017); L. Del Bino, J. M. Silver, S. L. Stebbings, and P. Del’Haye (2017); G. Xu, A. U. Nielsen, B. Garbin, L. Hill, G.-L. Oppo, J. Fatome, S. G. Murdoch, S. Coen, and M. Erkintalo (2021). In single coherently driven optical cavities, SSB emerges from the nonlinear coupling between polarization or counter-propagating modes Garbin et al. (2020); Del Bino et al. (2017). SSB has also been observed in coupled active photonic crystal nano-resonators Hamel et al. (2015), which share some properties with incoherently driven BHDs Seclì et al. (2021). However, optical gain saturation—a nonlinear mechanism reminiscent of inelastic two body collisions in atomic systems Coullet and Vandenberghe (2001)—results in a fundamental difference with respect to BHDs. Compared to the incoherent pumping case, coherent driving offers a more versatile parameter control and suppressed spontaneous emission noise. Furthermore, coherently driven BHD have been predicted to undergo entanglement close to the SSB transition Casteels and Ciuti (2017), thereby bridging classical nonlinear dynamics and quantum optics.
Despite the strong interest in coherently driven dissipative BHD physics, SSB remains unreported. This is likely due to two reasons. First, conventional driven-dissipative BHDs display symmetry broken phases restricted to narrow parameter regions, which coexist with other optical bistabilities Cao et al. (2016); Giraldo et al. (2020). Thus, accessing SSB is challenging. Second, resonant optical excitation experiments require mode-matching, thereby leading to more stringent conditions than their incoherent pumping counterparts.
Here we demonstrate coherently driven SSB in a photonic crystal driven-dissipative BHD. Unlike standard BHDs, our system features a negative photon hopping energy that, in conjunction with a positive on-site interaction energy, results in a broken symmetry phase across large parameter regions Giraldo et al. (2020). These are pure pitchfork-bifurcated phases; they do not coexist with a bistable homogeneous state which might otherwise hinder the SSB observation.
We consider a BHD of two sites—“or cavities”—where photons interact on-site with energy , hop across sites with energy , and that is coherently driven symmetrically with amplitude and frequency [see Fig. 1(a)]. We apply the truncated Wigner approximation Carusotto and Ciuti (2013), neglecting quantum correlations but accounting for quantum fluctuations via stochastic terms in semiclassical equations of motion. In a frame rotating at , the expectation values of the bosonic operators and in the two sites satisfy:
| (1) |
Here, is the detuning between and the cavities resonance frequency , and are coherent driving amplitude applied to each cavity. is the loss rate. The last term in Eqs. (1) models the fluctuations as complex Gaussian noise terms () which have zero mean and are delta-correlated in .
In our experimental implementation, the sites are given by two evanescently-coupled photonic crystal (PhC) nanocavities with embedded quantum wells (QWs) illuminated by an optically resonant laser field. The bosons are intracavity photons that experience carrier-induced Kerr-like nonlinearities below the QW optical transparency, leading to a blue-shifting intensity-dependent refractive index (). Using Eqs. (1) to model the PhC dimer, we assume ultrafast carrier dynamics instantaneous Kerr nonlinearity.
For identical cavities with and in the linear regime, two hybrid modes arise [Fig. 1(b)]: the symmetric mode with , and the anti-symmetric mode with ; the mode splitting and their relative spectral position, respectively, depend on the magnitude and sign of . Upon coherent in-phase symmetric illumination of the two cavities, only the symmetric mode is excited. The sign of has a large impact on the observed behavior [Fig. 1(c)]: provided , pure SSB only exists for (purple region and top inset). For , the bistability of the homogeneous symmetric states prevails (green region and bottom inset), see Fig. 1(c) for .
Decreasing the value of from zero results in an overlap of these two regions near ; this creates regions of e.g. periodic and chaotic behavior (see Supplementary Material). For , however, the SSB transition always lies inside the bistable symmetric zone. On the contrary, the pure super-critical pitchfork bifurcation is only warranted for , which we can implement experimentally.
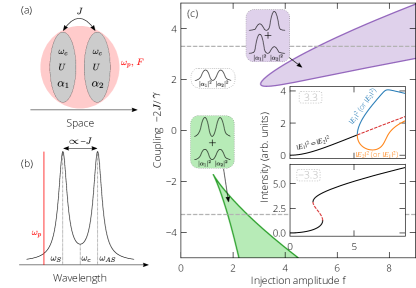
Figure 2 shows our experimental setup. Two evanescently-coupled photonic-crystal nanoresonators stand on a free-standing InP membrane with four embedded InGaAs/InGaAsP QWs. The lattice period is 435 nm (hole radii nm). Spatial mode matching of the illumination laser beam to the cavity mode is enhanced by means of far-field engineering of the PhC cavity Haddadi et al. (2014) (hole radii nm). Such mode matching is further improved using a lens with 100 cm focal length (L1 in Fig. 2). Importantly, negative with targeted splitting is achieved by controlling the radii of selected holes Hamel et al. (2015) (hole radii ). The two cavities are coherently driven close to their resonant wavelength ( 1563.9 nm) with a narrow-linewidth widely-tunable laser, whose beam is split for injection power monitoring. Finally, a magnification with 0.95 numerical aperture microscope objective (Olympus MPLAN x100 IR) focuses the laser beam to a 2.2 m diameter spot on the sample from the top. The sample is mounted on a PZT driven 6-axis translation stage for controlling the relative position between the driving beam and the cavities and, hence, the relative power impinging on the two cavities. We use a half-wave plate to rotate the linearly polarized injection beam at input, by 45∘ from the cavities polarization. The cavities outputs are subsequently separated from the reflected part of the injection beam with polarization optics, and split to allow spectral and temporal analysis. The spectral part is directed to a liquid-nitrogen-cooled spectrometer (Acton SP 2500). To independently analyze three different regions of the sample, the temporal part is split and directed to: (i) a 750 Hz bandwidth Newfocus fW detector for linear spectroscopy (large dashed circle in Fig. 2), and (ii) two 550 MHz bandwidth low-noise APD detectors (Princeton Lightwave PLA-8XX, N.E.P.=250 fW/) for measuring the output intensity of each cavity (smaller dashed circles in Fig. 2).
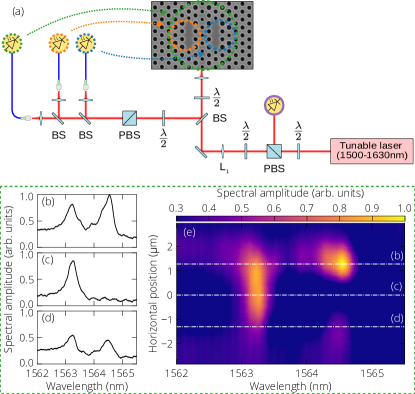
We first perform linear reflectivity spectroscopy by sweeping the driving laser wavelength. Figures 2(b)-(d) show spectra for selected horizontal positions of the driving beam, measured with the fW detector. The relative excitation of the two hybrid modes depends on the spatial location of the driving beam relative to the sample. For an off-centered beam [panels (b) and (d)] both modes are excited. For a centered beam [panel (c)], only the symmetric mode is excited. Figure 2(e) shows a collection of such spectra with the driving position varied along the horizontal axes. It allows us to identify the central driving condition (horizontal position labelled 0 m) which minimizes driving asymmetries [, see Eqs. (1)].
Since is negative, the symmetric mode is located at shorter wavelength (1563.2 nm) than the anti-symmetric one (1564.5 nm). Based on the measured mode splitting (1.3 nm) and mode linewidth (0.39 nm), we estimate the normalized coupling constant ; this is compatible with SSB observation for low excitation power. Increasing the splitting to , for instance without barrier hole modification, increases the injection amplitude of the SSB threshold and might hinder observation [see Fig. 1(c)].

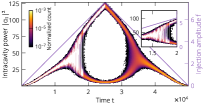
After locating the illumination spot at the center of the dimer [line (c) in Fig. 2(e)], the excitation power (purple traces) is ramped up to about 1.5 mW within ns to minimize thermal effects. Figures 3(a,b) show typical cavity intensity time traces (blue and orange curves) for two different values of the normalized detuning . At low driving powers, the two cavity output traces are coincident, indicating that a delocalized (symmetric) hybrid mode is being excited. At time of about 285 ns, however, the two output intensities part, which we identify as the SSB transition point. The spontaneous character of the SSB manifests itself as randomly selected asymmetric states (Fig. 3, top and middle traces). The bottom traces in Fig. 3, built by overlapping maxima of histograms of 500 successive realizations, evidence the mirror symmetry of the two asymmetric states (see Supplementary Material for comparisons with numerical simulations), and can be seen as the reconstruction of the underlying pitchfork bifurcation.
When increasing the magnitude of the detuning from Fig. 3(a) to (b), we need to realign the illumination spot to observe randomly selected asymmetric states. This may be understood from Eqs. (1) in the presence of asymmetries in the cavity frequencies () and driving fields (). The first one is due to unavoidable fabrication imperfections ( 0.13 0.07 nm), while the second one accounts for deviations of the illumination spot from the dimer center. Indeed, numerical simulations (not shown) indicate that the asymmetry parameter that induces random switching changes with , consistent with the experimental observation; this explains the difference in cavity intensities when moving from panel (a) to (b) related to slight misalignment in the optical detection devices. The observation of SBB through compensation of two asymmetry parameters has recently been reported in Garbin et al. (2020).
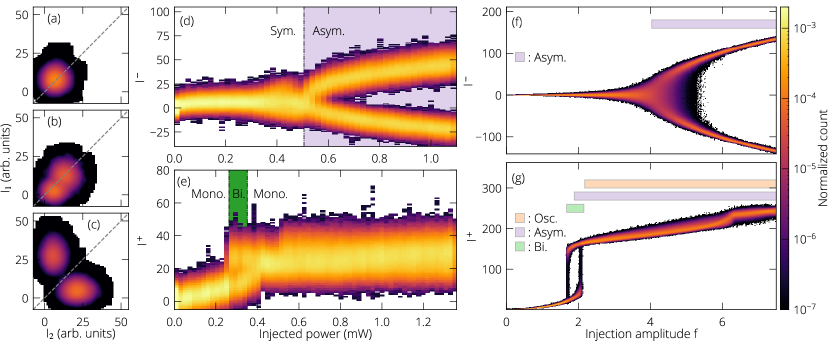
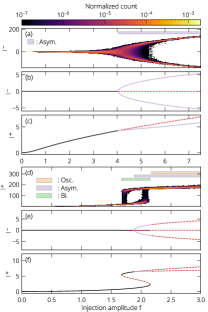
Figure 4 illustrates the three main regimes of operation observed in our experiment, as well as the associated SSB transition and bistability. Projections of the phase space onto the plane of the two measured intensities, for given values of injection power and detuning, show: (i) equal intensity in the two cavities [Fig. 4(a)], (ii) bistable operation with symmetric cavity intensities [Fig. 4(b)], and (iii) bistable operation with asymmetric cavity intensities [symmetry broken states, Fig. 4(c)]. To identify the different phases and transitions as parameters change, we consider the intensity difference and sum , which indicate the presence of asymmetric and symmetric states by highlighting anticorrelations and correlations, respectively (see Supplementary Material). To identify the number of states as the injected power is varied, we analyze, for two given values of detuning, the number of maxima in and [Fig. 4(d) and (e), respectively]. For comparatively small detunings as in Fig. 4(d), exhibits, at an injected power of about 0.51 mW, a SSB transition from a single to two asymmetric coexisting steady states [see panel (c)]. For comparatively large detunings as in Fig. 4(e), on the other hand, exhibits two maxima in the range of injected power from 0.26 mW to 0.35 mW, which is evidence for a region of bistability with two coexisting symmetric steady states [see panel (b)].
Figures 4(f,g) show corresponding plots obtained by simulating Eqs. (1) while varying the normalized driving amplitude . We also set , which we estimated by comparing numerical and experimental standard deviations of the intensity around the SSB transition. Further rescaling the intracavity field as Giraldo et al. (2020) allows us to interpret as the characteristic intracavity photon number; note that the thermodynamic limit corresponds to , for which the mean field solutions—i.e., these without stochastic fluctuations—are strictly justified. Analytical results of bifurcation points of the mean field BHD derived in Giraldo et al. (2020) give an important handle to analyse the stochastic simulation results. Firstly, the mean field pitchfork bifurcation associated with the SSB transition occurs at in panel (f); this is consistent with the stochastic numerical simulations, which also indicate the presence of random switching between asymmetric states from this value up to . Secondly, the two predicted mean-field bifurcations of the symmetric state for clearly set the limits of the observed hysteresis cycle in Figure 4(g).
We now identify in Fig. 5 the different regimes of operation in the two-dimensional parameter plane of driving strength and detuning. The experimental bifurcation diagram in panel (a) was created by color coding the number of maxima found for and . It reveals large regions of the parameter plane for which the system exhibits two asymmetric steady states; the SSB transition that bounds this region to the left moves towards lower injection power as the detuning is decreased; it is characterized by distinct maxima of . Notice also the region of symmetric bistability (identified by maxima of only) that exists for smaller ; it may also overlap (dotted area) with asymmetric behavior: three states are observed (one lower symmetric and two higher asymmetric). We attribute the absence of asymmetric states for to large deviations of the sample’s position with regard to the laser beam at larger detunings.
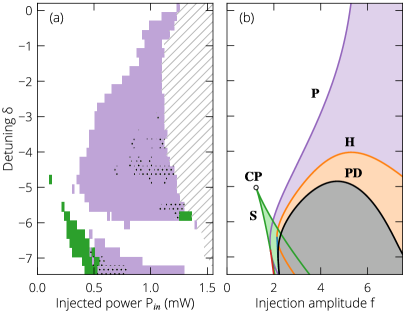
Figure 5(b) shows the associated two-parameter bifurcation diagram of Eqs. (1) without noise (see Supplementary Material) computed using Auto07p Doedel et al. (2012). Overall, it is in good agreement with the experimental bifurcation diagram in terms of where symmetry-broken dynamics and bistability between symmetric states can be found. More specifically, the saddle-node bifurcation curve with the cusp point at delimits the region with bistability between symmetric steady states. The SSB transition is identified as a pitchfork bifurcation Cao et al. (2016); Casteels and Ciuti (2017), yielding a region with two coexisting asymmetric steady states. As the detuning is decreased, the Hopf bifurcation curve marks the onset of asymmetric oscillations, whereas indicates the first bifurcation of a period-doubling route to chaos, which eventually creates a pair of asymmetric chaotic attractors that are each confined to one cavities Giraldo et al. (2020); they eventually collide, forming a symmetric chaotic attractor that features irregular switching between the two cavities Giraldo et al. (2021).
In conclusion, we have reported the first experimental realization of SSB in a coherently driven photonic dimer. For repulsive nonlinearities (), we have shown that pure supercritical pitchfork bifurcations only exist for negative photon hopping energies (); we also predict this to hold for provided that . The SSB transition consists of the splitting of the two intracavity intensities under symmetric driving conditions; this is observed as two different randomly-selected states where light is localized in either of the two cavities. We mapped out the SSB transition in a large parameter plane and identified the region of bistability between symmetric states. Our experiments are in good agreements with the mean field Bose-Hubbard dimer model and stochastic simulations validated the random nature of this process. The theory for the BHD also predicts the existence of limit cycle oscillations and deterministic chaos. Our results constitute an important step towards the study of symmetry breaking in the few photon regime Casteels and Ciuti (2017), at the crossroad between nonlinear dynamics and quantum optics.
B. G. and A. M. Y. would like to acknowledge the financial support from the European Union in the form of Marie Skłodowska-Curie Action grant MSCA-841351. This work is part of the research programme of the Netherlands Organisation for Scientific Research (NWO). S.R.K.R. acknowledges an ERC Starting Grant with project number 85269.
References
- Macroscopic quantum self-trapping and josephson oscillations of exciton polaritons. Nature Physics 9 (5), pp. 275–279. External Links: Document, ISSN 1745-2481, Link Cited by: Spontaneous symmetry breaking in a coherently driven nanophotonic Bose-Hubbard dimer.
- Direct observation of tunneling and nonlinear self-trapping in a single bosonic josephson junction. Phys. Rev. Lett. 95, pp. 010402. External Links: Document, Link Cited by: Spontaneous symmetry breaking in a coherently driven nanophotonic Bose-Hubbard dimer.
- Two coupled nonlinear cavities in a driven-dissipative environment. Phys. Rev. A 94, pp. 063805. External Links: Document, Link Cited by: Spontaneous symmetry breaking in a coherently driven nanophotonic Bose-Hubbard dimer, Spontaneous symmetry breaking in a coherently driven nanophotonic Bose-Hubbard dimer.
- Experimental demonstration of spontaneous chirality in a nonlinear microresonator. Phys. Rev. Lett. 118, pp. 033901. External Links: Document, Link Cited by: Spontaneous symmetry breaking in a coherently driven nanophotonic Bose-Hubbard dimer.
- Quantum fluids of light. Rev. Mod. Phys. 85, pp. 299–366. External Links: Document, Link Cited by: Spontaneous symmetry breaking in a coherently driven nanophotonic Bose-Hubbard dimer, Spontaneous symmetry breaking in a coherently driven nanophotonic Bose-Hubbard dimer.
- Quantum entanglement in the spatial-symmetry-breaking phase transition of a driven-dissipative bose-hubbard dimer. Phys. Rev. A 95, pp. 013812. External Links: Document Cited by: Spontaneous symmetry breaking in a coherently driven nanophotonic Bose-Hubbard dimer, Spontaneous symmetry breaking in a coherently driven nanophotonic Bose-Hubbard dimer, Spontaneous symmetry breaking in a coherently driven nanophotonic Bose-Hubbard dimer.
- Chaotic self-trapping of a weakly irreversible double bose condensate. Phys. Rev. E 64, pp. 025202. External Links: Document, Link Cited by: Spontaneous symmetry breaking in a coherently driven nanophotonic Bose-Hubbard dimer, Spontaneous symmetry breaking in a coherently driven nanophotonic Bose-Hubbard dimer.
- Symmetry breaking of counter-propagating light in a nonlinear resonator. Scientific Reports 7 (1), pp. 43142. External Links: ISSN 2045-2322, Document, Link Cited by: Spontaneous symmetry breaking in a coherently driven nanophotonic Bose-Hubbard dimer.
- AUTO-07p: continuation and bifurcation software for ordinary differential equations. AUTO-07P software. External Links: Link Cited by: Spontaneous symmetry breaking in a coherently driven nanophotonic Bose-Hubbard dimer.
- Quantum-limited amplification and entanglement in coupled nonlinear resonators. Phys. Rev. Lett. 113, pp. 110502. External Links: Document, Link Cited by: Spontaneous symmetry breaking in a coherently driven nanophotonic Bose-Hubbard dimer.
- Boson localization and the superfluid-insulator transition. Phys. Rev. B 40, pp. 546–570. External Links: Document, Link Cited by: Spontaneous symmetry breaking in a coherently driven nanophotonic Bose-Hubbard dimer.
- Asymmetric balance in symmetry breaking. Phys. Rev. Research 2, pp. 023244. External Links: Document, Link Cited by: Spontaneous symmetry breaking in a coherently driven nanophotonic Bose-Hubbard dimer, Spontaneous symmetry breaking in a coherently driven nanophotonic Bose-Hubbard dimer.
- Chaotic switching in driven-dissipative Bose-Hubbard dimers: when a flip bifurcation meets a T-point in . Discrete Contin. Dyn. Syst. Ser. B (to appear). External Links: Link Cited by: Spontaneous symmetry breaking in a coherently driven nanophotonic Bose-Hubbard dimer.
- The driven-dissipative bose–hubbard dimer: phase diagram and chaos. New Journal of Physics 22 (4), pp. 043009. External Links: Document, Link Cited by: Spontaneous symmetry breaking in a coherently driven nanophotonic Bose-Hubbard dimer, Spontaneous symmetry breaking in a coherently driven nanophotonic Bose-Hubbard dimer, Spontaneous symmetry breaking in a coherently driven nanophotonic Bose-Hubbard dimer, Spontaneous symmetry breaking in a coherently driven nanophotonic Bose-Hubbard dimer, Spontaneous symmetry breaking in a coherently driven nanophotonic Bose-Hubbard dimer.
- Photonic molecules: tailoring the coupling strength and sign. Opt. Express 22 (10), pp. 12359–12368. External Links: Link, Document Cited by: Spontaneous symmetry breaking in a coherently driven nanophotonic Bose-Hubbard dimer.
- Spontaneous mirror-symmetry breaking in coupled photonic-crystal nanolasers. Nature Photonics 9 (5), pp. 311–315. External Links: Document, ISSN 1749-4893, Link Cited by: Spontaneous symmetry breaking in a coherently driven nanophotonic Bose-Hubbard dimer, Spontaneous symmetry breaking in a coherently driven nanophotonic Bose-Hubbard dimer.
- Quantum simulation with interacting photons. Journal of Optics 18 (10), pp. 104005. External Links: Document, Link Cited by: Spontaneous symmetry breaking in a coherently driven nanophotonic Bose-Hubbard dimer.
- Enhancement of the sagnac effect due to nonlinearly induced nonreciprocity. Opt. Lett. 6 (12), pp. 590–592. External Links: Link, Document Cited by: Spontaneous symmetry breaking in a coherently driven nanophotonic Bose-Hubbard dimer.
- Coherent oscillations in an exciton-polariton josephson junction. Phys. Rev. Lett. 105, pp. 120403. External Links: Document, Link Cited by: Spontaneous symmetry breaking in a coherently driven nanophotonic Bose-Hubbard dimer.
- Spontaneous chiral symmetry breaking in metamaterials. Nature Communications 5 (1), pp. 4441. External Links: ISSN 2041-1723, Document, Link Cited by: Spontaneous symmetry breaking in a coherently driven nanophotonic Bose-Hubbard dimer.
- Spectral theory of liouvillians for dissipative phase transitions. Phys. Rev. A 98, pp. 042118. External Links: Document, Link Cited by: Spontaneous symmetry breaking in a coherently driven nanophotonic Bose-Hubbard dimer.
- Quantum simulations and many-body physics with light. Reports on Progress in Physics 80 (1), pp. 016401. External Links: Document, Link Cited by: Spontaneous symmetry breaking in a coherently driven nanophotonic Bose-Hubbard dimer.
- Observation of a dissipation-induced classical to quantum transition. Phys. Rev. X 4, pp. 031043. External Links: Document, Link Cited by: Spontaneous symmetry breaking in a coherently driven nanophotonic Bose-Hubbard dimer.
- Interaction-induced hopping phase in driven-dissipative coupled photonic microcavities. Nature Communications 7 (1), pp. 11887. External Links: ISSN 2041-1723, Document, Link Cited by: Spontaneous symmetry breaking in a coherently driven nanophotonic Bose-Hubbard dimer.
- Circuit qed lattices: towards quantum simulation with superconducting circuits. Annalen der Physik 525 (6), pp. 395–412. External Links: Document, ISBN 0003-3804, Link Cited by: Spontaneous symmetry breaking in a coherently driven nanophotonic Bose-Hubbard dimer.
- Signatures of self-trapping in the driven-dissipative bose–hubbard dimer. New Journal of Physics 23 (6), pp. 063056. External Links: Document, Link Cited by: Spontaneous symmetry breaking in a coherently driven nanophotonic Bose-Hubbard dimer.
- [27] (2013) Spontaneous symmetry breaking, self-trapping, and josephson oscillations, edited by Boris A. Malomed. Springer, Berlin. External Links: ISBN 978-3-642-21207-9 Cited by: Spontaneous symmetry breaking in a coherently driven nanophotonic Bose-Hubbard dimer.
- Spontaneous symmetry breaking of dissipative optical solitons in a two-component kerr resonator. Nature Communications 12 (1), pp. 4023. External Links: ISSN 2041-1723, Document, Link Cited by: Spontaneous symmetry breaking in a coherently driven nanophotonic Bose-Hubbard dimer.
- Classical bifurcation at the transition from rabi to josephson dynamics. Phys. Rev. Lett. 105, pp. 204101. External Links: Document, Link Cited by: Spontaneous symmetry breaking in a coherently driven nanophotonic Bose-Hubbard dimer.
Supplementary Materials: Spontaneous symmetry breaking in a coherently driven nanophotonic Bose-Hubbard dimer
I Numerical observation of SSB in the presence of noise
To reproduce the experimental observations of SSB, we perform stochastic simulations with the xSPDE Matlab toolbox Kiesewetter et al. (2016) by integrating Eqs. (1) with a fourth-order Runge-Kutta method, where the time steps are of size . In all our stochastic simulations we set to account for quantum fluctuations in the truncated Wigner approximation Carusotto and Ciuti (2013). The value of was then estimated by matching near the SSB transition to the experiment. A MHz filter was applied to match the experimental detector bandwidth. Figure S1 shows a histogram associated with a single cavity built from 500 computed realizations of Eqs. (1) as the modified driving power is ramped up and down; compare with Fig. 3. In the single shown trajectory the noise is seen to induce fast random switching between the two states near the the SSB transition. Consequently, the final state of the cavities is selected at random after the SSB transition occurs at 1.5x10⁴. Note that for a symmetric system such as Eqs. (1), the two asymmetric states are observed with equal probability and the histograms associated with each of the two cavities are equivalent.
II Identification of bistability of symmetric and asymmetric states
We now demonstrate with Figure S2 that the difference and the sum are suitable observables to identify and distinguish, respectively, SSB with asymmetric steady states and hysteresis between symmetric steady states; compare with Fig. 4 and Fig. 5. More specifically, Fig. S2 shows in panels (a) and (d) histograms over the injection amplitude , computed from 500 realizations of Eqs. (1), for both detunings used in Fig. 4. The case of SSB for is best identified by the difference , as can be seen clearly by comparing in Fig. S2(a) with the computed branches of associated steady states in panels (b) and (c); in particular, the sum does not show SSB clearly. In contrast, the range of bistability between symmetric steady states for is best identified by ; compare Fig. S2(d) with the computed branches of associated steady states in panels (e) and (f) and note that does not distinguish this bistability at all. These observations are further strengthened by the fact that the unstable states (dashed red curves) are not observed in experiments.
III Normalized model without noise
Equations (1) of our main manuscript may be further normalized to Giraldo et al. (2020):
| (S2) |
for the evolution of the slowly varying intracavity electric field envelopes of each of the two cavities in a frame rotating at . Here, the time is normalized to the cavity dissipation rate , and we defined the normalized detuning, coupling and driving field as , , , respectively; here we assume . Equation (S2) is related to the BHD model Eqs. (1) via the transformation:
| (S3) |
We remark that this model is reminiscent of the celebrated Lugiato-Lefever equation for passive optical resonators Lugiato and Lefever (1987).
IV Observation of pure SSB: positive versus negative coupling
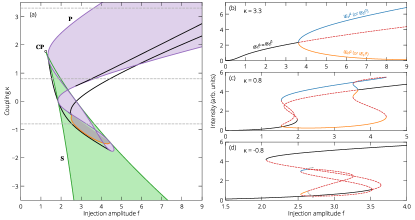
Figure S3 presents evidence for the statement that SSB is best observed for coupling and sufficiently large. Indeed, the two-parameter bifurcation diagram in the -plane of Eqs. (1) in Fig. S3(a) shows that, in that case, one does not find any bistability between symmetric steady states. As a result, the one-parameter bifurcation diagram for in panel (b) shows symmetry breaking at the pitchfork bifurcation very clearly, and there are no other bifurcation in this slice. Similarly, for sufficiently negative , one only observes bistability between two symmetric steady states. However, Fig. S3(a) shows also that there is a range of near where one finds both SSB and hysteresis between symmetric steady states. Examples of one-parameter bifurcation diagrams that feature both are shown in panel (b) for and in panel (d) for , respectively.
We remark that this “mixing” between the two types of bistability is considerably enhanced in Fig. S3(a) because we consider here the smaller value of , compared to the value of of Fig. 1(c). Nevertheless, the case with a “pure” (pitchfork bifurcation) SSB transition is still observed at larger values; moreover, for smaller values of the states born from the SSB still exist and, while they now coexist with a bistability of symmetric states, the difference between their intensities is still large [see blue and orange curves in panel (c)]. Finally, the region of symmetry broken states extends over a small region for , where it is strictly inside the region of coexisting symmetric steady states. We remark that it is generally subject to coexistence with other states (e.g., oscillating orbits and chaos) Giraldo et al. (2020), which implies that one cannot observe a “pure” pitchfork bifurcation of SSB for .
References
- Quantum fluids of light. Rev. Mod. Phys. 85, pp. 299–366. External Links: Document, Link Cited by: §I.
- The driven-dissipative bose–hubbard dimer: phase diagram and chaos. New Journal of Physics 22 (4), pp. 043009. External Links: Document, Link Cited by: §III, §IV.
- XSPDE: extensible software for stochastic equations. SoftwareX 5, pp. 12 – 15. External Links: ISSN 2352-7110, Link Cited by: §I.
- Spatial dissipative structures in passive optical systems. Phys. Rev. Lett. 58, pp. 2209–2211. External Links: Document, Link Cited by: §III.