.
On the martensitic transformation in FexMn80-xCo10Cr10 high-entropy alloy
Abstract
High-entropy alloys (HEAs), and even medium-entropy alloys (MEAs), are an intriguing class of materials in that structure and property relations can be controlled via alloying and chemical disorder over wide ranges in the composition space. Employing density-functional theory combined with the coherent-potential approximation to average over all chemical configurations, we tune free energies between face-centered-cubic (fcc) and hexagonal-close-packed (hcp) phases in FexMn80-xCo10Cr10 systems. Within Fe-Mn-based alloys, we show that the martensitic transformation and chemical short-range order directly correlate with the fcc-hcp energy difference and stacking-fault energies, which are in quantitative agreement with recent experiments on a =40 at.% polycrystalline HEA/MEA. Our predictions are further confirmed by single-crystal measurements on a=40at.% using transmission-electron microscopy, selective-area diffraction, and electron-backscattered-diffraction mapping. The results herein offer an understanding of transformation-induced/twinning-induced plasticity (TRIP/TWIP) in this class of HEAs and a design guide for controlling the physics behind the TRIP effect at the electronic level.
High-entropy alloys (HEAs) Yeh et al. (2004); Miracle and Senkov (2017); George et al. (2019) and medium-entropy alloys (MEAs) are new exciting class of materials with their vast design space and emerging unique properties Zhu and Liao (2004); Li et al. (2016); Singh et al. (2018); Ikeda et al. (2019); Picak et al. (2019). Originally, single-phase solid-solution formation in HEAs was proposed to originate through entropy maximization Yeh et al. (2004), but recent evidence Tamm et al. (2015); Zhang et al. (2017); Ma et al. (2018); Widom et al. (2014) suggest that entropic description is oversimplified, as HEAs/MEAs may display significant local chemical short-range order Singh et al. (2015); Ding et al. (2018); Kostiuchenko et al. (2020); Zhang et al. (2020). Outside the HEA space, high-Mn (15-30 at.%) austenitic (-fcc phase) ferrous alloys are a material class that receive special attention due to their low/medium stacking fault energies (SFEs) Volosevich et al. (1976); Ikeda et al. (2019), high ultimate tensile strength ( 1000 MPa) with total elongation over 60% at room temperature (RT) Cooman et al. (2018), and uses in automotive industry Bouaziz et al. (2013). A number of studies were performed to tune SFEs in the austenitic alloys to achieve better control over governing deformation mechanisms, e.g., dislocation slip (40 mJ/m2), mechanical twinning (20-40 mJ/m2), twinning-induced plasticity, and/or martensitic transformation (20 mJ/m2), including those in HEAs Steinmetz et al. (2013); Wu et al. (2014); Wang et al. (2020); Uzer et al. (2018). As expected, the deformation at the low-SFE regime in austenitic (-fcc) alloys is mainly realized through a martensitic (-hcp) transformation Cotes et al. (1995). The fcc-based, single-phase multi-principal-element solid-solutions have gained attention due to their outstanding ductility, however, lower strength limits their use for engineering applications He et al. (2014); Schuh et al. (2015). Recent work has shown that a martensitic transformation Li et al. (2016); Lu et al. (2018); Bu et al. (2019) or precipitation strengthening Zhao et al. (2017); Yang et al. (2018) could provide an effective way to address the strength-ductility trade-off in this important materials class.
Here we employed density-functional theory (DFT) methods to understand how to tune some of these key properties via alloying and disorder, in particular, formation-energy (Eform), stacking-fault energy (SFE), and short-range order (SRO) of fcc-based solid-solutions, see supplement for details on methods Johnson et al. (1986); Johnson and Pinski (1993); Alam and Johnson (2009); Alam et al. (2010); Alam and Johnson (2012); Perdew et al. (1996); Carter and Holmes (1977); Datta et al. (2009); Chandran and Sondhi (2011); Yu and Wang (2009); Singh et al. (2020, 2018). We show that chemistry profoundly alters Eform and SFE of FexMn80-xCo10Cr10 and can suppress SRO and, hence, long-range order (LRO). The DFT calculated Eform and SFE, together with experimental observations reveal details of the strain-driven martensitic (fcchcp) transformation at =40at.%Fe. Our DFT-predicted SRO Singh et al. (2015) on the =40 at.%Fe system indicate very weak chemical SRO and, hence, very low-temperature ordering behavior (below 50 K). The predicted low-temperature ordering suggests the preference for forming martensite rather than long-range order. Molecular-dynamics (MD) simulations Plimpton (1995) on this system at RT also show a strain-driven martensitic transformation at 40 at.% Fe. The results reveal key underpinning of physical principles behind formation of martensite, and an opportunity for more intelligent design of high-performance HEAs Raabe et al. (2015) – for a more directed exploration of higher-dimensional composition space Singh et al. (2018).
Following Hume-Rothery, phases stability of HEA/MEA systems in different lattice structures can be estimated empirically using valence-electron count (VEC), e.g., bcc (e.g., A2 or Laves phase) for VEC7; coexistence of bcc/fcc at 7VEC8; and fcc for VEC8 Singh et al. (2018). The solute and host with similar VEC show large solubility, i.e., a metal dissolve one of higher valency to a greater extent or lower valency to a lesser extent. These critical values can be directly and more reliably evaluated using DFT Singh et al. (2019). Notably, Mn-based fcc alloys are known for lower VEC than empirically defined solid-solution phase limit, the exceptions are already noted in Singh et al. (2019); Gao et al. (2016). As such, DFT calculations were performed on FexMn80-xCo10Cr10 to avoid limitations of empirical rules and detail the thermodynamic stability and planar faults versus (Fig. 1).
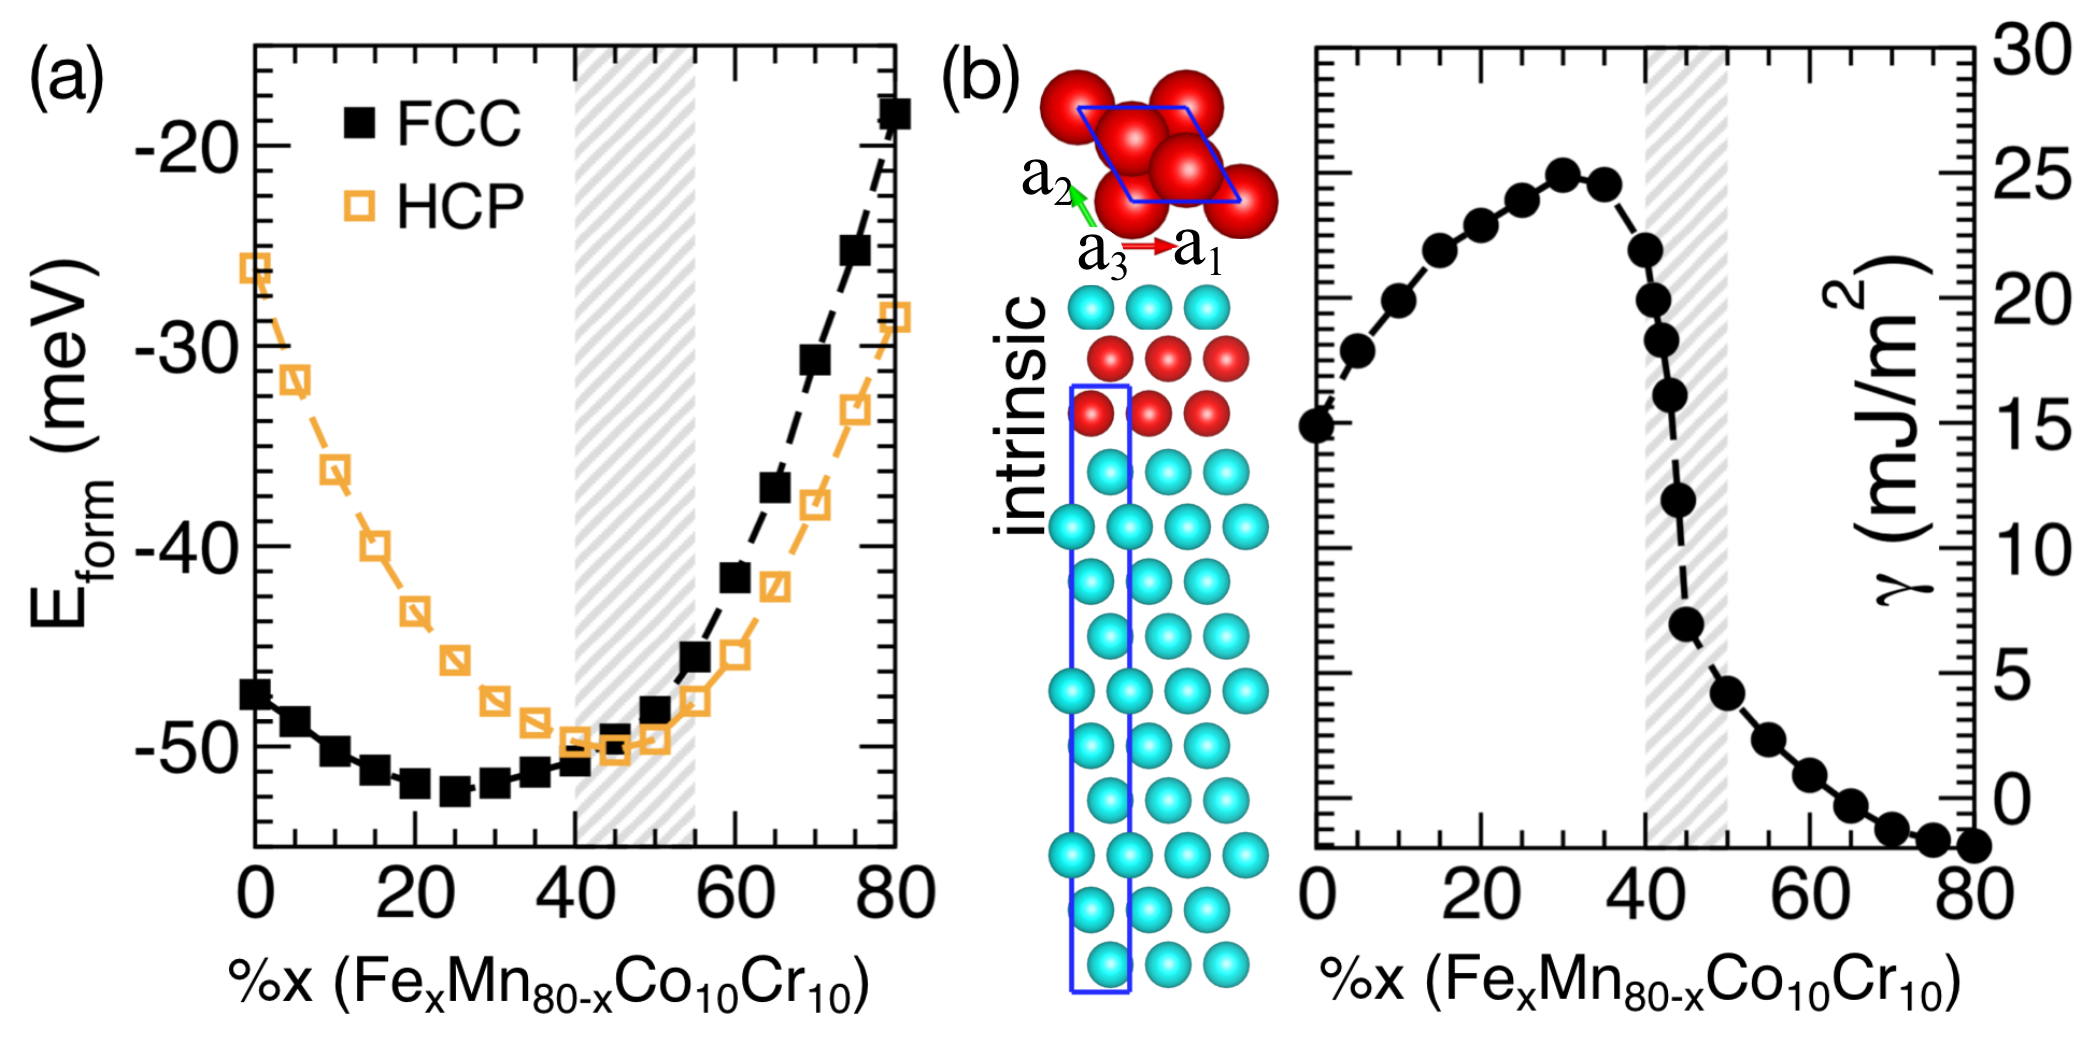
Phase stability (Fig. 1a) shows a critical range of 40-55 at.%Fe with a possible two-phase region at the crossover in the stability of the fcc and hcp phases, with fcc energetically favorable at low %Fe. The dual-phase alloy in the Fe-rich region can benefit from solid-solution strengthening, owing to the decreased SFE Li et al. (2016); Pierce et al. (2015). The SFE for FexMn80-xCo10Cr10 (Fig. 1b) first increases with %Fe additions and then shows a precipitous drop within the dual-phase region from 30–50 at.%Fe. The low SFE indicates an fcc lattice for this system becomes unstable with respect to the formation of intrinsic stacking faults. These results correlate well with Fe-Mn phase diagram that shows -martensite is not formed above 50 at.% Fe, and higher Mn concentration drives austenite-only structure Rabinkin (1979). In a pioneering work, Kelly investigated Fe-Ni and Fe-Ni-C alloys with relatively high SFE Kelly (1965) and showed that alloys with appreciable Cr or Mn have low SFE and form martensites associated with planar stacking faults or the formation of ‘hcp’ martensite Lee and Lee (1993); Misra et al. (2009).
Typically, medium or negative SFE has been regarded as the crucial indicator of TRIP phenomena Zhang et al. (2017); Zaddach et al. (2013); Kivy and Zaeem (2017); Li et al. (2017); Huang et al. (2018); Chen et al. (2020); Li et al. (2017), suggesting a low-energy barrier for fcc-to-hcp transformation Zhao et al. (2017). Conventional steels are known for martensitic transitions at medium SFEs, e.g., Fe-Mn-based alloys with SFEs below 11-19 mJ/m2, and Co-Ni-Cr-Mo alloys below 9-15 mJ/m2 Rémy and Pineau (1976). This has also been exemplified for Cu-Al Zhang et al. (2009), Ni-Cu Ebrahimi et al. (2004), Ni-Fe Ebrahimi et al. (2004), Ni-Co Medvedeva et al. (2010), Co-Ni-Cr-Mo Medvedeva et al. (2010), and Fe-Mn based (TWIP/TRIP steel) alloys Cooman et al. (2018); Pierce et al. (2015). However, the difficulty in measuring SFE Volosevich et al. (1976); Zhang et al. (2017); Zaddach et al. (2013); Kivy and Zaeem (2017) makes comparison with theory harder. In Table 1, we tabulated calculated SFEs for FexMn80-xCo10Cr10 with a comparison to experiments Picak et al. (2019) and other Fe-Mn-based alloys Pierce et al. (2015); Kim et al. (2011); Jeong et al. (2013). Our calculations indicate medium-to-low intrinsic SFE for FexMn80-xCo10Cr10 with increasing %Fe. Extrinsic (ESF) and twinning (TFE) fault energies (Fig. S2) suggests intrinsic faults are energetically more favorable, i.e., ISFE ESFE TFE. In Fig. 1b, the ISFE is non-monotonic versus , where the energy needed to alter the fcc stacking sequence Lin et al. (2018) is varying dramatically and goes negative with at.%Fe with composition. The dramatic change in ISFE can be attributed to the relatively large increase in hcp volume compared to fcc (see red zone in Fe-rich region in Fig. S1). The negative ISFEs in fcc configurations suggest that the hcp stacking would be preferred energetically. ESFEs (Fig. S2d) follow a similar trend as ISFE, but unlike ISFE it remains positive in the Fe-rich region. No such composition dependence versus %Fe was observed in TFE (Fig. S2d).
| Fe-Mn-based | FexMn80-xCo10Cr10 | |||
|---|---|---|---|---|
| Systems | SFE | %x | SFE | |
| Theory | Expt | |||
| Fe66Mn28Al3Si3 | 38.85 | 0 | 14.7 | – |
| Fe69Mn25Al3Si3 | 21.03 | 10 | 19.8 | – |
| Fe72Mn22Al3Si3 | 15.0 3 | 20 | 21.9 | – |
| Fe75Mn25 | 27.5 3.3 | 40 | 22.3 | 174 |
| Fe78Mn22 | 15.0 1.8 | 45 | 7.3 | – |
| Fe80Mn20 | 18.0 2.2 | 60 | 1.1 | – |
| Fe82Mn18 | 22.0 2.6 | 70 | -1.3 | – |
| Fe84Mn16 | 26.0 3.1 | 80 | -1.9 | – |
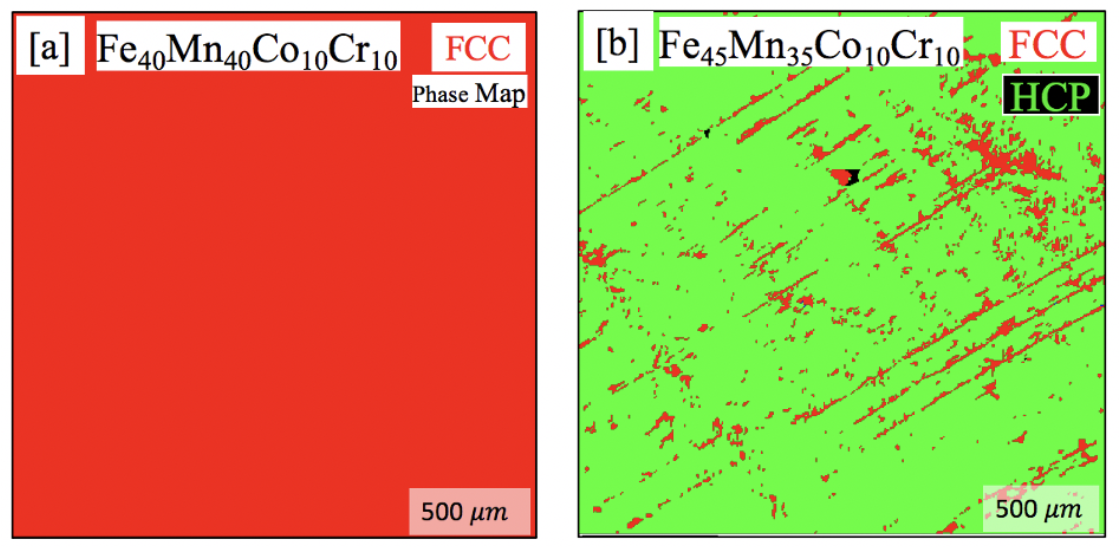
Phase stability analysis of FexMn80-xCo10Cr10 in Fig. 1a shows dual-phase region with onset at 40 at.%Fe. Recently, the =50 at.%Fe alloy has been reported as a two-phase at RT Li et al. (2016), whereas the =40 at.%Fe alloy is single-phase fcc at RT Picak et al. (2019). DFT results (Fig. 1) show small for 40 and 45 at.%Fe, with a higher SFE for 40 at.%Fe (22.2 mJ/m2) compared to 45 at.%Fe (7.3 mJ/m2). Thus, the higher SFE of fcc 40 at.%Fe alloy plays a key role in stabilizing the single-phase fcc; that is, RT cannot provide enough thermal energy to drive the martensitic transformation in contrast to 45 at.%Fe. To prove our claim, we grew a 40 and 45 at.%Fe single-crystal HEAs (see experimental methods in supplemental information). Electron backscatter diffraction (EBSD) micrographs (Fig. 2a,b) show single-phase (fcc) and dual-phase (fcc+hcp) microstructure, respectively, for 40 and 45 at.%Fe.
With proper configurational averaging for general HEAs (using the coherent-potential approximation, not just one representative configuration), theory provides a reliable and quantitative prediction of and and its dramatic composition dependence, here for FexMn80-xCo10Cr10. The small and medium SFE at at.%Fe provide crucial theory guidance for the microstructural evolution in HEA steels.
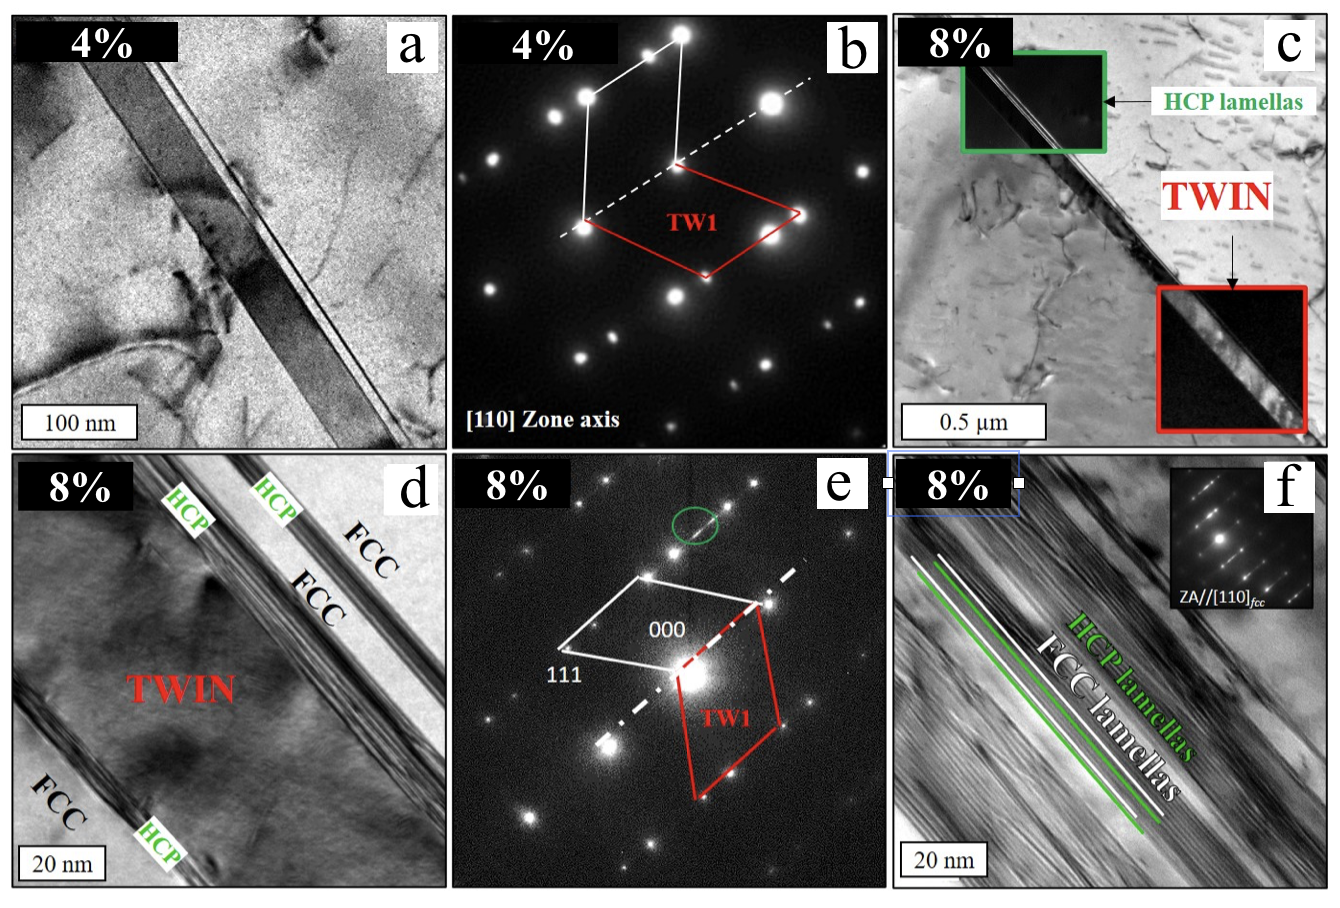
To confirm, we examined 40 at.%Fe single crystals under RT uniaxial tensile loading. The bright-field TEM micrographs and selective-area diffraction patterns (SADP) are shown in Fig. 3 (also see Fig. S5). At 4% strain, nano-twin formation was observed in Fig. 3a at the beginning of deformation, which is confirmed by SADP in Fig. 3b. With further increase in strain, martensite was activated at strains as low as 8% at twin boundaries in Fig. 3c. The strain-induced martensitic transformation in Fig. 3d and corresponding SADP at Fig. 3e at higher magnification further confirms the role of competing fcc/hcp stability with medium SFE (Fig. 1a). X-ray measurements in Fig. S6 further confirm the martensite (hcp phase) is not an artifact of TEM thin-foil effect. Nano-sized hcp and fcc lamellas in Fig. 3f reveal a composite microstructure acting as a barrier for the dislocation motion, which improved the strain hardening behavior (see Fig. S7). Recent reports also confirm that simultaneous activation of TWIP/TRIP effect provides better strength and ductility combination Picak et al. (2021).
The connection between SRO and low-temperature ordering behavior is very important for alloy design Singh et al. (2015); Singh and Johnson (2021). Upon cooling, the high-temperature disordered phase gives rise to SRO and ultimately at low-temperature to ordering. And, SRO in the disordered phase is often a ‘precursor’ to the long-range order at low temperatures (or competition between local ordering and clustering). The Warren-Cowley SRO pair-correlations were calculated directly using thermodynamic linear-response theory – for more details see Singh et al. (2015); Singh and Johnson (2021); Singh et al. (2020, 2020, 2018, 2019); Johnson (2012). Here, indices denote sublattices in a crystal structure [1 (2) for fcc (hcp)] and denote elements [here 1–4]. For N-component solid-solutions, all SRO pair correlations (arising from fluctuations in site-occupation probabilities) are calculated simultaneously Singh et al. (2015), similar to that done to get the vibrational stability matrix (i.e., phonon modes and “force-constants”). SRO is dictated by pair-interchange energies (chemical stability matrix), i.e., S Singh et al. (2015); Singh and Johnson (2021); the thermodynamically-averaged second-variation of the free energy with respect to compositional fluctuations Singh et al. (2015). As such, the most unstable SRO mode with wavevector ko will have the largest peak in for a specific - pair in the solid-solution. An absolute instability to mode Singh et al. (2015) occurs below the spinodal temperature , where . If =(000), the alloy is unstable to segregation. Both ordering and clustering peaks may compete. Importantly, S dictates the origin for the SRO, which may be a different pair that peaks in the observable , as they are related exactly by an inverse in linear response, see Singh et al. (2018, 2015, 2020, 2018).
For the 40 at.%Fe alloy, the calculated SRO for fcc and hcp phases are shown in Fig. 4 at 100 K and 300 K (RT). Although SRO at RT is not strong relative to 100 K, it persists over a range of temperature, which may impact dislocation glide, as found in fcc solid-solution alloys Zhang et al. (2020). The spinodal decomposition in solid-solutions occurs during, e.g., order-disorder transformation during cooling Zhou et al. (2015), in which the spinodal temperature indicates the absolute instability to the mode in SRO Singh et al. (2015). A high mixing entropy keeps solid-solution phases stable at higher temperatures, becoming metastable at low temperatures. To estimate temperature changes on relative stability, we approximate free-energy [fcc-hcp] by including SRO and electronic entropy as in fcc and hcp phases with respect to high-T disorder fcc phase (1500 K having no SRO) with = meV/atom; with lowering of temperature, [SRO] = meV/atom at 1000 K and meV/atom at 300 K. Although the energy of fcc lowers relative to hcp, the change is weak. Therefore, no major impact is expected for transition temperature. At low temperatures (with SRO included), the increased stability of fcc over hcp further conforms with the experimentally observed single-phase fcc at 300 K, see Fig. 2a. The calculated Tsp for the fcc and hcp at.%Fe alloy is 50 and 60 K, respectively. Such low phase-decomposition temperatures indicate that it cannot be retained at RT, supporting a martensitic transformation, as predicted in Fig. 1 and observed in Fig. 3.
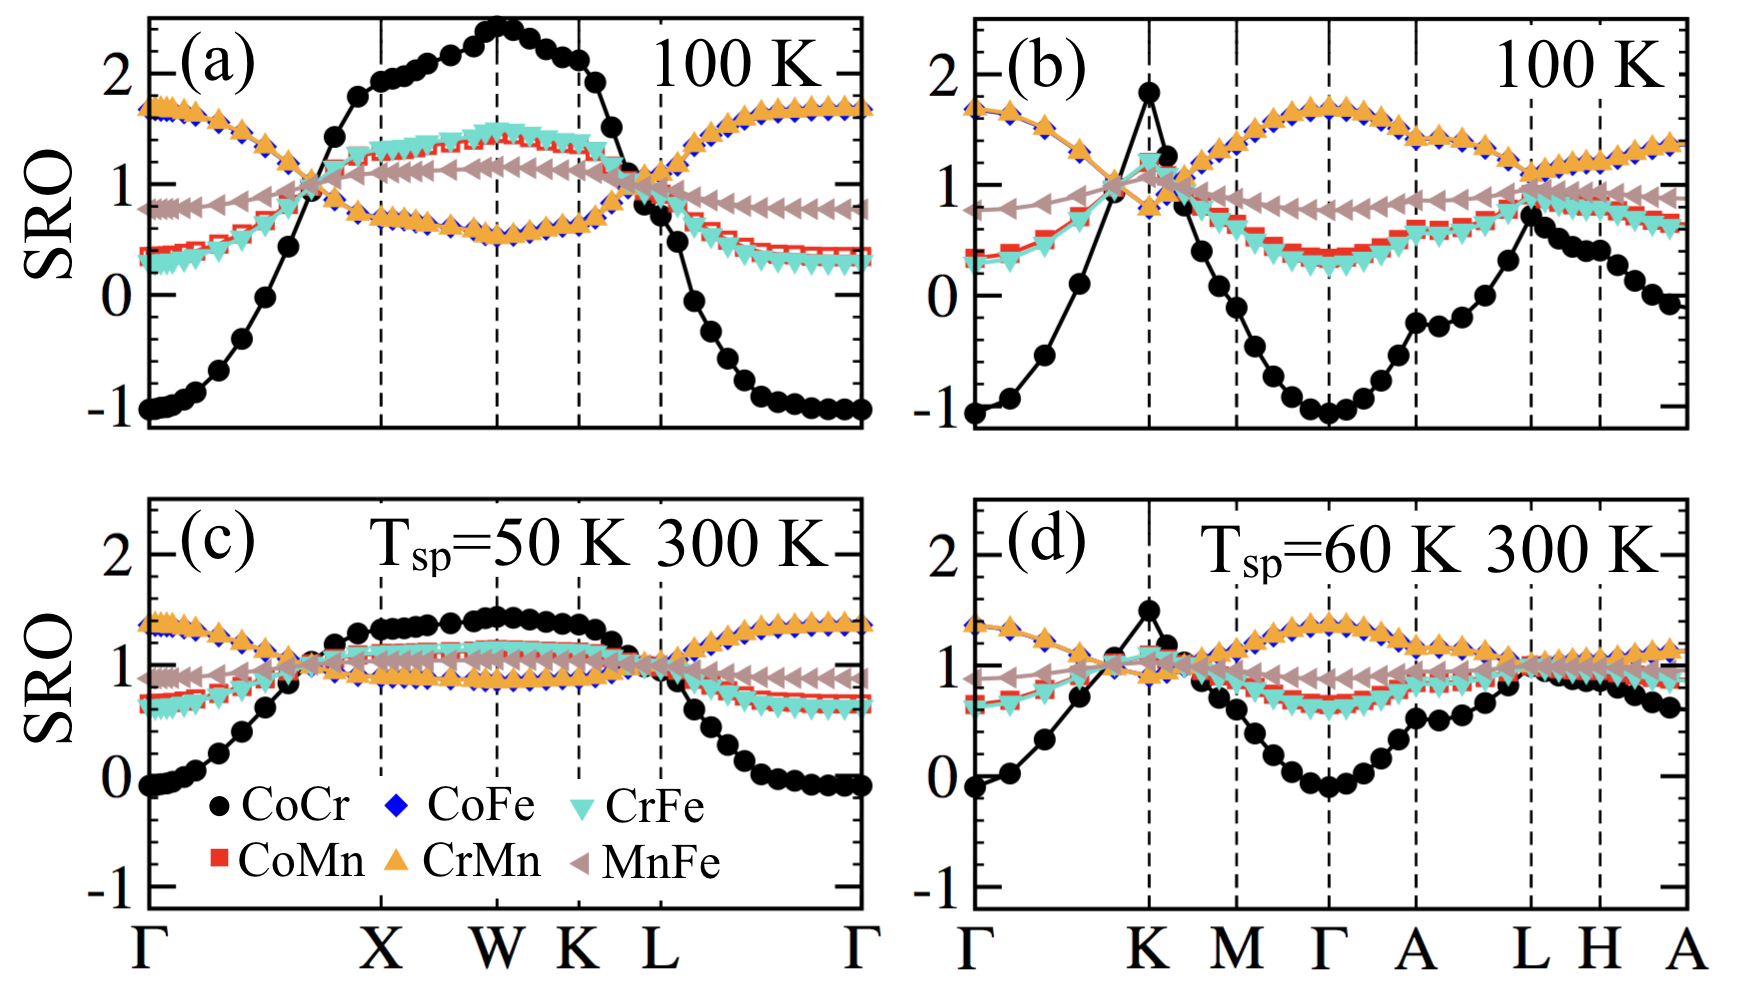
Importantly, the state of local chemical SRO is often a precursor to low-temperature order through cooling in most alloys. Notably, the microstructure and local order both can be controlled by composition and/or heat treatment at higher temperatures. To reveal the local chemical order at the onset of dual-phase in Fig. 1a), we analyze the Warren-Cowley SRO parameters that manifest the observable diffuse intensities at 100 K and 300 K for at.%Fe. The diffuse intensities in Fig. 4a-d have maximal SRO at W= in fcc phase (indicating D022-type ordering) and at K= for hcp phase (indicating D019-type order), which have possible origin in peaks in S Singh et al. (2015) (see Fig. S8 that shows weak temperature dependence). The Co-Cr pair is the most dominant mode that become unstable at Tsp of 50 K in fcc and of 60 K hcp phase. The Cr-Mn and Co-Fe pairs contribute with the second most dominant modes with peaks at both in fcc and hcp phases at RT. The presence of SRO at RT, however weak, can impact dislocation glide Ding et al. (2018). Our bright-field TEM image (Fig. S3) shows dislocations pile-up at the onset of plastic deformation, indicating strongly localized dislocation structures along a specific (111) planes in fcc alloy. According to Cohen and Fine Cohen and Fine (1962), the first dislocation in the pile-up is exposed to higher resistance against slip due to interaction with the favorable (stable) SRO environment, which leads to localized deformation and pile-up in Fe40Mn40Co10Cr10. All successive dislocations, produced by the activated dislocation source and moving along the regions with SRO that was locally destroyed (due to rearrangement of solute) help to overcome the higher resistance, which subsequently helps to nucleate the martensitic phase during deformation. The small poses only a small athermal transformation energy barrier between fcc and hcp phases that further assists the strain-induced martensitic transformation in Fig. 3. Thus, the dislocation behavior observed (Fig. S3) and martensitic transformation shown in Fig. 3 can be associated to the weak SRO, similar to binaries Gerold and Karnthaler (1989); Kivy and Zaeem (2017), as SFE and high yield strength are already known to have a minor effect on the dislocation pileup Zhang et al. (2020).
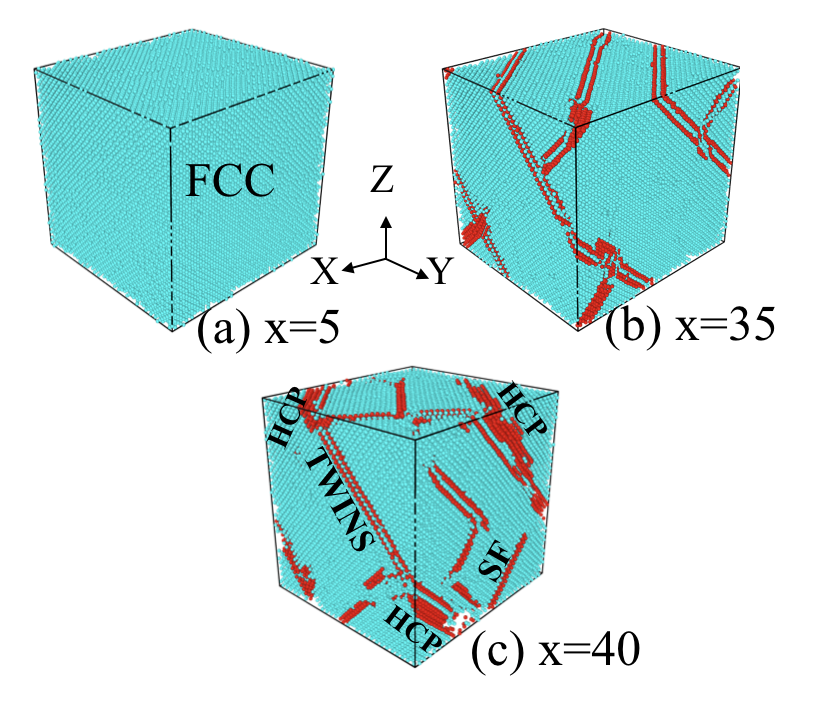
Finally, MD simulations were performed (Fig. 5) to understand the deformation mechanism in 40 at.%Fe under uniaxial stress with increasing strain at RT (method and details in supplement). The microstructure of uniaxially-deformed FexMn80-xCo10Cr10 at 8% strain (matching experimental condition) enhanced the ability to form SFs and twins (TWs) with increase in at.%Fe, as shown in Fig. 5. Our deformation analysis suggests that (see movie in supplement Video S1) intrinsic fault planes act as source for twin nucleation. Smallman et al. Smallman and Green (1964) also discussed that lower SFE is preferable for twins as it helps to accommodate large strain, see Tadmor and Bernstein (2004); Kibey et al. (2007). This mechanism becomes important as, unlike high SFE materials, low SFE alloys cannot develop cross slips that helps to absorb large stress. Once the deformation twins are formed further increase in strain can either increase TW density or existing twins act as nucleation sites for the hcp, especially at intersection of SFs and TWs, see Fig. 3c-d. Shockley partials were found as the primary dislocations during early loading stage. While Hirth dislocations and stair-rods, identified at the later stages, can be responsible for enhancement in strength and ductility due to the formation of Lomer-Cottrell lock (see movie in supplement Video S1), which agrees with an extra-stage strain-hardening observed in stress-strain curve for 40 at.%Fe (see Fig. S7).
In conclusion, using DFT-based Green’s function methods in combination with proper configuration-averaging using the coherent-potential approximation, we predicted the controlling physics behind the martensitic transformation in a complex FexMn8-xCo10Cr10 solid-solution alloy system to occur at the specific composition of = at.%Fe. We confirmed the theoretical predictions using precision experiments on single-crystal samples. Molecular dynamics simulations supports both DFT prediction and our experimental observation of a martensitic transformation. The tunability of phase energy and stacking-fault energy in HEAs/MEAs using purely chemistry and disorder shows the relevance of theory-guided design for the next-generation alloys with superior structure-property correlation, as well as the unique insights for controlling phase transformation in technologically relevant alloys.
Acknowledgements
PS and SP contributed equally to this work. Research at Ames Laboratory was supported by the U.S. Department of Energy (DOE), Office of Science, Basic Energy Sciences, Materials Science & Engineering Division. Ames Laboratory is operated by Iowa State University for the U.S. DOE under contract DE-AC02-07CH11358. RA acknowledges the support of QNRF under Project No. NPRP11S-1203-170056.
References
- Yeh et al. (2004) J.-W. Yeh, S.-K. Chen, S.-J. Lin, J.-Y. Gan, T.-S. Chin, T.-T. Shun, C.-H. Tsau and S.-Y. Chang, Advanced Engineering Materials, 2004, 6, 299–303.
- Miracle and Senkov (2017) D. Miracle and O. Senkov, Acta Materialia, 2017, 122, 448–511.
- George et al. (2019) E. P. George, D. Raabe and R. O. Ritchie, Nature Reviews Materials, 2019, 4, 515–534.
- Zhu and Liao (2004) Y. T. Zhu and X. Liao, Nature Materials, 2004, 3, 351–352.
- Li et al. (2016) Z. Li, K. G. Pradeep, Y. Deng, D. Raabe and C. C. Tasan, Nature, 2016, 534, 227–230.
- Singh et al. (2018) P. Singh, A. Sharma, A. V. Smirnov, M. S. Diallo, P. K. Ray, G. Balasubramanian and D. D. Johnson, npj Computational Materials, 2018, 4, 16.
- Ikeda et al. (2019) Y. Ikeda, I. Tanaka, J. Neugebauer and F. Körmann, Materials Characterization, 2019, 147, 464 – 511.
- Picak et al. (2019) S. Picak, J. Liu, C. Hayrettin, W. Nasim, D. Canadinc, K. Xie, Y. Chumlyakov, I. Kireeva and I. Karaman, Acta Materialia, 2019, 181, 555 – 569.
- Tamm et al. (2015) A. Tamm, A. Aabloo, M. Klintenberg, M. Stocks and A. Caro, Acta Materialia, 2015, 99, 307 – 312.
- Zhang et al. (2017) F. X. Zhang, S. Zhao, K. Jin, H. Xue, G. Velisa, H. Bei, R. Huang, J. Y. P. Ko, D. C. Pagan, J. C. Neuefeind, W. J. Weber and Y. Zhang, Phys. Rev. Lett., 2017, 118, 205501.
- Ma et al. (2018) Y. Ma, Q. Wang, C. Li, L. J. Santodonato, M. Feygenson, C. Dong and P. K. Liaw, Scripta Materialia, 2018, 144, 64 – 68.
- Widom et al. (2014) M. Widom, W. P. Huhn, S. Maiti and W. Steurer, Metallurgical and Materials Transactions A, 2014, 45, 196–200.
- Singh et al. (2015) P. Singh, A. V. Smirnov and D. D. Johnson, Phys. Rev. B, 2015, 91, 224204.
- Ding et al. (2018) J. Ding, Q. Yu, M. Asta and R. O. Ritchie, Proceedings of the National Academy of Sciences, 2018, 115, 8919–8924.
- Kostiuchenko et al. (2020) T. Kostiuchenko, A. V. Ruban, J. Neugebauer, A. Shapeev and F. Körmann, Phys. Rev. Materials, 2020, 4, 113802.
- Zhang et al. (2020) R. Zhang, S. Zhao, J. Ding, Y. Chong, T. Jia, C. Ophus, M. Asta, R. O. Ritchie and A. M. Minor, Nature, 2020, 581, 283–287.
- Volosevich et al. (1976) P. Y. Volosevich, V. Grindnev and Y. N. Petrov, Phys. Met. Metallogr., 1976, 42, 126–130.
- Ikeda et al. (2019) Y. Ikeda, I. Tanaka, J. Neugebauer and F. Körmann, Phys. Rev. Materials, 2019, 3, 113603.
- Cooman et al. (2018) B. C. D. Cooman, Y. Estrin and S. K. Kim, Acta Materialia, 2018, 142, 283 – 362.
- Bouaziz et al. (2013) O. Bouaziz, H. Zurob and M. Huang, steel research international, 2013, 84, 937–947.
- Steinmetz et al. (2013) D. R. Steinmetz, T. Jäpel, B. Wietbrock, P. Eisenlohr, I. Gutierrez-Urrutia, A. Saeed–Akbari, T. Hickel, F. Roters and D. Raabe, Acta Materialia, 2013, 61, 494 – 510.
- Wu et al. (2014) Z. Wu, H. Bei, G. Pharr and E. George, Acta Materialia, 2014, 81, 428 – 441.
- Wang et al. (2020) C. Wang, B. Yao, Z. Liu, X. Kong, D. Legut, R. Zhang and Y. Deng, International Journal of Plasticity, 2020, 102725.
- Uzer et al. (2018) B. Uzer, S. Picak, J. Liu, T. Jozaghi, D. Canadinc, I. Karaman, Y. Chumlyakov and I. Kireeva, Materials Research Letters, 2018, 6, 442–449.
- Cotes et al. (1995) S. Cotes, M. Sade and A. F. Guillermet, Metallurgical and Materials Transactions A, 1995, 26, 1957–1969.
- He et al. (2014) J. He, C. Zhu, D. Zhou, W. Liu, T. Nieh and Z. Lu, Intermetallics, 2014, 55, 9 – 14.
- Schuh et al. (2015) B. Schuh, F. Mendez-Martin, B. Völker, E. George, H. Clemens, R. Pippan and A. Hohenwarter, Acta Materialia, 2015, 96, 258 – 268.
- Lu et al. (2018) W. Lu, C. H. Liebscher, G. Dehm, D. Raabe and Z. Li, Advanced Materials, 2018, 30, 1804727.
- Bu et al. (2019) Y. Bu, Z. Li, J. Liu, H. Wang, D. Raabe and W. Yang, Phys. Rev. Lett., 2019, 122, 075502.
- Zhao et al. (2017) Y. Zhao, T. Yang, Y. Tong, J. Wang, J. Luan, Z. Jiao, D. Chen, Y. Yang, A. Hu, C. Liu and J.-J. Kai, Acta Materialia, 2017, 138, 72 – 82.
- Yang et al. (2018) T. Yang, Y. L. Zhao, Y. Tong, Z. B. Jiao, J. Wei, J. X. Cai, X. D. Han, D. Chen, A. Hu, J. J. Kai, K. Lu, Y. Liu and C. T. Liu, Science, 2018, 362, 933–937.
- Johnson et al. (1986) D. D. Johnson, D. M. Nicholson, F. J. Pinski, B. L. Gyorffy and G. M. Stocks, Phys. Rev. Lett., 1986, 56, 2088–2091.
- Johnson and Pinski (1993) D. D. Johnson and F. J. Pinski, Phys. Rev. B, 1993, 48, 11553–11560.
- Alam and Johnson (2009) A. Alam and D. D. Johnson, Phys. Rev. B, 2009, 80, 125123.
- Alam et al. (2010) A. Alam, B. Kraczek and D. D. Johnson, Phys. Rev. B, 2010, 82, 024435.
- Alam and Johnson (2012) A. Alam and D. D. Johnson, Phys. Rev. B, 2012, 85, 144202.
- Perdew et al. (1996) J. P. Perdew, K. Burke and M. Ernzerhof, Phys. Rev. Lett., 1996, 77, 3865–3868.
- Carter and Holmes (1977) C. B. Carter and S. M. Holmes, The Philosophical Magazine: A Journal of Theoretical Experimental and Applied Physics, 1977, 35, 1161–1172.
- Datta et al. (2009) A. Datta, U. Waghmare and U. Ramamurty, Scripta Materialia, 2009, 60, 124 – 127.
- Chandran and Sondhi (2011) M. Chandran and S. K. Sondhi, Journal of Applied Physics, 2011, 109, 103525.
- Yu and Wang (2009) X.-X. Yu and C.-Y. Wang, Acta Materialia, 2009, 57, 5914 – 5920.
- Singh et al. (2020) P. Singh, S. Gupta, S. Thimmaiah, B. Thoeny, P. K. Ray, A. Smirnov, D. D. Johnson and M. J. Kramer, Acta Materialia, 2020, 194, 540 – 546.
- Singh et al. (2018) P. Singh, A. V. Smirnov and D. D. Johnson, Phys. Rev. Materials, 2018, 2, 055004.
- Plimpton (1995) S. Plimpton, Journal of Computational Physics, 1995, 117, 1–19.
- Raabe et al. (2015) D. Raabe, C. C. Tasan, H. Springer and M. Bausch, steel research international, 2015, 86, 1127–1138.
- Singh et al. (2019) P. Singh, A. Marshal, A. V. Smirnov, A. Sharma, G. Balasubramanian, K. G. Pradeep and D. D. Johnson, Phys. Rev. Materials, 2019, 3, 075002.
- Gao et al. (2016) M. Gao, J.-W. Yeh, P. Liaw and Y. Zhang, High-entropy Alloys: Fundamentals and Applications, Springer Publishing, 2016.
- Pierce et al. (2015) D. Pierce, J. Jiménez, J. Bentley, D. Raabe and J. Wittig, Acta Materialia, 2015, 100, 178 – 190.
- Rabinkin (1979) A. Rabinkin, Calphad, 1979, 3, 77 – 84.
- Kelly (1965) P. Kelly, Acta Metallurgica, 1965, 13, 635 – 646.
- Lee and Lee (1993) S. W. Lee and H.-C. Lee, Metallurgical and Materials Transactions A, 1993, 24, 1333–1343.
- Misra et al. (2009) R. D. K. Misra, S. Nayak, S. A. Mali, J. S. Shah, M. C. Somani and L. P. Karjalainen, Metallurgical and Materials Transactions A, 2009, 40, 2498–2509.
- Zhang et al. (2017) Y. Zhang, Y. Zhuang, A. Hu, J. Kai and C. Liu, Scripta Materialia, 2017, 130, 96 – 99.
- Zaddach et al. (2013) A. J. Zaddach, C. Niu, C. C. Koch and D. L. Irving, JOM, 2013, 65, 1780–1789.
- Kivy and Zaeem (2017) M. B. Kivy and M. A. Zaeem, Scripta Materialia, 2017, 139, 83 – 86.
- Li et al. (2017) Z. Li, C. C. Tasan, H. Springer, B. Gault and D. Raabe, Scientific Reports, 2017, 7, 40704.
- Huang et al. (2018) S. Huang, H. Huang, W. Li, D. Kim, S. Lu, X. Li, E. Holmström, S. K. Kwon and L. Vitos, Nature Communications, 2018, 9, 2381.
- Chen et al. (2020) L. Chen, T. Cao, R. Wei, K. Tang, C. Xin, F. Jiang and J. Sun, Materials Science and Engineering: A, 2020, 772, 138661.
- Li et al. (2017) Z. Li, C. C. Tasan, K. G. Pradeep and D. Raabe, Acta Materialia, 2017, 131, 323–335.
- Zhao et al. (2017) S. Zhao, G. M. Stocks and Y. Zhang, Acta Materialia, 2017, 134, 334 – 345.
- Rémy and Pineau (1976) L. Rémy and A. Pineau, Materials Science and Engineering, 1976, 26, 123 – 132.
- Zhang et al. (2009) Y. Zhang, N. Tao and K. Lu, Scripta Materialia, 2009, 60, 211 – 213.
- Ebrahimi et al. (2004) F. Ebrahimi, Z. Ahmed and H. Li, Applied Physics Letters, 2004, 85, 3749–3751.
- Medvedeva et al. (2010) N. I. Medvedeva, D. V. Aken and J. E. Medvedeva, Journal of Physics: Condensed Matter, 2010, 22, 316002.
- Kim et al. (2011) J. Kim, S.-J. Lee and B. C. D. Cooman, Scripta Materialia, 2011, 65, 363 – 366.
- Jeong et al. (2013) K. Jeong, J.-E. Jin, Y.-S. Jung, S. Kang and Y.-K. Lee, Acta Materialia, 2013, 61, 3399 – 3410.
- Lin et al. (2018) Q. Lin, J. Liu, X. An, H. Wang, Y. Zhang and X. Liao, Materials Research Letters, 2018, 6, 236–243.
- Picak et al. (2021) S. Picak, H. Yilmaz and I. Karaman, Scripta Materialia, 2021, 202, 113995.
- Singh and Johnson (2021) P. Singh and D. D. Johnson, (in peer-review), 2021, xx, xxx.
- Singh et al. (2020) P. Singh, A. Smirnov, A. Alam and D. D. Johnson, Acta Materialia, 2020, 189, 248 – 254.
- Johnson (2012) D. D. Johnson, in Characterization of Materials, ed. E. N. Kaufmann, Wiley, New York, 2012, ch. 13, pp. 1–31.
- Zhou et al. (2015) J. Zhou, J. Odqvist, J. Ågren, A. Ruban, M. Thuvander, W. Xiong, G. B. Olson and P. Hedström, Scripta Materialia, 2015, 98, 13 – 15.
- Cohen and Fine (1962) J. Cohen and M. Fine, J. Phys. Radium, 1962, 23, 749 – 762.
- Gerold and Karnthaler (1989) V. Gerold and H. Karnthaler, Acta Metallurgica, 1989, 37, 2177 – 2183.
- Smallman and Green (1964) R. Smallman and D. Green, Acta Metallurgica, 1964, 12, 145–154.
- Tadmor and Bernstein (2004) E. Tadmor and N. Bernstein, Journal of the Mechanics and Physics of Solids, 2004, 52, 2507–2519.
- Kibey et al. (2007) S. Kibey, J. B. Liu, D. D. Johnson and H. Sehitoglu, Applied Physics Letters, 2007, 91, 181916.