Characterizing the FRB host galaxy population and its connection to transients in the local and extragalactic Universe
Abstract
We present the localization and host galaxies of one repeating and two apparently non-repeating Fast Radio Bursts. FRB 20180301A was detected and localized with the Karl G. Jansky Very Large Array to a star-forming galaxy at . FRB20191228A, and FRB20200906A were detected and localized by the Australian Square Kilometre Array Pathfinder to host galaxies at and , respectively. We combine these with 13 other well-localized FRBs in the literature, and analyze the host galaxy properties. We find no significant differences in the host properties of repeating and apparently non-repeating FRBs. FRB hosts are moderately star-forming, with masses slightly offset from the star-forming main-sequence. Star formation and low-ionization nuclear emission-line region (LINER) emission are major sources of ionization in FRB host galaxies, with the former dominant in repeating FRB hosts. FRB hosts do not track stellar mass and star formation as seen in field galaxies (more than 95% confidence). FRBs are rare in massive red galaxies, suggesting that progenitor formation channels are not solely dominated by delayed channels which lag star formation by Gigayears. The global properties of FRB hosts are indistinguishable from core-collapse supernovae (CCSNe) and short gamma-ray bursts (SGRBs) hosts, and the spatial offset (from galaxy centers) of FRBs is mostly inconsistent with that of the Galactic neutron star population (95% confidence). The spatial offsets of FRBs (normalized to the galaxy effective radius) also differ from those of globular clusters (GCs) in late- and early-type galaxies with 95% confidence.
1 Introduction
The physical mechanism and the source population(s) powering the energetic ( to Jy ms) and s-ms duration fast radio bursts (FRBs) are currently two of the biggest mysteries of modern astrophysics. Significant progress has been made in the last two years, with (sub-)arcsecond localization of FRBs using radio interferometers such as the Karl G. Jansky Very Large Array (VLA), the Australian Square Kilometre Array Pathfinder (ASKAP), the Deep Synoptic Array (DSA-10), and the European VLBI Network (EVN) (Chatterjee et al., 2017; Bannister et al., 2019b; Ravi et al., 2019; Marcote et al., 2020; Law et al., 2020). These FRB localizations have enabled the identification of FRB host galaxies, and in some cases the location of the FRBs within the galaxies, which has provided the clues to the progenitor channels of these enigmatic sources. While the nature of FRBs remains uncertain, the redshifts for localized FRBs still permit us to probe the baryonic content of the Universe (Macquart et al., 2020), through measurements of the ionised baryon density in the intergalactic medium (IGM). FRBs are thus excellent probes of cosmology and the structure of the Universe (Bhandari & Flynn, 2021).
Recently, the Canadian Hydrogen Intensity Mapping Experiment Fast Radio Burst (CHIME/FRB) Project published a catalog of 535 FRBs detected during their first year of operations and observed in the range MHz (The CHIME/FRB Collaboration et al., 2021). The catalog represents the first large sample () of FRBs detected in a well-controlled experiment. It includes bursts from repeating and non-repeating FRB sources, and facilitates a comparative study of the FRB population. The CHIME/FRB sample reveals that while the sky locations and dispersion measures (DMs) of the two FRB populations are consistent with being drawn from the same distribution, the bursts from repeating sources have wider pulse widths and narrower bandwidths compared to apparent non-repeaters (Fonseca et al., 2020; Pleunis et al., 2021). Thus, these observational differences in the bursts themselves hint at different propagation or emission mechanisms for the two FRB sub-populations. Whether all FRBs repeat is still an outstanding question in the field (Palaniswamy et al., 2018; James, 2019; Caleb et al., 2019; Ravi, 2019; Ai et al., 2021).
In addition to the properties of the bursts, analyses of their host galaxy environments may provide more clues to disentangle the two FRB populations and their progenitor sources (Chittidi et al., 2020; Tendulkar et al., 2021). Currently, 15 FRBs (including repeating and non-repeating) have been localized to host galaxies at redshifts in the range (Heintz et al., 2020)111http://frbhosts.org. This preliminary sample shows that FRB host galaxies overall exhibit a broad range of color (), stellar mass (MM⊙), and star-formation rates (M). Moreover, the burst sites are in most cases significantly offset from the host-galaxy centers. A high spatial resolution analysis of a subset of FRB hosts found that most FRBs are not located in regions of elevated local star formation and stellar mass surface densities in comparison to the mean global values of their hosts (Mannings et al., 2020). Also, the majority of hosts in Mannings et al. (2020) show clear spiral arm features in the infrared (IR), with the positions of the bursts found to be consistent with an origin in the spiral arms. An analysis of the host-burst offset distribution and other host properties rule out long gamma-ray bursts (LGRBs) and super-luminous supernovae (SLSNe) as FRB production channels and favor compact merger events (double white dwarf (WD) and double neutron star (NS) mergers), accretion-induced collapse (AIC) of a white dwarf and core-collapse supernovae (CCSNe) to be plausible mechanisms for non-repeating ASKAP-localized bursts (Bhandari et al., 2020; Heintz et al., 2020; Li & Zhang, 2020).
In this first, relatively small host galaxy sample, tentative evidence was found for the hosts of the repeating FRBs to be less massive and less luminous on average, compared to the hosts of the apparently non-repeating FRBs. Even within the specific sub-population of repeating FRB hosts, though, a very diverse nature is apparent; FRB20121102A originates in a highly magnetized environment (Michilli et al., 2018) co-located with a radio nebula in a low-metallicity, highly star-forming dwarf galaxy at (Chatterjee et al., 2017; Tendulkar et al., 2016). The immediate environment and host galaxy properties of the FRB20121102A source led to a concordant model for FRBs in which bursts are produced by young magnetars, remnants from SLSNe or LGRBs (Margalit & Metzger, 2018). In contrast, FRB20180916B originates close to a star-forming region in a massive nearby () spiral galaxy (Marcote et al., 2020) lacking an extreme magneto-ionic environment and radio nebula. Observations with the Hubble Space Telescope (HST) established a small but significant offset of FRB20180916B from the nearest knot of active star formation in the host galaxy. This suggests that the age of the progenitor is inconsistent with that of a young magnetar but compatible with the ages of high-mass X-ray binaries and gamma-ray binaries (Tendulkar et al., 2021). Another repeating source, FRB20200120E is localized to a globular cluster system in the nearby spiral galaxy M81, suggesting that if the progenitor is a young neutron star, it must have been formed via an alternative pathway, such as accretion-induced collapse of a white dwarf, or the merger of compact stars in a binary system (Bhardwaj et al., 2021; Kirsten et al., 2021). Finally, the repeating FRBs 20190711A and 20201124A are observed to originate in typical star-forming galaxies at their respective redshifts (Heintz et al., 2020; Ravi et al., 2021; Fong et al., 2021).
In this paper, we introduce three additional bursts and their host galaxies to the existing sample and conduct a differential study of the host population of one-off and repeating FRBs using an updated sample of 16 FRB hosts (containing 6 repeating and 10 non-repeating FRBs). The paper is laid out as follows: Section 2 presents the discovery of a new burst from the repeating FRB20180301A source (Luo et al., 2020) and resulting localization using the Realfast system at the VLA. We also describe the radio and optical properties of the host galaxy of FRB20180301A. Section 3 presents the discovery and localization of two new (apparently) non-repeating FRBs, namely FRB20191228A and FRB20200906A, found in the Commensal Real-time ASKAP Fast Transients (CRAFT) Survey (Macquart et al., 2010). We also describe the follow-up observations and identification of their host galaxies. In Section 4, we compare the overall population of FRB hosts with field galaxies at similar redshifts, based on the largest sample to date. In Section 5, we differentiate the hosts and compare the properties of the two sub-populations; repeating and one-off bursts. In Section 6, we compare the global properties and the projected physical offsets of FRBs to a range of both extragalactic transients and the projected source population of Galactic objects. Additionally, we compare the host-normalized offset distributions of FRBs with that of globular clusters associated with different galaxy types. We summarise our results in Section 7.


2 Localization of the repeating FRB20180301A
2.1 Detection of a repeating burst
FRB20180301A, a burst originally detected in the Breakthrough Listen project at the Parkes radio telescope (Price et al., 2019), was observed to emit repeating radio pulses in sensitive follow-up observations with the FAST telescope using the 19-beam receiver centered at 1.25 GHz (Luo et al., 2020). Fifteen repeating bursts with fluences ranging from 0.03 Jy ms to 0.4 Jy ms, were detected from the source of FRB20180301A in a total effective observation time of 12 hrs at FAST.
We performed follow-up observations of FRB20180301A using Director’s Discretionary Time (DDT) with 40 hrs scheduled under VLA/19B-351, using the VLA in C array configuration at L-band, spanning 1-2 GHz. We used the L16f5DC-realfast correlator mode, which enables a fast sampling time of 10 ms. We observed the field of FRB20180301A centered at RA(J2000): 06:12:54.96 and Dec(J2000): +04:38:43.60 covering a localization uncertainty region of 2.6′ at 1.25 GHz obtained from detection at FAST. The source was observed at 9 epochs, each with an observation time of 2 hr in the period FebMay 2020. Each observation had an on-source time of 1.5 hrs and was searched for fast transients by the Realfast system. The details of the Realfast search procedure can be found in Law et al. (2018, 2020). We detected a repeat burst from FRB20180301A on 2020 May 28 at UTC 19:14:47.310 in the last epoch. It was detected in the real-time system with an image S/N of 10.8 at a DM of 517.45 pc cm-3. The Deep Learning based classifier fetch (Agarwal et al., 2020) reported an astrophysical probability of 99% for this burst. We used the recorded visibilities of the burst data to refine our estimate of the burst properties in an offline reprocessing. We re-ran the search with a finer DM grid at fractional sensitivity loss on a sub-band of the data. This sub-band was manually identified to consist of burst signal. The refined search led to an improvement in detection significance to at the DM of 536 pc cm-3. The top panel of Fig. 1 shows the burst profile and dedispersed spectrogram. This figure also shows a weaker component ms after the burst that is present in the lower part of the band. This could either be a component of the main burst, or another burst from this FRB. We used the visibilities from the main component to determine the localization of this FRB.
We used burstfit222https://github.com/thepetabyteproject/burstfit (Aggarwal et al., 2021a) to model the spectro-temporal properties of FRB20180301A using its spectrogram. Following the method described in Aggarwal et al. (2021a), we modelled the spectrum and the pulse using a Gaussian, and fit for the following parameters simultaneously: arrival time of peak, Gaussian FWHM of pulse, peak of the spectrum, FWHM of the spectrum, fluence and DM. We used scipy.curve_fit followed by Markov-Chain Monte-Carlo methods to obtain the posterior distribution of all the fit parameters. The resulting burst properties are presented in Table 1.
| Properties ††footnotemark: | FRB20180301A | FRB20191228A | FRB20200906A |
|---|---|---|---|
| Arrival timeaaArrival time of a repeating burst from FRB20180301A source and one-off ASKAP/CRAFT FRBs. (UT) | 2020-05-28 19:14:47.310 | 2019-12-28 09:16:16.444 | 2020-09-06 21:40:50.923 |
| S/N | 19.0 bbThis is the coherent S/N of the FRB detected in the VLA image. | 22.9 | 19.2 |
| DM (pc cm-3) | |||
| DM (pc cm-3) | 152 | 33 | 36 |
| DM (pc cm-3) | 254 | 20 | 38 |
| DMcosmicccEstimated using the Macquart-relation. (pc cm-3) | 289 | 210 | 324 |
| RA (J2000) | 06h12m54.44s () | 22h57m43.30s () | 03h33m59.08s () |
| Dec (J2000) | +04d40′15.8 () | 29d35′38.7 () | 14d () |
| Fluence (Jy ms) | 40 | 59 | |
| Pulse width (ms) | ddFRB20191228A shows a scattering tail of ms. The deconvolved width is ms. | ||
| Spectral energy densityeeThe energies are derived assuming a flat spectrum for FRBs () and zero k-correction. (erg Hz-1) | |||
| Persistent source, | |||
| radio luminosity (W Hz-1) | 1.5 GHz | 6.5 GHz | 6 GHz |
| Host galaxy | |||
| Redshift**These measurements are derived from spectroscopy. | 0.3304 | 0.2432 | 0.3688 |
| $\dagger$$\dagger$footnotemark: (restframe) | |||
| Mr$\dagger$$\dagger$footnotemark: (restframe) | |||
| Galactic $\dagger$$\dagger$footnotemark: | 0.46 | 0.02 | 0.05 |
| M∗$\dagger$$\dagger$footnotemark: () | |||
| SFR**These measurements are derived from spectroscopy. ( yr-1) | |||
| log(sSFR) (yr-1) | 9.08 | 10.03 | 10.44 |
| MetallicityffIn units of 12 + log[O/H]. **These measurements are derived from spectroscopy. | 8.70 | 8.48 | 8.76 |
| Projected offset from galaxy center (kpc) | |||
| Effective radius (kpc) |
2.1.1 Spatial localization
The images generated by the Realfast search pipeline make several assumptions (coarse DM grid, non-optimal image size, simpler calibration algorithm, etc) during calibration and imaging. To address these, we used the raw, de-dispersed burst visibilities to form the burst image using CASA (McMullin et al., 2007). We ran the full CASA pipeline to generate VLA calibration tables for this observation. We then used the CASA task applycal to apply those calibration and flagging table to the burst data. Observations of calibrator 3C147 were used to calibrate the flux density scale, bandpass and delays. The nearby source J06321022 was used to calibrate the complex gain fluctuations over time, by observing it every 20 minutes. We then used CASA tasks tclean and imfit to generate a radio image and fit an ellipse to the burst position. The initial burst position was found to be RA(J2000): 06h12m54.47s and Dec(J2000): +04d40′15.6 with a statistical uncertainty of 0.01 in RA and 0.01 in Dec (see bottom panel of Fig. 1).
|
2.1.2 VLA Radio Continuum Image
In addition to the fast-sampled data with an integration time on order of a few milliseconds generated by Realfast, the VLA correlator creates slow-sampled data with an integration time of 5 s. This slow sampled data will average out any fast-varying signal (like FRBs) but is suitable for finding any persistent radio source near the burst location. We made separate images for each epoch and combined images to search for any persistent or slowly varying emission from the FRB location.
The slow-sampled data was calibrated using the standard VLA calibration pipeline, followed by manual data inspection and further flagging. We used tclean to produce images. Manual flagging of the dataset was done to allow for much finer and in-depth RFI flagging than autoflagging alogrithms. The inputs of tclean used the gridder wproject with 128 wprojplanes. The deconvolver was set to mtmfs and Briggs weighting was used with a robustness parameter of 0. These parameters were chosen to help reduce noise from sources outside the primary beam as well as suppressing minor baseline-dependent errors. The full field of view was also imaged to allow cleaning on these bright sources, specifically sources and arcminutes away from the phase center.
Once tclean was run, the RMS near the center of the primary beam was found to be in the range Jy beam-1 for all epochs. The image RMS is consistent with the combined effect of confusion noise (Jy beam-1) and thermal noise (Jy beam-1 in each epoch). Combining the first four epochs and last four epochs produces images with RMS of Jy beam-1, consistent with reduced thermal noise added to a fixed confusion noise. We find no persistent radio source above a 3 flux density of Jy beam-1 yielding a luminosity limit of W Hz-1 at 1.5 GHz.


2.1.3 Astrometry
We tested our astrometric precision by associating radio sources in the FRB-epoch VLA image with the Karl G. Jansky Very Large Array Sky Survey (Lacy et al., 2020, VLASS) Epoch 1 Quick Look catalog (Gordon et al., 2020). We re-imaged the FRB epoch, selecting an interval of 30 s centered on the FRB for investigating astrometric accuracy. We ran the PYSE source finding package (Spreeuw et al., 2018) on this 30 s image and identified six radio sources above a significance level of . All these sources had VLASS counterparts within a 2 search radius. We measured the weighted mean and associated uncertainty of the offsets between these six sources in the 30 s snapshot image and their VLASS catalog positions, measuring mas and mas in RA and Dec respectively. However, the scatter in the measured offsets is clearly not due solely to the statistical (signal-to-noise limited) measurement uncertainty, with the of the weighted mean fit being 50.40 for 10 degrees of freedom. This is not unexpected, given the potential for systematic differences in centroid position due to, e.g., the different frequency and resolution of our 30 s image vs the VLASS catalog. Previous studies using ASKAP (Day et al., 2021) have examined a large number of fields to estimate a scaling factor that can be applied to the weighted mean uncertainty to correct (on average) for these contributions, but the value of the scaling factor should depend on the telescope and reference catalogs used. Here, we instead take an unweighted mean of the six source offsets, which effectively assumes that the signal-to-noise limited contribution to each measured offset is small, and yields a more conservative estimation of the mean offset and uncertainty of mas and mas in RA and Dec respectively. We note that the astrometric accuracy of the VLASS Epoch 1 is well characterized, with a mean offset of the order in RA and in Dec333https://library.nrao.edu/public/memos/vla/vlass/VLASS_013.pdf. We corrected for this positional offset in the reference VLASS positions, and obtain a final offset correction of in RA and in Dec. The final position of FRB20180301A after correcting for positional offsets along with the statistical and systematic uncertainties is RA(J2000): 06h12m54.44s () and Dec(J2000): +04d40′15.8 (). These are also listed in Table 1.
We conducted additional tests on the FRB-epoch data to investigate the astrometric stability on minute scales across the entire observation duration, generating a set of images with spacing 3 minutes. The mean offset varied by up to half an arcsecond between adjacent 3 min images, consistent with our previous experience of L-band observations and implying a potential gradient in the observed positional offsets of up to 0.2 arcseconds/minute. We noted, however, that the average offset derived from the 30 s image centered on FRB does not lie on an interpolation between those derived from adjacent 3 min images, suggesting some structure on min timescales. We note that any remaining variability on s timescales could lead to a small, uncorrected positional bias.
2.1.4 Optical follow-up
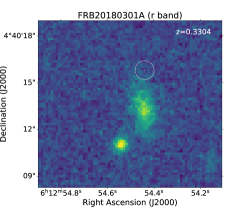
In archival Pan-STARRS images we identify a faint galaxy, PSO J093.226804.6703, as the putative host of FRB20180301A. We acquired deep (0.5 – 0.7 hrs in each band) follow-up imaging of the FRB field with the Nordic Optical Telescope (NOT) using the Sloan filters and on nights between UT 2021 October 26 to December 14, followed by additional deep ( s) Gemini -band observations on UT 2021 January 25. The Gemini image was astrometrically calibrated to match the Gaia DR2 catalog (Gaia Collaboration et al., 2018; Lindegren et al., 2018), with a relative accuracy of . We note that there is an additional nearby source to the south of the identified host galaxy in the field of FRB20180301A. The morphology of this source is consistent with being point-like, so we classify it as a Galactic foreground star.
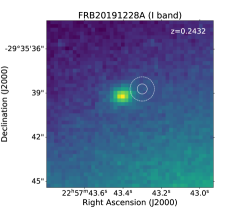
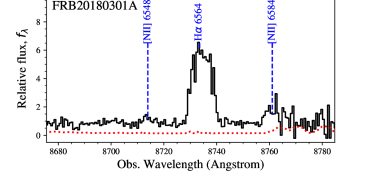
Observations of the host with the Keck/DEIMOS spectrograph on UT 2020 September 17 determined the galaxy’s redshift based on nebular emission lines such as [N ii] and H. The measured redshift was found to be consistent with the redshift range estimated by extragalactic DM in Luo et al. (2020). We also performed NIR observations of the galaxy in bands using the MMT telescope on UT 2021 February 27 & 28. The photometric measurements derived from MMT imaging, along with those from NOT, were used by CIGALE (Noll et al., 2009) for SED fitting to estimate the stellar mass of the galaxy (see Appendix for details). The deep band Gemini imaging was used for the probabilistic host galaxy association analysis. We find a Probabilistic Association of Transients to their Hosts (PATH) (Aggarwal et al., 2021b) probability of 99.9% for the association of FRB20180301A with the given galaxy. The host is presented in Fig. 2 and properties are listed in Table 1.
3 ASKAP localization of apparently non-repeating FRBs
Here we report the discoveries of the single bursts from two new FRB sources, FRBs 20191228A and 20200906A, discovered in the CRAFT incoherent-summed (ICS) searches with ASKAP Bannister et al. (2019a). The burst pulse profiles and dynamic spectra are shown in Figure 3.
3.1 FRB20191228A
FRB20191228A was detected on 2019 December 28 at UT 09:16:16.44440 during CRAFT observations conducted with ASKAP, with 28 antennas in a 336 MHz band centered on 1271.5 MHz. The burst had a detection S/N of 23 at a pc cm-3. The real-time detection in online incoherent-sum data triggered a download of 3.1 s of voltages around the FRB. The offline correlation of voltages across 28 antennas and their interferometric analysis led to an initial localization of FRB20191228A.
On 2020 January 31, we used the Australia Telescope Compact Array (ATCA) in the frequency range of GHz to perform astrometric observations of background sources near the position of FRB20191228A, to refine the position of the burst. In addition to four target background sources in the field of FRB20191228A (J22582929, J22552937, J22582955 and J22592957), we observed three gain calibrators (PKS2254367, PKS2337334, and PKS2255282). For each target background source, we obtained three position estimates – one for each gain calibrator, by applying phase calibration solutions derived from that calibrator. We observed a scatter of 80 mas in RA and mas in Dec in the position of the background sources depending on which gain calibrator was used. To account for this systematic uncertainty to the ATCA positions, for each background source we took a weighted mean of the three positions to estimate the probable location, and added the average residual offset from this mean position in quadrature to our estimate of the absolute positional uncertainty for the source.
The positions of target sources obtained from the ATCA radio image were compared with those obtained from the 3.1 s ASKAP data, following the method described in Day et al. (2020), to astrometrically register the FRB image frame to that of the International Celestial Reference Frame (ICRF3, Gordon, 2018) and estimate the accuracy of this registration. J22582929 and J22592957 were excluded from the field source comparison due to low S/N in the ASKAP image for the latter, and the former being resolved.
Finally, we computed a weighted mean systematic image frame offset using the method described in Day et al. (2021). We found positional offsets of and in RA and Dec., respectively. After accounting for astrometric shifts in the image frame as well as statistical and systematic errors, the final FRB position is RA(J2000): 22h57m43.30s () and Dec(J2000): 29d35′38.7 ().
3.1.1 Follow-up observations
The burst position is 1.8 arcmin from the first-magnitude star Fomalhaut ( PsA), which severely complicated identification and characterisation of the optical counterpart.
Deep imaging with FORS2 instrument at the European Southern Observatory’s (ESO) Very Large Telescope (VLT) was performed in the -band ( s) and -band ( s) on 2020 September 21 UT, while using the movable slitlets normally employed for multi-object spectroscopy to completely mask the lower of the 2 CCDs to protect the detector from saturation by Fomalhaut. The seeing ranged between during the observations.
The individual frames were bias-subtracted and flatfielded using the ESOReflex package (Freudling et al., 2013). To overcome the glare produced by Fomalhaut, a two-dimensional polynomial was fit to a patch of sky centered on the burst position in each individual frame, after masking sources. This model was then subtracted from the patch. The glare-subtracted images were coadded with the Montage package (Berriman & Good, 2017). A candidate host galaxy was identified with centroid approximately from the burst coordinates with a 100% PATH association probability (see Fig. 2). Photometry of the identified galaxy was performed with Source-Extractor (Bertin & Arnouts, 1996) using a circular aperture with a diameter. The effect of the glare subtraction on the photometry was investigated, and the uncertainty introduced by the procedure quantified, using injected synthetic sources of known magnitude (making use of Astropy, Robitaille et al., 2013).
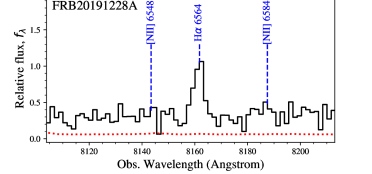
On UT 2020 November 08, the Keck/LRIS spectrograph was used to perform spectroscopic observations in order to determine the galaxy redshift. The nebular emissions such as H, [O iii] established the redshift of the host to be .
We also performed observations of the host of FRB20191228A using the ATCA at center frequencies of 5.5 and 7.5 GHz to search for a compact and persistent radio emission. We did not detect any radio emission above 22 Jy beam-1 (3) constraining the luminosity of the source to be W Hz-1 at 6.5 GHz.
3.2 FRB20200906A
FRB20200906A was discovered in the incoherent sum of 7 ASKAP antennas on 2020 September 06 UT 21:40:50.923 during CRAFT observations at 864.5 MHz. The burst had an optimal S/N of 19.2 at a DM of 577.8(2) pc cm-3 in the low time resolution search data stream. Voltages spanning 3.1 s around the FRB were downloaded, cross-correlated and imaged offline to obtain a preliminary position of the burst. The astrometric registration was performed by comparing background sources in the 3.1 s ASKAP image with their NRAO VLA Sky Survey (NVSS) radio source catalog (Condon et al., 1998) counterparts. We cross-matched seven sources and computed a weighted mean systematic image frame offset using the method described in Day et al. (2021). We found positional offsets of and in RA and Dec., respectively. The final burst position after correcting for the astrometric shifts in the image frame is RA(J2000): 03h33m59.08s () and Dec(J2000): 14d (), where statistical and systematic uncertainties in RA and Dec are quoted respectively.
3.2.1 Follow-up observations
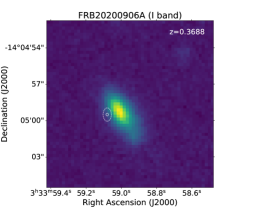
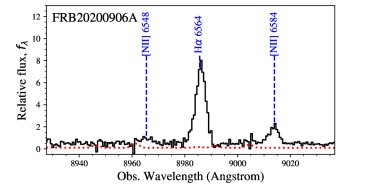
A candidate host galaxy for FRB20200906A was identified in the DES, Pan-STARRS and AllWISE database as DES J033358.99140459.2, PSO J033358.994140459.287 and J033358.99140459.1 respectively, with 100% PATH association probability (see Fig. 2). On UT 2020 December 20 & 22, we performed follow-up observations using VLT/FORS2 in - and -band following a similar strategy as for FRB20191228A (Sec. 3.1.1) but without the need to mask the lower CCD. On UT 2020 September 17, we also triggered Keck/DEIMOS for spectroscopic observations and found the redshift of the putative host to be . The photometric measurements from Pan-STARRS and those from the VLT were used to model the SED of the host galaxy. The derived properties are presented in Table 1.
We triggered the VLA (project code: VLA/20A-157) on UT 2020 September 22 to observe the host galaxy of FRB20200906A in the frequency range GHz. We found no radio emission from the host galaxy above a flux density of 12 Jy beam-1, implying an upper-limit on the source’s luminosity to be W Hz-1 at 6 GHz.
|
4 Comparing FRB host galaxies to the underlying field galaxy population
In this section, we place the overall population of FRB hosts in context with the field galaxy population, expanding on our earlier work (Bhandari et al., 2020; Heintz et al., 2020).
4.1 Sample selection
We use the data published in Heintz et al. (2020), Mannings et al. (2020) and measurements derived for the hosts in this work. We also update the measurements published for a subset of FRB hosts (see Appendix). For FRB20171020A, FRB20201124A and FRB20200120E, we use the data published in Mahony et al. (2018), Fong et al. (2021) and Bhardwaj et al. (2021) respectively.
We considered only the FRB host galaxies for which the PATH posterior probability is greater than 90% (see last column of Table A2). This includes all 3 of the new FRBs presented here which have posterior probability . The host of FRB20190614D (Law et al., 2020), FRB20181112A (Prochaska et al., 2019) and FRB20190523A (Ravi et al., 2019) have low probabilities of of and respectively and, are therefore excluded. Also, FRB20191001A has two nearby candidate hosts at a common redshift (Bhandari et al., 2020), that yield PATH posterior probabilities and 0.4. We proceeded by adopting the galaxy with smaller angular separation from the FRB as the host which is akin to adopting a stronger prior on the projected offset than adopted by Aggarwal et al. (2021b). Future associations will refine this assumption. We also included the host of FRB20200120E (Bhardwaj et al., 2021; Kirsten et al., 2021) and the candidate host for FRB20171020A, because of their low probability of chance association (North-Hickey et al. in prep). Thus, we obtained a sample of 16 confident host associations for our analysis, of which 10 are hosts of apparently non-repeating FRBs and six host repeating FRBs (see Table A3).
The spectroscopy and photometry of all FRB hosts are analyzed with the pPXF (Cappellari, 2017) and CIGALE (Noll et al., 2009) software packages by fitting a set of stellar population models and star formation history to the spectra and spectral energy distribution (SED) respectively (See Heintz et al. (2020) for details). The star-formation rates (SFR) are derived from the dust-corrected H line flux measurements (Kennicutt, 1998), adopting an initial mass function (IMF) from Chabrier (2003).
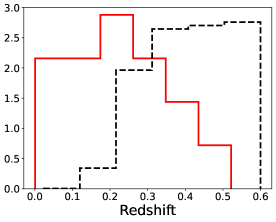
We used the PRism MUlti-object Survey (PRIMUS) data as an underlying sample of field galaxies (Moustakas et al., 2013). We restricted the redshift range to be to match the redshifts of the FRB hosts (see Fig. 4). We used K-correct synthesized restframe SDSS absolute magnitude of galaxies and stellar masses/SFRs of galaxies. We note that the PRIMUS sample lack good stellar mass and SFR measurements of field galaxies for . All stellar masses and SFRs assume a universal (Chabrier, 2003) IMF and are derived using SED-modeling code iSEDfit, designed to extract the physical properties of galaxies (Moustakas et al., 2013).
4.2 Comparison with underlying population
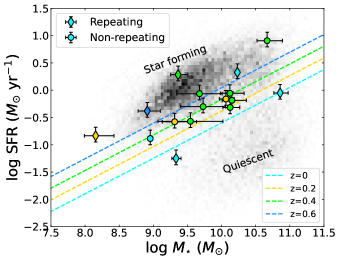
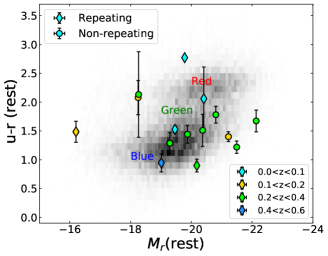
Figure 5 shows our comparison of the colormagnitude and SFRM∗ distributions of the FRB host galaxies with those of the general population of galaxies at redshift . The left panel of Fig. 5 presents the current SFR as a function of M∗. The hosts of repeating and one-off bursts are distinguished by symbol shape and the color represents the four redshift bins. We also present the redshift evolution of the boundary separating the star-forming and quiescent galaxies (Moustakas et al., 2013). Most of the FRB hosts lie in or around the star-forming cloud of galaxies, but are offset from the star-forming main sequence for galaxies with similar stellar masses. We caution here that since a significant fraction of the FRB hosts show LINER-like emission (see Sec. 4.4), the derived SFR should in these cases only be considered as upper limits since the total line emission may not reflect solely that of star formation. This would further offset the FRB hosts from the star-forming main-sequence.
The right panel of Fig. 5 shows a color magnitude diagram and provides information about the overall stellar populations in these galaxies. The late-type galaxies with ongoing star formation and therefore, young stellar populations lie in the ‘blue cloud’, i.e., blue galaxies (Strateva et al., 2001), while massive early-type galaxies live in the ‘red and dead’ zone characterized by very low star formation and hence older stellar populations, i.e., red galaxies. The host galaxies of the FRBs appear to lie on the luminous side of the absolute magnitude distribution, mainly near the ‘blue cloud’ and ‘green valley’ region, where galaxies are expected to be transitioning between star-forming and quiescent systems (Martin et al., 2007). We observe a dearth of red galaxies in our current sample of FRB host galaxies.
4.3 Do FRB hosts track stellar mass and star formation rates?
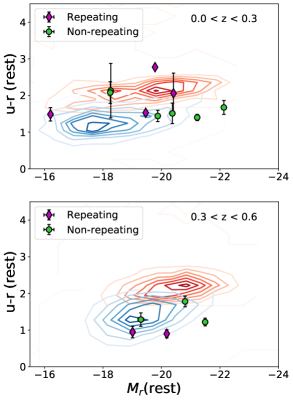
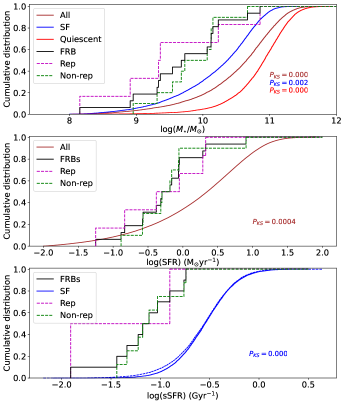
In Fig. 6 we again present the color-magnitude diagram, but with the background PRIMUS galaxy sample weighted by their stellar masses and divided into redshift bins of and . This is a good approximation of where most stars are in the local Universe. We show that the majority of FRB hosts do not trace massive red galaxies and also do not seem to align with the color-magnitude diagram space of the peak of stellar mass-weighted blue galaxies which tend to redder color, particularly for the low-redshift bin. To quantify this trend, we examined the null hypothesis that FRB hosts (both repeating and non-repeating population) track stellar mass. The galaxy stellar mass function (GSMF) of low- galaxies, , was weighted by stellar mass and compared to the observed FRB host mass distribution. We used the double Schechter function to model GSMF for all, star-forming and passive galaxies in the redshift range in the COSMOS field (Davidzon et al., 2017). Our KS tests comparing the cumulative mass distributions of all FRB hosts, together and separately for the two FRB populations, with the mass-weighted stellar mass distribution of field galaxies yield a p-value (see Table. 2). Therefore, we reject the null hypothesis that FRB hosts directly track stellar mass with more than 95% confidence, consistent with the findings of Heintz et al. (2020). We note that the redshift range of FRB hosts is broader than the range used for the stellar mass-weighted mass function. We replicated the above analysis using a subset of FRBs in the range to investigate if the differences in the redshift had an effect on our conclusions. We obtained identical results, indicating that the effect of redshift evolution is not substantial.
Furthermore, we tested the null hypothesis that FRB hosts track star formation rates. We used the star formation rate distribution function derived from the UV and IR luminosity Schechter functions for the local Universe using GALEX data (Bothwell et al., 2011). We then computed the star formation rate volume density distribution function, which is given by , where is the star formation rate in M⊙ yr-1. The p-values for the KS test performed between the cumulative star formation rate volume density distribution function and the star formation rates of FRB hosts (both repeating and non-repeating population) in our sample are presented in Table. 2. We find the p-values for all and non-repeating subset to be . [Considering the SFRs as upper limits due to possible LINER emission contamination (see Sect 4.4) would make the discrepancy even more significant]. However, when comparing with the repeating host population, we find a p-value slightly higher than our significance level. As a result, while we reject the null hypothesis with greater than 95% confidence for all FRB hosts, we are unable to reject it with the same level of confidence for the repeating host population. We note a possible caveat of comparing the SFRs derived using the UV and IR luminosity for the GALEX sample with those derived using H emission-line luminosity for the FRB host sample. Nevertheless, Lee et al. (2009) showed a coarse agreement between the FUV and H SFRs, where the SFRs agree to within about a factor of two for the majority of galaxies with SFR M⊙ yr-1.
Finally, we investigated the specific star formation rates (sSFRs) of FRB hosts in our sample with that of sSFR functions derived from the star-forming sample of galaxies defined by a main sequence using a color–color selection in COSMOS and GOODS survey in the redshift range (Ilbert et al., 2015). The sSFR function can be modelled as a log-normal or a double exponential profile for a given stellar mass bin range (Eq. 2 and 3 of Ilbert et al. (2015)). We computed the function over four mass bins ranging from and combined them together. The weighted cumulative sum of this sSFR function is compared to the cumulative distribution of sSFRs of FRB hosts in the same mass range. The results are presented in Table 2. We observed that FRB hosts do not follow the sSFRs of star-forming galaxies and thus reject the null hypothesis with more than 95% confidence.
Thus, we conclude that FRB hosts have lower M∗, SFR and sSFR than randomly selected field galaxies weighted by M∗, SFR or sSFR.
| FRB Type | Stellar mass | SFR | sSFR | ||
|---|---|---|---|---|---|
| All | SF | Q | All | SF | |
| All | 4e-6 | 0.002 | 4e-11 | 4e-4 | 5e-6 |
| Rep | 0.014 | 0.029 | 6e-4 | 0.056 | 0.037 |
| Non-rep | 7e-5 | 0.005 | 4e-8 | 0.001 | 7e-6 |
4.4 BPT diagram
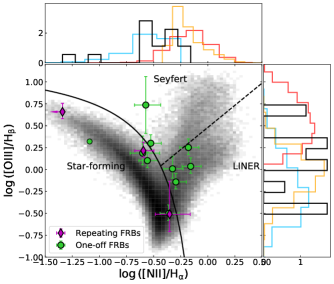
To identify the dominant source of ionization in FRB host galaxies, we plot their nebular emission line ratios namely, [N ii]/H and [O iii]/H in a Baldwin-Phillips-Terlevich (BPT) diagram (Baldwin et al., 1981) in Fig. 8. This diagram can also be used to distinguish between star-forming (SF) galaxies, low-ionization nuclear emission-line region (LINER) galaxies, and Active Galactic Nuclei (AGN) (see Kewley et al. (2001) for more details). For comparison, we show the distribution of nearby emission-line ( significance) galaxies from the Sloan Digital Sky Survey (SDSS) including the standard demarcation lines between SF, AGN, and LINER galaxies (Kauffmann et al., 2003; Cid Fernandes et al., 2010). We performed a 2D KS-test to compare the host population of FRBs with that of underlying SF, AGN and LINER galaxies and found that they are not drawn from a specific class (), which remains consistent with the findings of Heintz et al. (2020). The majority of FRB hosts occupy the star-forming and LINER region of the BPT diagram. We note that all three hosts of repeating FRBs lie in the star-forming region and the host of repeating FRB20121102A remains an outlier as compared to the hosts of other FRBs (Li et al., 2019).
| Transient type | Literature reference |
|---|---|
| ULXs a | Kovlakas et al. (2020) |
| SGRBs | Leibler & Berger (2010); Fong et al. (2010); Fong & Berger (2013); Berger (2014) |
| LGRBs | Blanchard et al. (2016); Taggart & Perley (2021) |
| CCSNe | Schulze et al. (2020) |
| SLSNe | Schulze et al. (2020); Taggart & Perley (2021) |
| Type Ia SNe | Lampeitl et al. (2010); Uddin et al. (2020) |
-
a
Excluding unreliable data, nuclear sources and sources with X-ray luminosities erg s-1.
5 Disentangling the host galaxies of repeating and non-repeating FRBs
The progenitors of FRBs are linked to the specific stellar population and environments of their host galaxies. Based on the larger set of FRBs and their hosts presented here, in combination with previous literature identifications, we leverage this larger sample to further constrain the likely progenitor channels of FRBs. More specifically, we aim to quantify whether the repeating and apparently non-repeating bursts are hosted by distinct galaxy environments. This might provide further clues to whether their progenitor channels are physically distinct.
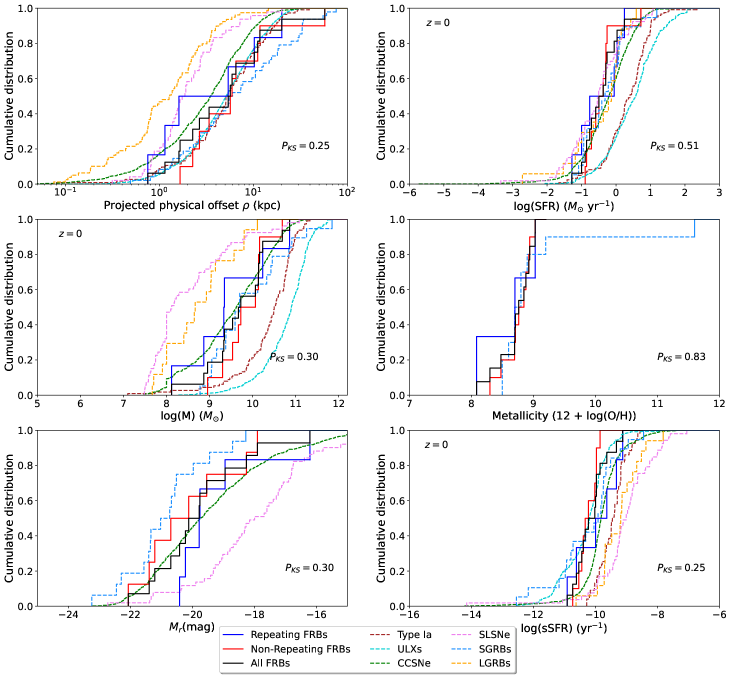
Initially, Heintz et al. (2020) found that FRB hosts seem to show an overall broad, continuous range of physical properties. They noted that the hosts of repeating FRBs generally occupied the faint, low-mass end of the FRB galaxy distribution. Here, we performed a differential analysis of the properties of the larger sample of FRB hosts. In Fig. 9 we compared the projected physical offsets, SFR, stellar mass, metallicities, -band luminosities and specific star formation rates of repeating and non-repeating FRB host population. We found the KS test p-values to be greater than our threshold statistical significance level (). Thus, the null-hypothesis that these distributions are drawn from the same underlying distribution cannot be rejected. The present sample of FRB hosts thus do not indicate strong physical distinctions between the two apparent source populations.
| Property | FRB Type | Transients | |||||
|---|---|---|---|---|---|---|---|
| ULXs | SGRBs | LGRBs | SLSNe | CCSNe | Type Ia | ||
| Offset | Rep | 0.28 | 0.44 | 0.18 | 0.37 | 0.82 | 0.28 |
| Non-rep | 0.97 | 0.57 | 0.00 | 0.02 | 0.25 | 0.99 | |
| All | 0.93 | 0.52 | 0.00 | 0.02 | 0.27 | 0.92 | |
| SFR | Rep | 0.01 | 0.93 | 0.96 | 0.86 | 0.65 | 0.03 |
| Non-rep | 0.00 | 0.26 | 0.07 | 0.18 | 0.04 | 0.00 | |
| All | 0.00 | 0.68 | 0.23 | 0.44 | 0.15 | 0.00 | |
| log(M) | Rep | 0.00 | 0.36 | 0.29 | 0.06 | 0.73 | 0.02 |
| Non-rep | 0.00 | 0.64 | 0.00 | 0.00 | 0.33 | 0.00 | |
| All | 0.00 | 0.59 | 0.00 | 0.00 | 0.50 | 0.00 | |
| Z | Rep | - | 0.91 | - | - | - | - |
| Non-rep | - | 0.99 | - | - | - | - | |
| All | - | 0.84 | - | - | - | - | |
| Mr | Rep | - | 0.01 | - | 0.06 | 0.36 | - |
| Non-rep | - | 0.89 | - | 0.01 | 0.80 | - | |
| All | - | 0.06 | - | 0.00 | 0.73 | - | |
| sSFR | Rep | 0.32 | 0.75 | 0.25 | 0.05 | 0.70 | 0.34 |
| Non-rep | 0.46 | 0.08 | 0.00 | 0.00 | 0.00 | 0.00 | |
| All | 0.42 | 0.39 | 0.00 | 0.00 | 0.01 | 0.00 |
 |
 |
6 Comparison of the FRB host galaxy properties with other transients
6.1 Extragalactic transients
Studies of extragalactic transients often use their physical offsets from the center of their hosts, and locations within their host galaxies, to aid in inferring the nature of their progenitors. In the past, such investigations including other global properties for a small sample of FRB hosts have been conducted (Bhandari et al., 2020; Heintz et al., 2020; Mannings et al., 2020; Li & Zhang, 2020; Safarzadeh et al., 2020; Bochenek et al., 2021). The majority of them suggest that galaxies hosting gamma-ray bursts (SGRBs) and CCSNe are similar to galaxies hosting FRBs. Additionally, the progenitor scenarios of LGRBs and SLSNe have been disfavored for the majority of FRBs. Recently, ultra-luminous X-ray sources (ULX)-like binaries were proposed as a possible progenitor for periodically active FRBs (Sridhar et al., 2021). Motivated by such studies, we performed two sample 1D-KS tests comparing the distributions of various global host properties of the most updated sample of FRBs together and separated into two populations (repeating and non-repeating) with the host galaxy properties of other transients (see Fig. 9). We also included Type Ia supernovae – a proxy for the accretion-induced collapse of white dwarf stars, which have been suggested as possible FRB progenitors (Margalit et al., 2019; Kirsten et al., 2021). Table 3 represents the data from the literature that has been used in this study for all these transients. We used the method described in Bochenek et al. (2020) to correct for redshift evolution by scaling the stellar masses and star-formation rates of host galaxies of FRBs and other transients to be statistically representative of galaxies.
While the distribution of projected physical offsets for ULXs and Type Ia supernovae are statistically consistent with that of FRBs, their host galaxies are often more massive and star-forming, i.e, a mean of log(M∗) = 10.4 M⊙ and 10.8 M⊙, SFR = 6.2 M⊙yr-1 and 11.7 M⊙yr-1 for the hosts of Type Ia SN and ULXs, respectively. A possible caveat is that the ULX sample in the HECATE and the Chandra X-ray catalogue is biased against low-mass galaxies due to various selection effects (Sridhar et al., 2021). However, we observe the specific SFR for ULX hosts to be similar to that of FRB hosts. Also, the majority of properties of the hosts of SGRBs and CCSNe are very similar to FRB hosts suggesting that the host population of FRB progenitors shares the same/similar characteristics to those of these transients. A KS test shows that the SFR distribution of LGRB hosts and SLSNe hosts are consistent with FRB hosts. However, we note that such events are common in dwarf galaxies with high specific SFRs as evident from the left middle and right bottom panel of Fig. 9, which is not consistent with the overall FRB-host population. Interestingly, while the results of our KS-tests allow us to statistically rule out LGRB scenarios for all FRBs combined (), we are unable to reject the hypothesis that the repeating FRB and LGRB hosts are drawn from the same continuous distribution. When comparing with SLSNe hosts, we found the physical offsets of the repeating FRBs (), stellar mass () and -band magnitude () of their hosts to agree with that of SLSNe hosts. The p-values from our KS-tests are presented in Table 4.
6.2 Comparison to the Galactic source population and globular clusters
The prevailing view currently associates FRBs with magnetars, whose extreme magnetic fields provide a reservoir of energy to produce FRBs (Metzger, 2018; Lyutikov & Rafat, 2019). With the detection of an FRB-like burst from SGR1935+2154, the association of some (low-luminosity) FRBs with magnetars has been observationally confirmed (CHIME/FRB Collaboration et al., 2020; Bochenek et al., 2020). Following the analysis of Chrimes et al. (2021), we compared the host-normalized offset distributions of low-mass X-ray binaries (LMXBs), high-mass X-ray binaries (HMXBs), pulsars and magnetars in the Milky Way with the updated FRB host sample — including all repeating and non-repeating FRBs in the left panel of Fig. 10. Based on our KS-test, the offset distribution of only low-mass X-ray binaries in the Milky Way is consistent with that observed for FRBs in their host galaxies (95% confidence).
Recently, a repeating FRB20200120E originally associated with the galaxy M81 (Bhardwaj et al., 2021) has been precisely localized, by the EVN network, to a globular cluster (GC) system [PR95] 30244 in M81 (Kirsten et al., 2021). Motivated by this finding, we compared the host-normalized offset distributions of FRBs in our sample with globular clusters in late-type spirals and early-type elliptical galaxies in the right panel of Fig. 10.
For the GCs in late-type galaxies, we used a sample of 340 high quality GC candidates (of which 74 were confirmed using spectroscopy) associated with M81, identified in HST imaging (Nantais et al., 2010; Nantais & Huchra, 2010). We note that the available data is dominated by a GC disk population with the majority of GCs within 10 kpc from the center of M81. We also used a sample of 390 GCs associated with the galaxy M31 (both disk and halo population) identified in images from the Wide Field Camera (WFCAM) on the United Kingdom Infrared Telescope and from the Sloan Digital Sky Survey (SDSS) (Peacock et al., 2010). For early-type galaxies, we used the available GC data associated with an isolated elliptical galaxy NGC821, extending up to 50 kpc from the center of the galaxy (Spitler et al., 2008). The sample consist of 306 GCs identified in the new imaging from the 3.5-m Wisconsin Indiana Yale NOAO (WIYN) Mini-Mosaic imager, supplemented with the HST WFPC2 images. We also used a sample of 1828 GC candidates (of which 270 are confirmed using spectroscopy from Keck/DEIMOS) associated with the elliptical galaxy NGC4278, identified in HST/ACS and wide-field Subaru/Suprime-Cam imaging (Usher et al., 2013). These selected galaxies have stellar masses and SFRs in the range MM⊙ and SFR = M⊙ yr-1, overlapping with the SFRs and high-mass end distribution of FRB host galaxies (Tamm et al., 2012; Rahmani et al., 2016; Bhardwaj et al., 2021; Forbes et al., 2016; Kokusho et al., 2017).
We compared the host-normalized offset distribution of FRBs in their hosts with that of globular clusters in selected galaxies and found that they are not consistent with being drawn from the same underlying distribution (95% confidence) except for M81 (). This could be due to the fact that M81 globular cluster data is incomplete and dominated by disc population.
A possible caveat in above analysis is that the number of GCs scale with galaxy stellar mass and our FRB host population spans four orders of magnitude in the stellar mass, i.e. MM⊙. We also repeated the KS-test by selecting FRB hosts which had MM⊙ and found similar results, however with lower confidence of 80%. Furthermore, we note that our FRB host sample currently shows a deficiency of elliptical galaxies. A subset of FRBs in our sample were found to originate from or near the spiral arms of their hosts. Whether they are linked to the disk population of GCs is presently unknown and we are limited by the sensitivity of current telescopes. A much larger sample of precisely localized FRBs with high spatial observations of nearby hosts are needed to pursue this further.
7 Summary and future work
We have presented the localization of the sixth repeating FRB20180301A using the Realfast system at the VLA and two apparently non-repeating FRBs (FRB20191228A and FRB20200906A) discovered by ASKAP. With an updated sample of 6 repeating and 10 non-repeating FRB host galaxies, we have conducted a differential analysis of global properties of the FRB host population. While the latest observations of FRBs from the CHIME/FRB project strongly suggest that repeaters and single-burst sources arise from separate mechanisms and astrophysical sources (Pleunis et al., 2021), we did not find significant differences in their host populations. We observed FRB hosts to be moderately star-forming galaxies ( M), with masses offset from the star-forming main-sequence. The majority of FRB hosts lie in the star-forming and LINER region of the BPT diagram. As a low metallicity dwarf galaxy, the host of FRB20121102A continues to be an outlier in the sample. Furthermore, we observe no persistent radio emission co-located with the bursts in our radio follow-up observations of FRBs 20180301A, 20191228A, and 20200906A. We note that the derived upper limits on the luminosity of these sources are lower than the luminosity of the FRB20121102A persistent source ( W/Hz at 1.4 GHz (Ofek, 2017)) indicating that these bursts might originate from less extreme environments.
We find that FRBs in our sample do not track the stellar mass and in general are not hosted in old, red and dead galaxies which have old stellar population. The dearth of FRBs in the massive red galaxies suggest that FRBs are not solely produced in channels with a large average delay between star formation and the FRB source formation such as magnetars formed via compact object-related systems, including neutron star mergers, or the AIC of a white dwarf to a neutron star. Current data supports a mix of prompt (core-collapse SNe) and delayed channels for producing FRB progenitors, suggesting that they are drawn from the general stellar population rather than an exotic and rare sub-population. Furthermore, FRB hosts do not follow the specific SFRs of main-sequence star-forming galaxies, nor do they track the star formation rates of field galaxies in the nearby Universe.
When comparing the properties of FRB host galaxies with that of other transients, we find the host galaxies of ULXs and Type Ia supernovae to be more massive and star-forming than FRBs. The hosts of CCSNe and SGRBs are similar to FRB hosts in terms of their stellar masses, star-formation rates, projected physical offsets, absolute -band magnitudes, and specific SFRs. While from the host galaxy considerations, we could statistically rule out LGRBs and SLSNe as progenitor scenarios for all FRBs combined, we found some similarities between the repeating FRB host population and hosts of LGRBs and SLSNe. These may be attributed to either the small sample size or the effect of the outlier FRB20121102A host galaxy on the overall repeating FRB host population. We also note that one is more likely to find an extreme value under the null hypothesis with more KS-tests.
Driven by the studies and findings of Chrimes et al. (2021) and Kirsten et al. (2021), we compared the physical offsets of FRBs in their hosts with that of Galactic sources such as pulsars, magnetars, X-ray binaries in the Milky Way, and globular clusters in the late- and early-type galaxies. According to our KS test, the Galactic source offset distributions of the neutron star population and high mass X-ray binaries are different, while low-mass X-ray binaries are indistinguishable from the observed FRB offset distribution (95% confidence). We also show that FRBs are positioned in their host galaxies in a way that is mostly not comparable to globular clusters found in late-type spiral and early-type elliptical galaxies.
Lastly, in the future, observations of a much larger sample of nearby FRB hosts will be ideal for progenitor model studies as these will allow the high spatial resolution analysis of FRB environments in their host galaxies.
All of the data and the majority of the software used for the host analysis is available at https://github.com/FRBs/FRB.
.
SB would like to thank Themiya Nanayakkara, Arash Bahramian, and Kristen Dage for useful discussions.
RMS acknowledges support the Australian Research Council Future Fellowship FT190100155. KEH acknowledges support by a Postdoctoral Fellowship Grant (217690–051) from The Icelandic Research Fund. K.A. acknowledges support from NSF grant AAG-1714897. L.M. acknowledges the receipt of an MQ-RES scholarship from Macquarie University. S.B.S acknowledges support from NSF grant AAG-1714897. She is a CIFAR Azrieli Global Scholar in the Gravity and the Extreme Universe program, which helped support J.S. for this project. ATD is the recipient of an Australian Research Council Future Fellowship (FT150100415). W.F. acknowledges support by the National Science Foundation under grant Nos. AST-1814782, AST-1909358 and CAREER grant No. AST-2047919. CJL acknowledges support from the National Science Foundation under Grant No. 2022546. NT acknowledges support by FONDECYT grant 11191217. KJL is supported by CAS XDB23010200, Max-Planck Partner Group, National SKA program of China 2020SKA0120100, NSFC 11690024, CAS Cultivation Project for FAST Scientific. The NANOGrav project receives support from National Science Foundation (NSF) Physics Frontiers Center award number 1430284. Part of this research was carried out at the Jet Propulsion Laboratory, California Institute of Technology, under a contract with the National Aeronautics and Space Administration. Authors S.S., N.T., J.X.P., and K.G.L. as members of the Fast and Fortunate for FRB
Follow-up team, acknowledge support from
NSF grants AST-1911140 and AST-1910471.
The Australian Square Kilometre Array Pathfinder and Australia Telescope Compact Array (ATCA) are part of the Australia Telescope National Facility which is managed by CSIRO.
Operation of ASKAP is funded by the Australian Government with support from the National Collaborative Research Infrastructure Strategy. ASKAP uses the resources of the Pawsey Supercomputing Centre. Establishment of ASKAP, the Murchison Radio-astronomy Observatory and the Pawsey Supercomputing Centre are initiatives of the Australian Government, with support from the Government of Western Australia and the Science and Industry Endowment Fund.
We acknowledge the Wajarri Yamatji as the traditional owners of the Murchison Radio-astronomy Observatory site.
We acknowledge the Gomeroi people as the traditional owners of the Paul Wild (ATCA) Observatory site.
The National Radio Astronomy Observatory is a facility of the National Science Foundation operated under cooperative agreement by Associated Universities, Inc.
Spectra were obtained at the W. M. Keck Observatory, which is operated as a scientific partnership among Caltech, the University of California, and the National Aeronautics and Space Administration (NASA). W. M. Keck Observatory and MMT Observatory access was in part supported by Northwestern University and the Centre for Interdisciplinary Exploration and Research in Astrophysics (CIERA). The Keck Observatory was made possible by the generous financial support of the W. M. Keck Foundation. The authors recognize and acknowledge the very significant cultural role and reverence that the summit of Mauna Kea has always had within the indigenous Hawaiian community. We are most fortunate to have the opportunity to conduct observations from this mountain. Observations reported here were obtained at the MMT Observatory, a joint facility of the University of Arizona and the Smithsonian Institution.
Based on observations collected at the European Southern Observatory under ESO programme 0105.A-0687(A).
Based on observations obtained at the international Gemini Observatory, a program of NSF’s NOIRLab, which is managed by the Association of Universities for Research in Astronomy (AURA) under a cooperative agreement with the National Science Foundation on behalf of the Gemini Observatory partnership: the National Science Foundation (United States), National Research Council (Canada), Agencia Nacional de Investigación y Desarrollo (Chile), Ministerio de Ciencia, Tecnología e Innovación (Argentina), Ministério da Ciência, Tecnologia, Inovações e Comunicações (Brazil), and Korea Astronomy and Space Science Institute (Republic of Korea). The Gemini data were obtained from program GS-2020B-Q-138, and were processed using
the DRAGONS (Data Reduction for Astronomy from Gemini Observatory North and South) package.
References
- Agarwal et al. (2020) Agarwal, D., Aggarwal, K., Burke-Spolaor, S., Lorimer, D. R., & Garver-Daniels, N. 2020, MNRAS, 497, 1661
- Aggarwal et al. (2021a) Aggarwal, K., Agarwal, D., Lewis, E. F., et al. 2021a, arXiv e-prints, arXiv:2107.05658
- Aggarwal et al. (2021b) Aggarwal, K., Budavári, T., Deller, A. T., et al. 2021b, ApJ, 911, 95
- Ai et al. (2021) Ai, S., Gao, H., & Zhang, B. 2021, ApJ, 906, L5
- Baldwin et al. (1981) Baldwin, J. A., Phillips, M. M., & Terlevich, R. 1981, PASP, 93, 5
- Bannister et al. (2019a) Bannister, K., Zackay, B., Qiu, H., James, C., & Shannon, R. 2019a, FREDDA: A fast, real-time engine for de-dispersing amplitudes, , , ascl:1906.003
- Bannister et al. (2019b) Bannister, K. W., Deller, A. T., Phillips, C., et al. 2019b, Science, 365, 565
- Berger (2014) Berger, E. 2014, ARA&A, 52, 43
- Berriman & Good (2017) Berriman, G. B., & Good, J. C. 2017, Publications of the Astronomical Society of the Pacific, 129, 058006. http://dx.doi.org/10.1088/1538-3873/aa5456
- Bertin & Arnouts (1996) Bertin, E., & Arnouts, S. 1996, Astronomy and Astrophysics Supplement Series, 117, 393
- Bhandari & Flynn (2021) Bhandari, S., & Flynn, C. 2021, Universe, 7, doi:10.3390/universe7040085. https://www.mdpi.com/2218-1997/7/4/85
- Bhandari et al. (2020) Bhandari, S., Sadler, E. M., Prochaska, J. X., et al. 2020, ApJ, 895, L37. https://doi.org/10.3847%2F2041-8213%2Fab672e
- Bhandari et al. (2020) Bhandari, S., Bannister, K. W., Lenc, E., et al. 2020, ApJ, 901, L20
- Bhardwaj et al. (2021) Bhardwaj, M., Gaensler, B. M., Kaspi, V. M., et al. 2021, ApJ, 910, L18
- Blanchard et al. (2016) Blanchard, P. K., Berger, E., & Fong, W.-f. 2016, ApJ, 817, 144
- Bochenek et al. (2020) Bochenek, C. D., Ravi, V., Belov, K. V., et al. 2020, Nature, 587, 59
- Bochenek et al. (2021) Bochenek, C. D., Ravi, V., & Dong, D. 2021, ApJ, 907, L31
- Bothwell et al. (2011) Bothwell, M. S., Kennicutt, R. C., Johnson, B. D., et al. 2011, MNRAS, 415, 1815
- Caleb et al. (2019) Caleb, M., Stappers, B. W., Rajwade, K., & Flynn, C. 2019, MNRAS, 484, 5500
- Cappellari (2017) Cappellari, M. 2017, MNRAS, 466, 798
- Chabrier (2003) Chabrier, G. 2003, PASP, 115, 763
- Chatterjee et al. (2017) Chatterjee, S., Law, C. J., Wharton, R. S., et al. 2017, Nature, 541, 58
- CHIME/FRB Collaboration et al. (2020) CHIME/FRB Collaboration, Andersen, B. C., Bandura, K. M., et al. 2020, Nature, 587, 54
- Chittidi et al. (2020) Chittidi, J. S., Simha, S., Mannings, A., et al. 2020, arXiv e-prints, arXiv:2005.13158
- Chrimes et al. (2021) Chrimes, A. A., Levan, A. J., Groot, P. J., Lyman, J. D., & Nelemans, G. 2021, arXiv e-prints, arXiv:2105.04549
- Cid Fernandes et al. (2010) Cid Fernandes, R., Stasińska, G., Schlickmann, M. S., et al. 2010, MNRAS, 403, 1036
- Condon et al. (1998) Condon, J. J., Cotton, W. D., Greisen, E. W., et al. 1998, AJ, 115, 1693
- Davidzon et al. (2017) Davidzon, I., Ilbert, O., Laigle, C., et al. 2017, A&A, 605, A70
- Day et al. (2021) Day, C. K., Deller, A. T., James, C. W., et al. 2021, arXiv e-prints, arXiv:2107.07068
- Day et al. (2020) Day, C. K., Deller, A. T., Shannon, R. M., et al. 2020, MNRAS, staa2138. https://doi.org/10.1093/mnras/staa2138
- Fong & Berger (2013) Fong, W., & Berger, E. 2013, ApJ, 776, 18
- Fong et al. (2010) Fong, W., Berger, E., & Fox, D. B. 2010, ApJ, 708, 9
- Fong et al. (2021) Fong, W.-f., Dong, Y., Leja, J., et al. 2021, arXiv e-prints, arXiv:2106.11993
- Fonseca et al. (2020) Fonseca, E., Andersen, B. C., Bhardwaj, M., et al. 2020, ApJ, 891, L6
- Forbes et al. (2016) Forbes, D. A., Sinpetru, L., Savorgnan, G., et al. 2016, Monthly Notices of the Royal Astronomical Society, 464, 4611. https://doi.org/10.1093/mnras/stw2604
- Freudling et al. (2013) Freudling, W., Romaniello, M., Bramich, D. M., et al. 2013, Astronomy & Astrophysics, 559, 96
- Gaia Collaboration et al. (2018) Gaia Collaboration, Brown, A. G. A., Vallenari, A., et al. 2018, A&A, 616, A1
- Gordon (2018) Gordon, D. 2018, in AGU Fall Meeting Abstracts, Vol. 2018, G42A–01
- Gordon et al. (2020) Gordon, Y. A., Boyce, M. M., O’Dea, C. P., et al. 2020, Research Notes of the American Astronomical Society, 4, 175
- Heintz et al. (2020) Heintz, K. E., Prochaska, J. X., Simha, S., et al. 2020, ApJ, 903, 152
- Ilbert et al. (2015) Ilbert, O., Arnouts, S., Le Floc’h, E., et al. 2015, A&A, 579, A2
- Jacob et al. (2010) Jacob, J. C., Katz, D. S., Berriman, G. B., et al. 2010, Montage: An Astronomical Image Mosaicking Toolkit, ,
- James (2019) James, C. W. 2019, MNRAS, 486, 5934
- Jones et al. (2001) Jones, E., Oliphant, T., & Peterson, P. 2001
- Kauffmann et al. (2003) Kauffmann, G., Heckman, T. M., Tremonti, C., et al. 2003, MNRAS, 346, 1055
- Kennicutt (1998) Kennicutt, Robert C., J. 1998, ARA&A, 36, 189
- Kewley et al. (2001) Kewley, L. J., Dopita, M. A., Sutherland, R. S., Heisler, C. A., & Trevena, J. 2001, ApJ, 556, 121
- Kirsten et al. (2021) Kirsten, F., Marcote, B., Nimmo, K., et al. 2021, arXiv e-prints, arXiv:2105.11445
- Kokusho et al. (2017) Kokusho, T., Kaneda, H., Bureau, M., et al. 2017, A&A, 605, A74
- Kovlakas et al. (2020) Kovlakas, K., Zezas, A., Andrews, J. J., et al. 2020, MNRAS, 498, 4790
- Lacy et al. (2020) Lacy, M., Baum, S. A., Chandler, C. J., et al. 2020, PASP, 132, 035001
- Lampeitl et al. (2010) Lampeitl, H., Smith, M., Nichol, R. C., et al. 2010, ApJ, 722, 566
- Law et al. (2018) Law, C. J., Bower, G. C., Burke-Spolaor, S., et al. 2018, ApJS, 236, 8
- Law et al. (2020) Law, C. J., Butler, B. J., Prochaska, J. X., et al. 2020, ApJ, 899, 161
- Lee et al. (2009) Lee, J. C., Gil de Paz, A., Tremonti, C., et al. 2009, ApJ, 706, 599
- Leibler & Berger (2010) Leibler, C. N., & Berger, E. 2010, ApJ, 725, 1202
- Li & Zhang (2020) Li, Y., & Zhang, B. 2020, ApJ, 899, L6
- Li et al. (2019) Li, Y., Zhang, B., Nagamine, K., & Shi, J. 2019, ApJ, 884, L26
- Lindegren et al. (2018) Lindegren, L., Hernández, J., Bombrun, A., et al. 2018, A&A, 616, A2
- Luo et al. (2020) Luo, R., Wang, B. J., Men, Y. P., et al. 2020, Nature, 586, 693
- Lyutikov & Rafat (2019) Lyutikov, M., & Rafat, M. 2019, arXiv e-prints, arXiv:1901.03260
- Macquart et al. (2010) Macquart, J.-P., Bailes, M., Bhat, N. D. R., et al. 2010, PASA, 27, 272
- Macquart et al. (2020) Macquart, J. P., Prochaska, J. X., McQuinn, M., et al. 2020, Nature, 581, 391
- Mahony et al. (2018) Mahony, E. K., Ekers, R. D., Macquart, J.-P., et al. 2018, ApJ, 867, L10
- Mannings et al. (2020) Mannings, A. G., Fong, W.-f., Simha, S., et al. 2020, arXiv e-prints, arXiv:2012.11617
- Marcote et al. (2020) Marcote, B., Nimmo, K., Hessels, J. W. T., et al. 2020, Nature, 577, 190
- Margalit et al. (2019) Margalit, B., Berger, E., & Metzger, B. D. 2019, ApJ, 886, 110
- Margalit & Metzger (2018) Margalit, B., & Metzger, B. D. 2018, ApJ, 868, L4
- Martin et al. (2007) Martin, D. C., Wyder, T. K., Schiminovich, D., et al. 2007, ApJS, 173, 342
- McMullin et al. (2007) McMullin, J. P., Waters, B., Schiebel, D., Young, W., & Golap, K. 2007, in Astronomical Society of the Pacific Conference Series, Vol. 376, Astronomical Data Analysis Software and Systems XVI, ed. R. A. Shaw, F. Hill, & D. J. Bell, 127
- Metzger (2018) Metzger, B. D. 2018, Nature Astronomy, 2, 192
- Michilli et al. (2018) Michilli, D., Seymour, A., Hessels, J. W. T., et al. 2018, Nature, 553, 182
- Moustakas et al. (2013) Moustakas, J., Coil, A. L., Aird, J., et al. 2013, ApJ, 767, 50
- Nantais & Huchra (2010) Nantais, J. B., & Huchra, J. P. 2010, AJ, 139, 2620
- Nantais et al. (2010) Nantais, J. B., Huchra, J. P., McLeod, B., Strader, J., & Brodie, J. P. 2010, AJ, 139, 1413
- Noll et al. (2009) Noll, S., Burgarella, D., Giovannoli, E., et al. 2009, A&A, 507, 1793
- Ofek (2017) Ofek, E. O. 2017, ApJ, 846, 44
- Palaniswamy et al. (2018) Palaniswamy, D., Li, Y., & Zhang, B. 2018, ApJ, 854, L12
- Peacock et al. (2010) Peacock, M. B., Maccarone, T. J., Knigge, C., et al. 2010, MNRAS, 402, 803. https://doi.org/10.1111/j.1365-2966.2009.15952.x
- Pellegrini et al. (2007) Pellegrini, S., Siemiginowska, A., Fabbiano, G., et al. 2007, ApJ, 667, 749
- Pleunis et al. (2021) Pleunis, Z., Good, D. C., Kaspi, V. M., et al. 2021, arXiv e-prints, arXiv:2106.04356
- Price et al. (2019) Price, D. C., Foster, G., Geyer, M., et al. 2019, MNRAS, 486, 3636
- Prochaska et al. (2019) Prochaska, J. X., Macquart, J.-P., McQuinn, M., et al. 2019, Science, doi:10.1126/science.aay0073
- Rahmani et al. (2016) Rahmani, S., Lianou, S., & Barmby, P. 2016, Monthly Notices of the Royal Astronomical Society, 456, 4128. https://doi.org/10.1093/mnras/stv2951
- Ravi (2019) Ravi, V. 2019, Nature Astronomy, 3, 928
- Ravi et al. (2019) Ravi, V., Catha, M., D’Addario, L., et al. 2019, Nature, 572, 352
- Ravi et al. (2021) Ravi, V., Law, C. J., Li, D., et al. 2021, arXiv e-prints, arXiv:2106.09710
- Robitaille et al. (2013) Robitaille, T. P., Tollerud, E. J., Greenfield, P., et al. 2013, Astronomy & Astrophysics, 558, 9. https://www.aanda.org/articles/aa/abs/2013/10/aa22068-13/aa22068-13.html
- Safarzadeh et al. (2020) Safarzadeh, M., Prochaska, J. X., Heintz, K. E., & Fong, W.-f. 2020, ApJ, 905, L30
- Savorgnan & Graham (2016) Savorgnan, G. A. D., & Graham, A. W. 2016, ApJS, 222, 10
- Schulze et al. (2020) Schulze, S., Yaron, O., Sollerman, J., et al. 2020, arXiv e-prints, arXiv:2008.05988
- Spitler et al. (2008) Spitler, L. R., Forbes, D. A., Strader, J., Brodie, J. P., & Gallagher, Jay S., I. 2008, MNRAS, 385, 361. https://doi.org/10.1111/j.1365-2966.2007.12823.x
- Spreeuw et al. (2018) Spreeuw, H., Swinbank, J., Molenaar, G., et al. 2018, PySE: Python Source Extractor for radio astronomical images, , , ascl:1805.026
- Sridhar et al. (2021) Sridhar, N., Metzger, B. D., Beniamini, P., et al. 2021, arXiv e-prints, arXiv:2102.06138
- Strateva et al. (2001) Strateva, I., Ivezić, Ž., Knapp, G. R., et al. 2001, ApJ, 122, 1861
- Taggart & Perley (2021) Taggart, K., & Perley, D. A. 2021, MNRAS, 503, 3931
- Tamm et al. (2012) Tamm, A., Tempel, E., Tenjes, P., Tihhonova, O., & Tuvikene, T. 2012, A&A, 546, A4
- Tendulkar et al. (2016) Tendulkar, S. P., Kaspi, V. M., & Patel, C. 2016, ApJ, 827, 59
- Tendulkar et al. (2021) Tendulkar, S. P., Gil de Paz, A., Kirichenko, A. Y., et al. 2021, ApJ, 908, L12
- The CHIME/FRB Collaboration et al. (2021) The CHIME/FRB Collaboration, :, Amiri, M., et al. 2021, arXiv e-prints, arXiv:2106.04352
- Uddin et al. (2020) Uddin, S. A., Burns, C. R., Phillips, M. M., et al. 2020, ApJ, 901, 143
- Usher et al. (2013) Usher, C., Forbes, D. A., Spitler, L. R., et al. 2013, MNRAS, 436, 1172. https://doi.org/10.1093/mnras/stt1637
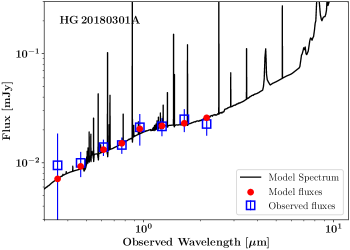
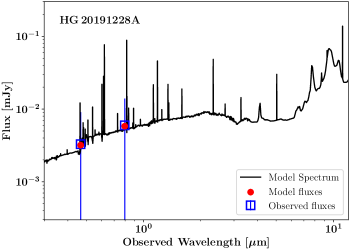
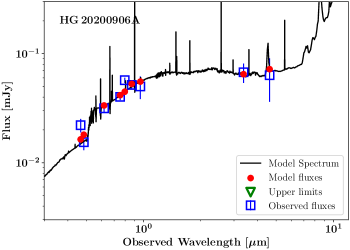
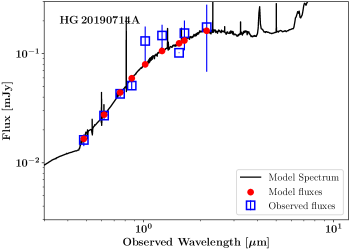
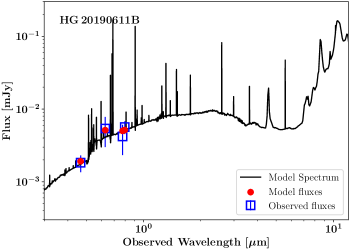
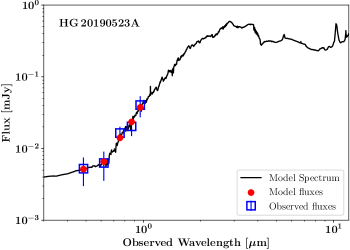
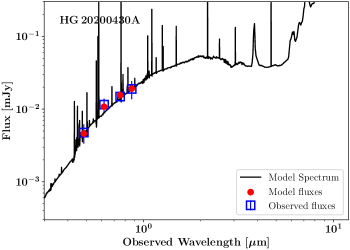
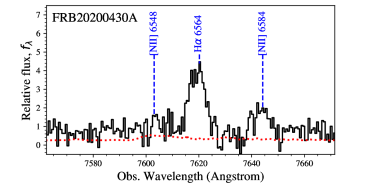
The spectrum of the new FRB hosts in this paper and newly obtained data for FRB20200430A are shown in Fig. A1. Table A1 lists the nebular line measurements of FRB hosts that are used in the BPT diagram. We have also updated the previously reported Pan-STARRS photometric measurements (PSFMag) for hosts of FRB20190523A, FRB20190714A, and FRB20200430A to Kron Mag and re-did the SED fitting in CIGALE using the method described in Heintz et al. (2020). Furthermore, we obtained new VLT/FORS2 measurements for the host of FRB20190611B. The best fitting models for these hosts and new FRBs introduced in this work are presented in Fig. A2 and the updated derived measurements are shown in Table A3. The new and updated photometry is presented in Table A4.
|
|
| FRB | [N ii] | [O iii] | ||
|---|---|---|---|---|
| FRB20121102A | ||||
| FRB20180301A | ||||
| FRB20180916B | - | |||
| FRB20180924B | ||||
| FRB20190102C | ||||
| FRB20190608B | ||||
| FRB20190611B | ||||
| FRB20190711A | - | - | - | |
| FRB20190714A | ||||
| FRB20191001A | ||||
| FRB20191228A | ||||
| FRB20200430A | ||||
| FRB20200906A | ||||
| FRB20201124A | 56.9 | 12.3 | 25.3 | 3.8 |
| FRB | RAcand | Deccand | Filter | ||||||
|---|---|---|---|---|---|---|---|---|---|
| FRB20121102A | 82.9945 | 0.2 | 0.28 | 23.52 | GMOS_N_i | 0.0039 | 0.0245 | 1.0000 | |
| FRB20180916A | 29.5012 | 7.7 | 3.03 | 16.16 | GMOS_N_r | 0.0005 | 0.8200 | 1.0000 | |
| FRB20180924B | 326.1054 | 0.8 | 1.31 | 21.32 | VLT_FORS2_g | 0.0119 | 0.8723 | 0.9894 | |
| FRB20181112A | 327.3486 | 0.4 | 0.67 | 21.49 | VLT_FORS2_I | 0.0622 | 0.0784 | 0.6678 | |
| FRB20190102C | 322.4149 | 0.5 | 0.86 | 20.73 | VLT_FORS2_I | 0.0056 | 0.8425 | 1.0000 | |
| FRB20190523A | 207.0642 | 3.4 | 0.71 | 22.13 | LRIS_R | 0.1158 | 0.1974 | 0.8154 | |
| FRB20190608B | 334.0203 | 2.5 | 1.66 | 17.60 | VLT_FORS2_I | 0.0005 | 0.9930 | 1.0000 | |
| FRB20190611B | 320.7429 | 2.0 | 0.50 | 22.35 | GMOS_S_i | 0.0407 | 0.3322 | 0.9741 | |
| FRB20190614D | 65.0743 | 1.3 | 0.41 | 24.01 | LRIS_I | 0.0552 | 0.1944 | 0.5825 | |
| FRB20190711A | 329.4194 | 0.5 | 0.46 | 22.93 | GMOS_S_i | 0.0172 | 0.4782 | 0.9937 | |
| FRB20190714A | 183.9795 | 1.2 | 0.95 | 19.48 | VLT_FORS2_I | 0.0014 | 0.7993 | 1.0000 | |
| FRB20191001A | 323.3525 | 4.2 | 1.36 | 17.82 | VLT_FORS2_I | 0.0010 | 0.5075 | 0.5980 | |
| FRB20200430A | 229.7064 | 0.4 | 0.72 | 21.18 | LRIS_I | 0.0047 | 0.9379 | 1.0000 | |
| FRB20191228A | 344.4307 | 2.1 | 0.49 | 21.92 | VLT_FORS2_I | 0.0251 | 0.5596 | 1.0000 | |
| FRB20200906A | 53.4958 | 1.6 | 1.51 | 20.70 | VLT_FORS2_g | 0.0106 | 0.8997 | 1.0000 | |
| FRB20180301A | 93.2269 | 2.3 | 0.92 | 22.07 | GMOS_S_r | 0.0387 | 0.7154 | 0.9993 |
| S.No | FRB | z | Rep | Offset | ReffaaIsophotal effective half-light radius are used for a sample of FRB host published in Mannings et al. (2020). For remaining hosts, effective radius derived from GALFIT are used. | Mass | SFR | log(sSFR) | |||
|---|---|---|---|---|---|---|---|---|---|---|---|
| (kpc) | (kpc) | (10) | ( yr-1) | (yr-1) | |||||||
| 1 | FRB20121102A | 0.1927 | y | 8.99 | 8.08 | ||||||
| 2 | FRB20180301A | 0.3304 | y | 9.08 | 8.70 | ||||||
| 3 | FRB20180916B | 0.0337 | y | 10.58 | - | ||||||
| 4 | FRB20180924B | 0.3212 | n | 10.18 | 8.93 | ||||||
| 5 | FRB20190102C | 0.2912 | n | 9.74 | 8.70 | ||||||
| 6 | FRB20190608B | 0.1178 | n | 10.22 | 8.85 | ||||||
| 7 | FRB20190611B | 0.3778 | n | 10.11 | 8.71 | ||||||
| 8 | FRB20190711A | 0.5220 | y | 9.29 | - | ||||||
| 9 | FRB20190714A | 0.2365 | n | 10.34 | 9.03 | ||||||
| 10 | FRB20191001A | 0.2340 | n | 9.76 | 8.94 | ||||||
| 11 | FRB20191228A | 0.2432 | n | 10.03 | 8.48 | ||||||
| 12 | FRB20200430A | 0.1608 | n | 9.89 | 8.88 | ||||||
| 13 | FRB20200906A | 0.3688 | n | 10.44 | 8.76 | ||||||
| 14 | FRB20171020A**Host properties are taken from Mahony et al. (2018); Bhardwaj et al. (2021); Fong et al. (2021). The observed magnitudes for FRB20171020A, FRB20200120E and FRB20201124A are approximated as rest-frame magnitudes because of their low redshifts. | 0.0087 | n | - | - | 0.09 | 0.13 | 9.84 | 17.9 | - | 8.30 |
| 15 | FRB20200120E**Host properties are taken from Mahony et al. (2018); Bhardwaj et al. (2021); Fong et al. (2021). The observed magnitudes for FRB20171020A, FRB20200120E and FRB20201124A are approximated as rest-frame magnitudes because of their low redshifts. | 0.0008 | y | 3.5 | 10.91 | 19.78 | - | ||||
| 16 | FRB20201124A**Host properties are taken from Mahony et al. (2018); Bhardwaj et al. (2021); Fong et al. (2021). The observed magnitudes for FRB20171020A, FRB20200120E and FRB20201124A are approximated as rest-frame magnitudes because of their low redshifts. | 0.0980 | y | - | 9.90 | 9.03 | |||||
| – | FRB20190523A | 0.6600 | n | 12.74 | - |
| Filter | FRB20180301A | FRB20191228A | FRB20200906A | FRB20190523A | FRB20190611B | FRB20190714A | FRB20200430A |
|---|---|---|---|---|---|---|---|
| NOTu | - | - | - | - | - | - | |
| NOTg | - | - | - | - | - | - | |
| NOTr | - | - | - | - | - | - | |
| NOTi | - | - | - | - | - | - | |
| NOTz | - | - | - | - | - | - | |
| Pan-STARRSg | - | - | - | ||||
| Pan-STARRSr | - | - | - | ||||
| Pan-STARRSi | - | - | - | ||||
| Pan-STARRSz | - | - | - | ||||
| Pan-STARRSy | - | - | - | - | |||
| VLT/FORS2g | - | - | Heintz et al. (2020) | - | |||
| VLT/FORS2I | - | - | Heintz et al. (2020) | - | |||
| MMT/MMRSJ | - | - | - | - | - | - | |
| MMT/MMRSH | - | - | - | - | - | - | |
| MMT/MMRSK | - | - | - | - | - | - | |
| WISEW1 | - | - | - | - | - | - | |
| WISEW2 | - | - | - | - | - | - | |
| WISEW3 | - | - | - | - | - | - | |
| WISEW4 | - | - | - | - | - | - |