![[Uncaptioned image]](/html/2108.01158/assets/x2.png)
![]()
|
|
Optimizing Pulsed-Laser Ablation Production of AlCl Molecules for Laser Cooling |
| Taylor N. Lewis,a† Chen Wang,b† John R. Daniel,b Madhav Dhital,b Christopher J. Bardeen,a∗ and Boerge Hemmerlingb∗ | |
|
|
Aluminum monochloride (AlCl) has been proposed as a promising candidate for laser cooling to ultracold temperatures, and recent spectroscopy results support this prediction. It is challenging to produce large numbers of AlCl molecules because it is a highly reactive open-shell molecule and must be generated in situ. Here we show that pulsed-laser ablation of stable, non-toxic mixtures of Al with an alkali or alkaline earth chlorides, denoted XCln, can provide a robust and reliable source of cold AlCl molecules. Both the chemical identity of XCln and the Al:XCln molar ratio are varied, and the yield of AlCl is monitored using absorption spectroscopy in a cryogenic gas. For KCl, the production of Al and K atoms was also monitored. We model the AlCl production in the limits of nonequilibrium recombination dominated by first-encounter events. The non-equilibrium model is in agreement with the data and also reproduces the observed trend with different XCln precursors. We find that AlCl production is limited by the solid-state densities of Al and Cl atoms and the recondensation of Al atoms in the ablation plume. We suggest future directions for optimizing the production of cold AlCl molecules using laser ablation. |
1 Introduction
Laser cooling of atoms 1, 2, 3, 4, 5 has led to significant advances in fundamental physics, including the creation of Bose-Einstein condensates6, 7 and the demonstration of quantum phase transitions8. It also provides the basis for many precision tests of fundamental theories 9, 10 and atomic clocks11. Extending laser cooling techniques to molecules could open up completely new directions of research, such as controlled chemical reactions12, 13, 14, 15, 16, 17, quantum simulation of strongly interacting systems18, 19, searches for physics beyond the Standard Model, and precision tests of fundamental theories20, 21, 22, 23, 24, 25, 26, 27, 28, 29, 30, 31, 32. The large electric dipole moments of polar molecules also makes possible the creation of arrays of entangled molecular qubits that have been proposed as a novel platform for quantum computing 33, 34, 35.
Given these potential applications, tremendous experimental effort has been put into the field in recent years, resulting in successful laser cooling and magneto-optical trapping of several diatomic species such as CaF36, 37, 38, SrF39, and YO40. Computational results and experimental studies suggest there exist other molecules with excellent properties for laser cooling and trapping 41, including BaH 42, CaOH 43, 44, YbF 45, CaOCH3 46, YbOH 47, 22, and SrOH 48, which have been laser cooled. Other proposed diatomics for laser cooling are AlF 49, 50, BaF 51, 52, Cs2 53, MgF 54, RaF 55, TiO 56, TlF 57, and CH 58. AlCl has been predicted to have excellent properties for laser cooling and trapping, including a large Franck-Condon factor of 99.88% and strong cycling.59, 60, 61 High resolution spectroscopy experiments have recently confirmed these theoretical predictions, providing additional motivation to study this molecule 62. One prerequisite for the study of AlCl is to have a general and versatile technique to produce a large number of molecules in the gas phase, especially for experiments that aim to create quantum degenerate molecular gases.
AlCl is an unstable molecule that must be created in situ. The production of gas phase AlCl for spectroscopic measurements has most commonly been accomplished by heating or putting a discharge through AlCl363, 64, 65, 66, 67, 68, 69, 70. High temperature ovens have also been used to react Al vapor with separate sources of Cl atoms, including gases like Cl2 and HCl,69, 71, 72 as well as vaporized solids like MgCl2, AgCl, and AlCl373, 74, 75, 76. These high temperature sources produce translationally hot molecules and generate a heavy thermal load. In molecular laser cooling experiments that operate on a cryogenic buffer-gas cell, typically laser ablation is used to minimize the heat load. This approach was used to generate AlCl for the recent spectroscopy studies 62, but there has been no systematic exploration of different conditions and precursors for optimal AlCl production. In optimizing the production of AlCl by laser ablation, several factors need to be taken into consideration for the solid target, including ease of preparation, safety, and the yield of gas phase AlCl. From previous work on thermal sources, the most obvious choice for a target would be neat AlCl3, but this material presents several practical difficulties. It rapidly decomposes in the presence of water vapor, producing toxic HCl gas and inert Al2O3. The rate of this composition depends on how the AlCl3 is stored, and the details of sample loading (time of air exposure, relative humidity). Although it is straightforward to press AlCl3 into a pellet, we found that these chemically unstable targets provided highly variable AlCl signals from run to run.
In an effort to generate more reproducible results, we explored mixtures of Al with a stable ionic compound source of chloride, denoted XCln, where X is the cation and n is the number of associated Cl anions. The laser ablation process involves several chemical steps, including rapid non-equilibrium heating of the solid target, volatilization of the precursors by breaking Al-Al and X-Cl bonds, diffusion, and finally Al-Cl bond formation. Any one of these steps could act as a bottleneck for AlCl production. In this work, our goal is to gain a better understanding of how this process works in order to optimize AlCl production for future laser cooling experiments. Both the chemical identity of XCln and the Al:XCln molar ratio are varied, and the yield of AlCl is monitored using absorption spectroscopy in a cryogenic buffer-gas beam cell.77 The production of Al and K atoms was also monitored for Al:KCl mixtures.
We develop a simple framework to describe AlCl production in the limit of nonequilibrium reaction dynamics dominated by first-encounter events. With the additional assumption that Al atom production is partially suppressed by recombination under the cryogenic conditions, this model provides a quantitative description of the data and reproduces the observed trend with different XCln precursors. The general conclusion is that using Al:XCln mixtures as ablation targets provides a robust and general strategy for AlCl production. This preliminary investigation of AlCl formation in ablation plumes should help provide a guide for the development of new ablation precursors and their optimization. The ultimate goal is to develop convenient, high efficiency sources of metastable diatomic molecules that are amenable to cooling to nano-Kelvin temperatures.
2 Experimental
2.1 Target Preparation
Aluminum powder and various chloride sources were mixed to make pellets for target analysis. To analyze the molar mixing ratios, 99% BioXtra potassium chloride (KCl, Sigma Aldrich) was mixed with 99.95% aluminum powder m (Sigma Aldrich) in increasing Al:Cl molar ratios from 1:25 to 10:1. A 1:4 molar ratio of Al:Cl was then used for the other chloride sources, crystalline sodium chloride (NaCl, Fisher Scientific), 98% anhydrous magnesium chloride (MgCl2, Sigma Aldrich), and anhydrous calcium chloride (CaCl2, Fisher Scientific). For the AlCl3 sample, pure 98% sublimed, anhydrous aluminum trichloride (Sigma Aldrich) was used. Each of the powder mixtures were put into a 12 mm pellet die between two anvils and pelletized using a hydraulics press with 6000 psi for 1 minute. A thin layer of Stycast 2850FT epoxy was used to glue the sample pellets onto a copper target holder. For the Al:XCln mixtures, the sample was allowed to cure for 24 hours in air, while the AlCl3 samples were wrapped in parafilm and allowed to cure for 4-5 hours. After the epoxy hardened, the target holder was loaded into the copper cell at the heart of the ablation chamber.
2.2 Spectroscopy
The experimental apparatus is illustrated in Figure 1 and details can be found in reference.62 Gas phase AlCl is produced by laser ablation into a cryogenic buffer gas cell. The target is installed into the cell and cooled to 4.2 K using a commercial cryogenic system (PT-420, Cryomech). We flow 4 standard cubic centimeters per minute (sccm) of a purified helium buffer gas into the cell, resulting in a helium density of 1.75. This buffer gas is cooled to K. The precursor target is ablated with 14 mJ of 532 nm pulsed laser light focused to an micron diameter spot, with a repetition rate of 1 Hz. The hot plume from the ablation collides with the buffer gas and is cooled to around 8.5 K by the time it passes the spectroscopy window in the cell. The ablation laser spot is steered with an actuator mirror to average over inhomogeneities in the target surface and to avoid drilling holes into the target.
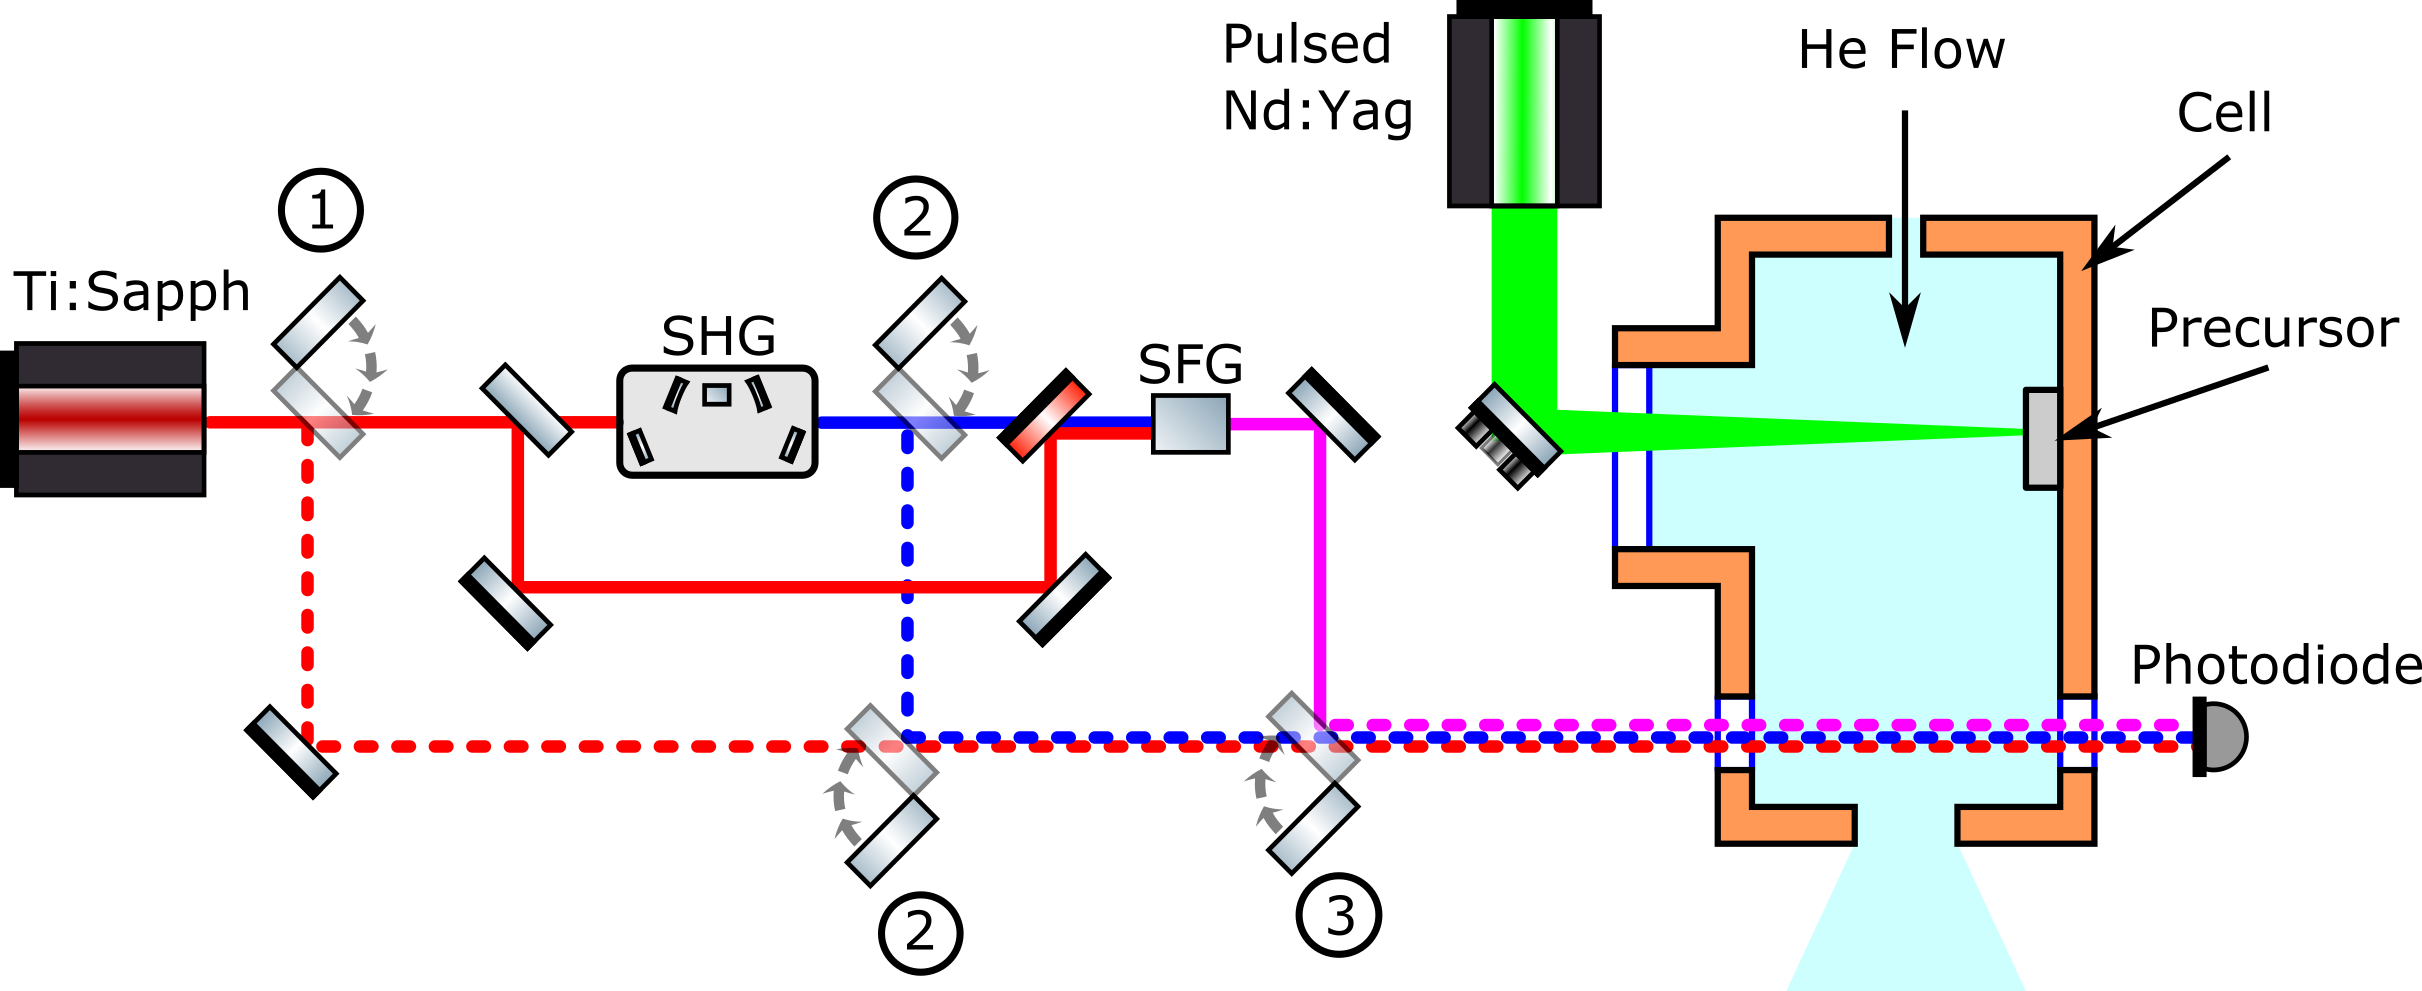
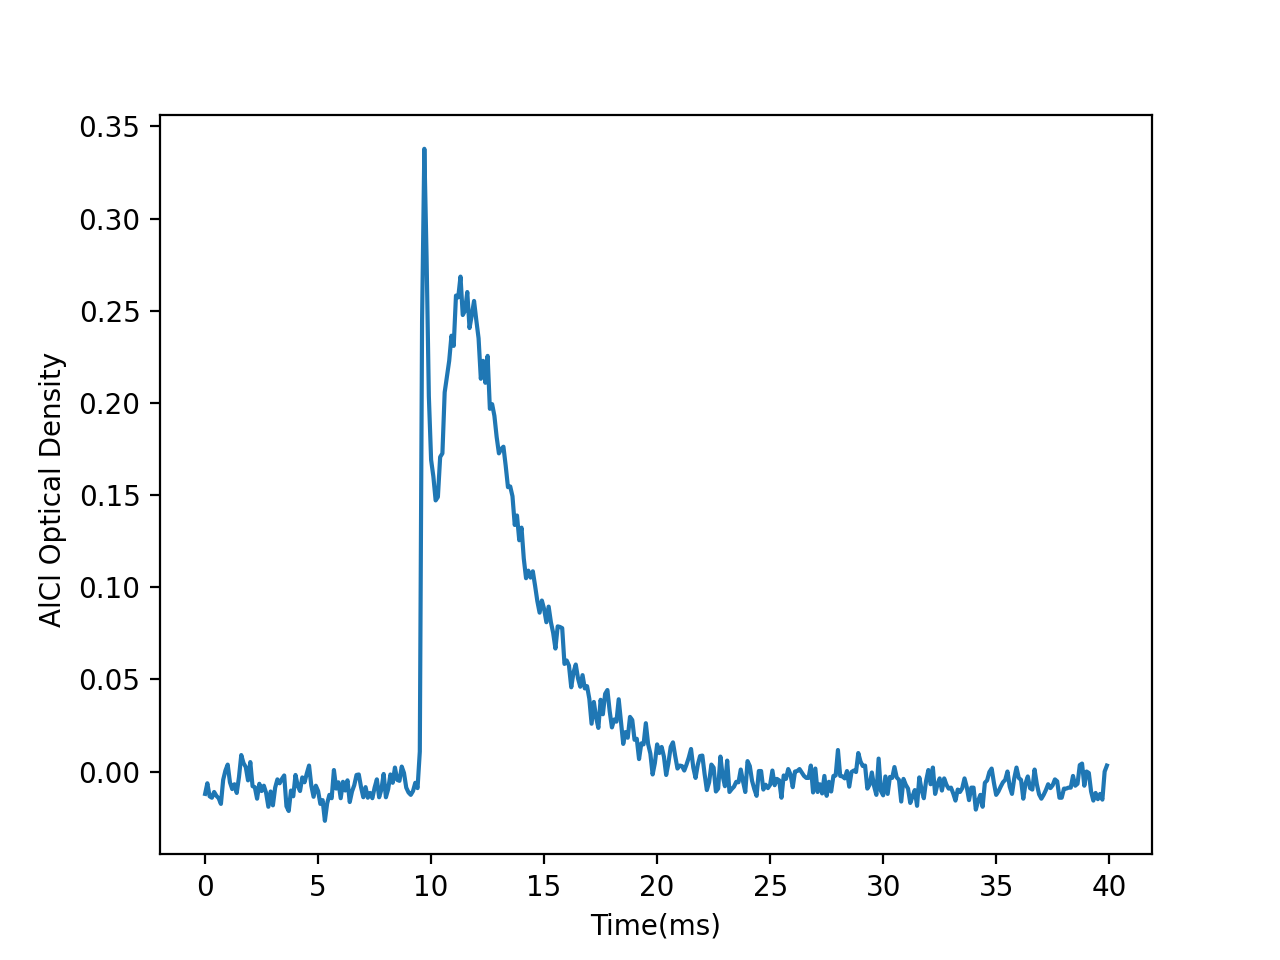
For the absorption measurements of AlCl, we use continuous-wave UV laser light generated via second-harmonic generation (SHG) and sum-frequency generation (SFG) to frequency triple a Ti:Sapphire ring laser at 784 nm. In the present configuration, we produce W of 261.5 nm laser light, which is sufficient for performing in-cell absorption measurements. For this study, we perform absorption spectroscopy on three different species for the targets, starting with AlCl, followed by Al, and then K. For each scan, the laser is tuned to the peak absorption of the corresponding species. For K, we use the direct output of the Ti:Sapph and tune it to the transition at 767 nm ( THz). For Al, we use the SHG of the Ti:Sapph and tune it to the transition at 395 nm ( THz). For AlCl, we tune the third-harmonic generation (THG) of the Ti:Sapph to the X Q branch transition at 261.5 nm ( THz). By rastering the ablation beam over the target, an image of the absorption signal for each target and species is acquired (see Supplemental Information). At each point on the sample, the transmitted signal is measured with an amplified photodiode (Thorlabs PDA25K2), and the optical density where is the transmitted signal without any molecules present, is calculated. In order to generate an absorption value for the time-dependent absorption traces like those shown in Figure 2, the transmission signal is averaged over the time interval from 1-3 ms after the laser pulse. For the signal traces in the following analysis, we average the absorption over at least 50 different laser spots on the target pellet.
3 Results
3.1 Experimental Measurements of AlCl, Al, and K
The ablation target consists of a pressed pellet of powdered Al and XCln precursors. For all cases, a robust, stable pellet was formed that could be cut and glued to the target plate. Several Cl sources were tested in addition to AlCl3, including NaCl, KCl, CaCl2 and MgCl2. These chlorides are non-toxic and relatively stable. MgCl2 and CaCl2 can absorb water to make a hydrate, but this process is very slow when the MgCl2 or CaCl2 is pelletized with Al, with less than a 0.03% mass increase after 24 hours of exposure to ambient air. Of the other low molecular weight chlorides, LiCl is very hygroscopic and visibly changes appearance after less than 1 minute of air exposure, so it was not tested. BeCl2 is toxic and was also omitted. The properties of the alkali and alkaline earth chlorides are summarized in Table 1. The variation in X-Cl ionic bond strengths provides a way to assess whether the initial dissociation of this bond is a limiting factor in AlCl production.
| MW(g/mol) | (g/cm3) | (mol/cm3) | (kJ/mol) | |
|---|---|---|---|---|
| Al | 26.982 | 2.70 | - | - |
| KCl | 74.551 | 1.988 | 0.0267 | 433.0 |
| NaCl | 58.443 | 2.17 | 0.0371 | 412.1 |
| CaCl2 | 110.984 | 2.15 | 0.0387 | 409 (Ca-Cl) |
| MgCl2 | 95.211 | 2.325 | 0.0488 | 312 (Mg-Cl) |
| AlCl3 | 133.34 | 2.48 | 0.0558 | 502 (Al-Cl) |
The apparatus for the production and measurement of the AlCl has been described in detail in a previous paper 62. Briefly, a high-energy 14 mJ, 5 ns at 532 nm laser pulse is focused on the target in a vacuum chamber. The resulting ablation plume is swept through the absorption cell by a 4 K stream of He gas. The absorption at the transition located at 1146 THz (261.5 nm) gives rise to the most intense absorption and is monitored by an ultraviolet probe laser.
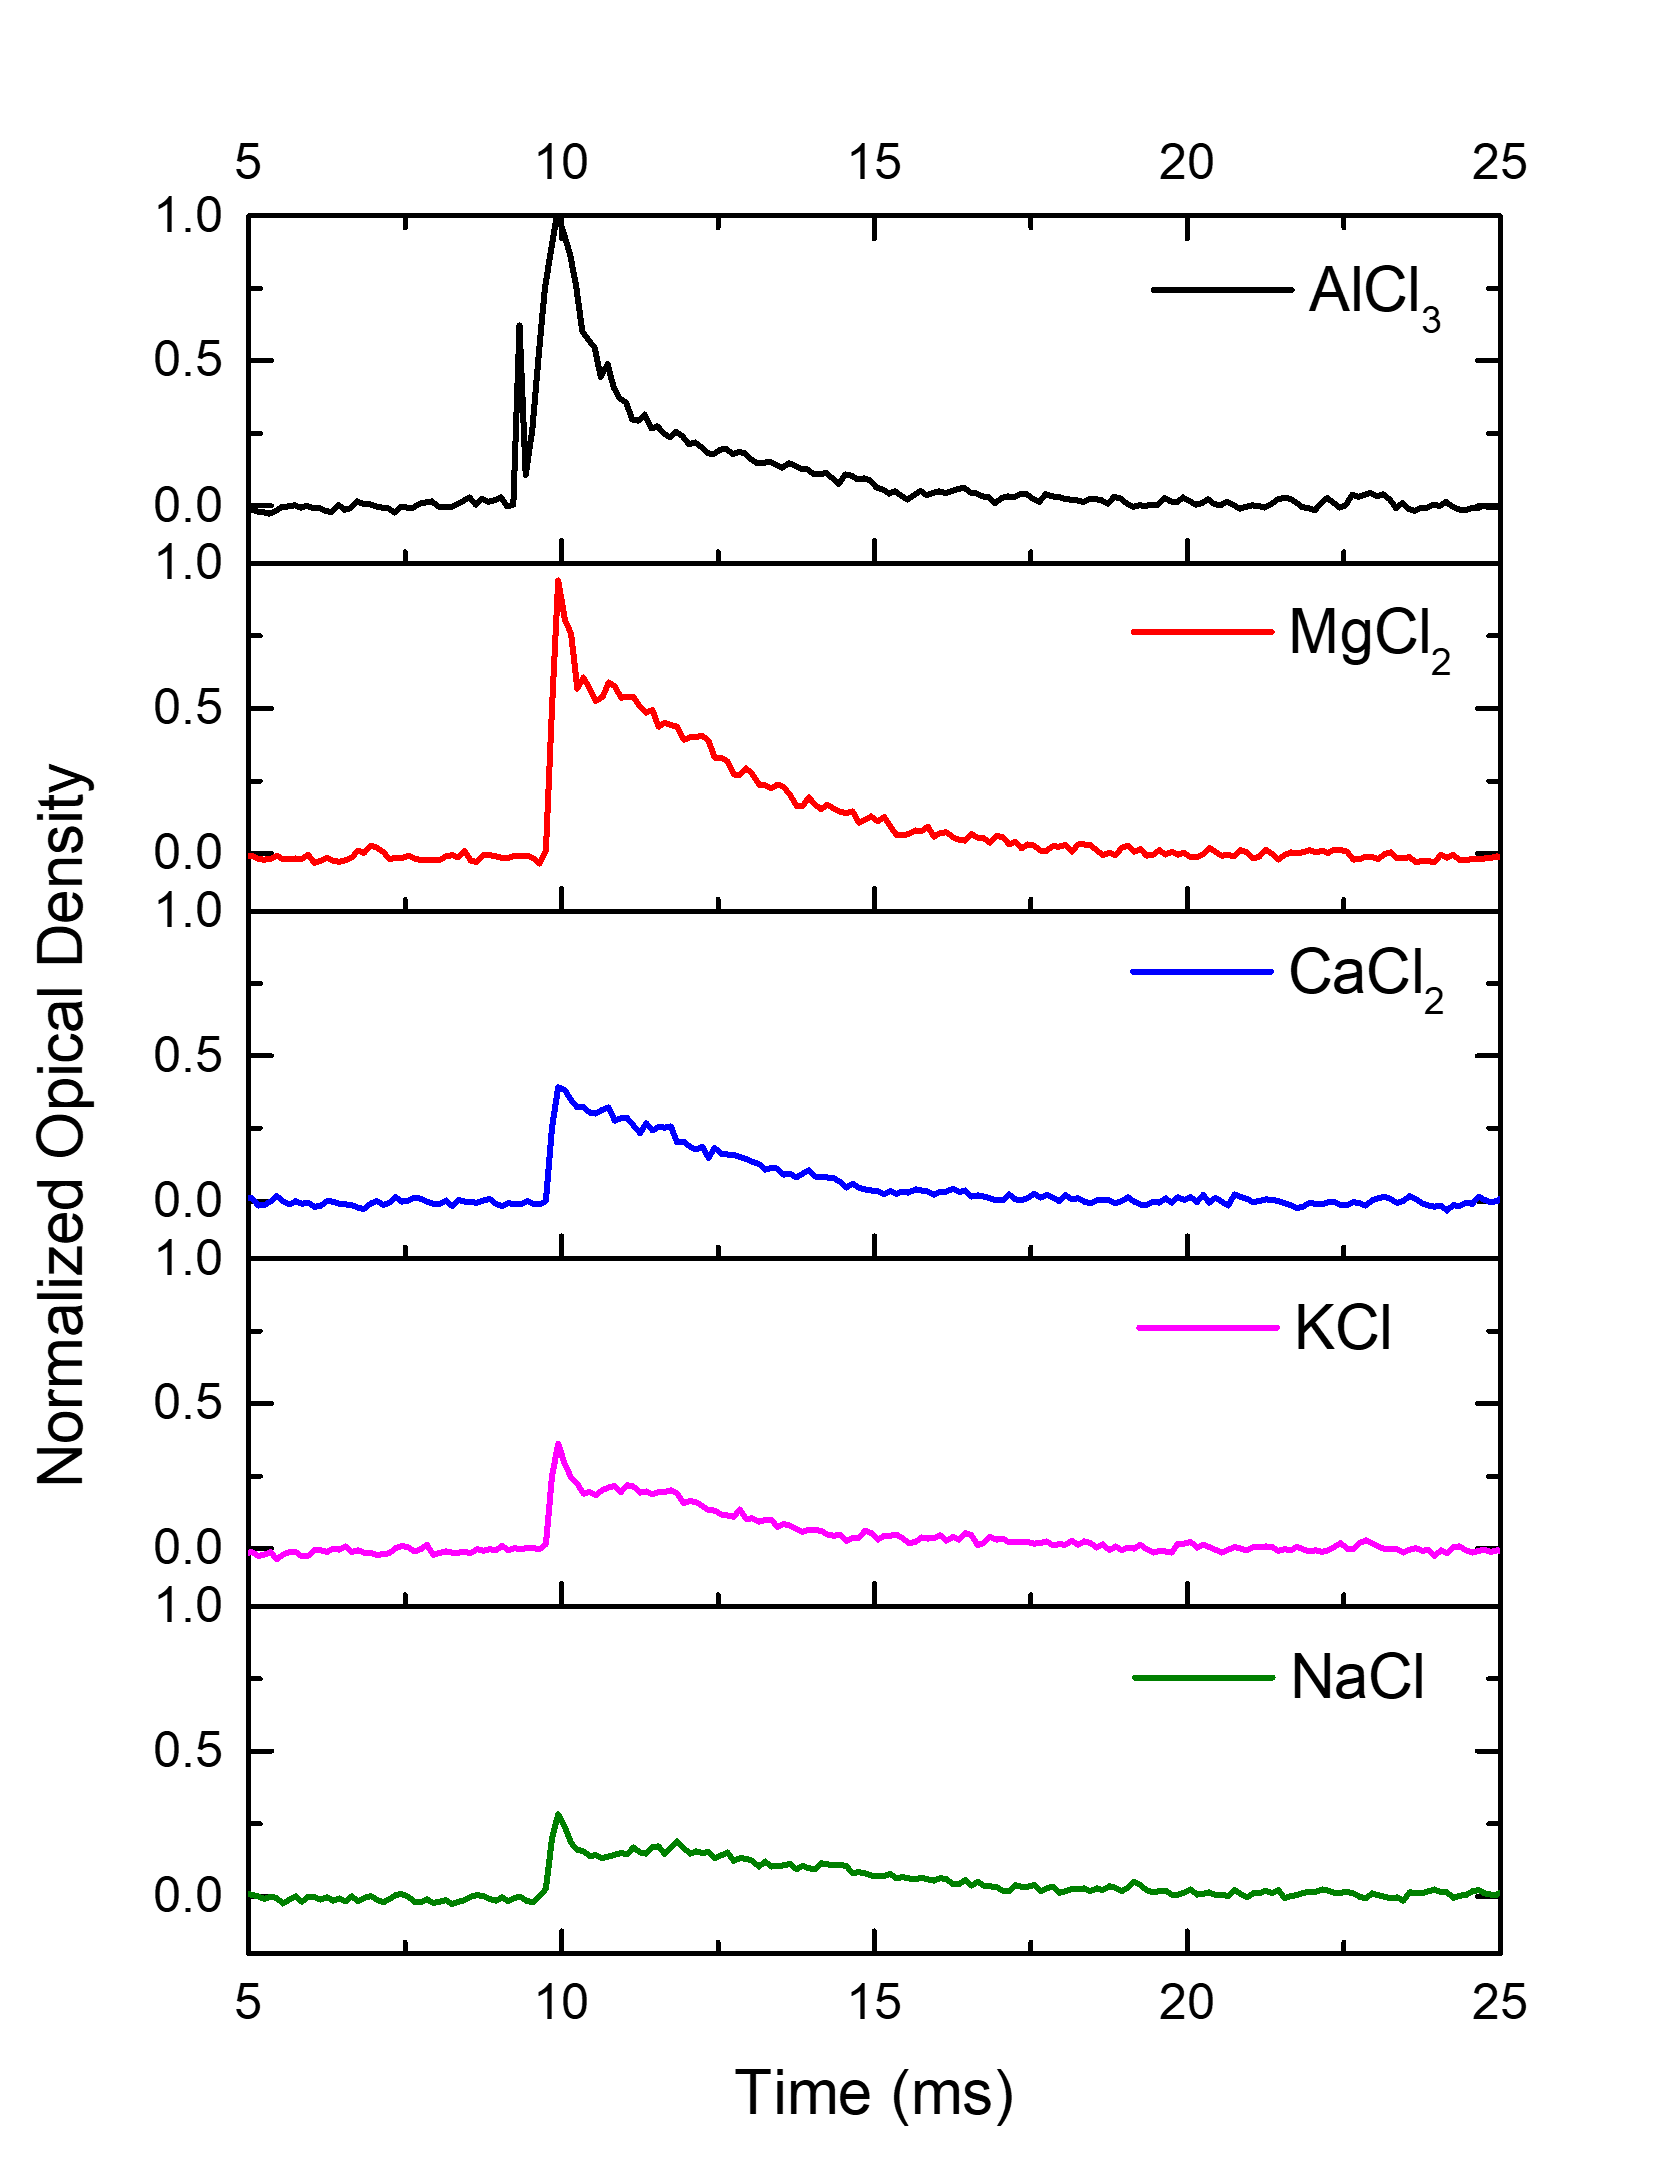
The absorption is time-dependent, as shown in Figure 2, peaking shortly after the ablation laser shot at 10 ms and then decaying away on a timescale of ms. Figure 3 shows images of a Al:KCl target before and after an absorption run. The grey color of the target in Figure 3 can be attributed to the Al powder with its oxide coating. The KCl does not absorb in the visible region and makes a transparent glassy solid when compressed.
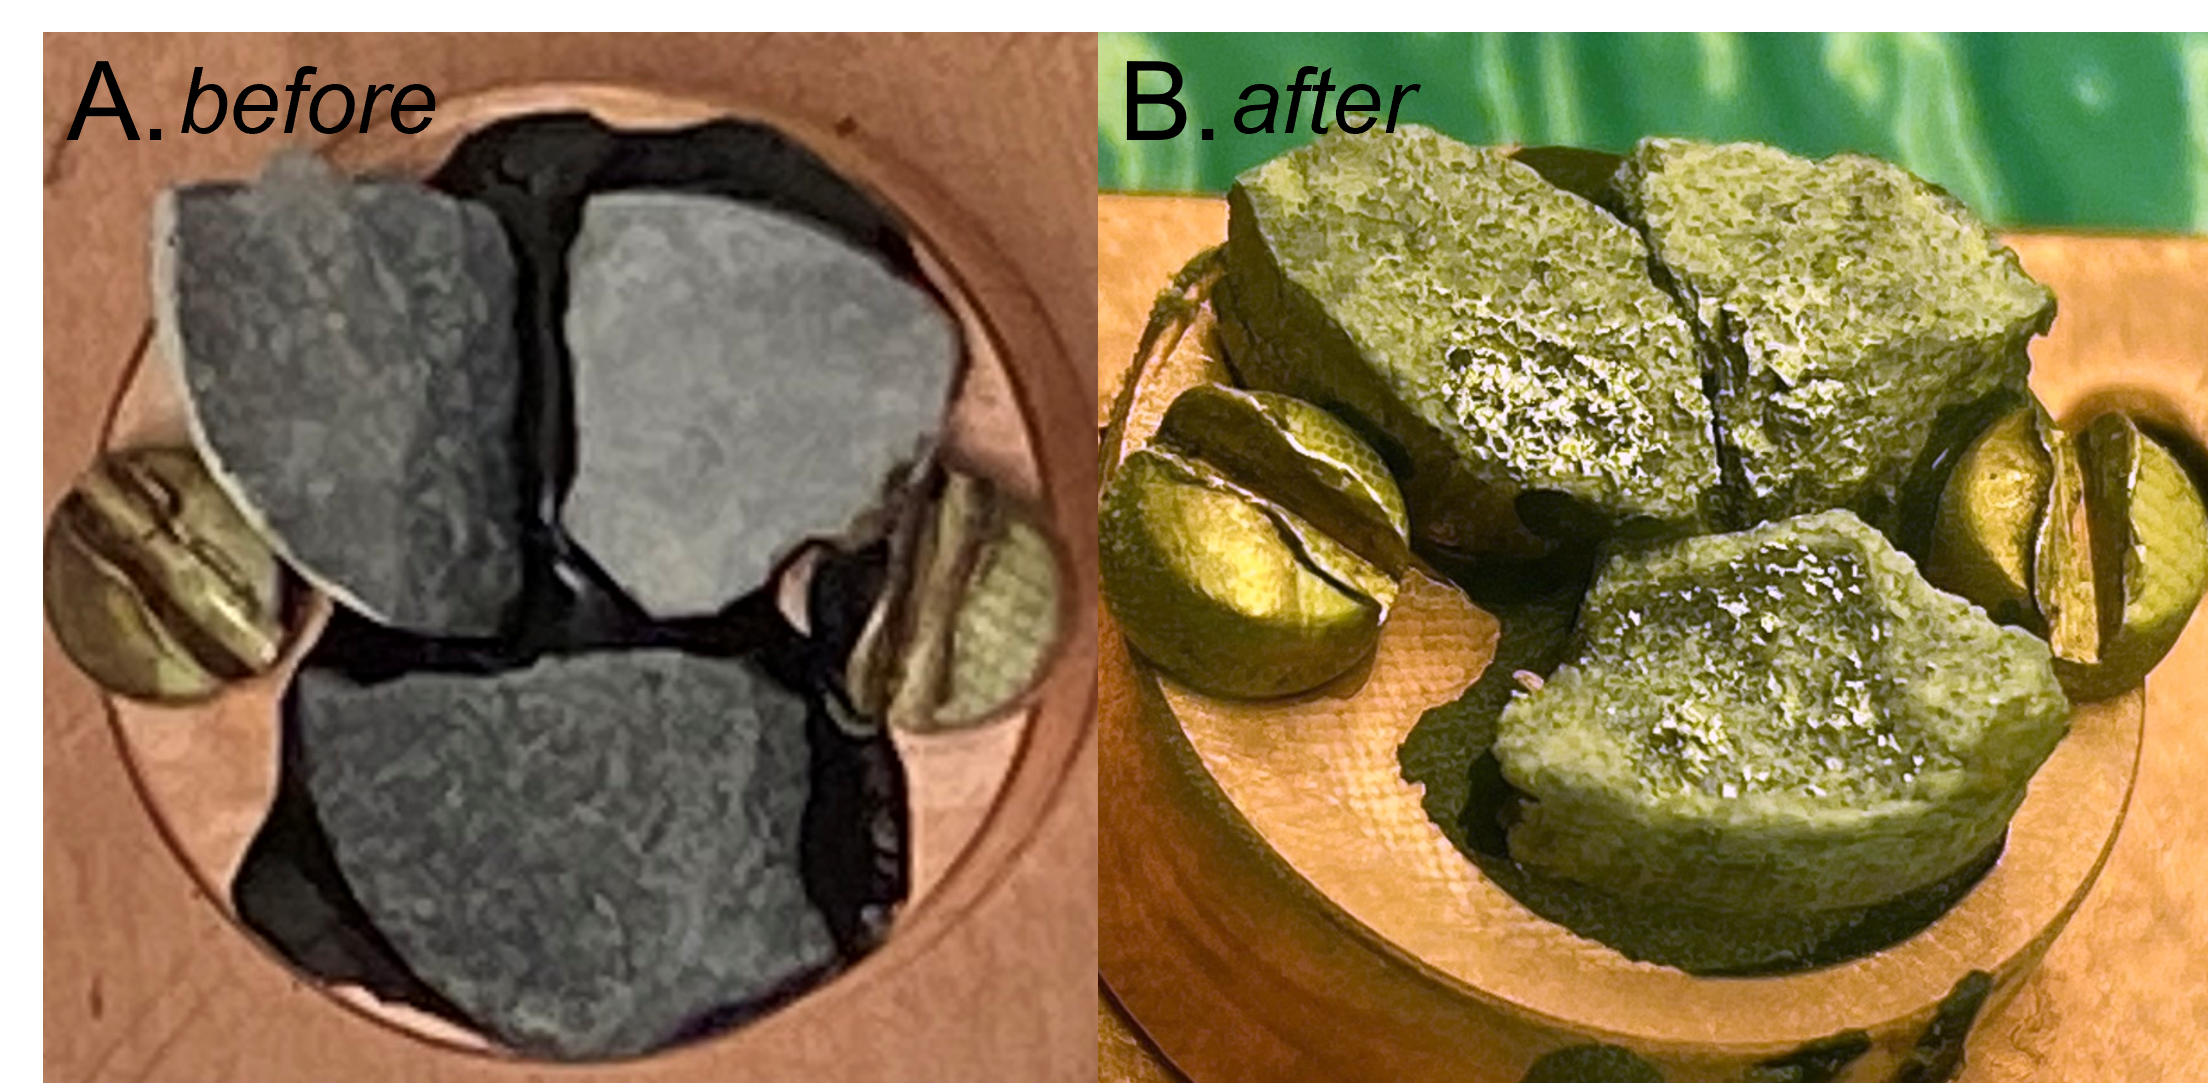
After ablation, the target in Figure 3B shows the expected loss of mass, but this loss is not uniform across the pellet. This corrugated landscape is probably due to local concentration inhomogeneities in the pellet, as well as morphology changes that occur due to fracture during the ablation process. The most notable change is the appearance of a bright, reflective layer of Al metal in the ablated regions. The presence of this coating suggests Al atoms are being efficiently ablated and recondensing onto the target surface as a metallic layer. The effect of ablation on the KCl is less obvious, but it is also ablated as deduced from the large loss of material from the pellet. From Figure 3, one potential concern is that debris from one target could contaminate a neighboring target. However, this contamination would only affect the surface, while the majority of ablated material originates from the interior of the pellet. Extra contributions by K atoms in the absorption signal of neighboring low KCl pellets was not detected, further indicating that cross-contamination is negligible.
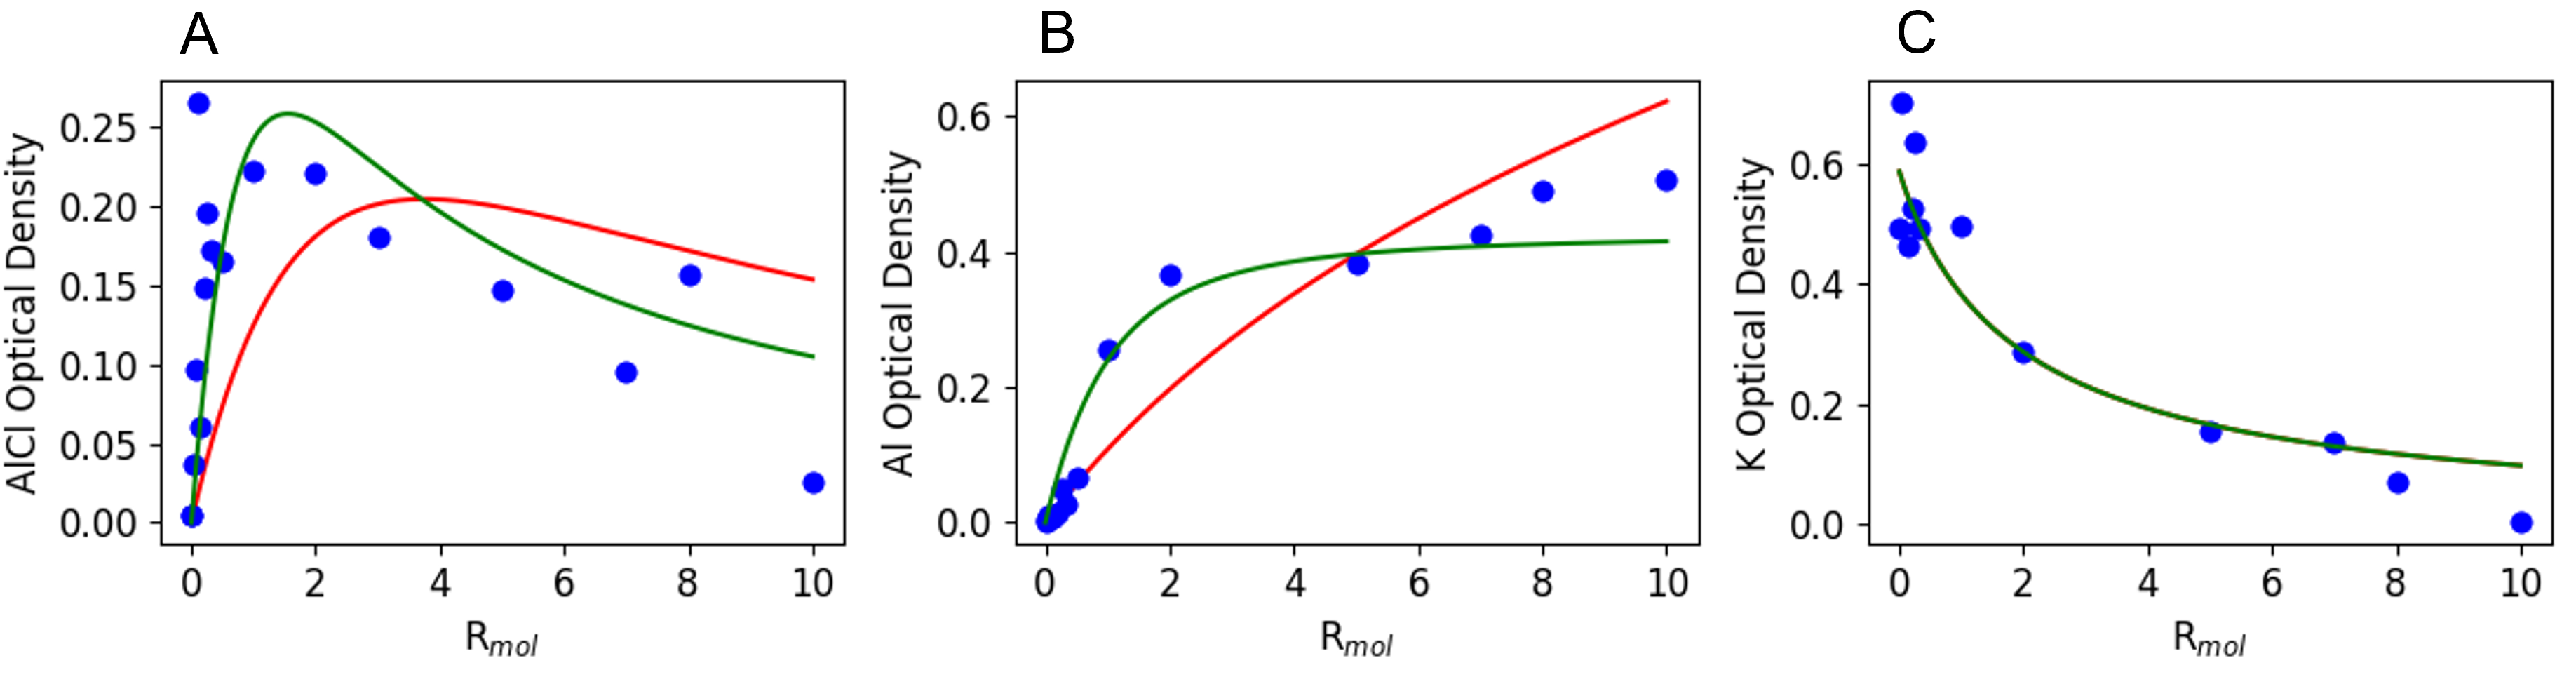
To determine how the AlCl production depends on the composition of the ablation target, the Al:KCl combination was used with varying amounts of KCl and Al powders. The amounts of AlCl, K and Al produced from different mixing ratios were monitored in the absorption chamber. The experimental results are shown in Figure 4 as a function of the Al:Cl molar ratio, . Also shown in Figure 4 are simulated data generated by two chemical models that are described in the next section.
3.2 Modelling AlCl Formation
Given the highly dynamic nature of the ablation process followed by rapid cooling in the He gas, it is doubtful that the system ever reaches chemical equilibrium. The reaction
| (1) |
is thermodynamically favored with kJ/mol79, but at low temperatures the reaction
| (2) |
is even more favored.80, 81, 82 Extrapolating from previous high temperature results81, we can estimate Keq=101000 for reaction (2) at 10 K, which implies that no AlCl should be present at this temperature if the system is at equilibrium. But the disproportionation reaction (2) has an activation barrier and can be suppressed for temperatures below about 150 K, as shown in earlier work on cryogenic solids83. So the rapid cooling of the ablation plume should be able to quench reaction (2) and preserve the thermodynamically unstable AlCl. Given that reaction (1) will be occurring under conditions of rapid cooling, AlCl formation will be determined by first-encounter collisions of Al and Cl atoms early in the process, followed by an extended period during which the excess collision energy present in the AlCl molecule is carried away by collisions with the He atoms. Thus a reasonably high He gas density is expected to be necessary for preserving the newly formed AlCl77, 84.
To model the data, we take as the starting point the assumption that the AlCl concentration [AlCl] is proportional to the product of the initial gas phase concentrations of Al and Cl atoms produced by the ablation pulse, [Al]0 and [Cl]0 respectively,
| (3) |
Note that the form of Equation 3 resembles that expected for a system at equilibrium, where K=Keq, the equilibrium constant. But here Equation 3 is justified by different physical considerations. From a probabilistic standpoint, the collision probability is just proportional to the Al and Cl densities. Alternatively, if we consider the bimolecular kinetic equation,
| (4) |
where lower-case k is the rate constant, for small time intervals we also obtain Equation 3 with . These arguments justify the use of Equation 3 as the starting point for our calculations.
Model A: Free Atom Production
We assume that the ablation laser vaporizes a volume , which puts a limit on the amount of Al and Cl that can be vaporized because
| (5) |
where and are the masses of Al and in the ablation volume V0. The molecular weights of the compounds are and ; , are the solid-state densities of Al and XCln and and are the number of moles of atomic Al, and molecular XCln in V0.
Equation 5 places a constraint on the number of moles of Cl available to bond with a given number of moles of Al. We define the molar ratio of Al:Cl atoms (Rmol) in the solid to be
| (6) |
If we assume that the moles of atoms in the gas phase are directly proportional to the number of moles in the solid, i.e. and where and are the ablation efficiencies and the factor takes into account that we get Cl atoms per molecule of . Equation 3 then becomes
| (7) |
Using Equation 5 and Equation 6, we obtain an expression for [AlCl], and in terms of and V0 with only , , and K as adjustable parameters:
| (8) |
| (9) |
| (10) |
where . Equation 10 gives the full dependence of the AlCl concentration on . We can take the derivative of Equation 10 to find the value that gives the maximum [AlCl],
| (11) |
The maximum [AlCl] is found to be
| (12) |
Equation 11 shows that depends only on the relative molar densities of Al and Cl atoms in the laser focal volume. Equations 8-10 can be independently scaled to obtain agreement with the experimental data. Since the scaling factors may be different, this fitting does not permit the absolute determination of the efficiencies and .
Model A’: Al Recondensation
The observation in Figure 3 that metallic Al is plating out on the target suggests that the concentration of Al atoms above the target may be limited by recombination. The relatively high boiling point of Al (2519∘C)78 versus KCl (1407∘C)85 suggests that the recondensation of Al into its liquid form will occur preferentially. If Al atoms recondense before they can react with the Cl atoms, this will limit the Al concentration in the gas phase. We can take this possibility into account by limiting the amount of Al in the gas phase using the equation
| (13) |
is a free parameter that limits the amount of Al that can react with Cl atoms. Equation 13 assumes that the local density of Al in the solid, , promotes recondensation of the Al from the gas phase. This expression reduces to N in the limit of small or NAl, but predicts that N saturates at a value of as NAl increases. This expression leads to a new equation for the concentration of AlCl
| (14) |
To compare this result to Equation 11, the maximum of Equation 14 can only be determined numerically.
Physically, we expect the maximum of the [AlCl] curve to shift to lower Rmol values, since increasing NAl only limits the available Cl atoms after saturation. This is exactly what is observed in numerical calculations (see Supplemental Information).
3.3 Comparison of Model Results with Data
In Figure 4, we overlay the results of Models A and A’ with the Al:KCl data. The prefactors in Equation 10 and Equation 14 are scaled to match the experimental data. Model A’ does a better job of reproducing the data than Model A, which assumes no aluminum saturation after gas-phase collisions in the ablation plume. Model A predicts a maximum signal for , while Model A’ predicts a maximum [AlCl] at , with . Both Model A and Model A’ predict the same trend in K signal, as shown in Figure 4C; while Model A’ better predicts the trend in aluminum signal due to recondensation of aluminum after ablation, as shown in Figure 4B. Another advantage of Model A’ is that it predicts a sharper drop off in the AlCl concentration for larger values. The prefactor required to match the [AlCl] data in Figure 4A is 2.8 times larger in Model A’ than Model A. This corresponds to roughly three times lower [AlCl] in Model A’ than Model A for a fixed prefactor. Based on this trend, we estimate that the AlCl concentration is reduced by a factor of three due to recondensation of aluminum onto the surface of the target.
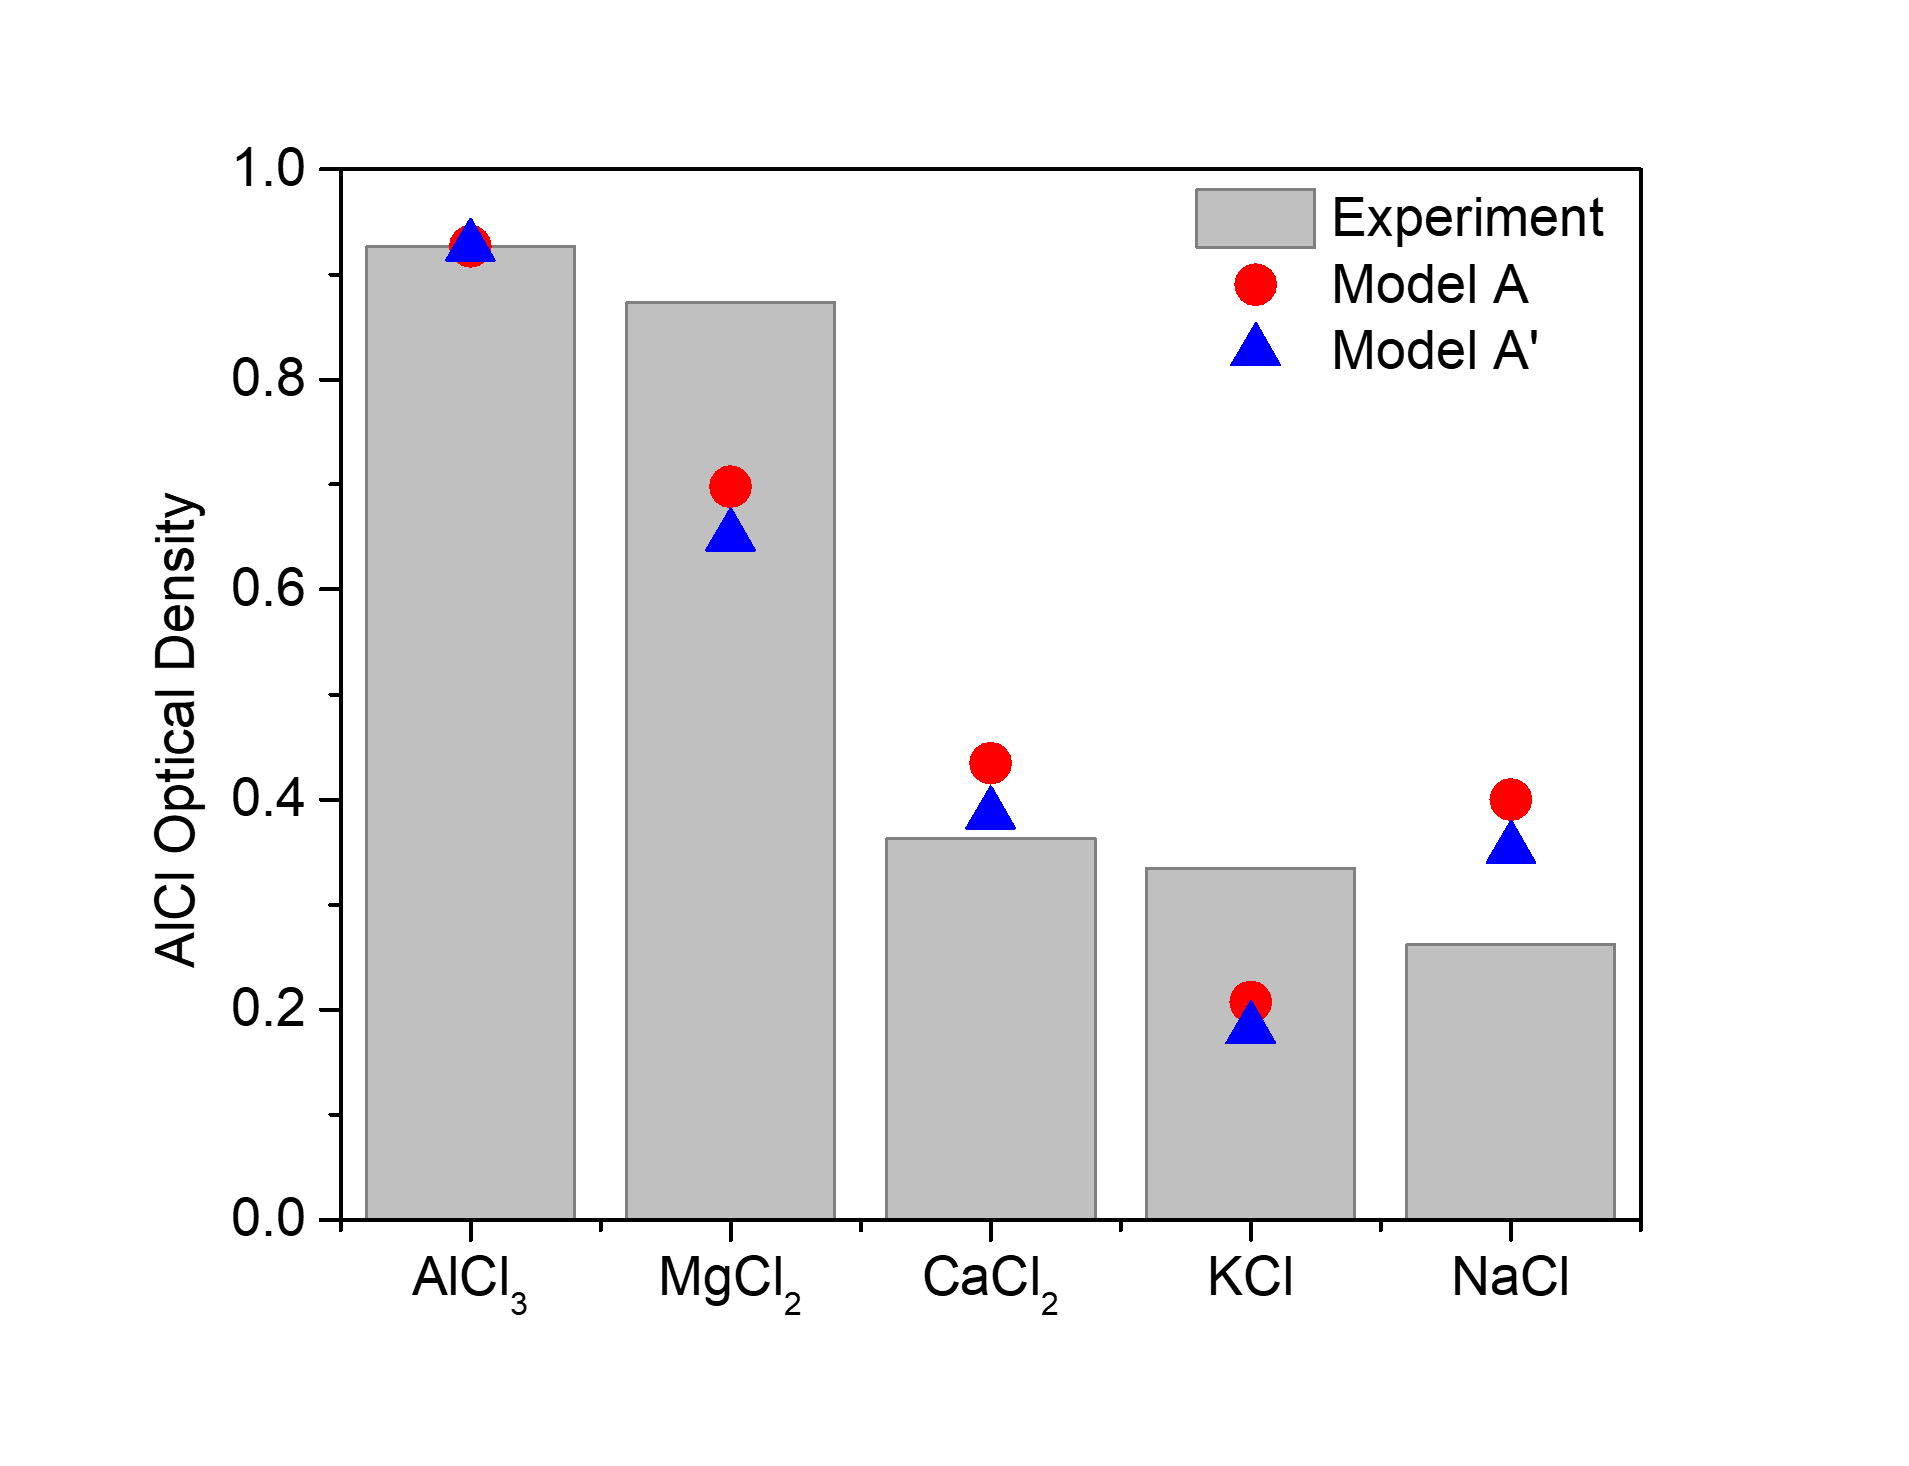
We next turn to the comparative study of different Cl atom sources. Figure 5 compares the raw AlCl signals obtained for pure AlCl3 and mixtures with NaCl, KCl, MgCl2, and CaCl2 with . For this comparison, we used the best signal obtained after testing multiple AlCl3 pellets, some of which produced no signal at all. The Al:XCln mixtures, on the other hand, provided much more reproducible signal levels. We observed only about a factor of two variation in the yield for these very different chemical mixtures. This result was robust with respect to the method used to extract the average absorption from the time-dependent traces in Figure 5 (Supplemental Information). Figure 6 provides a relative comparison of the experimental and calculated signals using models A and A’. The XCln species are ordered from low to high Cl molar density, as given in Table 1. The general trends for all three models are very similar. Both models predict a relatively weak dependence on the identity of X, as observed.
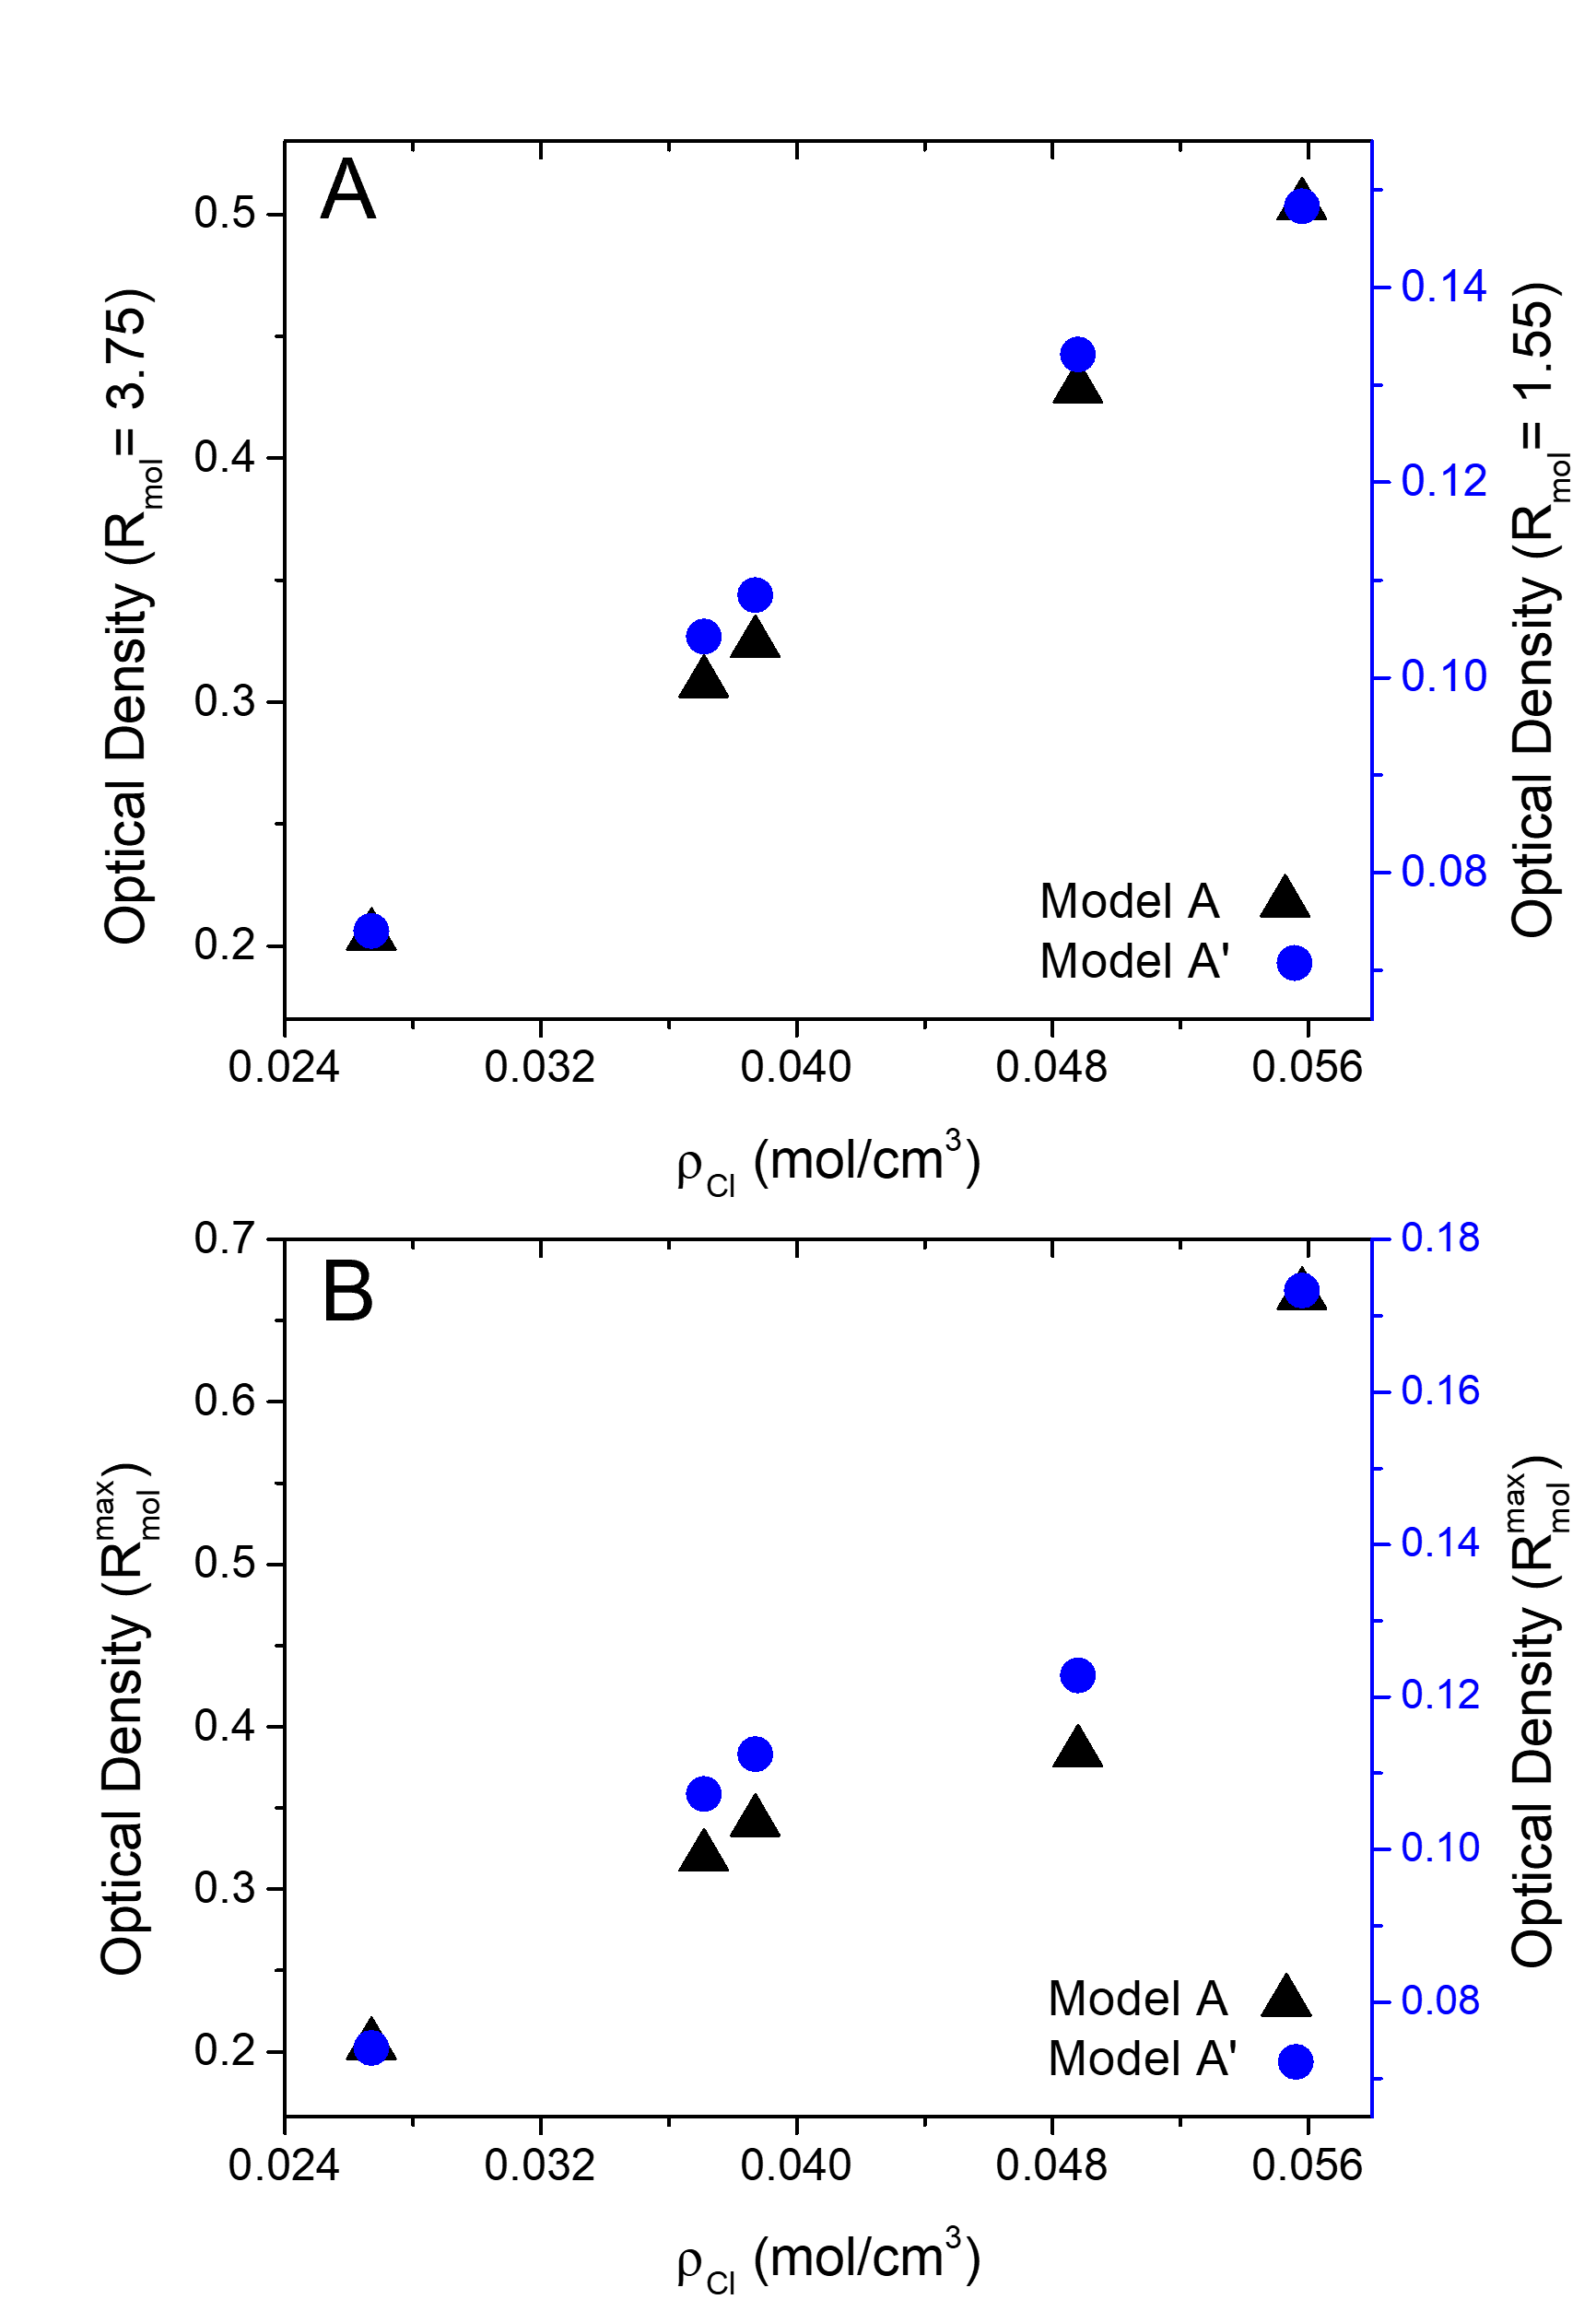
The AlCl yield is not correlated with variations in the X-Cl bond strength (Table 1), suggesting that the details of the chemical bonding in the XCln precursor are not vital. Instead, the critical quantity for AlCl production appears to be the molar density of Cl atoms in the solid, . This can be seen most clearly when the calculated [AlCl] signal is plotted for each XCln precursor at a fixed Rmol value. This plot, shown in Figure 7A for models A and A’, is linear and has the same slope for both models. It should be noted that each XCln source can have a different , so we also evaluated the maximum [AlCl] signal for each individual XCln source. The trend with is the same as in Figure 7A, although not quite as linear as for the fixed plot. In fact, this variation can be predicted from Equation 12 and the deviations from linearity are due to changes in the MW denominator. The most important conclusion is that variations between the different chlorides are almost entirely due to differences in Cl density in the solid.
4 Discussion
Laser ablation of solid targets is an extremely complicated process, involving multiple processes like thermal melting, phase explosion, and ionization.86 The laser fluences used in this experiment are well above the phase explosion87, 88, 89 and plasma thresholds 90 for Al, suggesting that many different chemical species can be generated in the plume above the target. Once the precursors are in the gas phase, modeling the detailed chemistry would require measuring densities, diffusion coefficients, and reaction rate constants for these species, a daunting task. An important result of this paper is that relatively simple models can capture the main features of the AlCl production by considering only the dynamics of the Al and Cl atoms after they are placed into the gas phase. The details of how they got there do not affect the model, as long as the ablation efficiencies are independent of . This can be rationalized by assuming that the ablation conditions result in such high temperatures that essentially all solid-state bonding is lost, leading to free atoms whose reaction to form AlCl is entirely determined by the initial concentrations and collision rate.
The fact that the first-encounter models do a good job of reproducing the [AlCl] curves is not surprising because the atoms are rapidly cooled as they react to form AlCl. If the cooling process freezes out the initially formed AlCl and prevents subsequent high energy collisions that allow the molecules to react further, for example dissociating back into Al+Cl or by adding another Cl to make AlCl2, then the mixture will not reach equilibrium. At the measured temperature of 8.5 K, the formation of AlCl3 is overwhelmingly favored, so the fact that AlCl is observed at all is further evidence that the cryogenic buffer gas beam source does not allow the gas mixture to reach equilibrium. In other words, AlCl production is kinetically controlled under these rapid cooling conditions.
Having developed a physical model that does a reasonable job of quantitatively reproducing the AlCl production data, we are now in a position to draw some conclusions about the production of cold AlCl by laser ablation. The first conclusion, that Cl atom density in the XCln precursor is a critical parameter in determining AlCl yield, provides practical guidance for the choice of precursor. In principle, AlCl3 provides the highest yield, but as discussed above its toxicity and instability make it challenging to work with. Given that Al:MgCl2 provides a similar signal level, and since there is only a modest (roughly a factor of 2) variation between the different chlorides we explored, it is not clear that the added inconvenience and hazard of AlCl3 is worth the small signal gains. On the other hand, it may be that molecules with additional bonded Cls could drive the yield even higher. For example, hexachloroethane is a solid at room temperature, although it is much more difficult to handle than the salts used in this work. Finally, we should emphasize that the physical basis of our model is very general and should be applicable to other halides. We suspect that identifying precursors with high solid-state halide densities will be an important consideration for the production of metal halide diatomics using laser ablation from mixtures.
In addition to the choice of Cl source, other experimental parameters can be tuned to improve AlCl production. One obvious step would be to increase the spot size and thus V0, while keeping the heat load on the cryogenic system manageable. Since [AlCl] will scale as V (Equation 10), this provides a straightforward path to more signal per shot, albeit at the expense of using up the pellet more quickly and increasing the heat load on the cryogenic cell. Similarly, increasing the ablation efficiencies and (which were not directly measured in this paper) would also increase the production of AlCl. A comparison of the measured Al density () and the maximum Al density calculated based on the estimated ablation volume (, see Supplemental Information for details) allows a rough estimate of to be on the order of . Modifying the ablation conditions might enhance efficiencies. For example, most researchers use ultraviolet excimer laser sources to ablate alkali halides91, 92, 93, 94, although infrared lasers have also been used95, so it is possible that shifting to shorter wavelengths would produce more Cl atoms. Alternatively, if we assume that the Al component is responsible for most of the laser absorption, then smaller Al and XCln particles in combination with more uniform mixing might also improve heat transfer to the XCln and accelerate its solid-to-gas transition. We could also consider ways to avoid the Al saturation behavior that is described by Model A’. Changes in the rate of cooling gas flow or surface geometry might inhibit Al atom recombination, although this is somewhat speculative.
Finally, it is important to point out that ablation of an Al:XCln mixture will always be limited by the constraint of Equation 5. Because all the Al and Cl atoms must be packed into a fixed volume V0, increasing NAl requires decreasing NCl and vice versa. To decouple these quantities requires separate Al and Cl sources. Recent work has shown that using a gas source for the halide, for example SF6, can successfully generate metal halides like AlF.96 To produce a source of Cl atoms, Cl2, HCl or possibly methanochlorides like CCl4, CHCl3 and CH2Cl2 would be reasonable candidates. There is a previous report of AlCl being produced by ablation of an Al rod exposed to Cl2 gas 97, but its characteristics were not described in detail. These potential Cl sources are corrosive and/or toxic, so the introduction of these gases into a vacuum chamber would add experimental challenges. But they are also chemically stable and easy to put in the gas phase, so they could result in much higher AlCl production if all the solid Al could be vaporized and reacted.
5 Conclusions
This work has demonstrated that pulsed laser ablation of Al:XCln mixtures provides a robust and reliable source of cold AlCl molecules. Stable, non-toxic precursors can be used instead of AlCl3, the most commonly used precursor in previous studies. The reason that the alkali halide mixtures are relatively insensitive to the chemical nature of the precursor is that high intensity laser ablation provides enough excess energy to efficiently dissociate the Cl salt into its atomic constituents. A simple model that assumes AlCl formation is mainly determined by the initial Al+Cl AlCl encounters can quantitatively capture trends in the AlCl production as a function of precursor composition and Al:XCln mixing ratio. The most important attribute of the solid XCln source is a high Cl atom density, a conclusion that may be generalizable to the production of other heteronuclear diatomics as well. More powerful lasers, improved ablation of the Al component, and decoupling the Al and Cl sources are all promising future directions for producing a large numbers of cold AlCl molecules. The work in this paper represents a first step in understanding the chemical mechanisms of laser ablation sources for producing AlCl and will hopefully provide guidance for their future development and optimization.
Author Contributions
Taylor N. Lewis and Chen Wang contributed equally to this work.
Conflicts of interest
There are no conflicts to declare.
Acknowledgements
We acknowledge funding from the National Science Foundation (NSF) RAISE-TAQS grant 1839153.
References
- Wineland et al. 1978 D. J. Wineland, R. E. Drullinger and F. L. Walls, Physical Review Letters, 1978, 40, 1639.
- Phillips 1998 W. D. Phillips, Reviews of Modern Physics, 1998, 70, 721.
- Cohen-Tannoudji 1998 C. N. Cohen-Tannoudji, Reviews of Modern Physics, 1998, 70, 707.
- Chu 1998 S. Chu, Reviews of Modern Physics, 1998, 70, 685.
- Eschner et al. 2003 J. Eschner, G. Morigi, F. Schmidt-Kaler and R. Blatt, Journal of the Optical Society of America B, 2003, 20, 1003.
- Davis et al. 1995 K. B. Davis, M. O. Mewes, M. R. Andrews, N. J. v. Druten, D. S. Durfee, D. M. Kurn and W. Ketterle, Physical Review Letters, 1995, 75, 3969.
- Anderson et al. 1995 M. H. Anderson, J. R. Ensher, M. R. Matthews, C. E. Wieman and E. A. Cornell, Science, 1995, 269, 198–201.
- Greiner et al. 2002 M. Greiner, O. Mandel, T. Esslinger, T. W. Hänsch and I. Bloch, Nature, 2002, 415, 39–44.
- Uzan 2003 J.-P. Uzan, Reviews of Modern Physics, 2003, 75, 403.
- Baker et al. 2021 C. J. Baker, W. Bertsche, A. Capra, C. Carruth, C. L. Cesar, M. Charlton, A. Christensen, R. Collister, A. C. Mathad, S. Eriksson, A. Evans, N. Evetts, J. Fajans, T. Friesen, M. C. Fujiwara, D. R. Gill, P. Grandemange, P. Granum, J. S. Hangst, W. N. Hardy, M. E. Hayden, D. Hodgkinson, E. Hunter, C. A. Isaac, M. A. Johnson, J. M. Jones, S. A. Jones, S. Jonsell, A. Khramov, P. Knapp, L. Kurchaninov, N. Madsen, D. Maxwell, J. T. K. McKenna, S. Menary, J. M. Michan, T. Momose, P. S. Mullan, J. J. Munich, K. Olchanski, A. Olin, J. Peszka, A. Powell, P. Pusa, C. O. Rasmussen, F. Robicheaux, R. L. Sacramento, M. Sameed, E. Sarid, D. M. Silveira, D. M. Starko, C. So, G. Stutter, T. D. Tharp, A. Thibeault, R. I. Thompson, D. P. van der Werf and J. S. Wurtele, Nature 2021 592:7852, 2021, 592, 35–42.
- Ludlow et al. 2015 A. D. Ludlow, M. M. Boyd, J. Ye, E. Peik and P. O. Schmidt, Reviews of Modern Physics, 2015, 87, 637.
- Krems 2008 R. V. Krems, Physical Chemistry Chemical Physics, 2008, 10, 4079.
- Ni et al. 2010 K.-K. K. Ni, S. Ospelkaus, D. Wang, G. Quéméner, B. Neyenhuis, M. H. G. De Miranda, J. L. Bohn, J. Ye and D. S. Jin, Nature, 2010, 464, 1324–1328.
- Ospelkaus et al. 2010 S. Ospelkaus, K.-K. K. Ni, D. Wang, M. H. G. de Miranda, B. Neyenhuis, G. Quéméner, P. S. Julienne, J. L. Bohn, D. S. Jin and J. Ye, Science, 2010, 327, 853.
- Ye et al. 2018 X. Ye, M. Guo, M. L. González-Martínez, G. Quéméner and D. Wang, Science Advances, 2018, 4, eaaq0083.
- Tscherbul and Kłos 2020 T. V. Tscherbul and J. Kłos, Physical Review Research, 2020, 2, 013117.
- Liu and Ni 2022 Y. Liu and K.-K. Ni, Annu. Rev. Phys. Chem., 2022, 00, 1–25.
- Carr et al. 2009 L. D. Carr, D. DeMille, R. V. Krems and J. Ye, New Journal of Physics, 2009, 11, 055049.
- Micheli et al. 2006 A. Micheli, G. K. Brennen and P. Zoller, Nature Physics, 2006, 2, 341–347.
- Andreev et al. 2018 V. Andreev, D. G. Ang, D. DeMille, J. M. Doyle, G. Gabrielse, J. Haefner, N. R. Hutzler, Z. Lasner, C. Meisenhelder, B. R. O’Leary, C. D. Panda, A. D. West, E. P. West, X. Wu and A. Collaboration, Nature, 2018, 562, 355–360.
- Cairncross et al. 2017 W. B. Cairncross, D. N. Gresh, M. Grau, K. C. Cossel, T. S. Roussy, Y. Ni, Y. Zhou, J. Ye and E. A. Cornell, Phys. Rev. Lett., 2017, 119, 153001.
- Kozyryev and Hutzler 2017 I. Kozyryev and N. R. Hutzler, Physical Review Letters, 2017, 119, 133002.
- Hudson et al. 2011 J. J. Hudson, D. M. Kara, I. J. Smallman, B. E. Sauer, M. R. Tarbutt and E. A. Hinds, Nature, 2011, 473, 493–496.
- Kozyryev et al. 2021 I. Kozyryev, Z. Lasner and J. M. Doyle, Physical Review A, 2021, 103, 043313.
- Kondov et al. 2019 S. S. Kondov, C.-H. Lee, K. H. Leung, C. Liedl, I. Majewska, R. Moszynski and T. Zelevinsky, Nature Physics 2019 15:11, 2019, 15, 1118–1122.
- DeMille et al. 2008 D. DeMille, S. Sainis, J. Sage, T. Bergeman, S. Kotochigova and E. Tiesinga, Physical Review Letters, 2008, 100, 043202.
- Chin et al. 2009 C. Chin, V. V. Flambaum and M. G. Kozlov, New Journal of Physics, 2009, 11, 55048.
- Kajita 2009 M. Kajita, New Journal of Physics, 2009, 11, 055010.
- Beloy et al. 2010 K. Beloy, A. Borschevsky, P. Schwerdtfeger and V. V. Flambaum, Physical Review A, 2010, 82, 022106.
- Jansen et al. 2014 P. Jansen, H. L. Bethlem and W. Ubachs, The Journal of Chemical Physics, 2014, 140, 010901.
- Daprà et al. 2016 M. Daprà, M. L. Niu, E. J. Salumbides, M. T. Murphy and W. Ubachs, The Astrophysical Journal, 2016, 826, 192.
- Kobayashi et al. 2019 J. Kobayashi, A. Ogino and S. Inouye, Nature Communications 2019 10:1, 2019, 10, 1–5.
- DeMille 2002 D. DeMille, Physical Review Letters, 2002, 88, 067901.
- Yelin et al. 2006 S. F. Yelin, K. Kirby and R. Côté, Physical Review A, 2006, 74, 050301(R).
- Yu et al. 2019 P. Yu, L. W. Cheuk, I. Kozyryev and J. M. Doyle, New Journal of Physics, 2019, 21, 093049.
- Anderegg et al. 2017 L. Anderegg, B. L. Augenbraun, E. Chae, B. Hemmerling, N. R. Hutzler, A. Ravi, A. Collopy, J. Ye, W. Ketterle and J. M. Doyle, Physical Review Letters, 2017, 119, 103201.
- Truppe et al. 2017 S. Truppe, H. J. Williams, M. Hambach, L. Caldwell, N. J. Fitch, E. A. Hinds, B. E. Sauer and M. R. Tarbutt, Nature Physics, 2017, 13, 1173–1176.
- Williams et al. 2017 H. J. Williams, S. Truppe, M. Hambach, L. Caldwell, N. J. Fitch, E. A. Hinds, B. E. Sauer and M. R. Tarbutt, New Journal of Physics, 2017, 19, 113035.
- Barry et al. 2014 J. F. Barry, D. J. McCarron, E. B. Norrgard, M. H. Steinecker and D. DeMille, Nature, 2014, 512, 286–289.
- Collopy et al. 2018 A. L. Collopy, S. Ding, Y. Wu, I. A. Finneran, L. Anderegg, B. L. Augenbraun, J. M. Doyle and J. Ye, Physical Review Letters, 2018, 121, 213201.
- Di Rosa, M. D. 2004 Di Rosa, M. D., Eur. Phys. J. D, 2004, 31, 395–402.
- Iwata et al. 2017 G. Z. Iwata, R. L. McNally and T. Zelevinsky, Physical Review A, 2017, 96, 022509.
- Baum et al. 2020 L. Baum, N. B. Vilas, C. Hallas, B. L. Augenbraun, S. Raval, D. Mitra and J. M. Doyle, Physical Review Letters, 2020, 124, 133201.
- Augenbraun et al. 2021 B. L. Augenbraun, A. Frenett, H. Sawaoka, C. Hallas, N. B. Vilas, A. Nasir, Z. D. Lasner and J. M. Doyle, Zeeman-Sisyphus Deceleration of Molecular Beams, 2021.
- Lim et al. 2018 J. Lim, J. Almond, M. Trigatzis, J. Devlin, N. Fitch, B. Sauer, M. Tarbutt and E. Hinds, Physical Review Letters, 2018, 120, 123201.
- Mitra et al. 2020 D. Mitra, N. B. Vilas, C. Hallas, L. Anderegg, B. L. Augenbraun, L. Baum, C. Miller, S. Raval and J. M. Doyle, Science, 2020, 369, 1366–1369.
- Augenbraun et al. 2020 B. L. Augenbraun, Z. D. Lasner, A. Frenett, H. Sawaoka, C. Miller, T. C. Steimle and J. M. Doyle, New Journal of Physics, 2020, 22, 22003.
- Kozyryev et al. 2017 I. Kozyryev, L. Baum, K. Matsuda, B. L. Augenbraun, L. Anderegg, A. P. Sedlack and J. M. Doyle, Physical Review Letters, 2017, 118, 173201.
- Truppe et al. 2019 S. Truppe, S. Marx, S. Kray, M. Doppelbauer, S. Hofsäss, H. C. Schewe, N. Walter, J. Pérez-Riós, B. G. Sartakov and G. Meijer, Physical Review A, 2019, 100, 052513.
- Doppelbauer et al. 2021 M. Doppelbauer, N. Walter, S. Hofsäss, S. Marx, H. C. Schewe, S. Kray, J. Pérez-Ríos, B. G. Sartakov, S. Truppe and G. Meijer, Molecular Physics, 2021, 119, e1810351.
- Chen et al. 2017 T. Chen, W. Bu and B. Yan, Physical Review A, 2017, 96, 053401.
- Albrecht et al. 2020 R. Albrecht, M. Scharwaechter, T. Sixt, L. Hofer and T. Langen, Physical Review A, 2020, 101, 013413.
- Bahns et al. 1996 J. T. Bahns, W. C. Stwalley and P. L. Gould, Journal of Chemical Physics, 1996, 104, 9689.
- Xu et al. 2016 L. Xu, Y. Yin, B. Wei, Y. Xia and J. Yin, Physical Review A, 2016, 93, 013408.
- Isaev et al. 2010 T. A. Isaev, S. Hoekstra and R. Berger, Physical Review A, 2010, 82, 052521.
- Stuhl et al. 2008 B. K. Stuhl, B. C. Sawyer, D. Wang and J. Ye, Physical Review Letters, 2008, 101, 243002.
- Norrgard et al. 2017 E. B. Norrgard, E. R. Edwards, D. J. McCarron, M. H. Steinecker, D. DeMille, S. S. Alam, S. K. Peck, N. S. Wadia and L. R. Hunter, Physical Review A, 2017, 95, 062506.
- Schnaubelt et al. 2021 J. C. Schnaubelt, J. C. Shaw and D. J. McCarron, Cold CH radicals for laser cooling and trapping, 2021.
- Wan et al. 2016 M. Wan, D. Yuan, C. Jin, F. Wang, Y. Yang, Y. Yu and J. Shao, The Journal of Chemical Physics, 2016, 145, 024309.
- Yang et al. 2016 R. Yang, B. Tang and T. Gao, Chinese Physics B, 2016, 25, 043101.
- Ren et al. 2020 X. Y. Ren, Z. Y. Xiao, Y. Liu and B. Yan, Chinese Physics B, 2020, 30, 053101.
- Daniel et al. 2021 J. R. Daniel, C. Wang, K. Rodriguez, T. Lewis, A. Teplukhin, B. Kendrick, C. Bardeen and B. Hemmerling, Physical Review A, 2021, 104, 012801.
- Bhaduri and Fowler 1934 B. N. Bhaduri and A. Fowler, Proceedings of the Royal Society of London A, 1934, 145, 321–336.
- Sharma 1951 D. Sharma, The Astrophysical Journal, 1951, 113, 210.
- Tsunoda et al. 1978 K. I. Tsunoda, K. Fujiwara and K. Fuwa, Analytical Chemistry, 1978, 50, 861–865.
- Ram et al. 1982 R. S. Ram, S. B. Rai, K. N. Upadhya and D. K. Rai, Physica Scripta, 1982, 26, 383–397.
- Mahieu et al. 1989 E. Mahieu, I. Dubois and H. Bredohl, Journal of Molecular Spectroscopy, 1989, 134, 317–328.
- Mahieu et al. 1989 E. Mahieu, I. Dubois and H. Bredohl, Journal of Molecular Spectroscopy, 1989, 138, 264–271.
- Futerko and Fontijn 1993 P. M. Futerko and A. Fontijn, The Journal of Physical Chemistry, 1993, 97, 7222–7227.
- Saksena et al. 1998 M. Saksena, V. Dixit and M. Singh, Journal of Molecular Spectroscopy, 1998, 187, 1–5.
- Rogowski et al. 2002 D. F. Rogowski, P. Marshall and A. Fontijn, Journal of Physical Chemistry, 2002, 93, 1118–1123.
- Himmel 2005 H.-J. Himmel, European Journal of Inorganic Chemistry, 2005, 2005, 1886–1894.
- Lide 1965 D. R. Lide, The Journal of Chemical Physics, 1965, 42, 1013–1018.
- Wyse and Gordy 1972 F. C. Wyse and W. Gordy, The Journal of Chemical Physics, 1972, 56, 2130–2136.
- Hedderich et al. 1993 H. G. Hedderich, M. Dulick and P. F. Bernath, The Journal of Chemical Physics, 1993, 99, 8363–8370.
- Dearden et al. 1993 D. V. Dearden, R. D. Johnson and J. W. Hudgens, The Journal of Chemical Physics, 1993, 99, 7521–7528.
- Hutzler et al. 2012 N. R. Hutzler, H.-I. I. Lu and J. M. Doyle, Chemical Reviews, 2012, 112, 4803–4827.
- John R. Rumble 2021 John R. Rumble, CRC Handbook of Chemistry and Physics, 101st edn, 2021.
- Numata et al. 1993 M. Numata, M. Sugiura and A. Fuwa, Materials Transactions, JIM, 1993, 34, 511–516.
- Russell et al. 1951 A. S. Russell, K. E. Martin, C. N. Cochran and C. Norman Cochran, Journal of the American Chemical Society, 1951, 73, 1466–1469.
- Kikuchi et al. 1964 T. Kikuchi, T. Kurosawa and T. Yagihashi, Transactions of the Japan Institute of Metals, 1964, 5, 122–126.
- Rao and Dadape 1966 D. B. Rao and V. V. Dadape, J. Phys. Chem., 1966, 70, 1349.
- Tacke and Schnöckel 1989 M. Tacke and H. Schnöckel, Inorganic Chemistry, 1989, 28, 2895–2896.
- Takahashi et al. 2021 Y. Takahashi, D. Shlivko, G. Woolls and N. R. Hutzler, Phys. Rev. Research, 2021, 3, 023018.
- Kirshenbaum et al. 1962 A. D. Kirshenbaum, J. A. Cahill, P. J. Mcgonigal~ and A. V. Grosse, Nucl. Chem, 1962, 24, 1287–1296.
- Russo et al. 2013 R. E. Russo, X. Mao, J. J. Gonzalez, V. Zorba and J. Yoo, Analytical Chemistry, 2013, 85, 6162–6177.
- Stafe et al. 2008 M. Stafe, I. Vladoiu, C. Negubu and I. Popescu, Romanian Reports in Physics, 2008, 60, 789–796.
- Gragossian et al. 2009 A. Gragossian, S. H. Tavassoli and B. Shokri, Journal of Applied Physics, 2009, 105, 103304.
- Zhang and Willitsch 2017 D. Zhang and S. Willitsch, RSC Theoretical and Computational Chemistry Series, 2017, 2018-Janua, 496–536.
- Cabalin and Laserna 1998 L. M. Cabalin and J. J. Laserna, Spectrochimica Acta Part B: Atomic Spectroscopy, 1998, 53, 723–730.
- Haglund et al. 1992 R. F. Haglund, M. Affatigato, J. H. Arps, K. Tang, A. Niehof and W. Heiland, Nuclear Instruments and Methods in Physics Research Section B: Beam Interactions with Materials and Atoms, 1992, 65, 206–211.
- Thomas Dickinson 1994 J. Thomas Dickinson, Nuclear Instruments and Methods in Physics Research Section B: Beam Interactions with Materials and Atoms, 1994, 91, 634–638.
- Nishikawa et al. 2000 H. Nishikawa, M. Kanai, G. Szabo and T. Kawai, Physical Review B, 2000, 61, 967.
- FA et al. 2008 F.-L. FA, P. CR and d. S. EF, Journal of mass spectrometry : JMS, 2008, 43, 587–593.
- Redeker et al. 2017 F. A. Redeker, H. Beckers and S. Riedel, Chemical Communications, 2017, 53, 12958–12961.
- Aggarwal et al. 2021 P. Aggarwal, H. L. Bethlem, A. Boeschoten, A. Borschevsky, K. Esajas, Y. Hao, S. Hoekstra, K. Jungmann, V. R. Marshall, T. B. Meijknecht, M. C. Mooij, R. G. E. Timmermans, A. Touwen, W. Ubachs, L. Willmann, Y. Yin and A. Zapara, Review of Scientific Instruments, 2021, 92, 033202.
- Hensel et al. 1993 K. D. Hensel, C. Styger, W. Jäger, A. J. Merer and M. C. L. Gerry, The Journal of Chemical Physics, 1993, 99, 3320–3328.