AstroSat and MAXI view of Cygnus X-1: Signature of an ‘extreme’ soft nature
Abstract
We present a detailed spectral and timing analysis of Cygnus X-1 with multi-epoch observations, during to , by SXT and LAXPC on-board AstroSat. We model the spectra in broad energy range of to study the evolution of spectral properties while Cygnus X-1 transited from hard state to an extreme soft state via intermediate states in 2017. Simultaneous timing features are also examined by modelling the power density spectra in . We find that during high-soft state observations, made by AstroSat on Oct (MJD ), the energy spectrum of the source exhibits an inner disk temperature (kTin) of , a very steep photon index () of along with a fractional disk flux contribution of . The power density spectrum in the range of is also very steep with a power-law index of along with a high RMS value of . Comparing the spectral softness of high-soft state with those of previously reported, we confirm that AstroSat observed Cygnus X-1 in the ‘softest’ state. The lowest MAXI spectral hardness ratio of corroborates the softest nature of the source. Moreover, we estimate the spin of the black hole by continuum-fitting method, which indicates that Cygnus X-1 is a maximally rotating ‘hole’. Further, Monte Carlo (MC) simulations are performed to estimate the uncertainty in spin parameter, which is constrained as a with confidence interval. Finally, we discuss the implications of our findings.
keywords:
accretion, accretion disks – black hole physics – radiation: dynamics – X-ray: binaries – stars: individual (Cygnus X-1)1 Introduction
Black hole X-ray binaries (BH-XRBs) arguably provide wonderful opportunities to understand accretion dynamics. In BH-XRBs, matter from companion star, forms an accretion disk around a black hole. Matter loses angular momentum within disk to viscous dissipation which causes inward drift, heating and emission of radiation. Radiation emanating from disk in proximity to black hole has signatures of strong gravity.
Emission from BH-XRBs can be of thermal and non-thermal origins. The Keplerian accretion disk (Shakura & Sunyaev, 1973) is considered to produce multi-colour thermal X-ray emission. Inverse-comptonisation by a ‘hot’ corona (Titarchuk, 1994; Tanaka & Lewin, 1995; Chakrabarti & Titarchuk, 1995) of soft photons emanating from disc, is responsible for higher energy thermal or non-thermal emission. These two types of emissions are the major components in the energy spectra, of which one component may dominate in a spectral state of BH-XRBs (Remillard & McClintock, 2006).
The persistently bright BH-XRBs, in general, exhibit two spectral states, high-soft state and low-hard state whereas spectral states of outbursting BH-XRBs, based on hardness intensity diagram (HID) and spectro-temporal features, can be classified into low-hard state (LHS), hard-intermediate state (HIMS), soft-intermediate state (SIMS) and high-soft state (HSS) (Homan et al., 2001; Homan & Belloni, 2005; Remillard & McClintock, 2006; Nandi et al., 2012; Radhika et al., 2018; Sreehari et al., 2019; Baby et al., 2020, and references therein).
In HSS, energy spectrum is dominated by thermal emission from disk over Compton tail, while in LHS it is vice-versa (Remillard & McClintock, 2006). The thermal emission in HSS is of great importance as it originates in the inner regions of the disk and the spectrum has imprints of inner-disk radius (Rin). Rin is effectively the inner most stable circular orbit (ISCO) (Tanaka & Lewin, 1995; McClintock et al., 2014). The radius of ISCO (RISCO) is an important parameter which in units of gravitational radii (RISCO/rg; r GM/) is a simple function of black hole spin a∗111a∗ Jc/GM, a∗ 1, where J is angular momentum of black hole. (Bardeen et al., 1972). Hence, by estimating Rin, black hole’s spin parameter is measured in BH-XRBs.
Mainly two methods have been developed to estimate the spin of black holes. First method is based on modelling of thermal continuum spectrum of black hole’s accretion disk (Zhang et al., 1997; McClintock et al., 2014) and the second method estimates the spin by modelling the profile of a relativistically broadened Fe-Kα fluorescence line (Tanaka et al., 1995; Reynolds, 2014). Alternatively, measurement of spin is also possible via high frequency Quasi-periodic Oscillations (HFQPOs) (Abramowicz & Kluźniak, 2001; Remillard & McClintock, 2006; Dihingia et al., 2019, and references therein) and X-ray polarization (Dovčiak et al., 2008; Schnittman & Krolik, 2009) observed in BH-XRBs.
Spin estimation via X-ray continuum-fitting (CF) method requires a disk dominated HSS of BH-XRBs. The thermal disk spectrum, is fitted with thin relativistic disk model kerrbb (Novikov & Thorne, 1973; Li et al., 2005) and in turn estimates Rin of the accretion disk. Rin, is then tagged as RISCO since it is widely accepted that in this state the accretion rate is high enough for the disk to extend to RISCO, which is related to spin a∗1. Accurate measurements of distance (D), mass of black hole (MBH) and inclination angle of the binary plane (i) are crucial in order to determine black hole spin with CF method. In order to reliably estimate the spin with CF method, a geometrically thin disk and a weak Comptonisation of thermal seed photons is preferred. The disk luminosity satisfying a criteria of indicates presence of thin disk (McClintock et al., 2006; McClintock et al., 2014). The strength of Comptonising medium is estimated with scattering fraction (fsc), which indicates the fraction of thermal seed photons that is scattered to produce high energy tail. The condition fsc is necessary for successful application of CF method (Steiner et al., 2009b). The method has been employed for many BH-XRBs previously (Gou et al., 2009; McClintock et al., 2014, and references therein) including Cygnus X-1 (Gou et al., 2011, 2014; Kawano et al., 2017), to measure the spin of the black hole.
Cygnus X-1 is a persistent bright high mass X-ray binary with a primary object as confirmed black hole (Webster & Murdin, 1972; Bolton, 1972) and a massive companion of 09.7 Iab type supergiant star HDE (Walborn, 1973). Previously, the binary bf was estimated to be at distance of kpc based on radio parallax (Reid et al., 2011) and at kpc based on dust scattering method (Xiang et al., 2011). The mass of the black hole in the binary system was estimated as MBH M☉ and the inclination of binary plane as i (Orosz et al., 2011). Recently, Miller-Jones et al. (2021), using VLBA observations, re-estimated the binary system parameters, MBH, i and D to be and , respectively. Based on the previous parameters, the spin of the black hole, was estimated by Tomsick et al. (2014) as ( confidence level) with Fe-Kα line fitting method using Suzaku and NuSTAR data. Gou et al. (2014) employed CF method and estimated spin as a at a confidence level of . Kawano et al. (2017) determined the spin with CF method using data from Suzaku. Recently, Zhao et al. (2021), used the updated parameters of binary system and revised the spin parameter as a at a confidence level of .
Cygnus X-1 mostly remains in LHS but displays transitions to HSS. HSS duration can be few months to years (Grinberg et al., 2014). The LHS spectra can be modelled well with Comptonised continuum model. High resolution broad-band spectroscopic observations revealed an additional component attributing to reflection of Comptonised photons from disk (Ling et al., 1983; Parker et al., 2015). Basak et al. (2017) argued for presence of an in-homogeneous Comptonising cloud and suggested two Comptonising components for modelling the spectra. Spectra in HSS, exhibit multi-colour blackbody accountable for accretion disk with steep weak Compton tail. An additional reflection component have also been reported in this state (Gierliński et al., 1999; Tomsick et al., 2014; Walton et al., 2016; Kawano et al., 2017) of the source. Moreover, the broadband spectra of both states have been modelled with two component advective flows model as well Mandal & Chakrabarti (2007).
The short term and long term temporal features and their evolution in different states of Cygnus X-1 have been reported mainly from high time resolution RXTE and AstroSat observations (Pottschmidt et al., 2003; Axelsson et al., 2005; Grinberg et al., 2014; Misra et al., 2017). The power density spectra (PDS) exhibit multiple broad features which are modelled with multiple Lorentzians. Exception to this are the ‘canonical’ soft states when one lorentzian plus power-law or only a power-law can successfully represent the PDS (Churazov et al., 2001; Axelsson et al., 2005). During transitions from LHS to HSS, the central frequencies of Lorentzians shift to higher frequencies (Axelsson et al., 2005) but remain below Hz.
| Observation | Obs ID | Orbit | Obs date (MJD) | LAXPC | SXT | ||
|---|---|---|---|---|---|---|---|
| (ksec) | (counts/sec) | (ksec) | (counts/sec) | ||||
| Obs A | |||||||
| Obs B | |||||||
| Obs C | |||||||
| Obs D | |||||||
| Obs E | |||||||
| Obs F | |||||||
| Obs G | |||||||
| Obs H | |||||||
| Obs I | |||||||
Cygnus X-1 has been observed multiple times over last years with AstroSat, India’s first multi-wavelength space observatory (Agrawal, 2006). AstroSat was launched on Sept 25, , with five scientific instruments on-board covering a wide range of energies from UV to hard X-rays (Singh et al., 2014; Rao et al., 2016). It provides a unique platform for simultaneous observations, over a wide X-ray band from keV to keV, via its suite of co-aligned X-ray instruments - Soft X-ray Telescope (SXT) (Singh et al., 2016, 2017), Large Area X-ray Proportional Counter (LAXPC) (Yadav et al., 2016b; Antia et al., 2017) and Cadmium Zinc Telluride Imager (CZTI) (Vadawale et al., 2016). We exploit the detection capabilities of SXT in the soft X-rays to obtain spectra in the lower energies and LAXPC enables us to study spectra up to keV. We studied evolution of spectral and temporal properties of Cygnus X-1 over a transition from LHS to HSS via intermediate states (IMS). Cygnus X-1 attains an extreme soft state and we find that during this state source has the ‘softest nature’ ever observed by any other X-ray observatory. Further, we employ CF method to estimate the spin of the black hole. Since accuracy and success of CF method rely on broadband X-ray observation of BH-XRBs, AstroSat data is suitable for such studies. We also make use of the temporal resolution ( s) of LAXPC to obtain PDS of Cygnus X-1, in order to study the temporal features during the softest state and various phases of accretion states.
In 2, we have given details of the observations and the steps for data reduction. We have discussed broadband spectral analysis using both SXT and LAXPC data and the results from phenomenological as well as physical modelling in 3. Detailed analysis of PDS has been carried out with LAXPC data and the results are presented in 4. We discuss about the ‘softest’ nature of the source and present the details of spin measurement in the softest state with CF method in 5. Finally, we have discussed the results and have concluded in 6.
2 Observations and Data Reduction
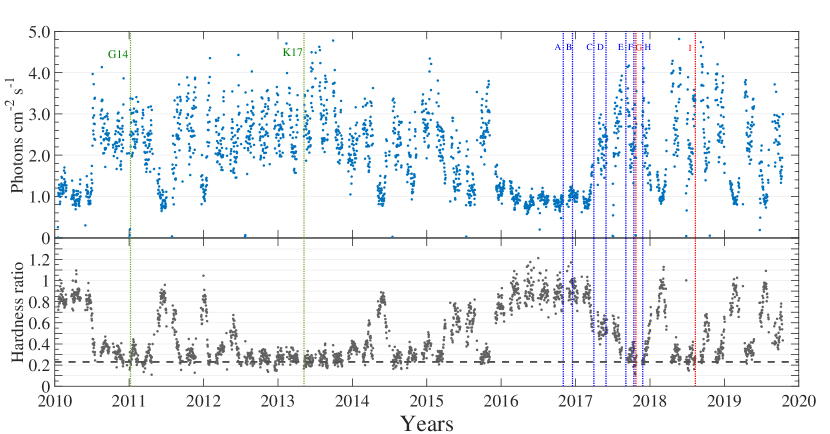
Cygnus X-1, for the last decade , has been showing atypical behaviour of remaining mostly in soft states when compared to previous years where it was typically found in hard state with occasional soft state transitions (Grinberg et al., 2014). Lightcurve obtained from continuous monitoring of source with MAXI, clearly shows this behaviour of the source (see Figure 1). The monitoring shows that the source is in persistent LHS in and subsequently, in starts a transition into HSS. We make use of MAXI lightcurve in keV energy band and hardness ratio (HR) of two energy bands keV to keV (hereafter MAXI-HR) in order to select observations from AstroSat data during this transition period (Figure 1).
Cygnus X-1 was observed by AstroSat for last years () with about co-ordinated pointings. We have selected observations from Guaranteed Time (GT) phase for this work, as our primary goal is to study the broadband characteristics during the transition phase of the source. Hence, we select only those observations which are suitable to study the entire transition from LHS to HSS via IMS during the AstroSat campaign. The details of multi-epoch observation logs are provided in Table 1 and also marked in Figure 1. We make use of data from SXT and LAXPC on board AstroSat to carry out broadband spectral and timing analysis on these selected observations.
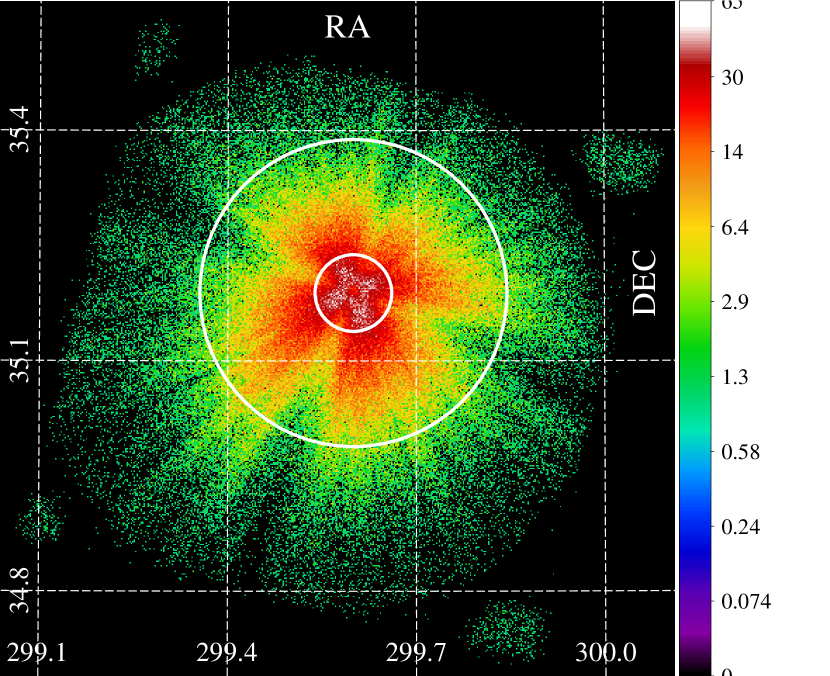
SXT is a soft X-ray instrument capable of imaging and spectroscopy in the keV energy range. SXT has a focusing telescope and a charged-coupled device (CCD) detector (Singh et al., 2017). The SXT CCD calibration procedures and results are summarized by Singh et al. (2016, 2017). Extraction of level data from SXT raw data is done using the sxtpipeline tool by SXT instrument team222https://www.tifr.res.in/astrosat_sxt/dataanalysis.html and is available on ISSDC website333 https://www.issdc.gov.in/astro.html (see also Sreehari et al., 2019; Baby et al., 2020). The SXT data are available in the Photon Counting (PC) mode. The extracted cleaned event files are used to generate energy spectra with XSELECT V2.4d. Spectra and lightcurve are extracted from an annular region over SXT CCD image of the source (see Figure 2). As Cygnus X-1 is a bright source and saturates the central pixels of image location on SXT CCD, thus annular source region with inner radius of has been excluded for data extraction to avoid pile-up (see 6, for details on pile-up estimation in SXT spectra), while the outer radius varied from depending on the size of source image in different states and epochs. Smaller outer radii correspond to LHS data sets since counts from source is very low and bigger radii causes high background contribution. The spectra have 1024 channels and for fitting purpose, we use the spectra without rebinning along with the background, response as well as ARF files provided by SXT instrument team2.
The LAXPC is one of the primary instruments on board AstroSat and consists of three identical co-aligned X-ray proportional counter units (LAXPC10, LAXPC20 and LAXPC30) providing with high time resolution ( s) covering keV energy band (Yadav et al., 2016b; Antia et al., 2017; Agrawal et al., 2017). All three units are calibrated with Crab observations and further details on the same are given by Antia et al. (2017, 2021). Data from LAXPC10 unit are unstable, while LAXPC30 data are not considered due to the continuous gain shift observed in this unit, suspected to be caused by a gas leakage (Antia et al., 2017). Thus, in this work, we use the data only from LAXPC20, which is stable and working nominally since launch. A very recent Crab observation with LAXPC20 is discussed by Antia et al. (2021) where spectral fit parameters are found to be well within the acceptable limits. LAXPC20 was operated in event analysis (EA) mode during all the observations. The capabilities of LAXPC for timing and spectroscopic studies of various sources are already demonstrated by Yadav et al. (2016a); Misra et al. (2017); Verdhan Chauhan et al. (2017); Agrawal et al. (2018); Sreehari et al. (2019); Baby et al. (2020); Agrawal & Nandi (2020); Agrawal et al. (2020); Sreehari et al. (2020).
We followed these papers and the instructions provided along with the LAXPC analysis software (LaxpcSoft444https://www.tifr.res.in/~astrosat_laxpc/software.html) released on Sept . The details of how the responses and background spectra are generated, are described in Antia et al. (2017). Further, the source and background energy spectra are extracted from events in all layers and anodes of LAXPC20. Moreover, only single events are considered for generating the spectra. These options are selected to have a minimal undesired bump in the spectral residuals at around keV which attributes to Xenon fluorescence from detector. The extracted spectra have 256 channels and we use the spectral data for fitting without rebinning. LaxpcSoft generates GTI files of good time interval which reduces the data and results in data gaps attributing to South Atlantic Anomaly (SAA) passes and Earth occultations during observations.
3 Spectral Analysis and Results
We consider broadband modelling of energy spectra obtained during all observations listed in Table 1. SXT and LAXPC spectra are simultaneously fitted in HEAsoft XSPEC 12.10.0e package. Energy ranges of keV and keV have been considered in spectral fit for SXT and LAXPC, respectively.
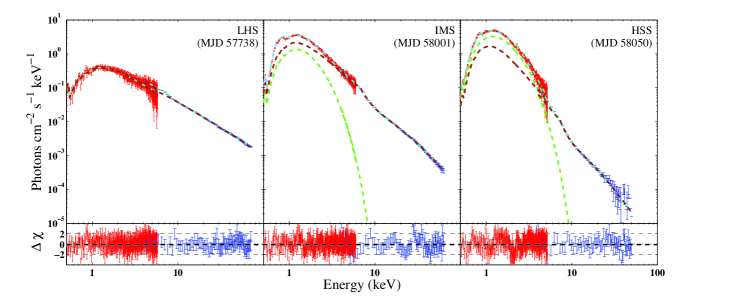
We start with Obs A and modeled the spectrum with Tbabs (Wilms et al., 2000), diskbb (Mitsuda et al., 1984) and power-law of XSPEC. The relative cross-normalization between the LAXPC and SXT data is taken care by multiplicative constant factor. The fit gives a very low and unrealistic value of disk temperature though of indicates a good fit. Hence, we removed the disk component and fitted with Tbabs and nthComp (Zdziarski et al., 1996). The model gives a of . The value of kTbb is fixed to a fiducial value of keV. We then correct for instrument features at and keV arising from SXT. Also, a broad absorption dip, present at keV, is modelled with smedge. An instrumental Xenon edge around keV and systematic uncertainty is introduced in order to achieve a good estimate of the spectral fit parameters (Sreehari et al., 2019). This results into a significantly improved value of . The fit gives model parameters of photon index () as and electron temperature (kTe) of . Unless mentioned explicitly, all the errors are computed using ( confidence level) for all the observations. Spectral analysis and fit procedure for Obs B is similar to that of Obs A. The resulting fit parameters are given in Table 2 and the spectra fitted with the model is shown in the left of Figure 3.
The hydrogen column density NH is estimated to be atoms cm-2 from the fit. This is in good agreement with estimations of previous investigators (Tomsick et al., 2014; Parker et al., 2015; Walton et al., 2016; Kawano et al., 2017). It is to be noted that HEASARC NH calculator555https://heasarc.gsfc.nasa.gov/cgi-bin/Tools/w3nh/w3nh.pl gives an average value for hydrogen column density of atoms cm-2 for Cygnus X-1. Xiang et al. (2011) estimates hydrogen column density towards Cygnus X-1 as N atoms cm-2 by dust scattering modelling.
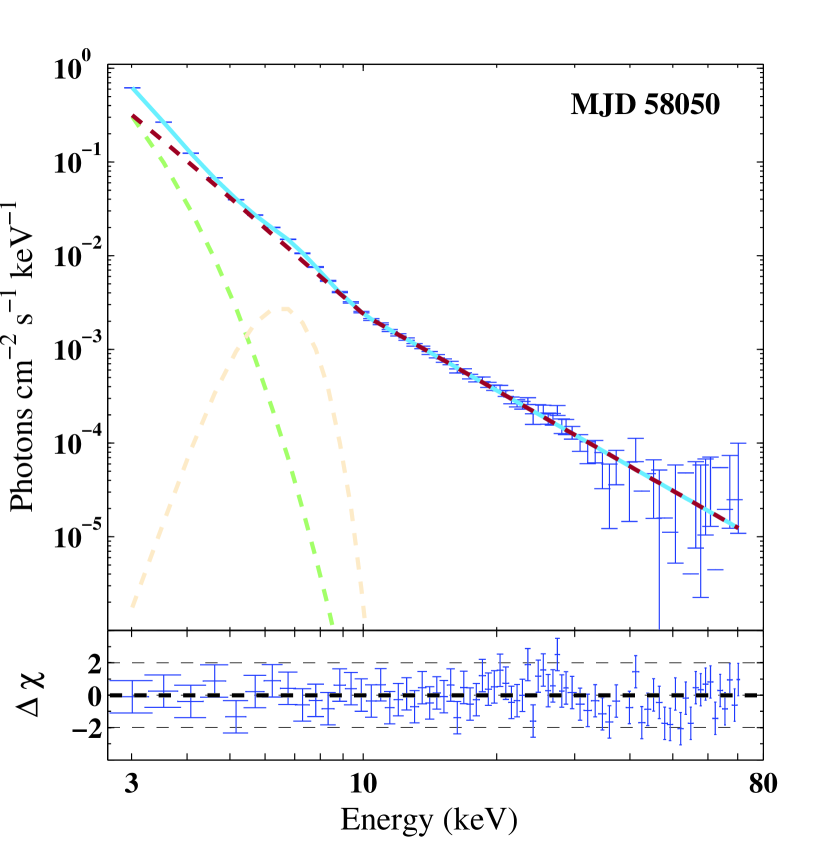
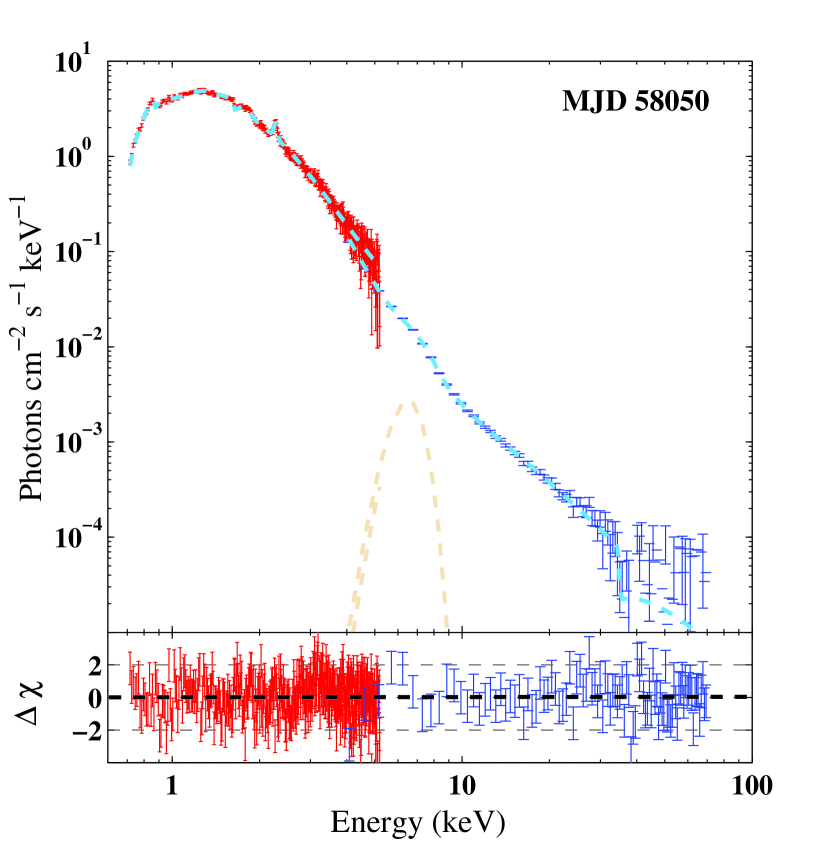
Moving onto the softer observations, as indicated by hardness ratio from MAXI (see Figure 1 and Table 1), we attempt to fit the spectrum, from Obs C, with Tbabs and nthComp, but the fit shows residuals below 10 keV, suggesting inclusion of a thermal disk emission component in the model. Hence, diskbb is added to model the spectrum. The fit gives a value of for inner disk temperature (kTin) and a disk normalisation of . The photon index () is found to be , which suggests the spectrum has become steeper. We note that Obs C marks the advent of soft state transition. Further, similar fit procedure is applied to Obs D and E. The inner disk temperature, during Obs D is slightly higher than that of Obs C and the disk normalization decreases to a value of . Further, during Obs E, inner disk temperature increases to a value of while the fit gives a disk normalization of . Photon index () keeps on increasing, making the spectrum steeper (see middle panel of Figure 3) with values of to for Obs D and Obs E, respectively. Subsequently, spectral fit for Obs F with the same model gives roughly similar values of inner disk temperature and normalization of disk as Obs E. The photon index is even steeper with value of . The spectrum from Obs G is fitted in the same way except the energy range of LAXPC is considered from keV onwards. The fit results an even higher inner disk temperature of keV. Also, the fit results in higher photon index () of , which suggests the steepest spectrum of all the observations (see right panel of Figure 3). Fit results into a value of . Additionally, observations Obs H and I are modelled in the same way as mentioned for previous states. The fit parameters of all the observations are summarized in Table 2.
| Obs | NH | kTin | Ndisk | kTe | kTbb | NnthComp | Flux | (/dof) | |
|---|---|---|---|---|---|---|---|---|---|
| Obs A | - | - | (fixed) | ||||||
| Obs B | - | - | (fixed) | ||||||
| Obs C | (fixed) | ||||||||
| Obs D | (fixed) | ||||||||
| Obs E | |||||||||
| Obs F | (fixed) | (fixed) | |||||||
| Obs G | (fixed) | ||||||||
| Obs H | (fixed) | (fixed) | |||||||
| Obs I | (fixed) |
-
a
Note: The model is multiplied with smedge to represent the absorption feature. The component consists of a threshold energy (Ec), maximum absorption factor at threshold (f), index for photo-electric cross-section () and smearing width (w). The parameters Ec, f, and w are found to be varying in range of 7.3-8.0 keV, 0.5 to 3.6, -1.3 to -2.9 and 2.4 to 9.6 keV, respectively.
3.1 The Softest Spectral State
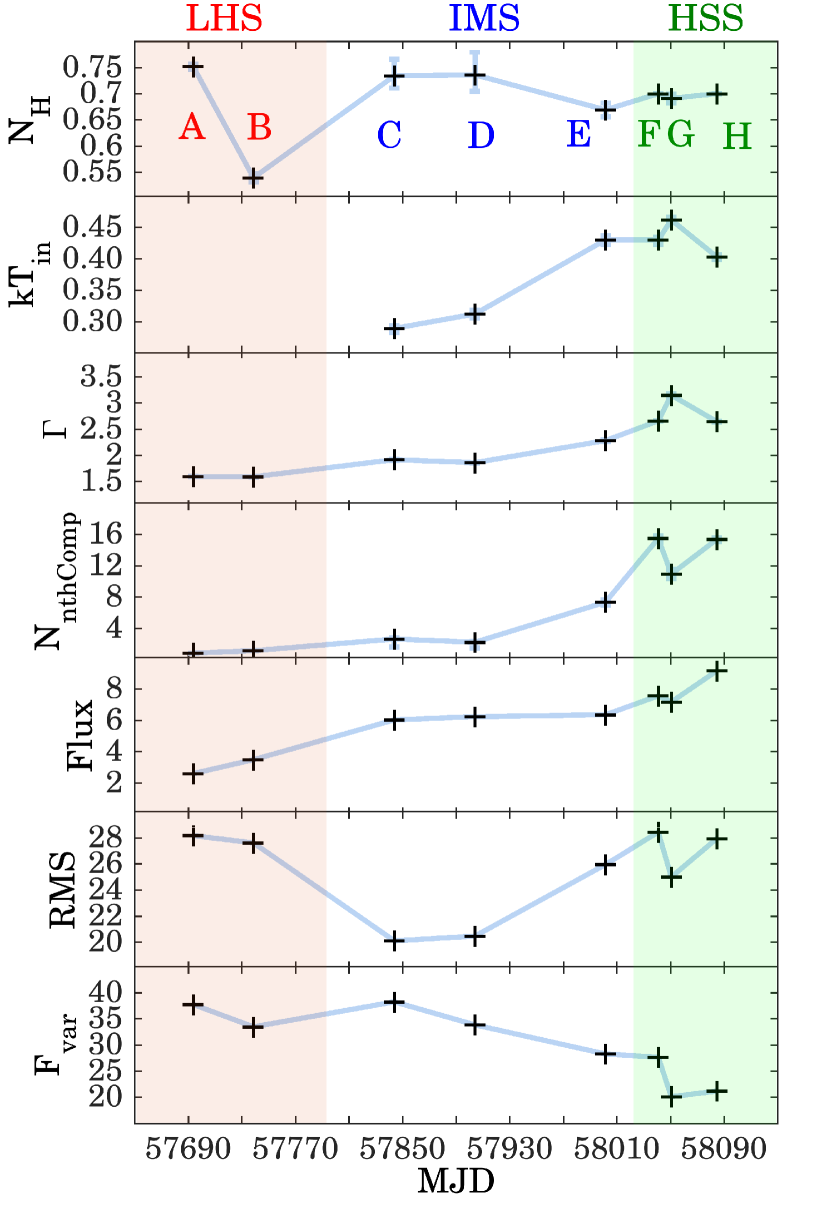
The spectral fit parameters obtained in the analysis evidently confirm that the spectral nature of the source evolved from LHS to HSS. Additionally, in order to identify the spectral states of the source, we define criteria based on the inner disk temperature (kTin) and photon index (). We classify observations with and no disk component, as LHS. Spectra that exhibit between along with kTin in range keV are identified as IMS. The observations with very steep values in and high kTin ranging in keV are classified as HSS. Hence, Obs A & B are classified as LHS, Obs C, D & E as IMS and Obs F, G, H & I are of HSS.
Moreover, the spectral fit parameters obtained for observation made by AstroSat on Oct (Obs G, MJD ) clearly indicate that Cygnus X-1 exhibits very soft nature as the spectrum has the highest inner disk temperature of and the steepest photon index of . Furthermore, we calculate the disk flux contribution in the total spectrum for all observations. It is found that Obs G spectrum has the largest disk flux contribution of in net flux in keV, which indicates dominance of the disk and major contribution of soft thermal component in the spectrum. These findings evidently suggest that Cygnus X-1 is in extremely soft spectral state. Also, during this observation, we notice that the MAXI hardness ratio drops to a very low value of (Figure 1), which further corroborates an extreme soft nature of the source. Studying the observed variability of MAXI hardness ratio of last years we infer that Cygnus X-1 possibly attains an ‘extreme’ soft state that has ever been recorded. It further motivates us to analyse and study timing properties with AstroSat observations.
4 Timing analysis and results
| Obs | RMSBLN | RMStotal | Fvar | (/dof) | ||||||||
|---|---|---|---|---|---|---|---|---|---|---|---|---|
| (FWHM) | (Hz) | (FWHM) | (Hz) | (FWHM) | (Hz) | (FWHM) | (%) | (%) | (%) | |||
| Obs A | - | |||||||||||
| Obs B | (fixed) | - | ||||||||||
| Obs C | - | - | - | - | ||||||||
| Obs D | - | - | - | - | ||||||||
| Obs E | - | - | - | - | - | - | - | - | ||||
| Obs F | - | - | - | - | - | - | ||||||
| Obs G | - | - | - | - | - | - | ||||||
| Obs H | - | - | - | - | - | - |
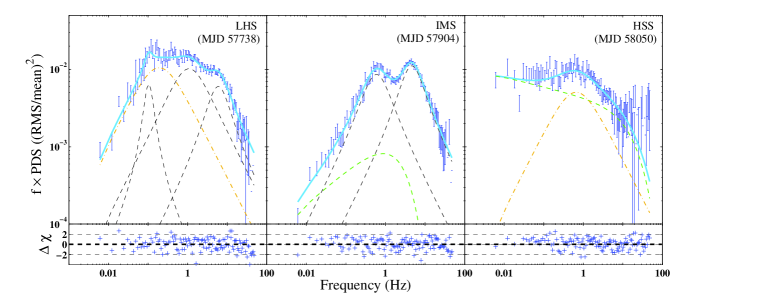
We track the evolution of temporal features of Cygnus X-1 strictly simultaneous to spectral observations. In order to study temporal features of source in different states, lightcurves of ms resolution from LAXPC20 data sets in the energy range from keV are extracted. Thereafter each lightcurve is divided in multiple intervals of timebins (equivalent to multiple sec long lightcurve segments) and then PDS is generated for each interval. The final PDS for each lightcurve is generated after averaging these individual PDS over entire observation. The averaged PDS is binned by a geometrical factor of in frequency space. Normalization for each PDS is similar to that of Belloni & Hasinger (1990); Miyamoto et al. (1992) where PDS is given in units of the squared fractional rms variability per frequency interval. Further, we represent the PDS in units of frequency times power (f Pf) versus frequency (Belloni et al., 1997). We consider frequency range upto Hz for modelling as beyond this in higher frequencies data is not reliable and may be affected by dead time correction.
We start with modelling of power density spectra of LHS (Obs A), with three Lorentzians since previous investigators (Pottschmidt et al., 2003; Axelsson et al., 2005; Misra et al., 2017) have shown that PDS of Cygnus X-1 in hard state can be well modelled with multiple Lorentzian profiles. One of the Lorentzians center is fixed to zero to represent broad band limited noise (BLN). This model gives a of . The residuals suggest requirement of a narrow Lorentzian feature below Hz. Hence an additional Lorentzian component is added to the model. Fit results in an improved value of . We consider this model as the best fit for LHS and similarly model other PDS of LHS obtained for Obs B. Fit results are shown in Figure 4 (left) and best fit parameters are given in Table 3. We calculate fractional root mean square (RMS) variability by integrating model over frequency range of Hz. An RMS value of is noted in LHS, of which contributes to BLN component. Further, PDS of IMS from Obs C and D are fitted with two Lorentzian as power spectra show only two broad features. A of results from the fit for Obs C. Residuals below Hz indicate a need of power-law to further improve the fit. Hence a cut-off power-law is incorporated in existing model which gives a of . Similar fit procedure is applied to PDS from Obs D. We calculate an RMS value of in PDS for these observations, which is lesser than that of LHS.
Moving onto softer spectral states observations, we notice that PDS are steep in nature. Hence PDS, obtained from Obs E to Obs H, are modelled with a cut-off power-law. We notice fit for Obs E results in of . The power-law index value is found to be . It is observed that RMS value increases to when compared that of Obs C & D. Obs F, G & H when fitted with power-law, show residual suggesting presence of BLN component. Addition of BLN component to power-law improves the fit significantly for Obs F & H and fits result in values of & , respectively. This improvement is moderate for Obs G with a value of . Overall fit for Obs G is shown in right panel of Figure 4. We notice fits give power-law index close to unity ( ).
Moreover, we observe during Obs G when spectral nature becomes the softest, cut-off power-law index is further steeper with an index of , when compared to that of other observations (Obs F and H) with soft spectral nature. In terms of RMS values Obs F & H have roughly same values of , while Obs G shows a lesser value of . Finally, we calculate the flux variability (, where S2, and are the variance, mean square error and arithmetic mean of time series representing lightcurve) for each observation following Vaughan et al. (2003). The calculated Fvar for various states are presented in Table 3.
5 The continuum-fitting and the softest state of Cygnus X-1
5.1 The Softest Nature of Cygnus X-1: AstroSat and Previous Observations
Cygnus X-1, although persistently remains in hard state but occasionally it transits to extreme soft states. The spectral analysis described in 3 indicates that AstroSat observation of Cygnus X-1 on Oct 24, 2017 (Obs G) is very distinctive in terms of spectral softness and the spectral characteristics, which exhibits an extremely soft nature. In order to carry out a comparative study of this soft nature of the source with previously reported as the softest state by Kawano et al. (2017) from Suzaku observations on May 07, 2013, an in-depth analysis of the AstroSat data is performed.
Firstly, MAXI-HR for Oct (MJD ) is obtained and it is compared with the same for May (MJD ). We find that MAXI-HR drops to during AstroSat observation, while the same corresponding to Suzaku observations is at higher value of (see Figure 1). The lower MAXI-HR value is an indicative of more soft energy photon flux relative to that of in hard energy. Secondly, LAXPC lightcurve is also examined and we obtain the hardness ratio (hereafter LAXPC-HR) of photon counts in energy range keV to keV. We choose these energy ranges as it is noted in the spectral analysis (3) that disk component extends upto keV whereas the photon flux in is attributed to Comptonisation component. Hence, the LAXPC-HR reflects variation of the relative contributions of disk component and Comptonised emission component in total spectrum with time. We notice a time interval where the LAXPC-HR remains about a minimum value of . Subsequently, SXT and LAXPC spectra from Obs G data are extracted for this time interval only. This extracted spectrum is further used to compare the spectral softness of the source with that of described in Kawano et al. (2017). We follow the same method adopted by Kawano et al. (2017) and fit an absorbed disk plus broken power-law model over LAXPC spectrum ( keV). The method, defining the spectral nature in Cygnus X-1, is prescribed by Wilms et al. (2006) and Grinberg et al. (2014), which is based on low energy index of broken power-law. The low energy photon index suggests the disk dominance over high energy tail. We estimate the low energy photon index , which is even higher than that of the softest state reported by Kawano et al. (2017) as 4.0. The model fitted LAXPC spectrum is shown in Figure 5.
Combining the results from these two methods, it is evident that Cygnus X-1 during AstroSat observation on MJD (Obs G) exhibits a minimum value of MAXI-HR and a steeper of low energy photon index () than those of during Suzaku observations. The two findings corroborate the highest contribution of soft disk component in total spectrum ever observed from the source.
5.2 Constraining the Spin of Cygnus X-1
| Components | Parameter | Obs G | Obs I | |
|---|---|---|---|---|
| Orbit 11212 | Orbit 11215 | Orbit 15548 | ||
| tbabs | NH | |||
| simpl | ||||
| fsc | ||||
| kerrbb | a∗ | |||
| MBH | (fixed) | (fixed) | (fixed) | |
| DBH | (fixed) | (fixed) | (fixed) | |
| (fixed) | (fixed) | (fixed) | ||
| f | ||||
| (/dof) | ||||
In previous sections (3.1 and 5.1), it is shown that the source exhibits an extreme soft state during AstroSat observations (Obs G). Further, the continuum-fitting method is employed and spectrum of HSS is modelled with relativistic model to estimate the spin. For relativistic modeling of spectrum, we follow Gou et al. (2014) and Kawano et al. (2017) and use constant * tbabs(simpl kerrbb + gaussian) model to fit the spectrum. simpl is a Comptonising convolution model, which produces power-law distribution in higher energies using soft seed photons from accretion disk independently irrespective of any shape or location of Comptonising medium (Steiner et al., 2009a). The simpl estimates two parameters, fsc and . fsc gives the fraction of seed photons up-scattered to power-law tail while estimates the steepness of this tail. kerrbb is a relativistic thin accretion disk model which includes self-irradiation and limb-darkening effects (Li et al., 2005). We switch off limb-darkening and apply zero torque condition at the inner boundary of the disk. Moreover, model is provided with updated measurements of distance to source (D), mass of the black hole (MBH) in the binary system and inclination of the binary plane (i) as mentioned in 1 and thus the normalization is fixed to unity. The other two parameters, namely accretion rate () and spectral hardening factor (f) are allowed to vary freely. The gaussian component is added to model the Iron line profile. Further, in order to achieve acceptable fit results, we correct for instrument features at and keV arising from SXT. Also, a broad absorption dip present at keV is modelled with smedge. The overall fit results in of . The model fitted spectrum is shown in Figure 6. is estimated as g s-1. Spectral hardening factor (f) is determined as , which is in good agreement with values suggested for stellar mass black holes (Shimura & Takahara, 1995). The scattering fraction fsc comes to be , which implies that the data is of good quality and it well satisfies the criterion for continuum-fitting method (Steiner et al., 2009b). The fit gives the power-law index () of , which is comparable with the estimate of by Kawano et al. (2017). This again indicates that during AstroSat observation Cygnus X-1 shows the weakest Comptonisation tail. The best fit gives an extreme value of the spin parameter as a, which is very close to the hard limit of kerrbb model. In order to estimate the errors on spin parameter we perform Monte Carlo (MC) simulations, which is discussed later in the section. Additionally, the similar fit procedure is applied to two more observations (Obs G, Orbit no. and Obs I) where spectra are suitable for spin estimations. Although these spectra have less steeper than that of Obs G (Orbit no. 11212), however, the fits give acceptable fsc values, which further made them reliable for spin estimation. The spectral fit parameters are provided in Table 4.

Further, to estimate the uncertainties in spin parameter values, obtained from each spectra, we perform MC simulations and generate 20000 sets of binary system parameters (MBH, i and D), as previous spin estimation works suggest that uncertainties in these three input parameters dominate over the errors resulting from kerrbb model (Gou et al., 2011; McClintock et al., 2014; Zhao et al., 2021). The sets are generated assuming independent Gaussian-distributions for each parameter. Subsequently, we calculate the look-up table of hardening factor (f), corresponding to each parameter set and then fit the spectra to determine spin parameters. This gives 20000 values of spin parameters per spectrum. We repeat this procedure on all three observations and finally, obtain respective histograms of a∗, which are shown in Figure 7. We consider the lowest spin parameter value of all the three observations, for the final estimation of spin as a at confidence level. We also calculate the spin parameter with a summed up histogram of all the observations, which also results into the similar value with confidence. The lower limits for and are and , respectively. Similar lower limits for individual spectrum are marked in Figure 7.
6 Discussion and Conclusion
AstroSat made several co-ordinated observations on Cygnus X-1, starting from to . Initially in the year the source is in low-hard state. In March, , the source starts to show signature of transition from the persistent low-hard state. The simultaneous and continuous monitoring by MAXI also exhibits a clear transition with a decreasing spectral hardness ratio value from its mean value of (see Figure 1). The hardness ratio consistently keeps decreasing till Oct, , while the source passes through intermediate state and attains a high-soft state. Cygnus X-1, in a period of about months starting from March, till Sept, 2017, completely transits to a high-soft state. The source remains in soft state for about two months. We observe that the hardness ratio of the source decreases to the lowest value of . From Nov, onwards, it is observed that there is increase in hardness ratio which marks the transition back to the low-hard state. Subsequently, the source shows flickering sequence of transitions from hard to soft states and vice versa (see Figure 1). AstroSat observations sample the transition of Cygnus X-1 in year from LHS to HSS via IMS (see Figure 1 and Table 1). We make use of data from SXT and LAXPC X-ray instruments on-board AstroSat and study the evolution of spectral and temporal properties of the source during the transition including hard and extreme soft states.
SXT & LAXPC combined spectra are modelled in – energy range. Spectra from LHS of Cygnus X-1 are modelled with absorbed non-thermal Comptonisation model (nthComp) with out any signature of thermal component in this state. Spectral indices () of are found to be in good agreement with usual LHS spectral index of Cygnus X-1 (Grinberg et al., 2014) as well as with other BH-XRBs (GX Nandi et al. (2012), IGR Radhika et al. (2018), 4U 1630-472 Baby et al. (2020)). In subsequent IMS, we find that spectral indices ( are steeper with values ranging in . Along with that there is an indication of thermal disk emission component (diskbb) with inner disk temperature (kTin) in range of keV. Further, during IMS, we note that with increase of spectral index, the inner disk temperature increases as well while the normalisation of disk component decreases. This could suggest that the disk approaches towards the central object. Subsequent observations in Oct, 2017 show that source is in HSS and the spectral indices are even steeper with values lying in . During HSS, from Obs G on Oct (MJD ), we find that spectral index of source is the steepest with along with an inner disk temperature (kTin) of keV. Similar steep spectral nature and inner disk temperature, during HSS of other BH-XRBs have been reported previously. For example, findings from the HSS of GX by Nandi et al. (2012) show an inner disk temperature and photon index of keV and respectively. Radhika et al. (2018) has shown for IGR that the inner disk temperature reaches upto keV in HSS. Further, we observe that the inner disk temperature increases consistently with increase in spectral index from LHS to HSS, which is shown in Figure 8. Along with this, we note that the fractional disk flux contributions in net spectra vary in during IMS to HSS. The maximum fractional disk contribution of is observed in Obs G of HSS. It is to be noted that the model with combination of diskbb and nthComp results in slightly higher values of (), indicating further investigation to improve modelling of the HSS spectra. Although, for uniformity and comparative study of spectral parameters we use the same model for all the states. Further, based on the inner disk temperature (kTin) and photon index () we classify the observed spectra into three states, namely, LHS, IMS and HSS (see 3.1 and Figure 8). We also estimate the unabsorbed flux keV energy range for all states (see Figure 8) and compare it with Eddington luminosity. We notice that luminosity of the source varies from to of Eddington luminosity (Ledd666For Cygnus X-1 L egs s-1) of Cygnus X-1. The luminosities during different states of the source are in good agreements with previous findings by Gou et al. (2011); Yamada et al. (2013); Gou et al. (2014); Tomsick et al. (2014); Walton et al. (2016); Basak et al. (2017); Tomsick et al. (2018).
Also, we examine the power density spectra (PDS) of Cygnus X-1 simultaneous to spectral analysis. PDS of LHS & IMS show multiple broad lorentzians features along with band limited noise. In soft states of the source, we observe that broad features are absent and PDS show a steep cut-off power-law with index of and again a band limited noise is present. The temporal features of Cygnus X-1 are in good agreement with previous studies by (Pottschmidt et al., 2003; Axelsson et al., 2005; Misra et al., 2017). Non-detection of QPO like features in HSS of Cygnus X-1 is quite common as the featureless PDS are observed in other BH-XRBs too (see Radhika & Nandi (2014); Nandi et al. (2018) for XTE J, Radhika et al. (2016) for V Cyg, Belloni et al. (2005); Nandi et al. (2012) for GX ).
Furthermore, we highlight the results of Obs G of HSS as it’s PDS shows the steepest power-law index with a value of . Also the band limited noise show the largest FWHM of Hz. We also calculate the flux variability (Fvar) in lightcurves during all the observations and note an anti-correlation with corresponding RMS calculated from PDS modelling (see Figure 8). The variation of RMS is also noticed with spectral index (), which agrees to that of Grinberg et al. (2014). During HSS, an RMS value of is observed which is comparable to that of in LHS. Display of such high RMS is a typical characteristics of Cygnus X-1 (Grinberg et al., 2014) and unlike the general nature of BH-XRBs (Belloni, 2010), RMS does not drop to very low values. For example, GX and IGR exhibit a low RMS of in HSS (Nandi et al., 2012; Radhika et al., 2018). Recently, Sreehari et al. (2020) show in case of HSS of GRS , a total RMS less than .
Moreover, we find that the high-soft state of Cygnus X-1 is unprecedented and AstroSat on Oct (MJD ) observed the source in an extremely soft state. We compare the soft nature of source during AstroSat era with previously reported the softest state of Cygnus X-1 by Kawano et al. (2017) with Suzaku observations on May (MJD ). We note the following two criteria for the comparison. Firstly, the hardness ratio obtained from MAXI on MJD 58050 with the lower value of indicates the AstroSat observations are softer than that of during Suzaku observations. Secondly, we adopt similar method of modelling spectra with broken power law in range keV as adopted by Kawano et al. (2017). We find that the low energy photon index () of broken power-law is even steeper with a value of than that of estimated by Kawano et al. (2017) as , which confirms the largest contribution of disk component in net spectrum ever recorded. Hence, in this work, we confirm the softest state of Cygnus X-1 ever observed. It is to be noted that Cygnus X-1 occasionally enters in a high-soft state and it has never reached ’canonical’ soft state.
Further, we make use of the high quality data from AstroSat observations of the softest state of the source to constrain the spin of black hole as the spectra are dominated with disk component and are suitable for continuum-fitting (CF) method. We fit the spectra with kerrbb convoluted with simpl in order to constrain the spin parameter (a∗) of the black hole. Furthermore, we perform MC simulations to estimate the uncertainty in a∗, combining the errors in the binary system parameters, MBH, i and D. We report the spin parameter of Cygnus X-1 as a at confidence level, which suggests an extreme spin of the black hole in Cygnus X-1.
We compare the spin measurement results with those obtained by Zhao et al. (2021) recently, as a. The spin estimation in this work is in good agreement with their results. Also, Zhao et al. (2020) applied CF method on large set of spectra obtained from HXMT and estimated lower limit of the spin parameter as a using revised values of MBH, i and D.
Previously, Gou et al. (2014) employed CF method and estimated a at a confidence level of . Kawano et al. (2017) determined a with similar method using data from Suzaku. Spin estimation by Tomsick et al. (2014) with with Fe-Kα line fitting method using Suzaku and NuSTAR data resulted as a ( confidence level).
Focusing on other parameters of best-fit, we state that the scattering fraction (fsc) comes to be . Furthermore, we observe from spectral fit that the luminosity of the disk component is consistent in HSS with L/LEdd . These parameters satisfy the criterion for application of continuum-fitting method to produce reliable results as stated in 1.
Moreover, these results of continuum-method are based on Novikov-Thorne model. The model assumes a zero torque which introduces uncertainties in spin estimation. These uncertainties are very small as a∗ tends to unity. Also, the model originated errors are much smaller than the errors in measurements of MBH, i and D, which is important in case of thin disks. Another possible error can be from pile-up in SXT detector during high flux soft states. In order to estimate pile-up, we fit only LAXPC spectra to find out any spectral hardening from pile-up. It is observed that photon index varies by less that , which is expected due to channel difference in two detectors. Hence, we conclude that spin estimations obtained are fairly reliable.
In order to summarize, in this paper, we present an in-depth spectral and timing analysis results obtained from AstroSat observations of Cygnus X-1 during transition from hard state to soft state via intermediate states. Moreover, we confirm the detection of the ‘softest’ nature ever observed from the source with AstroSat. We make use of the high quality spectral data of the softest state to constrain the spin parameter of the black hole. Finally, considering the present estimates of spin and mass, we conclude that Cygnus X-1 is a maximally rotating, massive black hole binary source. This compact nature echoes to that of the enigmatic galactic black hole source GRS , which represents a standard template for BH-XRBs (Sreehari et al., 2020).
Acknowledgements
We are thankful to the anonymous referee for giving valuable suggestions to improve on spin estimation results. We also thank Sreehari from Indian Institute of Astrophysics (IIA) for his help in modelling. This publication uses the data from the AstroSat mission of the Indian Space Research Organisation (ISRO), archived at the Indian Space Science Data Centre (ISSDC). This work has used the data from the Soft X-ray Telescope (SXT) developed at TIFR, Mumbai, and the SXT POC at TIFR is thanked for verifying and releasing the data and providing the necessary software tools. This work has also used the data from the LAXPC Instruments developed at TIFR, Mumbai, and the LAXPC POC at TIFR is thanked for verifying and releasing the data. We thank the AstroSat Science Support Cell hosted by IUCAA and TIFR for providing the LaxpcSoft software which we used for LAXPC data analysis. Authors thank GH, SAG; DD, PDMSA and Director, URSC for encouragement and continuous support to carry out this research.
Data availability statement
Data used for this work are available at AstroSat-ISSDC website (http://astrobrowse.issdc.gov.in/astro_archive/archive), and MAXI website (http://maxi.riken.jp/top/index.html).
References
- Abramowicz & Kluźniak (2001) Abramowicz M. A., Kluźniak W., 2001, A&A, 374, L19
- Agrawal (2006) Agrawal P. C., 2006, Advances in Space Research, 38, 2989
- Agrawal & Nandi (2020) Agrawal V. K., Nandi A., 2020, MNRAS, 497, 3726
- Agrawal et al. (2017) Agrawal P. C., et al., 2017, Journal of Astrophysics and Astronomy, 38, 30
- Agrawal et al. (2018) Agrawal V. K., Nandi A., Girish V., Ramadevi M. C., 2018, MNRAS, 477, 5437
- Agrawal et al. (2020) Agrawal V. K., Nandi A., Ramadevi M. C., 2020, Ap&SS, 365, 41
- Antia et al. (2017) Antia H. M., et al., 2017, ApJS, 231, 10
- Antia et al. (2021) Antia H. M., et al., 2021, arXiv e-prints, p. arXiv:2101.07514
- Axelsson et al. (2005) Axelsson M., Borgonovo L., Larsson S., 2005, A&A, 438, 999
- Baby et al. (2020) Baby B. E., Agrawal V. K., Ramadevi M. C., Katoch T., Antia H. M., Mandal S., Nandi A., 2020, MNRAS, 497, 1197
- Bardeen et al. (1972) Bardeen J. M., Press W. H., Teukolsky S. A., 1972, ApJ, 178, 347
- Basak et al. (2017) Basak R., Zdziarski A. A., Parker M., Islam N., 2017, MNRAS, 472, 4220
- Belloni (2010) Belloni T. M., 2010, States and Transitions in Black Hole Binaries. p. 53, doi:10.1007/978-3-540-76937-8_3
- Belloni & Hasinger (1990) Belloni T., Hasinger G., 1990, A&A, 227, L33
- Belloni et al. (1997) Belloni T., van der Klis M., Lewin W. H. G., van Paradijs J., Dotani T., Mitsuda K., Miyamoto S., 1997, A&A, 322, 857
- Belloni et al. (2005) Belloni T., Homan J., Casella P., van der Klis M., Nespoli E., Lewin W. H. G., Miller J. M., Méndez M., 2005, A&A, 440, 207
- Bolton (1972) Bolton C. T., 1972, Nature Physical Science, 240, 124
- Chakrabarti & Titarchuk (1995) Chakrabarti S., Titarchuk L. G., 1995, ApJ, 455, 623
- Churazov et al. (2001) Churazov E., Gilfanov M., Revnivtsev M., 2001, MNRAS, 321, 759
- Dihingia et al. (2019) Dihingia I. K., Das S., Nandi A., 2019, MNRAS, 484, 3209
- Dovčiak et al. (2008) Dovčiak M., Muleri F., Goosmann R. W., Karas V., Matt G., 2008, MNRAS, 391, 32
- Foreman-Mackey et al. (2013) Foreman-Mackey D., Hogg D. W., Lang D., Goodman J., 2013, PASP, 125, 306
- Gierliński et al. (1999) Gierliński M., Zdziarski A. A., Poutanen J., Coppi P. S., Ebisawa K., Johnson W. N., 1999, MNRAS, 309, 496
- Goodman & Weare (2010) Goodman J., Weare J., 2010, Communications in Applied Mathematics and Computational Science, 5, 65
- Gou et al. (2009) Gou L., et al., 2009, ApJ, 701, 1076
- Gou et al. (2011) Gou L., et al., 2011, ApJ, 742, 85
- Gou et al. (2014) Gou L., et al., 2014, ApJ, 790, 29
- Grinberg et al. (2014) Grinberg V., et al., 2014, A&A, 565, A1
- Homan & Belloni (2005) Homan J., Belloni T., 2005, Ap&SS, 300, 107
- Homan et al. (2001) Homan J., Wijnands R., van der Klis M., Belloni T., van Paradijs J., Klein-Wolt M., Fender R., Méndez M., 2001, ApJS, 132, 377
- Kawano et al. (2017) Kawano T., Done C., Yamada S., Takahashi H., Axelsson M., Fukazawa Y., 2017, PASJ, 69, 36
- Li et al. (2005) Li L.-X., Zimmerman E. R., Narayan R., McClintock J. E., 2005, ApJS, 157, 335
- Ling et al. (1983) Ling J. C., Mahoney W. A., Wheaton W. A., Jacobson A. S., Kaluzienski L., 1983, ApJ, 275, 307
- Mandal & Chakrabarti (2007) Mandal S., Chakrabarti S. K., 2007, Ap&SS, 309, 305
- McClintock et al. (2006) McClintock J. E., Shafee R., Narayan R., Remillard R. A., Davis S. W., Li L.-X., 2006, ApJ, 652, 518
- McClintock et al. (2014) McClintock J. E., Narayan R., Steiner J. F., 2014, Space Sci. Rev., 183, 295
- Mihara et al. (2011) Mihara T., et al., 2011, PASJ, 63, S623
- Miller-Jones et al. (2021) Miller-Jones J. C. A., et al., 2021, Science, 371, 1046
- Misra et al. (2017) Misra R., et al., 2017, ApJ, 835, 195
- Mitsuda et al. (1984) Mitsuda K., et al., 1984, PASJ, 36, 741
- Miyamoto et al. (1992) Miyamoto S., Kitamoto S., Iga S., Negoro H., Terada K., 1992, ApJ, 391, L21
- Nandi et al. (2012) Nandi A., Debnath D., Mandal S., Chakrabarti S. K., 2012, A&A, 542, A56
- Nandi et al. (2018) Nandi A., et al., 2018, Ap&SS, 363, 90
- Novikov & Thorne (1973) Novikov I. D., Thorne K. S., 1973, in Black Holes (Les Astres Occlus). pp 343–450
- Orosz et al. (2011) Orosz J. A., McClintock J. E., Aufdenberg J. P., Remillard R. A., Reid M. J., Narayan R., Gou L., 2011, ApJ, 742, 84
- Parker et al. (2015) Parker M. L., et al., 2015, ApJ, 808, 9
- Pottschmidt et al. (2003) Pottschmidt K., et al., 2003, A&A, 407, 1039
- Radhika & Nandi (2014) Radhika D., Nandi A., 2014, Advances in Space Research, 54, 1678
- Radhika et al. (2016) Radhika D., Nandi A., Agrawal V. K., Seetha S., 2016, MNRAS, 460, 4403
- Radhika et al. (2018) Radhika D., Sreehari H., Nandi A., Iyer N., Mandal S., 2018, Ap&SS, 363, 189
- Rao et al. (2016) Rao A. R., Singh K. P., Bhattacharya D., 2016, arXiv e-prints, p. arXiv:1608.06051
- Reid et al. (2011) Reid M. J., McClintock J. E., Narayan R., Gou L., Remillard R. A., Orosz J. A., 2011, ApJ, 742, 83
- Remillard & McClintock (2006) Remillard R. A., McClintock J. E., 2006, ARA&A, 44, 49
- Reynolds (2014) Reynolds C. S., 2014, Space Sci. Rev., 183, 277
- Schnittman & Krolik (2009) Schnittman J. D., Krolik J. H., 2009, ApJ, 701, 1175
- Shakura & Sunyaev (1973) Shakura N. I., Sunyaev R. A., 1973, A&A, 500, 33
- Shimura & Takahara (1995) Shimura T., Takahara F., 1995, ApJ, 445, 780
- Singh et al. (2014) Singh K. P., et al., 2014, ASTROSAT mission. p. 91441S, doi:10.1117/12.2062667
- Singh et al. (2016) Singh K. P., et al., 2016, In-orbit performance of SXT aboard AstroSat. p. 99051E, doi:10.1117/12.2235309
- Singh et al. (2017) Singh K. P., et al., 2017, Journal of Astrophysics and Astronomy, 38, 29
- Sreehari et al. (2019) Sreehari H., Ravishankar B. T., Iyer N., Agrawal V. K., Katoch T. B., Mandal S., Nand i A., 2019, MNRAS, 487, 928
- Sreehari et al. (2020) Sreehari H., Nandi A., Das S., Agrawal V. K., Mandal S., Ramadevi M. C., Katoch T., 2020, arXiv e-prints, p. arXiv:2010.03782
- Steiner et al. (2009a) Steiner J. F., Narayan R., McClintock J. E., Ebisawa K., 2009a, PASP, 121, 1279
- Steiner et al. (2009b) Steiner J. F., McClintock J. E., Remillard R. A., Narayan R., Gou L., 2009b, ApJ, 701, L83
- Tanaka & Lewin (1995) Tanaka Y., Lewin W. H. G., 1995, in X-ray Binaries. pp 126–174
- Tanaka et al. (1995) Tanaka Y., et al., 1995, Nature, 375, 659
- Titarchuk (1994) Titarchuk L., 1994, ApJ, 434, 570
- Tomsick et al. (2014) Tomsick J. A., et al., 2014, ApJ, 780, 78
- Tomsick et al. (2018) Tomsick J. A., et al., 2018, ApJ, 855, 3
- Vadawale et al. (2016) Vadawale S. V., et al., 2016, In-orbit performance AstroSat CZTI. p. 99051G, doi:10.1117/12.2235373
- Vaughan et al. (2003) Vaughan S., Edelson R., Warwick R. S., Uttley P., 2003, MNRAS, 345, 1271
- Verdhan Chauhan et al. (2017) Verdhan Chauhan J., et al., 2017, ApJ, 841, 41
- Walborn (1973) Walborn N. R., 1973, ApJ, 179, L123
- Walton et al. (2016) Walton D. J., et al., 2016, ApJ, 826, 87
- Webster & Murdin (1972) Webster B. L., Murdin P., 1972, Nature, 235, 37
- Wilms et al. (2000) Wilms J., Allen A., McCray R., 2000, ApJ, 542, 914
- Wilms et al. (2006) Wilms J., Nowak M. A., Pottschmidt K., Pooley G. G., Fritz S., 2006, A&A, 447, 245
- Xiang et al. (2011) Xiang J., Lee J. C., Nowak M. A., Wilms J., 2011, ApJ, 738, 78
- Yadav et al. (2016a) Yadav J. S., et al., 2016a, ApJ, 833, 27
- Yadav et al. (2016b) Yadav J. S., et al., 2016b, Large Area X-ray Proportional Counter (LAXPC) instrument onboard ASTROSAT. p. 99051D, doi:10.1117/12.2231857
- Yamada et al. (2013) Yamada S., Makishima K., Done C., Torii S., Noda H., Sakurai S., 2013, PASJ, 65, 80
- Zdziarski et al. (1996) Zdziarski A. A., Johnson W. N., Magdziarz P., 1996, MNRAS, 283, 193
- Zhang et al. (1997) Zhang S. N., Cui W., Chen W., 1997, ApJ, 482, L155
- Zhao et al. (2020) Zhao X.-S., et al., 2020, Journal of High Energy Astrophysics, 27, 53
- Zhao et al. (2021) Zhao X., et al., 2021, ApJ, 908, 117