pnasresearcharticle \leadauthorRan
Bacteria hinder large-scale transport and enhance small-scale mixing in time-periodic flows
Abstract
Understanding mixing and transport of passive scalars in active fluids is important to many natural (e.g. algal blooms) and industrial (e.g. biofuel, vaccine production) processes. Here, we study the mixing of a passive scalar (dye) in dilute suspensions of swimming Escherichia coli in experiments using a two-dimensional (2D) time-periodic flow and in a simple simulation. Results show that the presence of bacteria hinders large scale transport and reduce overall mixing rate. Stretching fields, calculated from experimentally measured velocity fields, show that bacterial activity attenuates fluid stretching and lowers flow chaoticity. Simulations suggest that this attenuation may be attributed to a transient accumulation of bacteria along regions of high stretching. Spatial power spectra and correlation functions of dye concentration fields show that the transport of scalar variance across scales is also hindered by bacterial activity, resulting in an increase in average size and lifetime of structures. On the other hand, at small scales, activity seems to enhance local mixing. One piece of evidence is that the probability distribution of the spatial concentration gradients is nearly symmetric with a vanishing skewness. Overall, our results show that the coupling between activity and flow can lead to nontrivial effects on mixing and transport.
keywords:
swimming microbes transport chaotic mixing active matterdoi:
To whom correspondence should be addressed. E-mail: parratia@seas.upenn.eduThis manuscript was submitted to PNAS on July 30, 2021.
Swimming microorganisms often live in environments with fluid flows across a range of length scales, from natural habitats like oceans to industrial biofuel plants to human intestines (1). Flow can exert forces and torques on microorganisms, which can affect their locomotion and transport (2). Microorganisms, conversely, adapt their swimming directions and take advantage of flow gradients in order to forage and reproduce (3). This coupling between activity (i.e. swimming motion) and flow leads to intriguing physical phenomena that are not seen for passive particles, such as rheotaxis (4, 5), gyrotaxis (6, 7), and flow-induced chemotaxis (8, 9).
Even simple flows, such as shear flows, can profoundly alter the movement of microswimmers (10, 11, 12). Experiments show motile bacteria can drift across streamlines out of the plane of shear (5), escape the low-shear regions and get trapped in high-shear regions (10). Motile phytoplankton are found to deplete or accumulate in regions of different shear rates (11), and form intense cell assemblages called “thin layers”(12). Under quiescent flow condition, microswimmers can still induce fluctuating velocity fields in the fluid by moving collectively (13, 14). These self-induced flows can lead to unique properties in fluids laden with active particles, or namely “active suspensions”. Examples include enhanced Brownian diffusivity (15, 16, 17), active fluid transport and mixing (18, 19, 20), and even the possibility of work extraction (21, 22).
In more complex flows, the behavior of microswimmers shows rich dynamics but is much less understood. In turbulent flows, gyrotactic swimmers are found to cluster in small-scale patches (23, 6), and gather in regions of positive velocity gradients (24). Numerical simulations in 3D isotropic turbulence show that elongated swimmers preferentially align with flow velocity (25), and clustering and patchiness are greatly reduced (26). In chaotic flows, simulations show that rod-like swimmers can be trapped or expelled by elliptic islands (27), i.e. KAM tori (28), depending on their shapes and swimming speeds. The trapping of particles in elliptic islands can even lead to a reduction in swimmer transport (29, 30). Recently, a study on the steady flow in model porous media show that bacteria align and accumulate with Lagrangian structures (31). However, how these dynamics affect mixing and transport in flows exhibiting chaotic advection are yet to be experimentally tested. Moreover, most simulations treat swimmers as self-propelled particles that do not feedback on the flow, and the effects of activity on flow are far less explored.
In this contribution, we experimentally investigate how swimming bacteria affect the transport and mixing of a passive scalar in a time-periodic chaotic flow. Dye experiments show that bacteria can significantly hinder large-scale transport and global mixing rates. These results are further characterized by computing the stretching fields from experimentally measured velocity fields, which show that bacteria attenuates large-amplitude fluid stretching. This leads to a lower mean finite-time Lyapunov exponent, indicating that activity also decreases flow chaoticity. At small scales, however, bacteria activity can substantially increase local mixing. These two effects lead to a new balance in the dynamical system characterized by a delay in the formation of persistent structures that are overall more homogeneous. A simple numerical simulation reveals the potential mechanism for the experimental phenomena being the transient accumulation of swimming particles along the unstable manifolds of the flow.
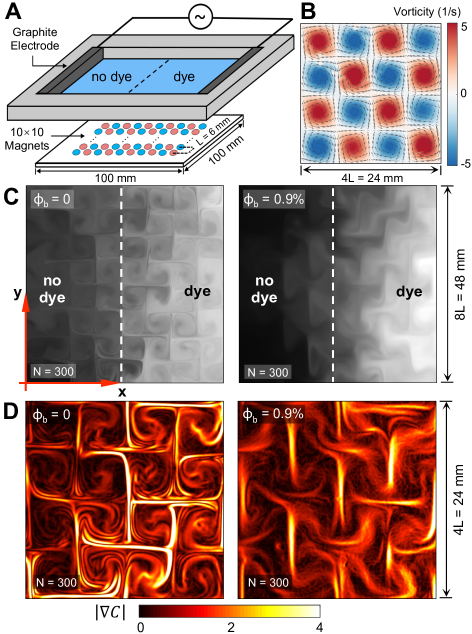
We use the flow cell setup (32, 33) to create a two-dimensional mixing flow with time-periodic magnetic forcing (Fig. 1A; see SI Appendix for details). As a sinusoidal voltage is imposed, the induced Lorentz forces in the fluid create a vortex array of alternating vorticity (Fig. 1B). The size of each vortex corresponds to the magnets spacing, = 6 mm. The flow is characterized by two dimensionless numbers. The first is the Reynolds number, , where is the root mean square (RMS) velocity, and is the fluid kinematic viscosity. The second is the path length, , with being the driving frequency of the flow, which describes the normalized mean displacement of a typical fluid parcel in one period. To better contrast the effects of bacterial activity, we keep the and at approximately 14.0 and 2.3 in all our experiments, respectively. These conditions (, ) are known to produce chaotic mixing (33, 34), even though the flow preserves spatial and temporal symmetries.
The effects of activity are investigated by adding swimming E. coli to the buffer solution (see Materials and Methods). The swimming speed of the bacteria ranges from 10 - 20 m/s (35). The bacteria volume fraction is adjusted from 0% (pure buffer) to 0.9%; experiments with non-motile bacteria are performed at . This volume fraction range is considered dilute (36), without introducing large-scale collective motion. We note that the active Péclet number, , is much larger than unity (), where is the effective diffusivity of E. coli (37). Passive dye mixing experiments are performed by adding a minute amount of fluorescent dye to the fluid. Initially, the flow cell is partitioned by a solid barrier into two halves, one with and one without dye (Fig. 1C). The barrier is then lifted and dye penetrates to the undyed portion with time or number of cycles . The duration of each experiment is approximately 30 minutes or , over which the bacterial motility remains roughly constant (See SI Appendix, Fig. S11). We also perform particle tracking velocimetry (PTV) to obtain the velocity fields of the flow (Fig. 1B; see Materials and Methods).
An example of the effects of the bacteria on dye mixing is shown in Fig. 1C, for pure buffer () and an active suspension (). The snapshots are taken at (see Movie S1 - S2 and SI Appendix, Fig. S1 for other times and non-motile data). A comparison between the two snapshots reveals that, in the presence of motile bacteria, the dye penetrates to the undyed region much slower than the buffer and non-motile (Fig. S1) cases. This indicates that bacterial activity is hindering large-scale (dye) mixing and transport. A closer look at the images show that finer dye structures within a vortex cells are also modified when motile bacteria is present; bacterial activity leads to smoother and less structured concentration fields. Normalized concentration gradients fields (Fig. 1D) show that, for both cases, gradients are steeper near the flow separatrices (see Fig S3 for non-motile case). This suggests the passive scalar is transported by regions of highest flow strain or material stretching (32, 38). However, the gradient fields in the active case () are broader and coarser, suggesting a higher diffusion with bacterial activity. These observations are consistent for all bacterial volume fractions investigated here (see SI Appendix, Fig. S2 for other and non-motile data). These experiments indicate that the presence of swimming bacteria affect both large-scale transport and small-scale mixing of the passive scalar in the time-periodic flow.
The overall mixing rate can be characterized by the variance of dye concentration field, , where denotes the spatial ensemble average. We find an exponential decay of the normalized with time or for all cases (Fig. 2A), a behavior that is consistent with observations in (time-periodic) chaotic flows (39, 33); solid lines are exponential fits to the data, , for . We note that the decay is slower as is increased, which is quantified by a linear decrease in mixing rate with (Fig. 2A, Inset). We expect the linearity to breakdown for non-dilute bacterial suspension due to hydrodynamic interaction and collective behavior. The mixing rate for the non-motile case is nearly
double that of the active case at the same . This indicates that the observed decrease in large scale mixing is not simply a viscous effect, since the addition of passive rod-like particles to the fluid will only lead to an increase in viscosity of 3% (see SI Appendix). We also observe the mixing slows down and deviate from the exponential decay at later times (). This slower decay mode or mixing rate is governed by longest wavelength in the flow (33), and it sets in earlier for active suspensions. These results show that bacteria activity hinders large-scale transport and decreases the global mixing rates of a passive scalar in time-periodic flows.
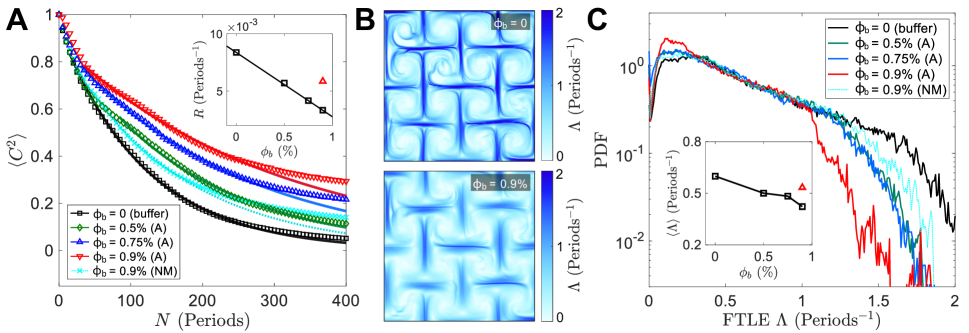
A key property of flows exhibiting chaotic advection is the exponential divergence of nearby trajectories in real space, usually characterized by the largest finite-time Lyapunov exponent (FTLE) over a time interval . One can relate to the stretching experienced by a fluid parcel by considering the deformation of an infinitesimal circular fluid element initially located at . The stretching is defined as the ratio of the final major diameter (after ) to its initial diameter, and . Here, stretching fields are computed from experimentally measured velocity fields (see SI Appendix for details). Two different quantities are computed at each point, namely past and future stretching. These quantities, past and future stretching, tend to be large on the unstable and stable manifolds of the hyperbolic fixed points of the Poincaré map, respectively (40). The past stretching fields for both the buffer and active suspension () are highly heterogeneous, being much larger along the flow separatrices near hyperbolic points (Fig. 2B, see Fig. S5 for non-motile case). While the structure of the field are relatively similar for all cases, stretching is clearly attenuated for the active case, particularly at regions of large stretching. Indeed, the probability distribution of stretching shows that bacteria systematically suppress large values of stretching (Fig. 2C). Note that the probability function shifts and decays at lower stretching values (than buffer and non-motile cases) as the concentration of motile bacteria is increased. This behavior is captured by computing the spatially averaged FTLE, which decreases as bacterial concentration increases (Fig. 2C, Inset). Similar to the mixing rate results, the non-motile case shows larger value of compare to active case at same . Overall, these results show that bacteria hinders large scale transport and mixing by suppressing the stretching of fluid elements.
The effects of bacteria activity across different length scales are examined by the spatial power spectrum of dye concentration field, , (see SI Appendix for details). The spectra characterize the fluctuation of the scalar field across wavenumbers (41, 42), whose total spectral power is the scalar variance . An example of for the buffer, non-motile, and active cases measured at is shown in Fig. 3A (see SI Appendix, Fig. S8 for at other times). We observe a power law of that spans a substantial range of , including wavenumbers above and below . Here, is the energy injection scale, as shown by peaks in the spectra, and is the viscous cutoff scale (43), estimated by setting the local Reynolds number . We find that the spectral power increases nearly uniformly with in the range of , while the change in logarithmic slope is more apparent at smaller scales, . Note that the area under is larger for active suspensions, which is consistent with a larger remaining scalar variance (Fig. 2A). The increases in the total spectral power with suggest the rate of transfer of scalar variance from large scale (low ) to small scale (high ) is hindered by bacterial activity compared to the buffer and non-motile cases.
We now focus on large-scale structures in the scalar field by computing the spatial autocorrelation function, defined as:
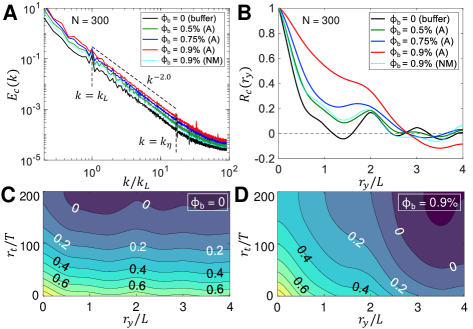
, where is the direction normal to the mean scalar gradient set by the initial condition (see Fig. 1C). The correlation is plotted for different as well as buffer and non-motile cases in Fig. 3B, which shows (bacterial) activity leads to increasingly stronger spatial correlations, especially at (within 2 vortex cells). The increase in the spatial correlation indicates the persistence of larger structures in the concentration field even after relatively long time at . This result suggests the stretching and folding mechanism responsible for creating thinner striations is hindered by bacterial activity, consistent with stretching field measurements. While we find long-range correlations and spatial symmetries in the scalar fields in the buffer and non-motile cases (peaks at , ), these are nearly erased by bacterial activity (). The absence of such peaks suggests that spatial periodicity of large-scale structures is broken by the bacterial activity.
Next, we examine the time evolution of dye structures by computing the spatial-temporal autocorrelation function . For the buffer case, the contour plots of quickly develop an invariant sh-
ape, and the decay of the correlation with time is nearly uniform in space for all (Fig. 3C). The initially formed invariant structures become decorrelated for due to diffusion. However, for the case, we find that structures decorrelate much slower in time; correlations in the range remain relatively high up to 200 periods. We believe that, for (larger than 2 vortex cells), the structures are decorrelated due to local stochastic behavior of bacteria activity in each vortex cell (this will be discussed in more detail later). This slow decay in correlation shows the presence of larger structures in the concentration field, which are less susceptible to diffusion. Taken together, these results show that bacterial activity leads to a decrease in long-range spatial correlation but an increase in temporal correlation. The structures created by the flow of these active fluids are coarser and more long-lasting than the passive case.
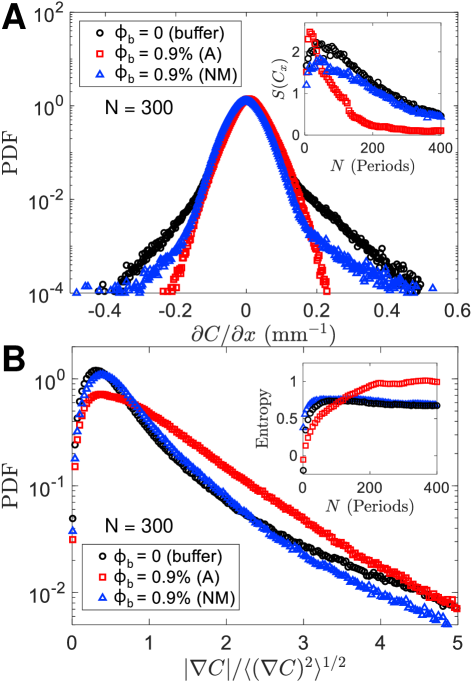
So far we have shown that bacterial activity can hinder large-scale transport and mixing by hindering the production of fine structures that decorrelate faster in time. To gain insights into mixing small scales, we examine the scalar gradient fields (Fig. 1D). We further quantify the results by computing the probability density function (PDF) of the partial scalar gradient (Fig. 4A), whose skewness is an indicator of the local isotropy of scalar fields (44). Here, is defined as the direction of the mean scalar gradient (see Fig. 1C). These PDFs have a non-Gaussian core with exponential tails at high gradient values. Remarkably, we find the PDF for active suspension () is nearly symmetric, while the PDFs for the buffer and non-motile bacteria suspension are asymmetric. Further calculations show the skewness values in the active suspension decrease by an order of magnitude relative to the buffer and non-motile cases (Fig. 4A, Inset). The active suspension has a vanishing steady state skewness of 0.09, suggesting that the scalar field is almost isotropically distributed at small scales. This result is unexpected since local isotropy of scalar fields is rarely observed; the skewness of is at the order of unity (rather than zero) even at geophysical Reynolds number (44, 45). Stronger mixing at the “swimmer” scale was previously proposed (15, 16, 17), mostly by observing an increase in particle mean-square-displacement (MSD) and effective diffusivity in quiescent flows. Here, in the presence of an imposed flow, we show that the swimmer-flow interaction can even lead to local isotropy in the scalar field.
The effectiveness of the mixing process at the finer scales can be characterized by the PDF of the magnitude of scalar gradient , normalized by to compensate for the decay of contrast (Fig. 4B). These PDFs reach invariant forms with time (see SI Appendix, Fig. S9) that have a nonzero mean and a notably exponential tail. The invariant form is also known as “persistent pattern” that is typical for time-periodic mixing (39). And exponential distribution at high gradients are expected for a passive scalar subjected to a mean gradient undergoing random advection (46, 47, 48). Here, however, we show that the active suspension () reaches a distinct invariant form than the buffer and non-motile cases, characterized by a longer and more pronounced exponential tail. It suggests that bacteria activity may be enhancing the randomness of the local advection of dye. Moreover, bacteria can also delay the formation of the invariant form by as much as 100 periods relative to the buffer and non-motile cases, which is captured by the differential entropy of the PDFs (Fig. 4B, Inset, see SI Appendix for the calculation). This is because stretching is adversely affected by the activity. The balance between these two effects, i.e. the decrease in stretching and the enhancement in diffusion, leads to a slower yet better small-scale mixing, as shown by a larger entropy in the active suspension (Fig. 4B, Inset, ).
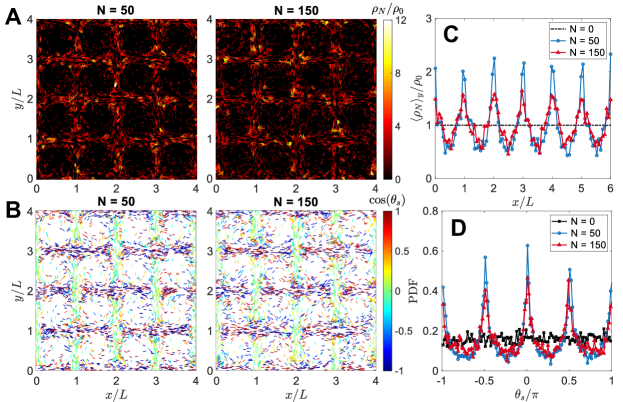
To gain further insight into these results, we perform numerical simulations of swimming particles in the flow (See Materials and Methods for details). Initially, swimmers are uniformly distributed in the simulation domain with random orientations. As the simulation begins, we see strong accumulation of particles along the flow unstable manifolds (Fig. 2B) at an early time of ; this is also shown by the number density pattern in Fig. 5A (see Movie S3 for the transient). The local particle number density at is an order of magnitude larger than the initial density . At a later time of , the particle accumulation reduces as the number density patterns grow wider and more disperse (Fig. 5A, right panel). This transient behavior is further quantified by the one-dimensional number density profile (Fig. 5C). Swimming particles, initially evenly distributed, form strong peaks at each multiple of where unstable manifolds are located. These peaks becomes weaker when particle distribution becomes more disperse at later times.
Simulation results also show that swimmers align with the unstable manifolds as characterized by the cosine of their swimming angle , as shown in Fig. 5B (see SI Appendix, Fig. S11 for ). Nearly all particles accumulated near vertical unstable manifolds are swimming upward or downward (green, ); and almost all particles near horizontal manifolds are swimming leftward or rightward (blue/red, ). The alignment of particles become weaker at later times () as the particle distribution broadens (Fig. 5B, right). This is characterized by the probability distribution of the swimming angle (Fig. 5D). While initially swimming angle is uniformly distributed, at later times we find a decay in all peaks as more particles fall between intermediate angles. While the steady state accumulation of active particles along unstable manifolds have been previously observed (30, 31), here, however, we show that this accumulation may be transient and non-monotonic in time (see SI Appendix, Fig. S12). Taken together, these simulation results suggest that the accumulation and alignment of swimmers along the unstable manifolds may be responsible for the decrease in fluid stretching. We believe that this accumulation may lead to an increase in local extensional viscosity or resistance of stretching along the manifolds, leading to a decrease in local FTLE (Fig. 2C). This causes a decrease in mixing rate (Fig. 2A) and an increase in average structure size (Fig. 3B).
We can estimate the increase in extensional viscosity () due to local bacteria accumulation. For dilute suspensions of rod-like pusher swimmers, the extensional viscosity in the high Péclet number limit can be estimated as , where is the shear viscosity of the suspending fluid, and is the particle aspect ratio (49) (see SI Appendix for details). Using this expression, we estimate that non-motile bacteria suspension of will only lead to a uniform increase of 2.7% in extensional viscosity. However, an active suspension of same has a much higher local volume fraction () due to bacteria accumulation near the manifolds, leading to an increase in of 33.3% (See SI Appendix). We believe that this relatively large increase in local extensional viscosity along the unstable manifolds is responsible for attenuation of stretching and the observed hindrance in large-scale mixing.
Fluid mixing is an important phenomenon that occurs in diverse natural situations (e.g., lakes, rivers, atmosphere). Here, we explored how swimming microorganisms affect mixing and transport in flows exhibiting chaotic advection. We find that swimming E. coli can hinder large-scale transport of a passive scalar (i.e. dye) in time-periodic flows even though small-scale (local) mixing is enhanced. Bacteria activity can adversely affect large-scale mixing by suppressing the stretching and folding mechanism, a hallmark of chaotic advection. This was demonstrated explicitly by measuring the flow stretching fields; regions of large stretching were attenuated by the presence of bacteria, which resulted in a lower mean of finite-time Lyapunov exponent (FTLE) as bacteria concentration is increased. In other words, bacteria activity reduces the chaoticity of the flow. The attenuation of stretching results in coarser and lasting structures, as shown by the increase in both spatial and temporal autocorrelations with swimming E. coli. This is in contrast to the strong local mixing produced by bacteria at later times, which can even lead to nearly locally isotropic dye concentration fields. This strong local mixing coupled with attenuation in stretching leads to a dynamical system in which scalar field invariant behavior is delayed; this invariant field is, however, subjected to higher randomness at the finer scales for , as shown by the longer exponential tail in Fig. 4B. Simulation results suggest that the attenuation of stretching and mixing at early times may come from an increase in local extensional viscosity due to the accumulation of swimmers along unstable manifolds. Overall, our results provide new insights into how the nonlinear coupling between flow and activity work together to transport and homogenize scalars such as impurities and temperature.
Bacterial Suspension Preparation
We inoculated a strain of Escherichia coli (wild type K12 MG1655) into LB broth (Sigma-Aldrich) liquid media. The media were then incubated at 37 ∘C and 135 rpm overnight (12 - 14 hours) to attain a stationary phase of approximately 109 cell/mL cell density (35). We centrifuged the stationary-phase culture at 5000 rpm for 3.5 min, and re-suspended the pellet into 20 mL of buffer solution. The buffer is an aqueous solution of 2 wt% KCl, 1 wt% NaCl, which does not inhibit cell viability (50). The bacterial volume fraction was adjusted from 0.5% to 0.9% within the same buffer. Non-motile bacteria suspension was made by killing the E. coli with 6% NaClO solution (1:20 to the culture), and then repeating the aforementioned centrifuging-resuspending protocol.
Dye Mixing Experiments
We labelled half of the fluids with 250 L of dye (2.5 10 M fluorescein sodium aqueous solution). The dye was then stirred and dispersed uniformly (6.25 10 M) in the labelled fluid, during which a barrier placed in the middle prevented the labelled and unlabelled fluid from mixing. After the barrier was lifted, we imposed a AC voltage of 4 V and 0.2 Hz to the fluid layer to drive the mixing. Images were taken in the (6 cm) center region using a CMOS camera (IO industries, Flare 4M180), operating at 5 fps and 2000 pixel resolution. Dye field was illuminated under black light (USHIO, F8T5/BLB). The black light (peak emission 368 nm) is in the ultraviolet (UV) range, but 90% of energy is in the range of long-wave UVA-I (340 - 400 nm), which does not harm the cell (51). A filter (TIFFEN, Yellow 12) was used to cut off UV, such that the light intensity is linearly proportional to dye concentration.
Particle Tracking Velocimetry (PTV)
We dispersed 100 m polyethylene (PE) fluorescent particles in the bacterial suspension. Particle positions were recorded by the aforementioned camera, this time operating at 30 fps and 1140 pixel resolution in a (3.6 cm) region. By using particle-tracking software (52), we extracted particle trajectories and measured particle velocities from 6 order polynomial fitting. The velocities were then phase averaged and interpolated on a spatial grid to obtain the velocity map.
Simulations
The swimmers are modelled as non-interacting axisymmetric ellipsoids with a swimming speed in the direction of . The position of the swimmers are governed by:
| (1) |
where is the fluid velocity, and m/s for E. coli. The orientations of swimmer can be modelled using Jeffery’s dynamics (53):
| (2) |
where and are the symmetric and skew parts of the velocity gradient tensor . Here, is a shape factor, with being the swimmer aspect ratio; the factor is roughly for E. coli. The flow in the simulation is defined by a Taylor-Green type stream function:
| (3) |
where is the maximum velocity, related to RMS velocity by . The simulation domain is in size, with 10,000 swimming particles in it, and periodical boundary conditions imposed on all boundaries.
This work was supported by NSF Grant DMR-1709763. We thank Jeffrey Guasto, Tom Solomon, Kevin Mitchell, and Simon Berman for insightful discussions, and David Gagnon and Madhura Gurjar for the help with early work.
References
- (1) S. Vogel, Life in moving fluids: the physical biology of flow. (Princeton University Press), (1983).
- (2) J. D. Wheeler, E. Secchi, R. Rusconi, R. Stocker, Not just going with the flow: The effects of fluid flow on bacteria and plankton. \JournalTitleAnnual Review of Cell and Developmental Biology 35, 213–237 (2019).
- (3) J. R. Taylor, R. Stocker, Trade-offs of chemotactic foraging in turbulent water. \JournalTitleScience 338, 675–679 (2012).
- (4) J. Hill, O. Kalkanci, J. L. McMurry, H. Koser, Hydrodynamic surface interactions enable escherichia coli to seek efficient routes to swim upstream. \JournalTitlePhys. Rev. Lett. 98, 068101 (2007).
- (5) Marcos, H. C. Fu, T. R. Powers, R. Stocker, Bacterial rheotaxis. \JournalTitleProceedings of the National Academy of Sciences 109, 4780–4785 (2012).
- (6) F. De Lillo, et al., Turbulent fluid acceleration generates clusters of gyrotactic microorganisms. \JournalTitlePhys. Rev. Lett. 112, 044502 (2014).
- (7) M. Borgnino, G. Boffetta, F. De Lillo, M. Cencini, Gyrotactic swimmers in turbulence: shape effects and role of the large-scale flow. \JournalTitleJournal of Fluid Mechanics 856, R1 (2018).
- (8) J. T. Locsei, T. J. Pedley, Run and tumble chemotaxis in a shear flow: The effect of temporal comparisons, persistence, rotational diffusion, and cell shape. \JournalTitleBulletin of Mathematical Biology 71, 1089–1116 (2009).
- (9) O. H. Shapiro, et al., Vortical ciliary flows actively enhance mass transport in reef corals. \JournalTitleProceedings of the National Academy of Sciences 111, 13391–13396 (2014).
- (10) R. Rusconi, J. S. Guasto, R. Stocker, Bacterial transport suppressed by fluid shear. \JournalTitleNature Physics 10, 212–217 (2014).
- (11) M. T. Barry, R. Rusconi, J. S. Guasto, R. Stocker, Shear-induced orientational dynamics and spatial heterogeneity in suspensions of motile phytoplankton. \JournalTitleJournal of The Royal Society Interface 12, 20150791 (2015).
- (12) W. M. Durham, J. O. Kessler, R. Stocker, Disruption of vertical motility by shear triggers formation of thin phytoplankton layers. \JournalTitleScience 323, 1067–1070 (2009).
- (13) J. S. Guasto, K. A. Johnson, J. P. Gollub, Oscillatory flows induced by microorganisms swimming in two dimensions. \JournalTitlePhys. Rev. Lett. 105, 168102 (2010).
- (14) I. Rushkin, V. Kantsler, R. E. Goldstein, Fluid velocity fluctuations in a suspension of swimming protists. \JournalTitlePhys. Rev. Lett. 105, 188101 (2010).
- (15) X.-L. Wu, A. Libchaber, Particle diffusion in a quasi-two-dimensional bacterial bath. \JournalTitlePhys. Rev. Lett. 84, 3017–3020 (2000).
- (16) H. Kurtuldu, J. S. Guasto, K. A. Johnson, J. P. Gollub, Enhancement of biomixing by swimming algal cells in two-dimensional films. \JournalTitleProceedings of the National Academy of Sciences 108, 10391–10395 (2011).
- (17) A. Jepson, V. A. Martinez, J. Schwarz-Linek, A. Morozov, W. C. K. Poon, Enhanced diffusion of nonswimmers in a three-dimensional bath of motile bacteria. \JournalTitlePhys. Rev. E 88, 041002 (2013).
- (18) M. B. Short, et al., Flows driven by flagella of multicellular organisms enhance long-range molecular transport. \JournalTitleProceedings of the National Academy of Sciences 103, 8315–8319 (2006).
- (19) D. Saintillan, M. J. Shelley, Instabilities and pattern formation in active particle suspensions: Kinetic theory and continuum simulations. \JournalTitlePhys. Rev. Lett. 100, 178103 (2008).
- (20) D. O. Pushkin, J. M. Yeomans, Fluid mixing by curved trajectories of microswimmers. \JournalTitlePhys. Rev. Lett. 111, 188101 (2013).
- (21) A. Sokolov, M. M. Apodaca, B. A. Grzybowski, I. S. Aranson, Swimming bacteria power microscopic gears. \JournalTitleProceedings of the National Academy of Sciences 107, 969–974 (2010).
- (22) R. Di Leonardo, et al., Bacterial ratchet motors. \JournalTitleProceedings of the National Academy of Sciences 107, 9541–9545 (2010).
- (23) W. M. Durham, et al., Turbulence drives microscale patches of motile phytoplankton. \JournalTitleNature Communications 4, 2148 (2013).
- (24) K. Gustavsson, F. Berglund, P. R. Jonsson, B. Mehlig, Preferential sampling and small-scale clustering of gyrotactic microswimmers in turbulence. \JournalTitlePhys. Rev. Lett. 116, 108104 (2016).
- (25) M. Borgnino, et al., Alignment of nonspherical active particles in chaotic flows. \JournalTitlePhys. Rev. Lett. 123, 138003 (2019).
- (26) C. Zhan, G. Sardina, E. Lushi, L. Brandt, Accumulation of motile elongated micro-organisms in turbulence. \JournalTitleJournal of Fluid Mechanics 739, 22–36 (2014).
- (27) C. Torney, Z. Neufeld, Transport and aggregation of self-propelled particles in fluid flows. \JournalTitlePhys. Rev. Lett. 99, 078101 (2007).
- (28) J. Ottino, The Kinematics of Mixing: Stretching, Chaos, and Transport, Cambridge Texts in Applied Mathematics. (Cambridge University Press), pp. 146–152 (1989).
- (29) N. Khurana, J. Blawzdziewicz, N. T. Ouellette, Reduced transport of swimming particles in chaotic flow due to hydrodynamic trapping. \JournalTitlePhys. Rev. Lett. 106, 198104 (2011).
- (30) N. Khurana, N. T. Ouellette, Interactions between active particles and dynamical structures in chaotic flow. \JournalTitlePhysics of Fluids 24, 091902 (2012).
- (31) A. Dehkharghani, N. Waisbord, J. Dunkel, J. S. Guasto, Bacterial scattering in microfluidic crystal flows reveals giant active taylor–aris dispersion. \JournalTitleProceedings of the National Academy of Sciences 116, 11119–11124 (2019).
- (32) G. A. Voth, G. Haller, J. P. Gollub, Experimental measurements of stretching fields in fluid mixing. \JournalTitlePhys. Rev. Lett. 88, 254501 (2002).
- (33) G. A. Voth, T. C. Saint, G. Dobler, J. P. Gollub, Mixing rates and symmetry breaking in two-dimensional chaotic flow. \JournalTitlePhys. Fluids 15, 2560–2566 (2003).
- (34) P. E. Arratia, J. P. Gollub, Statistics of Stretching Fields in Experimental Fluid Flows Exhibiting Chaotic Advection. \JournalTitleJ. Stat. Phys. 121, 805–822 (2005).
- (35) A. E. Patteson, A. Gopinath, M. Goulian, P. E. Arratia, Running and tumbling with e. coli in polymeric solutions. \JournalTitleScientific Reports 5 (2015).
- (36) T. V. Kasyap, D. L. Koch, M. Wu, Hydrodynamic tracer diffusion in suspensions of swimming bacteria. \JournalTitlePhysics of Fluids 26, 081901 (2014).
- (37) A. E. Patteson, A. Gopinath, P. K. Purohit, P. E. Arratia, Particle diffusion in active fluids is non-monotonic in size. \JournalTitleSoft Matter 12, 2365–2372 (2016).
- (38) P. E. Arratia, J. P. Gollub, Predicting the progress of diffusively limited chemical reactions in the presence of chaotic advection. \JournalTitlePhys. Rev. Lett. 96, 024501 (2006).
- (39) D. Rothstein, E. Henry, J. P. Gollub, Persistent patterns in transient chaotic fluid mixing. \JournalTitleNature 401, 770–772 (1999).
- (40) G. Haller, Finding finite-time invariant manifolds in two-dimensional velocity fields. \JournalTitleChaos 10, 99–108 (2000).
- (41) G. K. Batchelor, Small-scale variation of convected quantities like temperature in turbulent fluid part 1. general discussion and the case of small conductivity. \JournalTitleJournal of Fluid Mechanics 5, 113–133 (1959).
- (42) B. S. Williams, D. Marteau, J. P. Gollub, Mixing of a passive scalar in magnetically forced two-dimensional turbulence. \JournalTitlePhys. Fluids 9, 2061–2080 (1997).
- (43) A. N. Kolmogorov, The local structure of turbulence in incompressible viscous fluid for very large reynolds numbers. \JournalTitleC. R. Acad. Sci. URSS 30, 301–305 (1941).
- (44) K. R. Sreenivasan, J. C. R. Hunt, O. M. Phillips, D. Williams, On local isotropy of passive scalars in turbulent shear flows. \JournalTitleProceedings of the Royal Society of London. Series A 434, 165–182 (1991).
- (45) X. Shen, Z. Warhaft, The anisotropy of the small scale structure in high reynolds number () turbulent shear flow. \JournalTitlePhysics of Fluids 12, 2976–2989 (2000).
- (46) Jayesh, Z. Warhaft, Probability distribution of a passive scalar in grid-generated turbulence. \JournalTitlePhys. Rev. Lett. 67, 3503–3506 (1991).
- (47) M. Holzer, E. D. Siggia, Turbulent mixing of a passive scalar. \JournalTitlePhysics of Fluids 6, 1820–1837 (1994).
- (48) A. Pumir, B. I. Shraiman, E. D. Siggia, Exponential tails and random advection. \JournalTitlePhys. Rev. Lett. 66, 2984–2987 (1991).
- (49) D. Saintillan, Extensional rheology of active suspensions. \JournalTitlePhys. Rev. E 81, 056307 (2010).
- (50) A. Gandhi, Y. Cui, M. Zhou, N. P. Shah, Effect of kcl substitution on bacterial viability of escherichia coli (atcc 25922) and selected probiotics. \JournalTitleJournal of Dairy Science 97, 5939 – 5951 (2014).
- (51) N. Vermeulen, W. J. Keeler, K. Nandakumar, K. T. Leung, The bactericidal effect of ultraviolet and visible light on escherichia coli. \JournalTitleBiotechnol. Bioeng. 99, 550–556 (2008).
- (52) J. C. Crocker, D. G. Grier, Methods of digital video microscopy for colloidal studies. \JournalTitleJournal of Colloid and Interface Science 179, 298 – 310 (1996).
- (53) G. B. Jeffery, L. N. G. Filon, The motion of ellipsoidal particles immersed in a viscous fluid. \JournalTitleProceedings of the Royal Society of London. Series A 102, 161–179 (1922).