Electric-field control of the exchange interactions
Abstract
The impact of an applied electric field on the exchange coupling parameters has been investigated based on first-principles electronic structure calculations by means of the KKR Green function method. The calculations have been performed for a Fe film, free-standing and deposited on two different substrates, having 1 monolayer (ML) thickness to minimize the effect of screening of the electric field typical for metallic systems. By comparing the results for the free-standing Fe ML with those for Fe on the various substrates, we could analyze the origin of the field-induced change of the exchange interactions. Compared to thefree-standing Fe ML, in particular rather pronounced changes have been found for the Fe/Pt(111) system due to the localized electronic states at the Fe/Pt interface, which are strongly affected by the electric field and which play an important role for the Fe-Fe exchange interactions.
pacs:
71.15.-m,71.55.Ak, 75.30.DsI Introduction
The control of magnetic properties by applying an electric field is discussed in the literature since many years Siratori and Kita (1980); Jungwirth et al. (2006); Matsukura et al. (2015); Katsura et al. (2007); Maruyama et al. (2009); Ishibashi et al. (2018); Nozaki et al. (2012); Duan et al. (2008); Rado (1961); Yamada et al. (2018, 2011); Obinata et al. (2015). Apart from the well known example of the magneto-crystalline anisotropy (MCA) influenced by an electric field Maruyama et al. (2009); Nakamura et al. (2009); Weisheit et al. (2007); Lebeugle et al. (2009); Chiba et al. (2010), various types of the magneto-electric (ME) effects have been discussed. Accordingly, quite a number of investigations have been devoted to antiferromagnetic (AFM) Date et al. (1961); Rado (1961); Rado and Folen (1962); Laukhin et al. (2006), non-collinear magnetic Siratori and Kita (1980); Katsura et al. (2005) or ferromagnetic (FM) Ohno et al. (2000); Chiba et al. (2003); Matsukura et al. (2015); Ovchinnikov and Wang (2009); Duan et al. (2008); Shimamura et al. (2012) systems. In the case of FM materials the investigations have been focused in particular on the dependence of the exchange interactions on applied electric field aiming to manipulate that way by the ferromagnetic-to-paramagnetic transition. The features of the ME effect depend in turn on the dominating exchange mechanism in the material Matsukura et al. (2015). In the diluted magnetic semiconductor (DMS) (In,Mn)As Ohno et al. (2000); Chiba et al. (2003), for instance, used as a prototype system within such investigations, the dominating Ruderman-Kittel-Kasuya-Yosida (RKKY) exchange is mediated by holes and strongly depends on the hole concentration which may be efficiently controlled by the applied electric field. In the case of metallic materials, the situation is more complicatedOvchinnikov and Wang (2009) as their magnetic properties are governed by the exchange interactions having quite a different origin and as a consequence a different behavior under an applied electric field. It is worth noting in addition that despite a short screening length in metals Matsukura et al. (2015) a rather pronounced magneto-electric effect was demonstrated within DFT calculations performed for thin metallic Fe(001), Ni(001), and Co(0001) filmsDuan et al. (2008). Experimentally, a significant field induced change of the Curie temperature was observed for Co ultrathin films embedded into different layered structures Ando et al. (2018); Ishibashi et al. (2018). The dependence of on the electric field strength was attributed to the corresponding modification of the interatomic exchange interactions . As it was mentioned above, the origin of these changes in metallic films is different compared to DMS materials, and explicit first-principles calculations of the exchange coupling parameters would be very desirable to find out the relationship between the field induced modification of and the electronic structure in the system, as it has been done for instance for free-standing Fe(001) and Co/Pt(111) Oba et al. (2015) FM films.
Because of the central role of the Dzyaloshinskii-Moriya interaction (DMI) in two-dimensional layered systems for the formation of magnetic skyrmions, control of the DMI by an applied electric field is of great interest as it gives an access to manipulate the stability of skyrmions. In fact, a strong variation of the DMI with electric field was found experimentally for the Ta/FeCoB/TaO Srivastava et al. (2018) and MgO/Fe/Pt Zhang et al. (2018) trilayer systems. An impact of the electric field on the size of the magnetic domain wall, investigated experimentally for Pt/Co Ando et al. (2016) and Pt/Co/AlOx Schott et al. (2021) thin films as well as an impact on the domain wall motion in Pt/Co/Pd films Koyama et al. (2018), was also associated with the field-induced change of the Dzyaloshinskii-Moriya interaction. Furthermore, there is also great interest in the ME effect in bulk non-collinear magnetic materials Siratori and Kita (1980); Katsura et al. (2005), which is also associated with the electric field induced DMI.
Despite significant attention devoted in the literature to the magneto-electric effect, so far no systematic investigations have been performed on a first principles level. To our knowledge there are only few corresponding reports in the literature. This is the above mentioned report by Oba et al. Oba et al. (2015) on the field-dependent for free-standing Fe(001) and Co/Pt(111). Yang et al. Yang et al. (2018) have studied the electric field control of the DMI for the NM/Co/Pt trilayers with different non-magnetic NM layers. Recently Paul and Heinze Paul and Heinze (2021) reported on the stability of skyrmions controlled by the electric field, where , , biquadratic interactions and MCA have been calculated on the same footing on ab-initio level.
In this work we focus on three prototype systems, the free-standing Fe monolayer, 1ML Fe deposited on Pt(111) and on 1H-WS2 substrates. The first principles calculations of the electronic structure and the exchange interactions and DMI for these systems have been performed without external electric field as well as in the presence of the electric field, to reveal the relation between the field induced changes of the electronic structure and the exchange parameters.
II Computational details
Within the present work, exchange coupling parameters were calculated using the spin-polarized relativistic KKR (SPR-KKR) Green function method H. Ebert et al. (2017); Ebert et al. (2011). The fully-relativistic mode was used throughout except for those cases, for which a scaling of the spin-orbit interaction was applied. All calculations have been performed within the framework of the local spin density approximation (LSDA) to spin density functional theory (SDFT), using a parametrization for the exchange and correlation potential as given by Vosko et al. Vosko et al. (1980). The charge and spin densities as well as the potentials were treated on the level of the atomic sphere approximation (ASA). A cutoff was used for the angular momentum expansion of the Green function. The -space integration over the two dimensional (2D) Brillouin zone (BZ) was done using a 2D k-mesh.
The calculations for 1ML of Fe deposited on the Pt(111) surface have been performed for a geometry consisting of semi-infinite Pt and vacuum subspaces to the left and to the right, respectively, of the so-called interaction zone consisting of 3 atomic layers of Pt, one layer of Fe and 5 layers of empty spheres (vacuum). The calculations for a free-standing Fe monolayer and 1ML Fe on WS2 have been performed in slab geometry. In the latter case there are two possibilities for the arrangement of the Fe atoms with respect to the position of W in 1H-WS2; i.e. being either above the W atoms or above vacancies within the W layer. As the former occupation is energetically more preferable, all calculations here have been done for Fe occupying positions above the W atoms, with identical Fe-S and W-S distances. Finally, it should be noted that for all calculations the structure relaxation of the surface layers has not been taken into account.
Within the present work, we investigate the impact of an electric field on the magnetic properties of metallic FM films restricting to the situation when the field is applied along the normal to the surface. This implies that the electric field will lead to some charge rearrangement but not to a steady state electric current. We focus here on ultrathin films considering one Fe monolayer, as in this case one can expect pronounced effects while these will be reduced in metallic bulk materials because of screening (see, e.g. Ref. Simon et al., 2021). Accordingly, we consider here as representative examples a 1ML Fe film deposited on different substrates. In order to clarify the role of the substrate, we represent also results for an unsupported Fe monolayer.
Dealing with an Fe monolayer, one has to make a remark concerning its magnetic ordering. It is well known that the magnetic order in an ideal 2D system should be broken at K due to spin-wave (SW) excitations, as it is to be expected on the basis of the Mermin-Wagner theoremMermin and Wagner (1966). This, however, does not hold in the presence of magnetic anisotropy that causes for the SW spectrum the opening of an energy gap at the point of the 2D BZ and blocks that way the low-energy SW excitationsBruno (1991). As a consequence, this mechanism leads to a dependence of the Curie temperature, , on the MCATurek et al. (2006). Accordingly, one may expect a possible impact of the electric field on due to the field-dependent changes of the MCA discussed in the literature.
In the present work we assume a finite MCA to ensure a unique FM order in the Fe film. However, we do not discuss the impact of the electric field on the MCA and this way on the Curie temperature. Instead, we focus on the behavior of the exchange parameters and that represent the isotropic and anisotropic Dzyaloshinskii-Moriya interaction, respectively. Their field dependence will be monitored using the Curie temperature evaluated via mean-field theory.
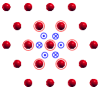
For the electronic structure calculations, the effect of a homogeneous external electric field was modeled by a periodic array of point charges in the vacuum region that behave essentially like a charged capacitor plate. This leads to a homogeneous electric field of strength,
| (1) |
where is the charge of the capacitor in unit of the electron’s charge, is the permittivity of vacuum and is the area per charged site in the capacitor plate. As suggested by Eq. (1), the orientation of the electric field can be controlled via the sign of . A positive charge in front of a surface gives rise to a field pointing inwards to the bulk and anti-parallel to the surface normal . As in this case, the electric field will be denoted briefly ’negative’, while ’positive’ denotes an outward-oriented electric field.
III Results
III.1 Free-standing 1 ML Fe
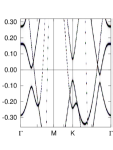
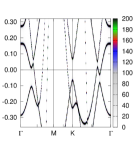
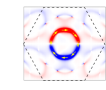
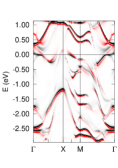
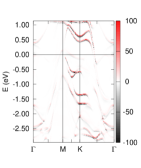
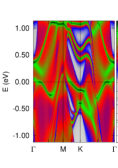
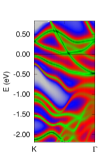
Presenting our results, we start with the free-standing Fe monolayer having a hexagonal structure with its structure parameters corresponding to 1 ML Fe deposited on a Pt(111) surface ( a.u.). The spin magnetic moment of Fe calculated for this 2D system is . Considering a monolayer film, the system experiences accordingly the influence of the electric field without screening. As it was discussed by Nakamura et al. Nakamura et al. (2009) and Oba et al. Oba et al. (2015), the external electric field along the film normal , introduces a perturbation to the system according to the Hamiltonian creating a coupling of the - and -type orbitals with equal magnetic quantum number , i.e. for examples and as well as and orbitals. This can be seen in the Bloch spectral function (BSF) plotted in Fig. 1(a), right panel, in comparison with the BSF for the non-distorted system shown in the left panel as a reference.
(a)
 (b)
(b)
In the former case the avoided crossings can be seen for the energy bands in the middle of the and directions, being a consequence of such a hybridization. The change in the charge density arising as a response to the external electric field creates in turn an induced electric polarization breaking the inversion symmetry of the film.
As it follows from the calculations, the Fe spin magnetic moment is practically unchanged by the applied electric field. Nevertheless, there is a noteworthy change for the exchange coupling parameters, that are shown up to third atomic shells in Fig. 2 (left panel) as a function of the electric field strength.

(a)

 (b)
(b)

 (c)
(c)
As one can see, the weak modification of due to the electric field has an almost parabolic dependency. It can be ascribed to the shift of the Fermi level and to the change of hybridization of the localized and delocalized electrons mediating interatomic exchange interactions. Considering the electric field as a perturbation, one can expand the exchange coupling parameter in powers of the electric field. This expansion has contributions only from even powers with respect to to ensure a scalar character for . This leads to a parabola-like dependence of this quantity on the electric field. As will be shown below, the field-dependent variation of parameters corresponding to deposited Fe monolayers is more complicated due to others field-induced effects having an impact on the exchange interactions.
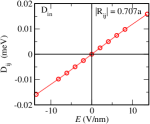
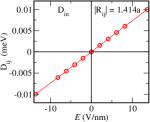
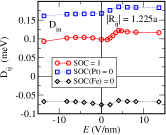
The broken inversion symmetry due to the presence of an external electric field creates a non-zero DMI, that is shown in the right panel of Fig. 2. As one can see, the DMI increases linearly with the field strength and accordingly changes sign when the field changes its direction. This behavior is associated with the field-induced Rashba SOC that introduces a perturbation to the delocalized electrons mediating the Fe-Fe exchange interaction according to the expression Bychkov and Rashba (1984)
| (2) |
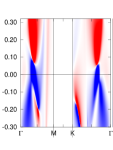
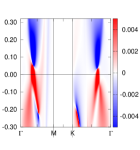
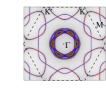
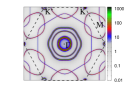
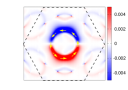
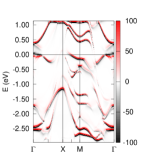
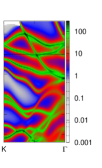
with the Rashba parameter , where the effective elecric field is created by the external and induced, , electric fields (where is the field-induced potential). To demonstrate the impact of the Rashba-type SOC on the electronic structure, we plot in Fig. 1(b) the in-plane spin polarization (-projection) of the electronic states, which does not show up in the field-free system as well as in the case of SOC strength artificially scaled down to zero. Moreover, this spin polarization having different directions for different energy bands, changes sign to the opposite together with the electric field direction (similar behavior to that observed for the DMI), that can be seen by comparing left and right panels in Fig. 1(b). To have a more complete picture, Fig. 3 (a) shows the calculated Bloch spectral functions (left panel) and (right panel), with eV and , representing the cut of the energy bands by the energy planes and eV. The corresponding -projected spin polarization for these energy bands is displayed in Fig. 3 (b). It has different sign for the states with and eV, located around point. Taking into account also the -projected spin polarization, one can reproduce the orientation of the in-plane spin polarization shown in Fig. 3 (b) by yellow arrows. It would be worth noting about the Rashba SOC induced modification of the electronic structure seen in 3 (a), right panel, with small electronic pockets in the and symmetric points of 2D BZ have having different size in the presence of the electric field, but getting identical in the case of SOC switched off.
(a)
 (b)
(b)
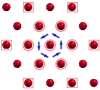
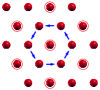
The DMI caused by the Rashba SOC was discussed already in the literature e.g. by Kundu and Zhang Kundu and Zhang (2015). For this reason, we only point out that in the particular case of a free-standing Fe monolayer, all three DMI parameters presented in Fig. 8(right panel) have the same order of magnitude. Positive orientations of the DMI vectors are shown in Fig. 4.
(a)
 (b)
(b)
 (c)
(c)
III.2 1 ML Fe/ Pt(111)
Next, we consider a 1 ML Fe film on a Pt(111) substrate. The change of the spin magnetic moment in the Fe monolayer, , due to an applied electric field is shown in Fig. 5.

The most significant change occurs at a small strength of the electric field, with an almost linear dependence of on the electric field strength. With further increasing field strength, , the magnetic moment shows only a weak variation with the field. To demonstrate the impact of the electric field on the electronic structure, we plot in Fig. 6 the difference in the Bloch spectral function , representing the changes of the (a) Fe- and (b) Pt(I)-projected electronic states due to a negative (; left) and positive (; right) electric field with Pt(I) denoting the Pt atoms at Fe/Pt interface.
(a)
 (b)
(b)
As one can see, the Fe layer experiences the strongest influence of the electric field. The modification of the band structure due to the electric field for 1 ML Fe on Pt(111) is obviously more complex than for the free-standing Fe monolayer. As it was already discussed previously Simon et al. (2021), one can distinguish several mechanisms for the observed field-induced changes in the electronic structure. First of all, one notes a shift of the electronic states, which depends on their distance to the surface. This shift is the strongest for the states well localized in the surface region with an unscreened or weakly screened electric field. In Fig. 6(a) one can see in particular a pronounced field-induced shift for the Fe -states, while the shift for the Pt states at the Pt/Fe interface is weaker. This is a result of a partial screening of the electric field as well as a weaker localization of the electron Pt states.
As it was pointed out above, the applied electric field changes in addition the hybridizationOba et al. (2015) of the - and - states. This effect however is hard to see in Fig. 6 because of the strong modification of the electronic states of deposited Fe when compared to a single Fe monolayer.
Finally, one notes that the bulk-like Pt states are almost unmodified. As a result, the field induced shifts of the Fe -states having essentially 2D character are accompanied by a corresponding broadening, as it is seen in Fig. 6, which is a consequence of their modified hybridization with the bulk-like Pt energy bands.
Concerning the field-dependence of the isotropic exchange coupling parameters, Fig. 7 shows these as a function of interatomic distance for the field-free case as a reference (left panel, open symbols).
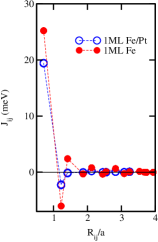
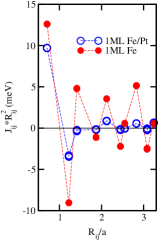
As can be concluded from the oscillating behavior of the product given in the right panel in Fig. 7, they show a well defined RKKY-like characteristics for large distances. These interactions are compared with those calculated for the free-standing Fe monolayer, shown by full symbols. For all distances the Fe-Fe interactions are stronger for the free-standing Fe monolayer, a finding that can be associated with a narrower -band and higher DOS at the Fermi energy, leading to a larger energy change under the perturbation caused by spin tiltings. Although the oscillations in both cases have a different amplitude the parameter has a similar RKKY-like dependency on the distance . Fig. 8 (left panel) represents the exchange coupling parameters (for ), (for ) and (for ) as a function of the electric field. As one can see, the relative change of the first-neighbor parameter is rather small, while the change is more pronounced for the two other parameters that are negative in sign for the field-free case. However, both parameters, and , are substantially smaller when compared to , implying that they play a much weaker role for the magnetic properties of the system, which is expected to be ferromagnetic (FM) due to dominating FM interactions . As one can see in Fig. 8, all parameters increase almost linearly together with increasing ’negative’ electric field, leading for to a change in sign. An increasing ’positive’ field, on the other hand, leads to a saturation already at .

(a)

 (b)
(b)

 (c)
(c)
 (d)
(d)
To get an impression for the influence of the electric field on the Curie temperature , we plot in Fig. 8 (d) calculated using the exchange coupling parameters in Fig. 8(a)-(c) on the basis of the mean-field theory. Obviously, follows the field-induced changes of shown in Fig. 8 (a)-(c), exhibiting a strong field dependence for ’negative’ field and only weak changes for ’positive’ fields.
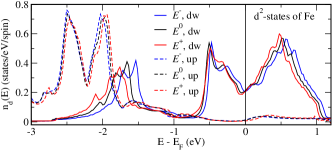
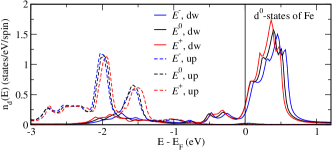
As one can see in Fig. 6, a ’positive’ electric field leads in general to an upwards shift for the -states of Fe, while ’negative’ field leads to a shift of the states down in energy. The same trend can be seen for the -resolved DOS plotted in Fig. 9(a) and (b) showing the DOS for the , , and states. However, pronounced field-induced shifts of the electronic states occur around the point in the vicinity of the Fermi energy for a ’negative’ field . This shift is opposite in direction compared to all others. As is shown in Fig. 9(c) a strong modification of the minority-spin states occurs close to the Fermi energy for a ’negative’ field.
(a)
 (b)
(b)
 (c)
(c)
This shift is also seen in Fig. 10 giving the BSF for the minority spin states of Fe. As one can see, the states at the point move in the presence of electric field from a position close to the Fermi level upwards in energy into the energy gap of the bulk Pt states. These states have to be seen as interface states strongly affected by the weakly screened electric field due to their spatial position. On the other hand, such a behaviour is not seen in the case of a ’positive’ electric field. From this one may conclude that the interface states are primarily responsible for the strong modification of the exchange parameters in case of ’negative’ electric field.

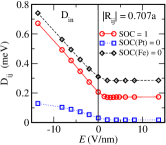
Due to the broken inversion symmetry at the surface, the Fe-Fe DMI does not vanish in the absence of the electric field in contrast to the unsupported Fe monolayer. As it was mentioned above, the out-of-plane component of the DMI, , has an alternating orientation when going from one atom to another within the same neighbour shell, as it is shown in Fig. 4. This results in a mutual cancellation of their influence on the magnetic structure. For that reason, we discuss here only the in-plane components of DMI , that are plotted in Fig. 8 (right panel) as a function of the field strength and direction. One can see a pronounced increase for the magnitude of the first- and third-neighbor parameters and in the case of a ’negative’ electric field. Note, however, that their sign is opposite. In the case of a ’positive’ electric field the parameters have rather weak variation with the field strength. This behaviour is rather similar to the behaviour of the isotropic exchange interactions and can be related to the field-dependent changes of the interface electronic states.
To demonstrate the role of the substrate atoms for the DMI and its dependence on the electric field, additional calculations have been performed with an artificial scaling of the SOC on the Fe and the interface Pt atoms. When the SOC of Fe atom is taken to be zero, SOC(Fe) = 0, the parameters and slightly increase, following the same field dependence as in the case of an unscaled SOC. In the case of the effect of SOC(Fe) scaling is much more pronounced, leading even to a change of sign for . On the other hand, scaling SOC on the Pt atoms, SOC(Pt) = 0, leads to an increase of the magnitude of (which is negative), having a rather similar field dependence as in the case of the unscaled SOC. This results obviously reflect a strong competition of the Pt and Fe SOC effects for the parameter , with a leading effect of SOC(Fe). In contrast, in the case of SOC(Pt) = 0 the parameters and drop down significantly, that implies that their strength is governed by the SOC of the Pt atoms.
IV 1ML Fe on 1H-WS2
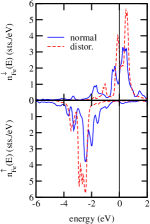
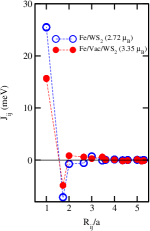
In the case of 1ML Fe on 1H-WS2, the substrate was chosen as an example for an insulator in contrast to metallic Pt considered above. In this case one can expect a different impact of the substrate on the Fe-Fe exchange interactions and in turn a different field-dependent behavior. The spin magnetic moment of Fe on 1H-WS2 in the absence of an electric field is , that is essentially smaller when compared to in the case of Fe/Pt(111), despite the larger Fe-Fe interatomic distance, a.u. for 1H-WS2, in comparison to a.u. for Pt(111) as a substrate. Moving Fe monolayer away from the surface of WS2 by inserting an empty layer in-between leads to an increase of the Fe spin magnetic moment to , which is a consequence of the narrower -bands of Fe leading to more pronounced exchange splitting of the majority- and minority-spin states, as can be seen in the DOS for the Fe -states plotted in Fig. 11 (left panel). This allows to conclude that the decreased magnetic moment of Fe on 1H-WS2 is a result of the strong hybridization of the Fe states with the states of S and states of W.
The Fe-Fe exchange parameters calculated for the non-distorted Fe/WS2 system (i.e., with identical Fe-S and W-S distances) are also plotted in Fig. 11 (right panel, open symbols) in comparison with those calculated for Fe monolayer spaced further away from the substrate (full symbols). From this one can see that depositing a Fe ML on WS2 results in an increase of the exchange parameters despite the decrease of the spin magnetic moment of Fe. This trend is opposite to that found for 1ML Fe/Pt(111) and may indicate a crucial role of the hybridization of the Fe -states with the -states of S responsible for a Fe-Fe superexchange in this system.
As it is shown in Fig. 12, the Fe magnetic moment in Fe/1H-WS2 has an almost linear dependence on the electric field.
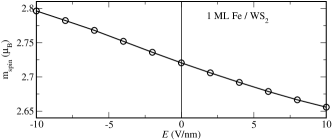
The field-induced change of is by about order of magnitude larger than in the case of Fe/Pt(111), as a result of the different impact of the substrate on Fe in these two cases.
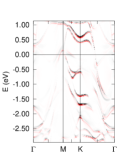
Note also that in contrast to Fe/Pt(111), the whole Fe/1H-WS2 system experiences the effect of the applied electric field due to its finite thickness. As a result, an impact of the electric field on the electronic structure is much stronger, as it can be seen in the BSF representing the Fe projected energy bands given in Fig. 13 for three different cases, , and .

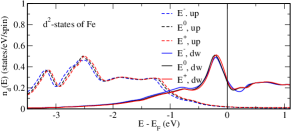
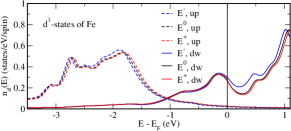
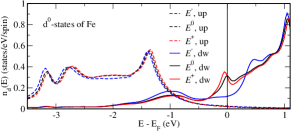
In the -resolved DOS of Fe plotted in Fig. 14 one can see that the bandwidth of the and states is largest, indicating their strong hybridization with the states of the substrate, i.e. first of all states of S. An applied electric field leads obviously to a rather complicated modification of the electronic structure. One notes a field-induced up- and down- shift of the minority-spin -states of Fe arranged around the Fermi level, depending on the direction of electric field (Fig. 14 (a)-(c)).
The DOS peaks at eV in Fig. 14 (a) appear due to a hybridization of the Fe minority-spin and states with the -states of S and -states of W. They show more pronounced field-induced shifts when compared to the states around the Fermi energy. This can be attributed to a field-induced change of the hybridization of these states caused by the shifts of the Fe and states. As a common trend one notes for the majority-spin states a shift in the opposite direction in comparison with the minority-spin states, implying a field-induced change of the exchange splitting, leading in turn to a corresponding change of the spin magnetic moment of Fe.
(a)
 (b)
(b)
 (c)
(c)
The isotropic Fe-Fe exchange coupling parameters, , in 1 ML Fe on WS2 are plotted in Fig. 15, left panel, as a function of applied electric field. Figs. 15 (a), (b) and (c) represent the exchange parameters for the distances , and , respectively. One can see in all cases an almost linear variation of for small electric fields. At larger fields, changes almost linearly with the field strength for ’positive’ field, and reach some extremum in the case of the ’negative’ field. Fig. 15 (d) represents the reduced mean-field evaluated assuming FM ordering in the system, demonstrating rather pronounced impact of the electric field on the critical temperature.

(a)

 (b)
(b)

 (c)
(c)
 (d)
(d)
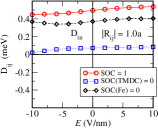
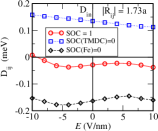
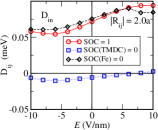
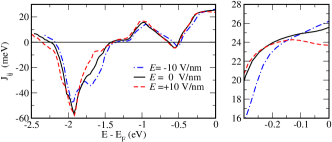
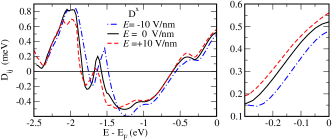
The in-plane components Dzyaloshinskii-Moriya interactions in 1 ML Fe on WS2 calculated for the distances , and are plotted in Fig. 15, right panel, as a function of applied electric field. In contrast to the Fe/Pt(111) system, the DMI exhibits a weaker dependence on the electric field, implying a crucial role of the states localized at the Fe/substrate interface, being rather sensitive to the influence of an electric field. Such states occur in the vicinity of the Fermi energy for the Fe/Pt(111) interface, but not for the Fe/WS2 system. A strong field induced modification of the Fe -states in Fe/WS2 occurs due to a change of their hybridization with the electronic states of substrate. This however corresponds mainly to the states below the Fermi energy. As one can see in Fig. 16(b) representing the in-plane DMI as a function of the occupation of the electronic states, the field induced change of the hybridization could result in a much stronger field-dependence of DMI in the case of Fermi level shifted down by about 1.5 eV.
(a)
 (b)
(b)
Note that according to the results shown in Fig. 15, the SOC of the substrate plays a leading role for the and parameters, similar to the case of Fe/Pt(111), while for the SOC for Fe and the TMDC substrate compete with each other.
V Summary
In summary, considering an Fe monolayer, free-standing and deposited on two different substrates, we demonstrated the impact of an applied electric field on the exchange parameters, both, isotropic and DMI, . In the case of the free-standing Fe monolayer the electric field has a key role creating the DMI by breaking the inversion symmetry in the system. In the case of deposited Fe films rather prominent changes of the exchange parameters occur for the Fe/Pt(111) system due to the localized electronic states at the Fe/Pt interface, that are strongly affected by the electric field. In the case of an TMDC substrate the dependence of DMI on the electric field is much weaker, although the isotropic interactions still exhibit a rather strong modification.
References
- Siratori and Kita (1980) K. Siratori and E. Kita, Journal of the Physical Society of Japan 48, 1443 (1980), https://doi.org/10.1143/JPSJ.48.1443 .
- Jungwirth et al. (2006) T. Jungwirth, J. Sinova, J. Mašek, J. Kučera, and A. H. MacDonald, Rev. Mod. Phys. 78, 809 (2006).
- Matsukura et al. (2015) F. Matsukura, Y. Tokura, and H. Ohno, Nature Nanotechnology 10, 209 (2015), https://doi.org/10.1038/nnano.2015.22 .
- Katsura et al. (2007) H. Katsura, A. V. Balatsky, and N. Nagaosa, Phys. Rev. Lett. 98, 027203 (2007).
- Maruyama et al. (2009) T. Maruyama, Y. Shiota, T. Nozaki, K. Ohta, N. Toda, M. Mizuguchi, A. A. Tulapurkar, T. Shinjo, M. Shiraishi, S. Mizukami, Y. Ando, and Y. Suzuki, Nature Nanotechnology 4, 158 (2009).
- Ishibashi et al. (2018) M. Ishibashi, K. T. Yamada, Y. Shiota, F. Ando, T. Koyama, H. Kakizakai, H. Mizuno, K. Miwa, S. Ono, T. Moriyama, D. Chiba, and T. Ono, Applied Physics Express 11, 063002 (2018).
- Nozaki et al. (2012) T. Nozaki, Y. Shiota, S. Miwa, S. Murakami, F. Bonell, S. Ishibashi, H. Kubota, K. Yakushiji, T. Saruya, A. Fukushima, S. Yuasa, T. Shinjo, and Y. Suzuki, Nature Physics 8, 491 (2012).
- Duan et al. (2008) C.-G. Duan, J. P. Velev, R. F. Sabirianov, Z. Zhu, J. Chu, S. S. Jaswal, and E. Y. Tsymbal, Phys. Rev. Lett. 101, 137201 (2008).
- Rado (1961) G. T. Rado, Phys. Rev. Lett. 6, 609 (1961).
- Yamada et al. (2018) K. T. Yamada, M. Suzuki, A.-M. Pradipto, T. Koyama, S. Kim, K.-J. Kim, S. Ono, T. Taniguchi, H. Mizuno, F. Ando, K. Oda, H. Kakizakai, T. Moriyama, K. Nakamura, D. Chiba, and T. Ono, Phys. Rev. Lett. 120, 157203 (2018).
- Yamada et al. (2011) Y. Yamada, K. Ueno, T. Fukumura, H. T. Yuan, H. Shimotani, Y. Iwasa, L. Gu, S. Tsukimoto, Y. Ikuhara, and M. Kawasaki, Science 332, 1065 (2011).
- Obinata et al. (2015) A. Obinata, Y. Hibino, D. Hayakawa, T. Koyama, K. Miwa, S. Ono, and D. Chiba, Sci. Rep. 5, 14303 (2015).
- Nakamura et al. (2009) K. Nakamura, R. Shimabukuro, Y. Fujiwara, T. Akiyama, T. Ito, and A. J. Freeman, Phys. Rev. Lett. 102, 187201 (2009).
- Weisheit et al. (2007) M. Weisheit, S. Fähler, A. Marty, Y. Souche, C. Poinsignon, and D. Givord, Science 315, 349 (2007), https://science.sciencemag.org/content/315/5810/349.full.pdf .
- Lebeugle et al. (2009) D. Lebeugle, A. Mougin, M. Viret, D. Colson, and L. Ranno, Phys. Rev. Lett. 103, 257601 (2009).
- Chiba et al. (2010) D. Chiba, Y. Nakatani, F. Matsukura, and H. Ohno, Appl. Phys. Lett. 96, 192506 (2010).
- Date et al. (1961) M. Date, J. Kanamori, and M. Tachiki, Journal of the Physical Society of Japan 16, 2589 (1961), https://doi.org/10.1143/JPSJ.16.2589 .
- Rado and Folen (1962) G. T. Rado and V. J. Folen, Journal of Applied Physics 33, 1126 (1962), https://doi.org/10.1063/1.1728630 .
- Laukhin et al. (2006) V. Laukhin, V. Skumryev, X. Martí, D. Hrabovsky, F. Sánchez, M. V. García-Cuenca, C. Ferrater, M. Varela, U. Lüders, J. F. Bobo, and J. Fontcuberta, Phys. Rev. Lett. 97, 227201 (2006).
- Katsura et al. (2005) H. Katsura, N. Nagaosa, and A. V. Balatsky, Phys. Rev. Lett. 95, 057205 (2005).
- Ohno et al. (2000) H. Ohno, D. Chiba, F. Matsukura, T. Omiya, E. Abe, T. Dietl, Y. Ohno, and K. Ohtani, Nature 408, 944 (2000).
- Chiba et al. (2003) D. Chiba, M. Yamanouchi, F. Matsukura, and H. Ohno, Science 301, 943 (2003), https://science.sciencemag.org/content/301/5635/943.full.pdf .
- Ovchinnikov and Wang (2009) I. V. Ovchinnikov and K. L. Wang, Phys. Rev. B 79, 020402 (2009).
- Shimamura et al. (2012) K. Shimamura, D. Chiba, S. Ono, S. Fukami, N. Ishiwata, M. Kawaguchi, K. Kobayashi, and T. Ono, Applied Physics Letters 100, 122402 (2012), https://doi.org/10.1063/1.3695160 .
- Ando et al. (2018) F. Ando, K. T. Yamada, T. Koyama, M. Ishibashi, Y. Shiota, T. Moriyama, D. Chiba, and T. Ono, Applied Physics Express 11, 073002 (2018).
- Oba et al. (2015) M. Oba, K. Nakamura, T. Akiyama, T. Ito, M. Weinert, and A. J. Freeman, Phys. Rev. Lett. 114, 107202 (2015).
- Srivastava et al. (2018) T. Srivastava, M. Schott, R. Juge, V. Křižáková, M. Belmeguenai, Y. Roussigné, A. Bernand-Mantel, L. Ranno, S. Pizzini, S.-M. Chérif, A. Stashkevich, S. Auffret, O. Boulle, G. Gaudin, M. Chshiev, C. Baraduc, and H. Béa, Nano Letters 18, 4871 (2018).
- Zhang et al. (2018) W. Zhang, H. Zhong, R. Zang, Y. Zhang, S. Yu, G. Han, G. L. Liu, S. S. Yan, S. Kang, and L. M. Mei, Applied Physics Letters 113, 122406 (2018).
- Ando et al. (2016) F. Ando, H. Kakizakai, T. Koyama, K. Yamada, M. Kawaguchi, S. Kim, K.-J. Kim, T. Moriyama, D. Chiba, and T. Ono, Applied Physics Letters 109, 022401 (2016), https://doi.org/10.1063/1.4955265 .
- Schott et al. (2021) M. Schott, L. Ranno, H. Bea, C. Baraduc, S. Auffret, and A. Bernand-Mantel, Journal of Magnetism and Magnetic Materials 520, 167122 (2021), magnetic materials and their applications: in Memory of Dominique Givord.
- Koyama et al. (2018) T. Koyama, Y. Nakatani, J. Ieda, and D. Chiba, 4 (2018), 10.1126/sciadv.aav0265.
- Yang et al. (2018) H. Yang, O. Boulle, V. Cros, A. Fert, and M. Chshiev, Scientific Reports 8, 12356 (2018).
- Paul and Heinze (2021) S. Paul and S. Heinze, arXiv: 2104.11986 (2021).
- H. Ebert et al. (2017) H. Ebert et al., The Munich SPR-KKR package, version 7.7, https://www.ebert.cup.uni-muenchen.de/en/software-en/13-sprkkr (2017).
- Ebert et al. (2011) H. Ebert, D. Ködderitzsch, and J. Minár, Rep. Prog. Phys. 74, 096501 (2011).
- Vosko et al. (1980) S. H. Vosko, L. Wilk, and M. Nusair, Can. J. Phys. 58, 1200 (1980), http://www.nrcresearchpress.com/doi/pdf/10.1139/p80-159 .
- Simon et al. (2021) E. Simon, A. Marmodoro, S. Mankovsky, and H. Ebert, Phys. Rev. B 103, 064406 (2021).
- Mermin and Wagner (1966) N. D. Mermin and H. Wagner, Phys. Rev. Lett. 17, 1133 (1966).
- Bruno (1991) P. Bruno, Phys. Rev. B 43, 6015 (1991).
- Turek et al. (2006) I. Turek, J. Kudrnovský, V. Drchal, and P. Bruno, Phil. Mag. 86, 1713 (2006), http://dx.doi.org/10.1080/14786430500504048 .
- Bychkov and Rashba (1984) Y. A. Bychkov and E. I. Rashba, JETP Lett. 39, 78 (1984), Russian original: ZhETF 39, 66 (1984).
- Kundu and Zhang (2015) A. Kundu and S. Zhang, Phys. Rev. B 92, 094434 (2015).