Convergent evolution in a large cross-cultural database of musical scales
Abstract
Scales, sets of discrete pitches that form the basis of melodies, are thought to be one of the most universal hallmarks of music. But we know relatively little about cross-cultural diversity of scales or how they evolved. To remedy this, we assemble a cross-cultural database (Database of Musical Scales: DaMuSc) of scale data, collected over the past century by various ethnomusicologists. Statistical analyses of the data highlight that certain intervals (e.g., the octave, fifth, second) are used frequently across cultures. Despite some diversity among scales, it is the similarities across societies which are most striking: step intervals are restricted to ; most scales are found close to equidistant 5- and 7-note scales. We discuss potential mechanisms of variation and selection in the evolution of scales, and how the assembled data may be used to examine the root causes of convergent evolution.
Introduction
Music, like language, can be described as a generative grammar consisting of basic building blocks, and rules on how to combine them. 1, 2 In melodies, these basic units are usually specified by two quantities: frequency and duration. We generally refer to this basic pitch unit as a note, and a set of notes as a scale. Thus, as far as pitch is concerned, a scale is to a melody what an alphabet is to writing. Despite their centrality to music and apparent ubiquity, we know surprisingly little about scales. Most studies focus on scales from a limited number of musical traditions, 3, 4 and the main statistical findings are that scales are non-equidistant, and have 7 or fewer notes. 5, 6 There are many anecdotal reports that certain notes are commonly used, 7, 8, 3, 4, 9, 10 but this has only been quantitatively examined in one small cross-cultural sample. 11 Thus, we lack concrete understanding of the fundamental questions of why humans use scales, how diverse they are, or how they came to be that way. We suspect that this is simply due to a lack of suitable resources. Here, we address this problem by presenting and analyzing a data set of musical scales from many societies, extant and extinct, built upon a century of ethnomusicological enterprise.
Let us begin by clarifying a few key terms and ideas. We define a scale simply as a sequence of unique notes (Figure 1A). Notes are pitch categories described by a single pitch, but as pitch is continuous, notes are more realistically described as regions of semi-stable pitch centered around a representative (e.g., mean, median) frequency. 12, 13 However, humans process relative frequency much better than absolute frequency, 14 so scales are practically specified by the intervals (frequency ratios) between notes. Thus, a scale is usually defined by the ratios made between all notes and the first note, called the tonic; we hereafter refer to these as scale notes. Intervals are determined by their frequency ratios, but since we perceive pitch logarithmically, 15, 16 they are naturally measured in units of cents – obtained by a base-2 logarithm of the ratio of frequencies and , . In what follows, steps will describe the intervals between adjacent notes, and intervals can refer to the interval between any pair of notes.
We explicitly define an important sub-class of scales, octave scales, which span an octave (frequency ratio 2:1; ) and have circular (or helical) structure such that notes repeat at every octave; 17 e.g., Fig. 1A shows that the first and last notes (an octave apart) of such a scale have the same name – a property is called octave equivalence). It is often reported that octave equivalence is one of the most universal features of music. 7, 8, 3, 4, 9, 10 However, this has been disputed, 18, 19, 20, 16, 13 and statistical study of octave prevalence is still lacking. Octaves are indeed salient in the harmonic spectra. 21, 22 Yet, experiments have indicated that octave equivalence is only a weak perceptual phenomenonon, 23, 24, 25, 26 that depends heavily on musical training, 27, 28, 29 and culture. 16 Nonetheless, several measurable phenomena related to harmonic tones may lead to preferential use of the octave: tonal fusion, 30, 31, 26 hearing in noise, 32, and memorability of complex tones. 33 For example, increased tonal fusion between octave intervals (likewise for fourths, fifths, which also undergo tonal fusion) may give rise to greater perception of synchrony when singing in parallel. 34

To address longstanding questions on scale diversity and evolution, we first document the creation of a database of scales. We then analyse the empirical scales to see which intervals are significantly frequent or infrequent, providing robust statistical evidence that the octave is prevalent among many societies. We examine the cross-cultural diversity of octave scales, finding that within-society variation can in some cases be as great as the total variation in scales – scales are surprisingly not that diverse. In particular, across all geographical regions step intervals are limited to , and scales are clustered around 5- and 7-note equidistant scales (scales where step sizes are similar in size). As a result of these restrictions, humans tend to use only of possible octave scales, which strongly suggests some degree of convergent evolution due to shared biases (in addition to convergence via cultural diffusion). Finally, we discuss the potential mechanisms of change and selection of scales, discuss the challenges in understanding scales evolution, and propose credible future directions for studying this evolution.
Scales Database
Database curation. A total of 60 books, journals, and other ethnomusicological sources were found to have relevant data on scales (SI Table 1). 35, 36, 37, 38, 39, 40, 41, 42, 43, 44, 45, 46, 47, 48, 49, 50, 51, 52, 53, 54, 55, 56, 57, 58, 59, 60, 61, 62, 63, 64, 65, 66, 67, 68, 69, 70, 71, 72, 73, 74, 75, 76, 77, 78, 79, 80, 81, 82, 83, 84, 85, 86, 87, 88, 13, 89, 90, 91, 92, 93 We note one previous attempt to create a database of scales from the ethnomusicological literature, 94 however there are no details on its construction, and it does not link scales directly to original sources. Our database improves on these issues through a stringent methodology (described below), sources for all scales and is presented as a digitized, open-access, resource which will continue to grow as new data is made available.
We can define scales (Fig. 1B) either prescriptively ("these are the notes you can use in a melody") or descriptively ("these are the notes that were used in the melody"). Theory scales consist of intervals with idealized, exact frequency ratios – they lack the random fluctuations that exist in the real world. These are mainly found in a limited set of cultures that exist along the old Silk Road route, and they are not necessarily played according to these theoretical ideals. 95, 93 Absence of theory scales does not mean that other societies lack musical theory, which can be found either explicitly through language, or implicitly through an understanding of what is ‘correct’ and ‘incorrect’ in a particular style. 96, 97, 98, 99, 2, 100 Theory scales are by definition prescriptive scales, although descriptive scales can be found which closely match these. Measured scales are obtained where measurements have been made of the notes on an instrument, or a recording of a song has been analysed with computational tools to extract a scale. Instrument tunings are by default prescriptive, but can be descriptive if all notes are used in a melody. There is some error in these measurements – taken with tools that include tuning forks, the Stroboconn, and modern computational approaches – but it is always within . Measured scales taken from song recordings are exclusively descriptive, and they make up the smallest part of the database. This is because it is still quite a challenge to reliably infer scales from a recording of a performance using algorithms, 76 and thus it requires extensive manual labor. Still, we believe that the future of studies on musical scales lies in tackling these challenges, due to the prospect of extracting descriptive scales from archives of ethnographic recordings. 101, 102, 103, 104 However, it is clear that the appropriate computational tools to perform such large-scale analyses are still lacking. 105, 106, 107
Another statistical regularity in musical pitch is tonality – i.e., the distribution of notes, how they are played (duration, ornamentation), and their transition probabilities. 109, 110 Of the various aspects of tonality, tonal hierarchies (probability distribution of notes) 111 have been best documented across cultures. 112, 113, 73, 114, 115 Tonality (or modality) is in some cases an integral part of a scale that determines how the notes should be played, 116 to the extent that musicians can reliably tell apart two ragas from the duration of a single note. 117 We emphasise that our definition of scale does not imply any specific tonal hierarchy, while acknowledging that similar definitions (e.g., maqam, raga) are often used with the expectation that they include tonality. 100 In the database, we account for tonality in a limited way by noting the order of notes in the scale, starting from the first note (tonic). However, this information is often unavailable, and we lack the finer details of note distribution or transition probabilities. Future cross-cultural analyses of recordings ought to document these important details. 116, 118
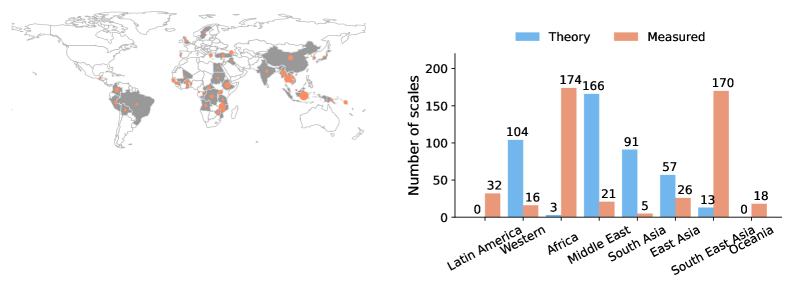
To enable a broad range of analyses we collected information pertaining to, where applicable, (i) the society (country, language or ethnic group, musical tradition), (ii) geography (country, geographic region) (Fig. 2), (iii) instrument type, (iv) tonic note, and (v) whether the scale is measured using harmonic or melodic intervals.
We additionally linked societies, where appropriate, to identifiers from other ethnographic and linguistic databases, such as D-PLACE and Glottolog. 119, 120 D-PLACE contains information on social structure, economic, and environmental information, while Glottolog can be used to determine the linguistic distance between two groups - a common proxy for cultural similarity. 121 Some musical traditions that span multiple countries (such as Western classical music) are also taken as a unit of society. Identification of the society or geographic origins of a scale was required for inclusion of scale data. Other details were found at varying frequency; e.g., tonic was only identified in out of measured scales.
Inferring octave scales. The database exists in two forms: the raw data (434 theory scales, and 462 measured scales), and a set of octave scales that is generated procedurally from the raw data according to five choices. For a complete workflow from source to database, including examples, and the choices we made to generate octave scales, see SI section "Inferring octave scales, SI Fig. 1-3, and SI Table 1-2.
In total, we infer octave scales ( theory octave-scales, octave-scales from instrument tunings, and octave-scales from song recordings), from societies. The theory scales span regions, while the measured scales span regions, and countries (Fig. 2). When inferring octave scales from measured scales, a principle assumption is that they add up to an octave. Since the validity of the assumption is not clear, we first study the statistics of the measured scales before studying octave scales.
Results
One of our goals is to estimate whether certain notes and intervals appear more or less frequently than expected by chance. This is hard to quantify, since we lack a universally-correct method of calculating the probability of observing an interval. Instead, we propose three independent statistical models that reflect different ways of constructing scales:
Model: Lognorm. This model assumes that scale notes are chosen independently from a lognormal distribution, . The rationale behind this choice is that small intervals should be uncommon ( as ) due to limits in pitch perception, and large intervals should be uncommon ( as ) due to physical constraints (human anatomy; instrument size). We expect that this model is inappropriate for within-scale analyses, since notes within a scale are unlikely to be chosen independently of each other, but rather according to specific choices made by a musician. However, if the choices made by many independent musicians are sufficiently diverse, then the lognormal distribution may be an appropriate description of the between-scales note distribution.
Model: Shuffle. This model assumes that specific step sizes are important, but their arrangement is not. Normally, both step size and order determine scale notes. But now consider a musician who cares only about the step sizes, not their order in which they are arranged. This can be approximated by sampling from the original data and reshuffling the order of step sizes.
Model: Resample. This model assumes that step sizes are chosen independently from a distribution, and arranged randomly into scales. This is equivalent to a musician who is indifferent to both the step size, and the order. A reasonable choice of a distribution in this case is the posterior distribution of all step sizes.
In any alternatively-sampled set of scales, the number of scales and the number of notes in these scales matches the original. In the following sections, we will use these three models to, first, compare intervals between scales, and second compare intervals within scales, searching for evidence of statistically significant counts of intervals.
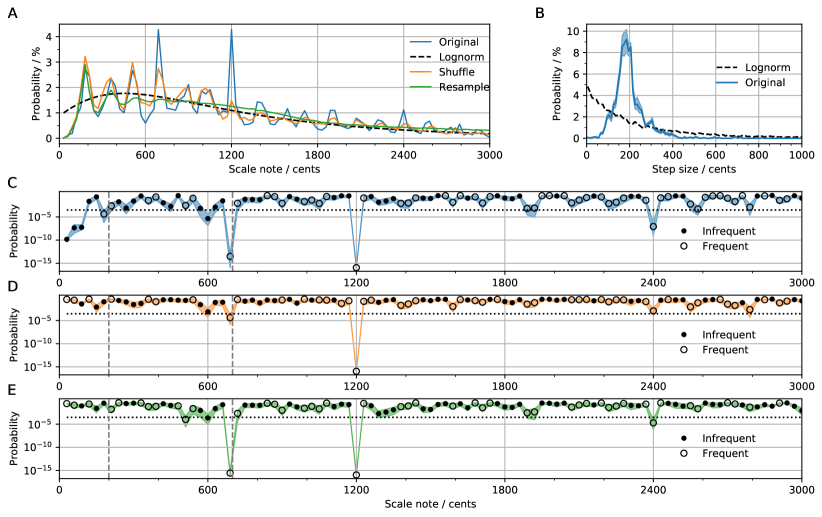
Statistically significant intervals between scales. To search for statistically significant (due to an abundance or dearth of) intervals, we first plot the distribution of scale notes (Fig. 3A, Original) and step sizes (Fig. 3B, Original) for a sub-sample including only measured scales, without imposing octave equivalence, and controlling for society ( scales sampled from a total of scales, with no more than per society, resampled times to achieve convergence; SI Fig. 4). We compare this empirical distribution to the maximum-likelihood lognormal distribution (Fig. 3A, Lognorm), and the corresponding step size distribution (Fig. 3B, Lognorm). As expected, we find that scales drawn from the lognormal distribution have step sizes that do not resemble real scales – since notes within a scale are not independent. Instead, notes within scales are more evenly distributed, such that step sizes are peaked at , and rarely smaller than (Fig. 3B); this is found in every geographical region that we investigated (SI Fig. 5). However, scale notes from different scales are independent of each other, resulting in a distribution that is approximately lognormal when many scales are sampled (Fig. 3A).
The utility of fitting a lognormal distribution to the data is that it can serve as a null-hypothesis baseline for estimating the probability that a scale note appears more or less than chance. To this end, we integrate the lognormal distribution over the range of each histogram bin in Fig. 3A to get the probability of observing scale notes, . We then calculate the binomial probability, , where is the number of observations in bin , and is the total number of observations. We report either: the probability that or higher is observed if , ; or else, the probability that or less is observed, , if . Low probability implies significant deviation from the null lognormal hypothesis. We see that only a few intervals deviate significantly from the lognormal distribution (Fig. 3C): nd are found more frequently, while is found less frequently than chance. This is strong evidence that the octave (and the fifth) are important intervals in many societies.
To corroborate these findings, we repeat the significance test with different assumptions on how scales are generated. We first repeatedly shuffle the step sizes in each scale to generate new scales, to examine whether the statistically significant intervals would arise if step sizes were ordered randomly (Fig. 3D). Similarly, by resampling with new step sizes, we can test whether the significant intervals could plausibly have been produced by arranging randomly selected step sizes from the distribution in Fig. 3B (Fig. 3E). These analyses demonstrate that the peak at (Fig. 3C) is due to it being the most common step size. The values of and are found to be less significant than in Fig. 3C, but are still much more significant than most intervals. The fact that the peak at is significant in Fig. 3D but not in Fig. 3E is likely due to the presence of equidistant scales (SI Fig. 6), where the order of the intervals is mostly irrelevant. By this logic, one might expect the peak at to disappear in Fig. 3D, but it survives because a large fraction of equidistant scales do not extend beyond the octave (SI Fig. 6). Remarkably, the octave is extremely significant according to all three tests.
Statistically significant intervals within scales. The previous method was used to assess whether intervals are found more than expected by chance across a collection of scales. Since grouping together scales from different societies might be problematic, we require a test that can discriminate unusually frequent / rare intervals within individual scales. To this end, we compare the original scales with many alternative scales that are created by shuffling the original scales’ step sizes. We use the full range of intervals that can be generated with an instrument, not just the scale notes. For an instrument with notes, this results in intervals. By sampling many more intervals, this test is powerful enough to detect, in some cases, significant signals within individual scales.
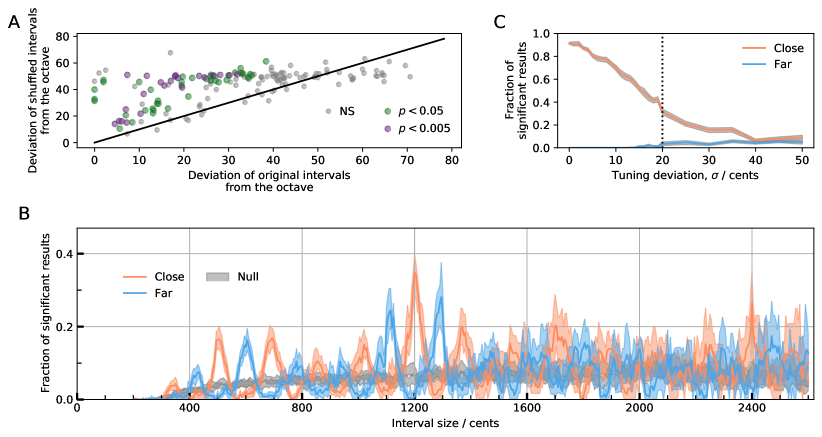
To test for statistical significance of an interval , we find all intervals in a scale that fall within of , and calculate their distance from . We repeat this process for shuffled versions of the scale, collecting all intervals within of in a second group. We then use a Mann-Whitney U test to examine whether either set of intervals, original or shuffled, is significantly closer (i.e., ) to the octave than the other (repeating times to get a converged average). We demonstrate this procedure for (Fig. 4A): in most scales the original intervals are closer to an octave than the shuffled scales, although only a fraction of results are significant. Reasons for non-significant results include small sample sizes and the tendency of equidistant scales to produce similar intervals when shuffled.
We extend this analysis to all intervals over the range cents, showing the fraction of significant results indicating an interval is found more or less frequently than chance (Fig. 4B). Without a doubt, the most significant interval is the octave ( significantly close), and the intervals that are most significantly avoided in scales are the regions flanking the octave. In further agreement with the between-scales analysis, the next most significant regions are those around , and .
To put these results in perspective, we repeat the test on sets of scales generated by resampling step sizes from Fig. 3B (Fig. 4B, Null). The null distribution converges to as expected, which clearly demonstrates that the high fractions of significant results in the original scales are not artefacts due to testing multiple hypotheses. Additionally, we show that the results do not depend on our choice of (SI Fig. 7). The consistency of these test results reinforces the conclusion that these significant intervals are not chosen randomly.
Effect of tuning variability on the search for universal intervals. Observation of significant intervals likely reflects the intentions of the musician to tune to these intervals. However, non-significant results do not necessarily indicate lack of such intentions, as imprecision in tuning (and tuning measurements) may result in false negatives. To understand the impact of imprecision, we generate a test set of scales (by sampling step sizes from Fig. 3B) and fix all scale notes that are to be exactly an octave higher than one of the notes that are . We then add to the test sets normally-distributed noise, . Even without noise (), this test can find significant results only of the time (Figure 4C), which demonstrates the difficulty in inferring intentionality simply due to low sample sizes.
To estimate reasonable bounds on the noise , one may first consider that the measurement error varies from about for computational methods (e.g., Stroboconn), 122 to for tuning forks. Also, instruments vary in the stability of their notes: e.g., humans typically sing with a standard deviation of at least about . 123, 124, 114, 125, 126, 12, 127, 13 However, the main source of error is perception: humans make mistakes in discriminating intervals below (although we lack replications with non-Western participants). 128, 129, 130, 131 Thus, we can expect a reasonable upper bound to the proportion of significant results that can be detected of about o . Thus, when we find the octave to occur significantly more than chance about of the time (Fig. 4B), this is a rate that is within the range of the hypothetical maximum.
Ultimately, it is hard to say how exactly scales are chosen. Were some important intervals fixed first (e.g., the octave), and then the rest chosen to fill the gaps? Or were step sizes of a certain size (e.g., big and small size categories) chosen, and then arranged in some preferred order? 132
What we have conclusively shown is that independently of how scales are created, they show a significant, consistent bias towards including some notes, and avoiding others.
Qualitative evidence for preferential use of octaves. A more direct route to understanding the intentions of musicians is through detailed ethnography. We therefore examined each source for qualitative evidence indicating preferential use (or absence) of the octave (SI Dataset 1). We found qualitative evidence in support of octave use in 26 out of 60 sources: use of the octave to tune instruments (8 sources); performing melodies in parallel octaves (11 sources); using the same name for notes an octave apart (10 sources), which is also strong evidence for octave equivalence. We also find quantitative evidence (statistically significant octaves for at least one scale; Fig. 4A) in 26 sources; in total, 40 sources contain either quantitative or qualitative evidence. For 6 of the remaining 20 sources, there is evidence from secondary sources for preferential use of the octave in those cultures; another 3 sources report on archaeological findings, which are difficult to investigate further. 48, 57, 63
Two sources (Georgian polyphonic singing) provided qualitative evidence that fifths are perceptually important, instead
of octaves; 13, 89 however, we found statistically significant octaves in one of these sources, so the evidence here is mixed. 13
A third source (Colombian marimba) provided quantitative evidence that octaves were found significantly less than chance. 85
Overall, we find some evidence (either primary or secondary) in support of octaves being significant
in 46 out of 60 sources, and evidence to the contrary in 3 sources. These findings strongly support the view that octaves are widespread, but not absolutely
universal. 19, 20
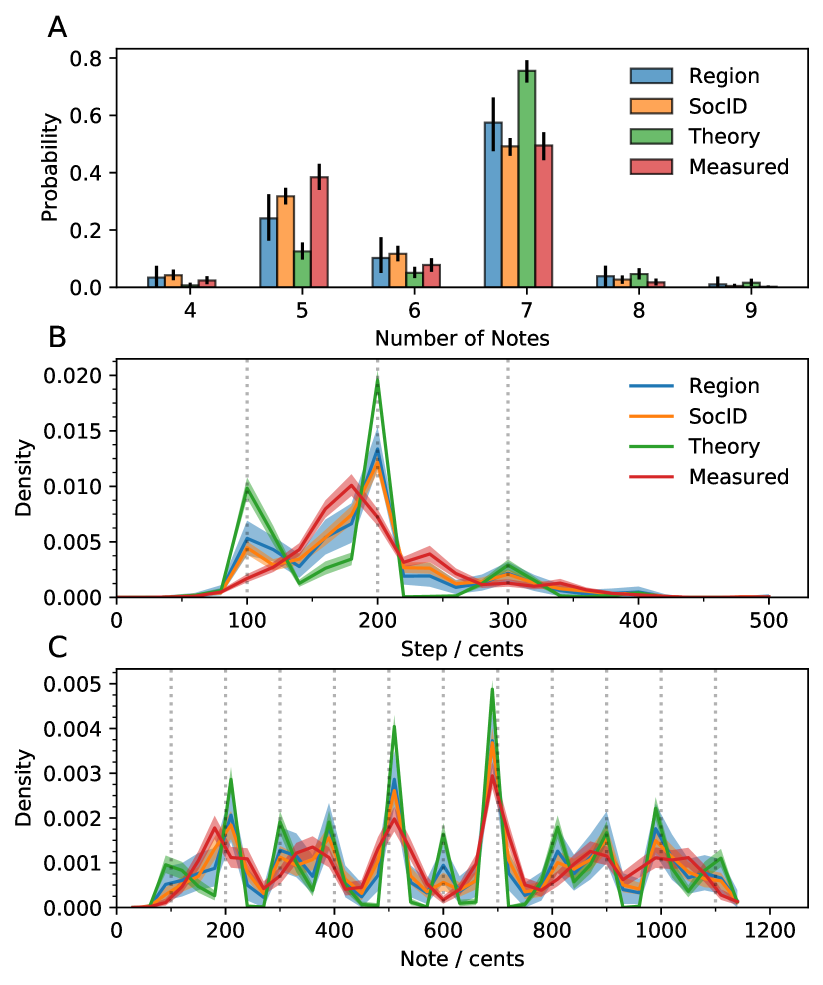
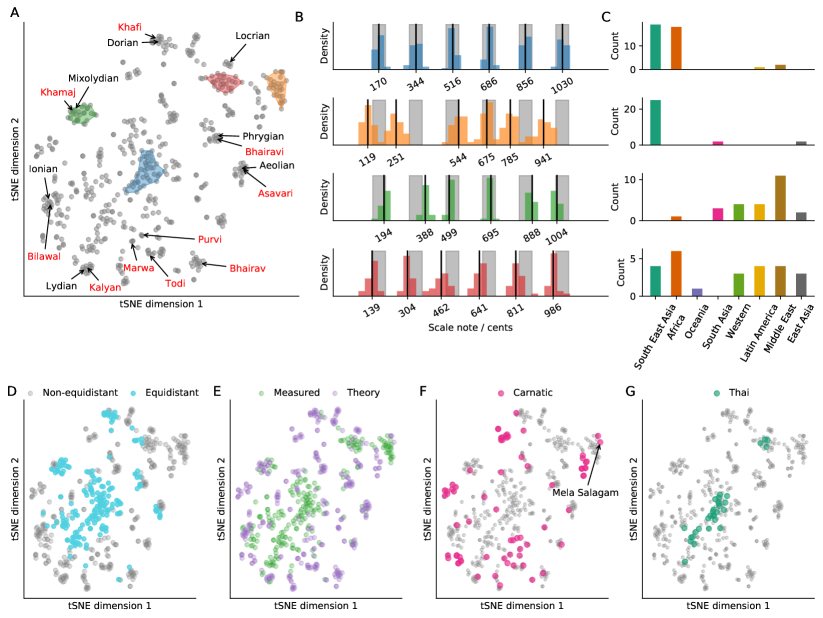
Statistics of Octave Scales. After verifying that preferential use of octaves is indeed widespread, we proceed to studying octave scales; we infer octave scales by making some assumptions (e.g., octave equivalence; see section “Inferring octave scales”). While in the previous section we exclusively examined measured scales, here we look at a mix of theory and measured scales. Data is shown for four samples of scales: (i) all theory scales, (ii) all measured scales, (iii) sub-sample controlling for society (‘SocID’, no more than 5 scales per society), and (iv) a sub-sample controlling for geographical region (‘Region’, no more than 10 scales per region).
Most scales are found to have 7 or fewer notes (Fig. 5A), in agreement with previous work. 6 6-note scales are remarkably rare across all sampling schemes. The predominance of step sizes of (Fig. 3B) is also seen in octave scales (Fig. 5B). Consistent with existing literature, 2 most steps are between , and this applies in all geographic regions studied (SI Fig. 5). The most common notes (Fig. 5C), in all sub-samples, are exact matches for the significant intervals in Fig. 4B ( ). The fact that the statistics of octave scales is consistent with the statistics of measured scales (and with previous work), to an extent, validates our methodology for extracting octave scales (SI section “Inferring octave scales”).
Theory scales show sharp peaks at intervals close to 12-TET intervals. In contrast, the distributions of steps and notes in measured scales are much more diffuse. This difference is expected, since theory scales consist of mathematically-exact, ideal intervals, while measured scales include natural sources prone to error and variation. There is, however, correspondence between theory and measured scales in the rarely used notes ( ), which is even clearer when controlling for the number of notes (SI Fig. 8).
Regardless of the number of notes in a scale, we find salient peaks at nd (SI Fig. 8). Overall, despite some differences between theory and measured scales, both sets are in agreement over the most distinct features: (1) step sizes
are usually , and between , and (2) the most salient notes are at nd , while the regions around these notes are avoided in scales.
Variation across societies is comparable to variation within some societies. To quantify variation in scales across societies, we use t-distribution stochastic neighbour embedding (tSNE) to map the scales onto a reduced two-dimensional representation. 133 This method can compare only scales with the same number of notes, so we show results separately for 7-note scales (Fig. 6A), and 5-note scales (SI Fig. 9). We group scales into clusters (using the DBSCAN algorithm (eps = 2, minimum samples = 5), 134 and report note distributions and region distributions for the largest four clusters. The tSNE embedding is useful for visualizing diversity among high-dimensional objects, but note that tSNE dimensions are arbitrary. The main information in this plot is the distances between points: distances in the 2d-embedding are non-linearly related to the real distances, such that 2d distance from one scale to all other scales will have a high rank-correlation with the real distances.
The simplest and most salient feature is that scales tend to be almost equidistant (Fig. 6D). For example, in the largest cluster (Fig. 6A-B; blue), notes are all within of the corresponding notes in the equiheptitonic scale. Although most examples (29 / 40) of this cluster (Fig. 6D) come from three countries (Thailand, Guinea, Malawi), in total they are found in countries (e.g., Colombia, Georgia, Zimbabwe, Indonesia). Surrounding this cluster (Fig. 6A), we can find examples of theory scales: Western diatonic modes, and North Indian thaat (e.g., green cluster). In general, we see that most equidistant scales are measured scales, but there is also a lot of overlap between theory and measured scales (Fig. 6E). Furthermore, when clustering societies by scale similarity, we find two main clusters – one dominated by societies with theory scales, and one dominated by societies with equidistant scales (SI Fig. 10-11). Examples of scales that are furthest from equiheptatonic include the Gamelan pelog scale (Fig. 6A-B; yellow cluster), and the Carnatic mela salagam (Fig. 6F), which both have many small step sizes in a row.
Surprisingly, there seems to be little variation overall, such that multiple societies
that use theory scales exhibit levels of within-society variability comparable to
the total variability (Fig. 6F). In general, we find that geographical regions
tend to contain overlapping subsets of scales (SI Fig. 12A), and distances between scales
within-regions are of similar magnitudes to distances between scales between-regions (SI Fig. 12B).
Even Thai scales, which are often cited as exclusively being in equiheptatonic tuning 47, 62, 69, 70 – although this is disputed 68 – exhibit substantial within-society variability (Fig. 6F). Overall, there appears to be less variation in 7-note scales than might have been expected, and a similar analysis of 5-note scales reveals similar results (SI Fig. 8), which suggests that they share the same organizing principles.
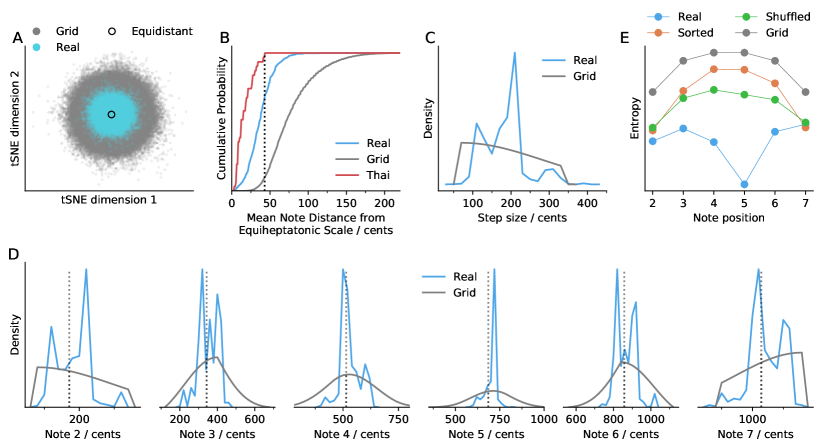
Statistical analysis shows that scales tend to be equidistant. To put the diversity of scales in a broader context, one may consider a hypothetical universe of possible scales by enumerating them on a grid (grid scales). To this end, we take as a basic grid resolution, and enumerate all possible unique scales with step sizes within ; this limitation on step size already reduces the number of possible scales (at resolution) by . To conveniently compare grid and real scales, we examine their 2-dimensional embedding. Strikingly, those grid scales that correspond to real scales (i.e., within of a real scale) are clustered around the equiheptitonic scale (Fig. 7A, cyan). For comparison, Thai scales are found to be as far as from equiheptatonic. We find that of real scales are within this boundary, compared to only of grid scales (Fig. 7B). Alternative definitions of equidistance based on step sizes rather than scale notes also support the finding that scales tend to be close to equidistant (SI Fig. 11).
To gain further insight into the striking (near-) equidistance of scales, we look at the note distributions for notes (Fig. 7D) for real scales and grid scales. The grid scales show the broadest note distributions for the two notes (4 and 5) furthest from the fixed ends (tonic, octave), resulting in higher entropy (Fig. 7E). This is expected, since summing two random distributions should result in a higher variance; e.g., note 4 is the sum of three steps drawn from Fig. 7C. In contrast, distributions of notes 4 and 5 in real scales are most predictable (lowest entropy), once again illustrating the significance of intervals of size nd .
To examine the possibility that the difference between real scales and grid scales is mainly due to differences in their step size distributions (Fig. 7C), we analyse two other sets of note distributions. We first look at the note distributions that ought to be farthest from equidistant scales: we rearrange the steps in each real scale so that they are ordered low-to-high, and consider scales starting from every position. This results in note distributions with entropy similar to grid scales (Fig. 7E, Sorted). We then look at the note distributions of alternative versions of real scales obtained by shuffling the step sizes in scales. Again, we find that the entropy is highest at notes 4 and 5 (Fig. 7E, Shuffled),in contrast to real scales. The main difference between the real scales and grid scales appears to be that step sizes in real scales are well-mixed – small steps are found adjacent to large steps rather than small steps (and vice versa).
Discussion
How diverse are scales? Despite some differences, scales across cultures are remarkably similar. For example, the set of Carnatic scales alone is almost as varied as the total set of scales (Fig. 6F). In particular, most scales observed in cultures – when compared to the universe of possible scales – are close to 5- and 7-note equidistant scales (Fig. 7, SI Fig. 12). Many authors have reported that equidistant scales are rare. 2, 135, 136, 10, 6, 137 Yet, we find that they are more prevalent than expected by chance. This discrepancy may be due to the lack of a robust definition for equidistant scales – for example, the only previous statistical study of prevalence of equidistance does not explicitly account for natural variation in intonation. 6 It is not clear how much deviation from perfect equidistance renders a scale perceptually non-equidistant, or how variability in pitch affects perception of equidistance. As an illustration of the difficulties, consider the following example from Georgian singing: the step sizes in this scale are close to equidistant () when viewing the melodic pitch histogram. But the intervals between notes in the melody are much less exact (); 13 despite being statistically equidistant, it is not clear whether this scale would be perceived as equidistant. Perception of equidistance may also vary with culture and training, in which case it may be better to avoid binary measures of equidistance, and instead to construct a perceptually-relevant, continuous measure.
The most salient difference between societies is whether their data consisted of theory scales or measured scales (SI Fig. 9-10), considering that theory scales appear to be less equidistant than measured scales. One hypothetical explanation for the predominance of non-equidistant scales in societies using theory scales: the process of creating new scales by combining simple-integer-ratio intervals will inevitably result in more non-equidistant scales because only one combination of step sizes can result in an equidistant scale. We wonder whether this societal difference would persist if we were to only compare measured scales from societies, since theory scales will certainly exhibit intonation variability when performed. In the literature, Western scholars often discuss variation in intonation in societies that lack mathematical musical theory as being an intentional form of expression, 138, 139, 140, 141, 64, 68 whereas studies of classical musics typically investigate to which theoretical tuning system the musicians conform. 123, 126, 127, 13 Ultimately, it is difficult to intuit the differences between societies, since there are only a few cross-cultural studies of interval discrimination. 142, 143 Here, we performed a preliminary study on intonation variability (SI Fig. 13-14), finding comparable levels of variation (with the possible exception of the pelog scale) in Gamelan orchestras, Thai xylophones, Turkish ney, 91 Georgian singing, 89 and a Belgian carillon. 144 But ultimately, to understand the differences between societies that use theory scales and those that do not, we will need cross-cultural perceptual experiments, and direct measurements of scales from recordings.
How did far-away societies come to use such similar scales? –
Using a cultural-evolutionary framework, 145 we can describe this process as a combination of
cultural diffusion, and convergent evolution due to common factors biasing the use of scales across cultures.
Diffusion can certainly account for some similarities, as some societies have documented shared history:
e.g., societies with theory scales in the Middle East, or East Asia; court music in Thailand, Laos and Cambodia. 100
Some have suggested that cultural diffusion can be inferred based on two cultures using similar
equiheptatonic scales, 80, 85 but evidence seems circumstantial
given how widespread equiheptatonic scales are.
Instruments, on the other hand, are a richer source of information than scales, so organology studies are
a much more direct way of inferring cultural diffusion. 146, 147, 148, 149
While there is undoubtedly some transmission of information across cultures,
we reiterate that:
within-region scale diversity is comparable to between-region diversity (SI Fig. 12B),
step intervals consistently show approximate limits of across regions (SI Fig. 5),
and scales are (against chance odds) overwhelmingly close to equidistance in all regions (SI Fig. 12A).
Taken together, these facts point towards some non-negligible degree of convergent evolution due to shared biases.
How do scales evolve over time? Scales can change, or persist, in a variety of ways. On a short time-scale, vocal (or other non-fixed-pitch instrument) scales are inherently stochastic, due to a lack of precision in motor control. 150 On a longer time-scale, vocal scales reside in memory, which introduces another mechanism of change. Unlike vocal scales, instrument tunings physically persist through time, but are still affected by multiple factors: environment (temperature, humidity), material (wood, metal, animal organs), and physical force. 49 To illustrate this point, we checked examples of repeated tunings of the same instruments across a specific time frame: Gamelan orchestra (metal idiophone), with standard deviation of notes, (slendro) and (pelog) cents over about 25 years; 46 Angolan likembe (plucked metal idiophone), where over a few weeks; 49 Gambian kora (chordophone), with over one week. 52 Technology offers more robust ways of keeping scales stable over time: monochords (ancient Greece) and pitch pipes (ancient China) enable reliable tuning by fourths and fifths. 36 Likewise, the perceptual phenomenon of tonal fusion may have enabled stable scales by providing knowledge of perceptual anchors (octaves and fifths) that can be reliably passed through generations. Recently, it seems to us that stability in scales has been reinforced though global tuning standards and inventions such as fixed pitch instruments and electric tuners. Thus, we can see that scales change in many ways, but it is possible for the rate of change to decrease through the use of technology and musical theory.
We can imagine some possible mechanisms of scale evolution, drawing analogies with biological evolution: We can think of a single scale as a gene, and a set of scales used by a population of people as a genome. Changes to the scale notes is akin to mutating a single nucleotide. Adding or removing notes from a scale is like insertions/deletions of nucleotides. Scales can be copied through interactions between populations; genes can be shared through horizontal transmission. The Western diatonic modes can be constructed using the same step intervals, but changing the tonic position; the same process occurs in protein sequences (circular permutants), likely through gene duplication and homologous recombination.
The analogy starts to break when you consider that scales can be invented, which is more akin to designing genomes. There are recent examples of invention of microtonal tunings in Western music, 151, 64, 36 and many theory scales bear the hallmarks of design: Greek modes are all circular permutants, based on simple integer ratios; 152 the Carnatic melakarta result from combinatorial enumeration of a set of intervals, constrained by a set of rules. 153 Similarly, other cultures that have a long history of mathematical scholarship 154 use overlapping sets of scales based on theoretical divisions of the octave. 155, 156, 157, 95, 158, 159 Typically, though, the theory scales that still survive are similar to the meaured scales, so it is likely that designed scales are constrained by similar selection criteria that applies to non-designed scales.
We propose that a detailed mechanistic model of scale evolution is possible:
The mechanisms of spontaneous change need to be studied at the resolution of a single mutation step (through, e.g., transmission chain experiments).160
The relative importance of
the different mechanisms could be investigated with sufficient long-term data
(e.g., same individual/group/culture, over a period of months/years).
Such a model could then be used for agent-based modelling to study the role
of horizontal transmission, and cultural-evolutionary biases.
How are scales selected? We propose three types of selection pressure: (i) cultural-evolutionary biases are based on how many people, or which people in one’s group are using the scale; 161 (ii) cognitive biases depend on how pitch is perceived by humans; and (iii) production biases depend on what is easy or difficult to sing, and physical constraints on instruments.
We can think of three examples of cultural-evolutionary biases that may apply to music: conformity, novelty and presitge biases. A bias towards conformity results in the most populous scale type being increasingly successful. In general, humans tend to synchronize 34, 162 when playing music (same meter, tonality), and over a longer time period, there is evidence of shifts towards the use of 12-TET. 126, 163 A conformity bias could arise due to other reasons, but we can probably rule out the difficulty of learning scales – studies on novel scale systems have shown that people rapidly learn their statistics. 164, 165 Novelty biases could be can describe choosing novel microtonal tunings as a means of expression. 151, 140 An example of a prestige bias is where tunings are copied from players/instruments that are acknowledged as good. 46, 87
Theories of scale selection are commonly based on cognitive biases, of which we will give a brief summary: liking harmonicity, 166, 167 disliking sensory dissonance 168, 169 (or liking sensory dissonance 114), tonal fusion, 30 neurodynamic theory, 170 transmissibility, 132, 171, 12, 172, 160 memory, 173 and theories based on mathematical properties of scales. 174, 175, 176, 177, 178, 179
Production constraints can apply to both singing and instruments. 180 When singing, large intervals cost more energy to produce than smaller ones, while small intervals are difficult to produce reliably due to limits on motor control. 181
Instruments are less constrained in this way, but still have physical limits to the number of notes, and interval range.
On the other hand, instruments are constrained in how reliably they can be re-tuned to the same scale.
There is a long history 152, 182 behind the practice of tuning using harmonic intervals, 50, 52, 88, 59, 67
and reports exist of tuning according to the step sizes, 38, 49, 51 tuning instruments visually, 96, 88, 183, 87 and copying a reference instrument. 46, 87
How can we study the evolution of scales? Tracing the evolutionary history of scales is challenging. Scales change at rates that depend on the instruments and technology, and new scales can be invented from scratch. The evolution is potentially driven by numerous selection pressures that vary in strength across societies. Nonetheless, we propose some approaches that seem feasible.
We can try to track evolutionary trajectories of scales using historical data. By restricting the scope to a single society, one can make simplifying assumptions by using ethnographic accounts to inform models. For example, about Gamelan orchestras we know that they are typically tuned in reference to another orchestra, 140 and instrument intonation changes at a steady rate (due to similar materials and environment). This can be described as an evolving network of Gamelan orchestras with edges between orchestras that influence each other. Gamelan tunings are also extensively documented in the literature, and additional tunings can be inferred from recordings.
Another approach to infer the evolutionary trajectories or selection pressures is by analyzing a population of scales. This approach requires appropriate mathematical models where multiple selection pressures can be considered in tandem. Ultimately, many models may have convergent predictions, which means that additional experiments are needed to distinguish the relative importance of different selection pressures. One limitation of this approach is the dependence on the sample of scales studied, and it is hard to construct a priori a representative sample of scales. In this study we control for society, but other criteria are possible.
Does it matter if societies have different population sizes? How does one deal with differences in within-society variation in scales? Should we take into account frequency of scale use within a society? 184, 100
These questions will surely unravel as more data becomes available for hypothesis testing.
Possible bias in the scale database. Relying on data collected by a limited number of ethnomusicologists, the database at this stage has sparse geographic coverage (Fig. 2). Some have suggested that ethnomusicologists have a bias towards reporting findings that are considered ‘interesting’, thus exaggerating diversity. 20 Certain musical traditions, such as Gamelan and Thai, were very popular research topics, so they are over-represented. In contrast, there are very few quantitative measurements of scales or instruments with fewer than 5 notes, despite these being reported in many sources. Additionaly, vocal scales (taken from recordings of singing) are scarce in the database, yet the voice is probably the most important instrument from an evolutionary point of view. 12
Unfortunately, in some rare instances there seem to be statistical irregularities in the reporting of tunings: Surjodiningrat et al. 46 note that Jaap Kunst 185 reported gamelan tunings (not included in this database) where all the higher notes were exactly an octave above the lower ones, and that this is extremely unlikely; in a study of prehistoric bone flutes where the tunings are given to an accuracy of , one flute is recorded as having a series of equal tempered intervals: . 63 Ultimately, these biases do not void the conclusions, but the results shown here will certainly need to be updated as more data becomes available.
Limitations to studying scale evolution. We may be witnessing a decline in diversity of scales due to the converging forces of globalization and technological change. 186 There is already evidence of homogenization, via the adoption of 12-TET. 163, 126 Thus, to understand how scales evolve, we must look to the past, but therein lies a different problem: the older the instrument, the less certain we are about how they were played. For prehistoric artefacts, we cannot be sure whether they (or their reconstructions) faithfully resemble the instrument in its original condition. So far, the the only instruments that remain sufficiently intact to play are aerophones, 48, 57, 63 which can produce many different scales depending on how they are played. 183, 187, 188, 189 Thus, we believe that the best source of scales is in ethnographic recordings spanning the past century. 103 It is therfore imperative that methods be developed that can faithfully infer scales from large samples of songs. Algorithms must be developed to handle low-quality recordings, 190 background noise, instrument / singing segmentation, 191 polyphonic stream segmentation, 192 note segmentation, 193 and tonal drift. 194
Conclusion
Scales are a cornerstone of music across the world, upon which endless combinations of melodies can be generated. Surprisingly, despite a wealth of ethnomusicological research on the subject, we lacked a comprehensive, diverse synthesis of scales of the world. Here we remedy this issue, with a focus on quantitative data that will enable detailed statistical analyses about how scales evolve. Our own preliminary analyses have lent quantitative and qualitative support for the widespread (but not necessarily universal) use of the octave in some special capacity. Despite the rich diversity of scales, when put in context of how many scales are possible, what stands out in our analysis is how remarkably similar they are across the globe.
Altogether, this work presents a treatise on the evolution of scales, and proposes promising avenues for future research.
Author Contributions. JM and SP were involved in creating the database; JM performed statistical analyses; TT supervised the project and edited the manuscript; JM wrote the manuscript with input from TT, SP.
Data and Code Availability.
DaMuSc (Database of Musical Scales) is available at https://github.com/jomimc/DaMuSc.
An archived version of DaMuSc, along with data needed to recreate figures is available at Zenodo (http://doi.org/10.5281/zenodo.7250281).
Analysis code and code for creating figures is available at https://github.com/jomimc/DaMuSc_Paper_Code.
Acknowledgements. We thank Olga Velichkina, Frank Scherbaum, Malinda McPherson for discussions and comments on the manuscript. We thank Polina Proutskova, Elizabeth Philips, Steven Brown, Patrick Savage, Kaustuv Kanti Ganguli, John Garzoli and Neil McLachlan for discussions.
References
- Lerdahl and Jackendoff (1996) F. Lerdahl and R. S. Jackendoff. A Generative Theory of Tonal Music, Reissue, With a New Preface. MIT press, 1996.
- Patel (2010) A. D. Patel. Music, Language, and the Brain. Oxford university press, 2010.
- Burns (1999) Edward M. Burns. Intervals, scales, and tuning. In Diana Deutsch, editor, The Psychology of Music (Second Edition), pages 215 – 264. Academic Press, San Diego, second edition edition, 1999. doi: https://doi.org/10.1016/B978-012213564-4/50008-1.
- Carterette and Kendall (1999) E. C. Carterette and R. A. Kendall. Comparative music perception and cognition. In Diana Deutsch, editor, The Psychology of Music (Second Edition), pages 725–791. Academic Press, San Diego, second edition edition, 1999. doi: https://doi.org/10.1016/B978-012213564-4/50008-1.
- Khe (1977) Tran Van Khe. Is the pentatonic universal? a few reflections on pentatonism. The World of Music, 19(1/2):76–84, 1977.
- Savage et al. (2015) P. E. Savage, S. Brown, E. Sakai, and T. E. Currie. Statistical universals reveal the structures and functions of human music. P. Natl. Acad. Sci. Usa., 112(29):8987–8992, 2015. doi: 10.1073/pnas.1414495112.
- Kolinski (1967) M. Kolinski. Recent trends in ethnomusicology. Ethnomusicology, 11(1):1–24, 1967. doi: 10.2307/850496.
- Harwood (1976) Dane L. Harwood. Universals in music: A perspective from cognitive psychology. Ethnomusicology, 20(3):521–533, 1976.
- Trehub (2000) S. E. Trehub. Human processing predispositions and musical universals. In Nils L. Wallin, Björn Merker, and Steven Brown, editors, The origins of music, pages 427–448, 2000.
- Brown and Jordania (2013) Steven Brown and Joseph Jordania. Universals in the world’s musics. Psychol. Music, 41(2):229–248, 2013. doi: 10.1177/0305735611425896.
- Kuroyanagi et al. (2019) J. Kuroyanagi, S. Sato, M. J. Ho, G. Chiba, J. Six, P. Pfordresher, A. Tierney, S. Fujii, and P. Savage. Automatic comparison of human music, speech, and bird song suggests uniqueness of human scales. In Proceedings of the Folk Music Analysis (FMA 2019), 2019.
- Pfordresher and Brown (2017) Peter Q. Pfordresher and Steven Brown. Vocal mistuning reveals the origin of musical scales. Eur. J. Cogn. Psychol., 29(1):35–52, 2017. doi: 10.1080/20445911.2015.1132024.
- Scherbaum et al. (2020) Frank Scherbaum, Nana Mzhavanadze, Simha Arom, Sebastian Rosenzweig, and Meinard Müller. Tonal Organization of the Erkomaishvili Dataset: Pitches, Scales, Melodies and Harmonies. Number 1. 2020. doi: 10.25932/publishup-47614.
- Levitin and Rogers (2005) Daniel J. Levitin and Susan E. Rogers. Absolute pitch: Perception, coding, and controversies. Trends Cogn. Sci., 9(1):26–33, 2005. doi: https://doi.org/10.1016/j.tics.2004.11.007.
- Attneave and Olson (1971) Fred Attneave and Richard K. Olson. Pitch as a medium: A new approach to psychophysical scaling. The American Journal of Psychology, 84(2):147–166, 1971.
- Jacoby et al. (2019) Nori Jacoby, Eduardo A. Undurraga, Malinda J. McPherson, Joaquín Valdés, Tomás Ossandón, and Josh H. McDermott. Universal and non-universal features of musical pitch perception revealed by singing. Curr. Biol., 2019. doi: 10.1016/j.cub.2019.08.020.
- Shepard (1982) R. N. Shepard. Geometrical approximations to the structure of musical pitch. Psychol. Rev., 89(4):305–333, 1982. doi: 10.1037/0033-295X.89.4.305.
- Udo (1997) W. Udo. Two types of octave relationships in central australian vocal music? Musicology Australia, 20(1):6–14, 1997. doi: 10.1080/08145857.1997.10415970.
- Nettl (2000) B. Nettl. An ethnomusicologist contemplates universals in musical sound and musical culture. In Nils L. Wallin, Björn Merker, and Steven Brown, editors, The origins of music, volume 3, pages 463–472, 2000.
- Nettl (2010) B. Nettl. The Study of Ethnomusicology: Thirty-One Issues and Concepts. University of Illinois Press, 2010.
- Lloyd (1942) Llewelyn S. Lloyd. Modern science and musical theory. Journal of the Royal Society of Arts, 90(4619):581–594, 1942.
- Parncutt and Hair (2018) R. Parncutt and G. Hair. A Psychocultural Theory of Musical Interval: Bye Bye Pythagoras. Music Percept., 35(4):475–501, 2018. doi: 10.1525/mp.2018.35.4.475.
- Dowling and Hollombe (1977) W. J. Dowling and A. W. Hollombe. The perception of melodies distorted by splitting into several octaves: Effects of increasing proximity and melodic contour. Perception & Psychophysics, 21(1):60–64, 1977. doi: 10.3758/BF03199469.
- Krumhansl et al. (2000) Carol L. Krumhansl, Pekka Toivanen, Tuomas Eerola, Petri Toiviainen, Topi Järvinen, and Jukka Louhivuori. Cross-cultural music cognition: Cognitive methodology applied to north sami yoiks. Cognition, 76(1):13–58, 2000. doi: https://doi.org/10.1016/S0010-0277(00)00068-8.
- Bonnard et al. (2013) D. Bonnard, C. Micheyl, C. Semal, R. Dauman, and L. Demany. Auditory discrimination of frequency ratios: The octave singularity. J. Exp. Psychol. Human., 39(3):788–801, 2013. doi: 10.1037/a0030095.
- Demany et al. (2021) Laurent Demany, Guilherme Monteiro, Catherine Semal, Shihab Shamma, and Robert P. Carlyon. The perception of octave pitch affinity and harmonic fusion have a common origin. Hearing Res., 404:108213, 2021. doi: https://doi.org/10.1016/j.heares.2021.108213.
- Allen (1967) D. Allen. Octave discriminability of musical and non-musical subjects. Psychon. Sci., 7(12):421–422, 1967. doi: 10.3758/BF03331154.
- Kallman (1982) H. J. Kallman. Octave equivalence as measured by similarity ratings. Perception & Psychophysics, 32(1):37–49, 1982. doi: 10.3758/BF03204867.
- Hoeschele et al. (2012) M. Hoeschele, R. G. Weisman, and C. B. Sturdy. Pitch chroma discrimination, generalization, and transfer tests of octave equivalence in humans. Attention, Perception, & Psychophysics, 74(8):1742–1760, 2012. doi: 10.3758/s13414-012-0364-2.
- Stumpf (1890) C. Stumpf. Tonpsychologie. Leipzig, 1890.
- McPherson et al. (2020) M. J. McPherson, S. E. Dolan, A. Durango, T. Ossandon, J. Valdés, E. A. Undurraga, N. Jacoby, R. A. Godoy, and J. H. McDermott. Perceptual fusion of musical notes by native amazonians suggests universal representations of musical intervals. Nat. Commun., 11(1):2786, 2020. doi: 10.1038/s41467-020-16448-6.
- McPherson et al. (2022) M. J. McPherson, R. C. Grace, and J. H. McDermott. Harmonicity aids hearing in noise. Attention, Perception, & Psychophysics, 84(3):1016–1042, 2022. doi: 10.3758/s13414-021-02376-0.
- McPherson and McDermott (2020) M. J. McPherson and J. H. McDermott. Time-dependent discrimination advantages for harmonic sounds suggest efficient coding for memory. P. Natl. Acad. Sci. Usa., 117(50):32169–32180, 2020. doi: 10.1073/pnas.2008956117.
- Savage et al. (2020) P. E. Savage, P. Loui, B. Tarr, A. Schachner, L. Glowacki, S. Mithen, and W. T. Fitch. Music as a coevolved system for social bonding. Behav. Brain Sci., pages 1–36, 2020. doi: 10.1017/S0140525X20000333.
- Hewitt (2013) M. J. Hewitt. Musical Scales of the World. Note Tree, 2013.
- Rechberger (2018) H. Rechberger. Scales and Modes Around the World: The Complete Guide to the Scales and Modes of the World. Fennica Gehrman Ltd., 2018.
- Ellis (1885) A. J. Ellis. On the Musical Scales of Various Nations. Journal of the Society of arts, 1885.
- Wachsmann (1950) K. P. Wachsmann. An equal-stepped tuning in a ganda harp. Nature, 165(4184):40–41, 1950. doi: 10.1038/165040a0.
- Kubik (1964) Gerhard Kubik. Harp music of the azande and related peoples in the central african republic: (part i - horizontal harp playing). Afr. Music, 3(3):37–76, 1964.
- Brandel (1967) R. Brandel. The Music of Central Africa: An Ethnomusicological Study: Former French Equatorial Africa the Former Belgian Congo, Ruanda-Urundi Uganda, Tanganyika. Springer Science & Business Media, 1967.
- Kunst (1967) J. Kunst. Music in New Guinea. Brill, 1967.
- Rouget and Schwarz (1969) Gilbert Rouget and J. Schwarz. Sur les xylophones équiheptaphoniques des malinké. Rev. Musicol., 55(1):47–77, 1969. doi: 10.2307/927751.
- Tracey (1970) A. Tracey. The matepe mbira music of rhodesia. Afr. Music, 4(4):37–61, 1970. doi: 10.21504/amj.v4i4.1681.
- Tracey (1971) A. Tracey. The nyanga panpipe dance. Afr. Music, 5(1):73–89, 1971. doi: 10.21504/amj.v5i1.1152.
- Knight (1976) R. Knight. Kora music from the gambia, played by foday musa suso, 1976.
- Surjodiningrat et al. (1972) W. Surjodiningrat, A. Susanto, and P. J. Sudarjana. Tone Measurements of Outstanding Javanese Gamelans in Jogjakarta and Surakarta. Gadjah Mada University Press, 1972.
- Morton and Duriyanga (1976) D. Morton and C. Duriyanga. The Traditional Music of Thailand, volume 8. Univ of California Press, 1976.
- Haeberli (1979) Joerg Haeberli. Twelve nasca panpipes: A study. Ethnomusicology, 23(1):57–74, 1979. doi: 10.2307/851338.
- Kubik (1980) Gerhard Kubik. Likembe tunings of kufuna kandonga (angola). Afr. Music, 6(1):70–88, 1980.
- Van Zanten (1980) W. Van Zanten. The equidistant heptatonic scale of the asena in malawi. Afr. Music, 6(1):107–125, 1980. doi: 10.21504/amj.v6i1.1099.
- Zemp (1981) Hugo Zemp. Melanesian solo polyphonic panpipe music. Ethnomusicology, 25(3):383–418, 1981. doi: 10.2307/851551.
- Aning (1982) B. A. Aning. Tuning the kora: A case study of the norms of a gambian musician. J. Afr. Stud., 9(3):164, 1982.
- Lu-Ting and Kuo-huang (1982) Ho Lu-Ting and Han Kuo-huang. On chinese scales and national modes. Asian Music, 14(1):132–154, 1982. doi: 10.2307/834047.
- Kubik (1984) G. Kubik. A structural examination of homophonic multi-part singing in east and central africa. Anuario Musical, 39:27, 1984.
- Kubik (1985) Gerhard Kubik. African tone-systems: A reassessment. Yearb. Tradit. Music, 17:31–63, 1985. doi: 10.2307/768436.
- Gottlieb (1986) Robert Gottlieb. Sudan ii: Music of the blue nile province; the ingessana and berta tribes, 1986.
- Yu-An et al. (1987) R. Yu-An, E. C. Carterette, and W. Yu-Kui. A comparison of the musical scales of the ancient chinese bronze bell ensemble and the modern bamboo flute. Percept. Psychophys., 41(6):547–562, 1987. doi: 10.3758/BF03210489.
- Keefe et al. (1991) D. H. Keefe, E. M. Burns, and P. Nguyen. Vietnamese modal scales of the dan tranh. Music Percept., 8(4):449–468, 1991. doi: 10.2307/40285522.
- Tracey (1991) A. Tracey. Kambazithe makolekole and his valimba group: A glimpse of the technique of the sena xylophone. Afr. Music, 7(1):82–104, 1991. doi: 10.21504/amj.v7i1.1932.
- Carterette et al. (1993) Edward C. Carterette, Roger A. Kendall, and Sue Carole De Vale. Comparative acoustical and psychoacoustical analyses of gamelan instrument tones. Journal of the Acoustical Society of Japan (E), 14(6):383–396, 1993. doi: 10.1250/ast.14.383.
- Schneider (2001) Albrecht Schneider. Sound, pitch, and scale: From "tone measurements" to sonological analysis in ethnomusicology. Ethnomusicology, 45(3):489–519, 2001. doi: 10.2307/852868.
- Attakitmongcol et al. (2004) K. Attakitmongcol, R. Chinvejkitvanich, and S. Sujitjorn. Characterization of traditional thai musical scale. In Proceedings of the 5th WSEAS International Conference on Acoustics and Music: Theory & Applications (AMTA’04), 2004.
- Zhang et al. (2004) J. Zhang, X. Xiao, and Y. K. Lee. The early development of music. analysis of the jiahu bone flutes. Antiquity, 78(302):769–778, 2004. doi: 10.1017/S0003598X00113432.
- Sethares (2005) W. A. Sethares. Tuning, Timbre, Spectrum, Scale. Springer Science & Business Media, 2005.
- McNeil and Mitran (2008) L. E. McNeil and S. Mitran. Vibrational frequencies and tuning of the african mbira. J. Acoust. Soc. Am., 123(2):1169–1178, 2008. doi: 10.1121/1.2828063.
- Strand (2009) J. L. Strand. The Sambla Xylophone: Tradition and Identity in Burkina Faso. PhD thesis, Wesleyan University, Connecticut, 2009.
- Kuss (2010) M. Kuss. Music in Latin America and the Caribbean: An Encyclopedic History: Volume 1: Performing Beliefs: Indigenous Peoples of South America, Central America, and Mexico. University of Texas Press, 2010.
- Garzoli (2015) J. Garzoli. The myth of equidistance in thai tuning. Anal Approaches Music, 4(2):1–29, 2015.
- Wisuttipat (2015) N. Wisuttipat. Relative nature of thai traditional music through its tuning system. International Journal of Creative and Arts Studies, 2(1):86–97, 2015. doi: 10.24821/ijcas.v2i1.1441.
- Morkonr et al. (2018) A. Morkonr, S. Punkubutra, et al. The collecting process of xylophone’s sound d (ranād xek) from art to numerical data. In 2018 International Conference on Engineering, Applied Sciences, and Technology (ICEAST), pages 1–4, 2018. doi: 10.1109/ICEAST.2018.8434434.
- Bader (2019) R. Bader. Temperament in tuning systems of southeast asia and ancient india. In Computational Phonogram Archiving, pages 75–107. Springer, 2019. doi: 10.1007/978-3-030-02695-0_3.
- Kimberlin (1976) C. M. L. Kimberlin. Masinqo and the Nature of Qanat. PhD thesis, The University of California, Los Angeles, 1976.
- Nam (1998) Unjung Nam. Pitch distributions in korean court music: Evidence consistent with tonal hierarchies. Music Percept., 16(2):243–247, 1998. doi: 10.2307/40285789.
- Weisser and Falceto (2013) S. Weisser and F. Falceto. Investigating qanat in amhara secular music: An acoustic and historical study. Annales d’Éthiopie, 28(1):299–322, 2013. doi: 10.3406/ethio.2013.1539.
- Ambrazevičius (2005) Rytis Ambrazevičius. The perception and transcription of the scale reconsidered: Several lithuanian cases. The World of Music, 47(2):31–53, 2005.
- Ambrazevičius (2006) Rytis Ambrazevičius. Modelling of scales in traditional solo singing. Music. Sci., 10(1_suppl):65–87, 2006. doi: 10.1177/1029864906010001041.
- Cooke (1971) P. R. Cooke. Ludaya - a transverse flute from eastern uganda. Yearb. Int. Folk Music Council, 3:79–90, 1971. doi: 10.2307/767457.
- Garfias (1975) Robert Garfias. Preliminary thoughts on burmese modes. Asian Music, 7(1):39–49, 1975.
- Jones (1966) A. M. Jones. A kwaikèr indian xylophone. Ethnomusicology, 10(1):43–47, 1966.
- Jones (1960) A. M. Jones. Indonesia and africa: The xylophone as a culture-indicator. African Music : Journal of the International Library of African Music, 2(3):36–47, 1960. doi: https://doi.org/10.21504/amj.v2i3.608.
- Kubik (1962) G. Kubik. The endara xylophone of bukonjo. African Music : Journal of the International Library of African Music, 3(1):43–48, 1962. doi: https://doi.org/10.21504/amj.v3i1.736.
- Kubik (1963) G. Kubik. Discovery of a trough xylophone in northern mozambique. African Music : Journal of the International Library of African Music, 3(2):11–14, 1963. doi: https://doi.org/10.21504/amj.v3i2.826.
- Kubik (1992) Gerhard Kubik. Embaire xylophone music of samusiri babalanda (uganda 1968). The World of Music, 34(1):57–84, 1992.
- Thrasher (1978) Alan Thrasher. The transverse flute in traditional chinese music. Asian Music, 10(1):92–114, 1978.
- Miñana Blasco (1990) C. Miñana Blasco. Afinación de las marimbas en la costa pacífica colombiana: Un ejemplo de la memoria interválica africana en colombia. 1990.
- Sundberg and Tjernlund (1969) J. Sundberg and P. Tjernlund. Computer measurements of the tone scale in performed music by means of frequency histograms. STL-QPS, 10(2-3):33–35, 1969.
- Copeland (2018) Lyndsey Copeland. Pitch and tuning in beninese brass bands. Ethnomusicology Forum, 27(2):213–240, 2018. doi: 10.1080/17411912.2018.1518151.
- Miller (1985) T. E. Miller. Traditional Music of the Lao: Kaen Playing and Mawlum Singing in Northeast Thailand. Number 13. Praeger, 1985.
- Mzhavanadze and Scherbaum (2020) N. Mzhavanadze and F. Scherbaum. Svan funeral dirges (zär): Musicological analysis. Musicologist, 4(2):168–197, 2020. doi: 10.33906/musicologist.782185.
- Mokhtar and Mosharrafa (1937) M. Mokhtar and A. M. Mosharrafa. Modes in modern egyptian music. Nature, 140(3543):548–549, 1937. doi: 10.1038/140548b0.
- Tan (2011) A. Tan. Ney açkısının tarihi ve teknik gelişimi. Yayınlanmamış Doktora Tezi. Marmara Üniversitesi, Sosyal Bilimler Enstitüsü, İstanbul, 2011.
- Mendes et al. (2012) M. Mendes et al. Fé No Pife: As Flautas De Pífano No Contexto Cultural Da Banda Cabaçal Dos Irmãos Aniceto. PhD thesis, Universidade do Estado de Santa Catarina, 2012.
- Panteli and Purwins (2013) Maria Panteli and Hendrik Purwins. A quantitative comparison of chrysanthine theory and performance practice of scale tuning, steps, and prominence of the octoechos in byzantine chant. J. New Music Res., 42(3):205–221, 2013. doi: 10.1080/09298215.2013.827215.
- Honingh and Bod (2011) Aline Honingh and Rens Bod. In search of universal properties of musical scales. J. New Music Res., 40(1):81–89, 2011. doi: 10.1080/09298215.2010.543281.
- Signell (1977) K. L. Signell. Makam: Modal Practice in Turkish Art Music, volume 4. Da Capo Pr, 1977.
- Zemp and Malkus (1979) Hugo Zemp and Vida Malkus. Aspects of ’are’are musical theory. Ethnomusicology, 23(1):5–48, 1979. doi: 10.2307/851336.
- Rice (1980) T. Rice. Aspects of bulgarian musical thought. Yearb. Int. Folk Music Council, 12:43–66, 1980. doi: 10.2307/767653.
- Feld (1981) S. Feld. ‘flow like a waterfall’: The metaphors of kaluli musical theory: For carl voegelin. Yearb. Tradit. Music, 13:22–47, 1981. doi: 10.2307/768356.
- Baily (1988) J. Baily. Anthropological and psychological approaches to the study of music theory and musical cognition. Yearb. Tradit. Music, 20:114–124, 1988. doi: 10.2307/768168.
- Church (2015) M. Church. The Other Classical Musics: Fifteen Great Traditions. Boydell & Brewer, 2015.
- Cornelis et al. (2010) Olmo Cornelis, Micheline Lesaffre, Dirk Moelants, and Marc Leman. Access to ethnic music: Advances and perspectives in content-based music information retrieval. Signal Process., 90(4):1008–1031, 2010. doi: https://doi.org/10.1016/j.sigpro.2009.06.020.
- Rosenzweig et al. (2020) S. Rosenzweig, F. Scherbaum, D. Shugliashvili, V. Arifi-Müller, and M. Müller. Erkomaishvili dataset: A curated corpus of traditional georgian vocal music for computational musicology. Transactions of the International Society for Music Information Retrieval, 3(1), 2020.
- Wood et al. (2022) A. L. C. Wood, K. R. Kirby, C. R. Ember, S. Silbert, S. Passmore, H. Daikoku, J. McBride, F. Paulay, M. J. Flory, J. Szinger, G. D’Arcangelo, K. K. Bradley, M. Guarino, M. Atayeva, J. Rifkin, V. Baron, M. El Hajli, M. Szinger, and P. E. Savage. The global jukebox: A public database of performing arts and culture. Plos One, 17(11):1–22, 2022. doi: 10.1371/journal.pone.0275469.
- Six et al. (2013) Joren Six, Olmo Cornelis, and Marc Leman. Tarsos, a modular platform for precise pitch analysis of western and non-western music. J. New Music Res., 42(2):113–129, 2013. doi: 10.1080/09298215.2013.797999.
- Cornelis et al. (2013) Olmo Cornelis, Joren Six, Andre Holzapfel, and Marc Leman. Evaluation and recommendation of pulse and tempo annotation in ethnic music. J. New Music Res., 42(2):131–149, 2013. doi: 10.1080/09298215.2013.812123.
- Benetos and Holzapfel (2015) E. Benetos and A. Holzapfel. Automatic transcription of turkish microtonal music. J. Acoust. Soc. Am., 138(4):2118–2130, 2015. doi: 10.1121/1.4930187.
- Ozaki et al. (2021) Y. Ozaki, J. McBride, E. Benetos, P. Q. Pfordresher, J. Six, A. T Tierney, P. Proutskova, E. Sakai, H. Kondo, H. Fukatsu, et al. Agreement among human and annotated transcriptions of global songs. In ISMIR 2021 - 22nd International Society for Music Information Retrieval Conference, 2021.
- Jordahl et al. (2020) Kelsey Jordahl, Joris Van den Bossche, Martin Fleischmann, Jacob Wasserman, James McBride, Jeffrey Gerard, Jeff Tratner, Matthew Perry, Adrian Garcia Badaracco, Carson Farmer, Geir Arne Hjelle, Alan D. Snow, Micah Cochran, Sean Gillies, Lucas Culbertson, Matt Bartos, Nick Eubank, maxalbert, Aleksey Bilogur, Sergio Rey, Christopher Ren, Dani Arribas-Bel, Leah Wasser, Levi John Wolf, Martin Journois, Joshua Wilson, Adam Greenhall, Chris Holdgraf, Filipe, and François Leblanc. Geopandas/geopandas: V0.8.1, 2020.
- Savage et al. (2022) P. E. Savage, S. Passmore, G. Chiba, T. E. Currie, H. Suzuki, and Q. D. Atkinson. Sequence alignment of folk song melodies reveals cross-cultural regularities of musical evolution. Curr. Biol., 32(6):1395–1402.e8, 2022. doi: 10.1016/j.cub.2022.01.039.
- Verosky (2021) N. J. Verosky. Interpreting the tonal hierarchy through corpus analysis. Psychomusicology: Music, Mind, and Brain, 31(2):96–106, 2021. doi: 10.1037/pmu0000276.
- Krumhansl and Shepard (1979) C. L. Krumhansl and R. N. Shepard. Quantification of the hierarchy of tonal functions within a diatonic context. J. Exp. Psychol. Human., 5(4):579–594, 1979. doi: 10.1037/0096-1523.5.4.579.
- Castellano et al. (1984) M. A. Castellano, J. J. Bharucha, and C. L. Krumhansl. Tonal hierarchies in the music of north india. Journal of Experimental Psychology: General, 113(3):394–412, 1984. doi: 10.1037/0096-3445.113.3.394.
- Kessler et al. (1984) E. J. Kessler, C. Hansen, and R. N. Shepard. Tonal schemata in the perception of music in bali and in the west. Music Percept., 2(2):131–165, 1984. doi: 10.2307/40285289.
- Ambrazevičius and Wiśniewska (2009) R. Ambrazevičius and I. Wiśniewska. Tonal hierarchies in sutartinės. Journal of interdisciplinary music studies, 3(1/2):45–55, 2009.
- Harasim et al. (2021) D. Harasim, F. C. Moss, M. Ramirez, and M. Rohrmeier. Exploring the foundations of tonality: Statistical cognitive modeling of modes in the history of western classical music. Humanities and Social Sciences Communications, 8(1):5, 2021. doi: 10.1057/s41599-020-00678-6.
- Pearson (2016) L. Pearson. Coarticulation and gesture: An analysis of melodic movement in south indian raga performance. Music Anal., 35(3):280–313, 2016. doi: https://doi.org/10.1111/musa.12071.
- Ganguli and Rao (2019) K. K. Ganguli and P. Rao. On the perception of raga motifs by trained musicians. J. Acoust. Soc. Am., 145(4):2418–2434, 2019. doi: 10.1121/1.5097588.
- Ganguli and Rao (2018) K. K. Ganguli and P. Rao. On the distributional representation of ragas: Experiments with allied raga pairs. Transactions of the International Society for Music Information Retrieval, 1(1), 2018. doi: http://doi.org/10.5334/tismir.11.
- Kirby et al. (2016) K. R. Kirby, R. D. Gray, S. J. Greenhill, F. M. Jordan, S. Gomes-Ng, H. J. Bibiko, D. E. Blasi, C. A. Botero, C. Bowern, C. R. Ember, D. Leehr, B. S. Low, J. McCarter, W. Divale, and M. C. Gavin. D-place: A global database of cultural, linguistic and environmental diversity. Plos One, 11(7):1–14, 2016. doi: 10.1371/journal.pone.0158391.
- Hammarström et al. (2019) H. Hammarström, R. Forkel, and M. Haspelmath. Glottolog 4.1, 2019.
- Evans et al. (2021) C. L. Evans, S. J. Greenhill, J. Watts, J. M. List, C. A. Botero, R. D. Gray, and K. R. Kirby. The uses and abuses of tree thinking in cultural evolution. Philosophical Transactions of the Royal Society B: Biological Sciences, 376(1828):20200056, 2021. doi: 10.1098/rstb.2020.0056.
- Jones (1970) A. M. Jones. On using the stroboconn. African Music : Journal of the International Library of African Music, 4(4):122–124, 1970. doi: 10.21504/amj.v4i4.1687.
- Hagerman and Sundberg (1980) B. Hagerman and J. Sundberg. Fundamental Frequency Adjustment in Barbershop Singing, volume 21. Citeseer, 1980.
- Jers and Ternström (2005) H. Jers and S. Ternström. Intonation analysis of a multi-channel choir recording. TMHQPSR Speech, Music and Hearing: Quarterly Progress and Status Report, 47(1):1–6, 2005.
- Devaney et al. (2011) J. Devaney, M. I. Mandel, D. P. W. Ellis, and I. Fujinaga. Automatically extracting performance data from recordings of trained singers. PsychoMusicology, 21(1-2):108–136, 2011. doi: 10.1037/h0094008.
- Serra et al. (2011) J. Serra, G. K. Koduri, M. Miron, and X. Serra. Assessing the tuning of sung indian classical music. In ISMIR, pages 157–162, 2011.
- D’Amario et al. (2020) Sara D’Amario, David M. Howard, Helena Daffern, and Nicola Pennill. A longitudinal study of intonation in an a cappella singing quintet. J. Voice, 34(1):159.e13–159.e27, 2020. doi: https://doi.org/10.1016/j.jvoice.2018.07.015.
- Siegel and Siegel (1977) J. A. Siegel and W. Siegel. Categorical perception of tonal intervals: Musicians can’t tell sharp from flat. Percept. Psychophys., 21(5):399–407, 1977. doi: 10.1037/h0094008.
- McDermott et al. (2010) J. H. McDermott, M. V. Keebler, C. Micheyl, and A. J. Oxenham. Musical intervals and relative pitch: Frequency resolution, not interval resolution, is special. J. Acoust. Soc. Am., 128(4):1943–1951, 2010. doi: 10.1121/1.3478785.
- Zarate et al. (2012) J. M. Zarate, C. R. Ritson, and D. Poeppel. Pitch-interval discrimination and musical expertise: Is the semitone a perceptual boundary? J. Acoust. Soc. Am., 132(2):984–993, 2012. doi: 10.1121/1.4733535.
- Larrouy-Maestri et al. (2019) P. Larrouy-Maestri, P. M. C. Harrison, and D. Müllensiefen. The mistuning perception test: A new measurement instrument. Behav. Res. Methods, 51(2):663–675, 2019. doi: 10.3758/s13428-019-01225-1.
- Stumpf (2012) C. Stumpf. The Origins of Music. OUP Oxford, 2012.
- van der Maaten and Hinton (2008) Laurens van der Maaten and Geoffrey Hinton. Visualizing data using t-sne. J. Mach. Learn. Res., 9(86):2579–2605, 2008.
- Pedregosa et al. (2011) F. Pedregosa, G. Varoquaux, A. Gramfort, V. Michel, B. Thirion, O. Grisel, M. Blondel, P. Prettenhofer, R. Weiss, V. Dubourg, J. Vanderplas, A. Passos, D. Cournapeau, M. Brucher, M. Perrot, and E. Duchesnay. Scikit-learn: Machine learning in Python. J. Mach. Learn. Res., 12:2825–2830, 2011.
- McDermott and Hauser (2005) J. McDermott and M. Hauser. The origins of music: Innateness, uniqueness, and evolution. Music Percept., 23(1):29–59, 2005. doi: 10.1525/mp.2005.23.1.29.
- Ball (2010) P. Ball. The Music Instinct: How Music Works and Why We Can’t Do Without It. Random House, 2010.
- Ross and Knight (2017) Barry Ross and Sarah Knight. Reports of equitonic scale systems in african musical traditions and their implications for cognitive models of pitch organization. Music. Sci., page 1029864917736105, 2017. doi: 10.1177/1029864917736105.
- Rahn (1978) Jay Rahn. Javanese pélog tunings reconsidered. Yearb. Int. Folk Music Council, 10:69–82, 1978. doi: 10.2307/767348.
- Coolen (1982) Michael Theodore Coolen. The fodet: A senegambian origin for the blues? The Black Perspective in Music, 10(1):69–84, 1982.
- Vetter (1989) Roger Vetter. A retrospect on a century of gamelan tone measurements. Ethnomusicology, 33(2):217–227, 1989. doi: 10.2307/924396.
- Perlman (1994) Marc Perlman. American gamelan in the garden of eden: Intonation in a cross-cultural encounter. The Musical Quarterly, 78(3):510–555, 1994.
- Arom and Fürniss (1993) Simha Arom and Susanne Fürniss. An interactive experimental method for the determination of musical scales in oral cultures. Contemp. Music Rev., 9(1-2):7–12, 1993. doi: 10.1080/07494469300640301.
- Perlman and Krumhansl (1996) M. Perlman and C. L. Krumhansl. An experimental study of internal interval standards in javanese and western musicians. Music Percept., 14(2):95–116, 1996. doi: 10.2307/40285714.
- Schneider and Leman (2017) A. Schneider and M. Leman. Sound, Pitches and Tuning of a Historic Carillon, pages 247–298. Springer International Publishing, Cham, 2017. doi: 10.1007/978-3-319-47292-8_9.
- Boyd and Richerson (1988) R. Boyd and P. J. Richerson. Culture and the Evolutionary Process. University of Chicago press, 1988.
- Kirby (1966) Percival R. Kirby. The indonesian origin of certain african musical instruments. Afr. Stud-uk., 25(1):3–22, 1966. doi: 10.1080/00020186608707224.
- Blench (2014) R. Blench. Using diverse sources of evidence for reconstructing the past history of musical exchanges in the indian ocean. Afr. Archaeol. Rev., 31(4):675–703, 2014. doi: 10.1007/s10437-014-9178-z.
- Aguirre-Fernández et al. (2020) G. Aguirre-Fernández, D. E. Blasi, and M. R. Sánchez-Villagra. Panpipes as units of cultural analysis and dispersal. Evolutionary Human Sciences, 2:e17, 2020. doi: 10.1017/ehs.2020.15.
- Aguirre-Fernández et al. (2021) G. Aguirre-Fernández, C. Barbieri, A. Graff, J. Pérez de Arce, H. Moreno, and M. R. Sánchez-Villagra. Cultural macroevolution of musical instruments in south america. Humanities and Social Sciences Communications, 8(1):208, 2021. doi: 10.1057/s41599-021-00881-z.
- Hutchins and Peretz (2012) S. M. Hutchins and I. Peretz. A frog in your throat or in your ear? searching for the causes of poor singing. Journal of Experimental Psychology: General, 141(1):76–97, 2012. doi: 10.1037/a0025064.
- Partch (1950) H. Partch. Genesis of a Music. University of Wisconsin Press, 1950.
- Crocker (1963) Richard L. Crocker. Pythagorean mathematics and music. The Journal of Aesthetics and Art Criticism, 22(2):189–198, 1963. doi: 10.2307/427754.
- Vijayakrishnan (2007) K. G. Vijayakrishnan. The Grammar of Carnatic Music, volume 8. Walter de Gruyter, 2007.
- Goodman (2016) M. K. J. Goodman. An Introduction to the Early Development of Mathematics. John Wiley & Sons, 2016.
- Marcus (1993) S. Marcus. The interface between theory and practice: Intonation in arab music. Asian Music, 24(2):39–58, 1993. doi: 10.2307/834466.
- Katz (2015) I. Katz. Henry George Farmer and the First International Congress of Arab Music (Cairo 1932). Brill, 2015.
- Farhat (2004) H. Farhat. The Dastgah Concept in Persian Music. Cambridge University Press, 2004.
- te Nijenhuis (1970) E. te Nijenhuis. Dattilam: A Compendium of Ancient Indian Music, volume 11. Brill Archive, 1970.
- von Falkenhausen (1992) Lothar von Falkenhausen. On the early development of chinese musical theory: The rise of pitch-standards. J. Am. Oriental Soc., 112(3):433–439, 1992.
- Anglada-Tort et al. (2023) Manuel Anglada-Tort, Peter M.C. Harrison, Harin Lee, and Nori Jacoby. Large-scale iterated singing experiments reveal oral transmission mechanisms underlying music evolution. Curr. Biol., 2023. doi: https://doi.org/10.1016/j.cub.2023.02.070.
- Creanza et al. (2017) N. Creanza, O. Kolodny, and M. W. Feldman. Cultural evolutionary theory: How culture evolves and why it matters. P. Natl. Acad. Sci. Usa., 114(30):7782–7789, 2017. doi: 10.1073/pnas.1620732114.
- Mehr et al. (2020) S. A. Mehr, M. M. Krasnow, G. A. Bryant, and E. H. Hagen. Origins of music in credible signaling. Behav. Brain Sci., pages 1–41, 2020. doi: 10.1017/S0140525X20000345.
- Moelants et al. (2009) Dirk Moelants, Olmo Cornelis, and Marc Leman. Exploring african tone scales. In Proceedings of the 10th International Society for Music Information Retrieval Conference, pages 489–494, Kobe, Japan, 2009. ISMIR. doi: 10.5281/zenodo.1416338.
- Loui et al. (2010) P. Loui, D. L. Wessel, and C. L. H. Kam. Humans rapidly learn grammatical structure in a new musical scale. Music Percept., 27(5):377–388, 2010. doi: 10.1525/mp.2010.27.5.377.
- Rohrmeier and Widdess (2017) M. Rohrmeier and R. Widdess. Incidental learning of melodic structure of north indian music. Cognitive Sci., 41(5):1299–1327, 2017. doi: https://doi.org/10.1111/cogs.12404.
- Huron (1994) D. Huron. Interval-Class Content in Equally Tempered Pitch-Class Sets: Common Scales Exhibit Optimum Tonal Consonance. Music Percept., 11(3):289–305, 1994. doi: 10.2307/40285624.
- Gill and Purves (2009) K. Z. Gill and D. Purves. A biological rationale for musical scales. Plos One, 4(12):1–9, 2009. doi: 10.1371/journal.pone.0008144.
- Aucouturier (2008) J. J. Aucouturier. The hypothesis of self-organization for musical tuning systems. Leonardo Music J., 18:63–69, 2008. doi: 10.1162/lmj.2008.18.63.
- Berezovsky (2019) Jesse Berezovsky. The structure of musical harmony as an ordered phase of sound: A statistical mechanics approach to music theory. Sci. Adv, 5(5):eaav8490, 2019. doi: 10.1126/sciadv.aav8490.
- Large et al. (2016) E. W. Large, J. C. Kim, N. K. Flaig, J. J. Bharucha, and C. L. Krumhansl. A Neurodynamic Account of Musical Tonality. Music Percept., 33(3):319–331, 2016. doi: 10.1525/mp.2016.33.3.319.
- Dowling (1988) W. J. Dowling. The cognitive framework for musical scales in various cultures. J. Acoust. Soc. Am., 84(S1):S204–S204, 1988. doi: 10.1121/1.2026117.
- Phillips and Brown (2022) E. Phillips and S. Brown. Beyond harmonicity: Toward a vocal-melodic theory of the origin of musical scales. Music in Human Experience: Perspectives on a Musical Species, page 247, 2022.
- Dowling (1978) W. J. Dowling. Scale and contour: Two components of a theory of memory for melodies. Psychol. Rev., 85:341–354, 1978. doi: 10.1037/0033-295X.85.4.341.
- Clough et al. (1999) J. Clough, N. Engebretsen, and J. Kochavi. Scales, Sets, and Interval Cycles: A Taxonomy. Music Theor. Spectrum, 21(1):74–104, 1999. doi: 10.2307/745921.
- Harasim et al. (2020) Daniel Harasim, Stefan E. Schmidt, and Martin Rohrmeier. Axiomatic scale theory. J. Math. Music, 14(3):223–244, 2020. doi: 10.1080/17459737.2019.1696899.
- Balzano (1980) Gerald J. Balzano. The group-theoretic description of 12-fold and microtonal pitch systems. Comput. Music J., 4(4):66–84, 1980. doi: 10.2307/3679467.
- Trehub et al. (1999) S. E. Trehub, E. G. Schellenberg, and S. B. Kamenetsky. Infants’ and adults’ perception of scale structure. J. Exp. Psychol. Human., 25(4):965, 1999. doi: 10.1037/0096-1523.25.4.965.
- Pelofi and Farbood (2021) C. Pelofi and M. M. Farbood. Asymmetry in scales enhances learning of new musical structures. P. Natl. Acad. Sci. Usa., 118(31), 2021. doi: 10.1073/pnas.2014725118.
- Verosky (2017) N. J. Verosky. Hierarchizability as a Predictor of Scale Candidacy. Music Percept., 34(5):515–530, 2017. doi: 10.1525/mp.2017.34.5.515.
- Tierney et al. (2011) A. T. Tierney, F. A. Russo, and A. D. Patel. The motor origins of human and avian song structure. P. Natl. Acad. Sci. Usa., 108(37):15510–15515, 2011. doi: 10.1073/pnas.1103882108.
- Sundberg et al. (1993) J. Sundberg, I. Titze, and R. Scherer. Phonatory control in male singing: A study of the effects of subglottal pressure, fundamental frequency, and mode of phonation on the voice source. J. Voice, 7(1):15 – 29, 1993. doi: https://doi.org/10.1016/S0892-1997(05)80108-0.
- West (1994) M. L. West. The babylonian musical notation and the hurrian melodic texts. Music Lett., 75(2):161–179, 1994. doi: 10.2307/737674.
- Velichkina (1998) O. Velichkina. Playing Panpipes in Southern Russia: History, Ethnography, and Performance Practices. PhD thesis, Ohio State University, 1998.
- Can (2002) M. C. Can. Geleneksel türk sanat müziğinde arel ezgi uzdilek ses sistemi ve uygulamada kullanılmayan bazı perdeler. Gazi Üniversitesi Gazi Eğitim Fakültesi Dergisi, 22(1), 2002.
- Kunst (1949) J. Kunst. Music in Java: Its History, Its Theory and Its Technique. Springer, 1949.
- Cowen (2009) T. Cowen. Creative Destruction: How Globalization Is Changing the World’s Cultures. Princeton University Press, 2009.
- Santiago (2005) G. A. S. Santiago. Los Artefactos Sonoros Del Oaxaca Prehispánico, volume 3. Secretaría de Cultura del Estado de Oaxaca, 2005.
- Rawcliffe (2007) Susan Rawcliffe. Eight west mexican flutes in the fowler museum. The World of Music, 49(2):45–65, 2007.
- Yoshikawa and Kajiwara (2015) Shigeru Yoshikawa and Kazue Kajiwara. Cross fingerings and associated intonation anomaly in the shakuhachi. Acoustical Science and Technology, 36(4):314–325, 2015. doi: 10.1250/ast.36.314.
- Gfeller et al. (2020) Beat Gfeller, Dominik Roblek, Marco Tagliasacchi, and Pen Li. Learning to denoise historical music. In ISMIR 2020 - 21st International Society for Music Information Retrieval Conference, 2020.
- Marolt et al. (2019) M. Marolt, C. Bohak, A. Kavčič, and M. Pesek. Automatic segmentation of ethnomusicological field recordings. Applied Sciences, 9(3), 2019. doi: 10.3390/app9030439.
- Benetos et al. (2019) E. Benetos, S. Dixon, Z. Duan, and S. Ewert. Automatic music transcription: An overview. Ieee Signal Proc. Mag., 36(1):20–30, 2019. doi: 10.1109/MSP.2018.2869928.
- Mauch et al. (2015) M. Mauch, C. Cannam, R. Bittner, G. Fazekas, J. Salamon, J. Dai, J. Bello, and S. Dixon. Computer-aided melody note transcription using the tony software: Accuracy and efficiency. In Proceedings of the First International Conference on Technologies for Music Notation and Representation, 2015.
- Mauch et al. (2014) M. Mauch, K. Frieler, and S. Dixon. Intonation in unaccompanied singing: Accuracy, drift, and a model of reference pitch memory. J. Acoust. Soc. Am., 136(1):401–411, 2014. doi: 10.1121/1.4881915.