What do Firms Gain from Patenting?
The Case of the Global ICT Industry.
Abstract
This study investigates the causal relationship between patent grants and firms’ dynamics in the global Information and Communication Technology (ICT) industry, as the latter is a peculiar sector of modern economies, often under the lens of antitrust authorities. We exploit a matched sample of patents and financial accounts in 2009-2017 by 179,660 companies operating in 39 countries. At first, we find that IPRs are highly concentrated in a few portfolios since less than of larger firms are responsible for of patent grants. After controlling for reverse causality, we find that, albeit few, smaller firms benefit the most after patent grants, as their market shares, turnover, and employment on average increase by 31.5%, 33.7%, and 18.8%, respectively. Coherently, larger firms record marginally lower gains by 5.2%, 5.7%, and 4.5%, respectively. After a novel instrumental variable strategy that exploits information at the level of patent offices to control for endogenous innovations, we confirm that most of the impact on smaller companies is due to IPRs. Notably, we never observe a significant effect on either profitability or productivity for any firm size category. Eventually, we argue that IPR policy reforms should consider assignees’ heterogeneous advantages by size in a context where endogenous R&D sunk costs are relevant.
JEL Classification: O31, O34, L22, L25, F23
Keywords: intellectual property rights, ICT, market competition, endogenous sunk costs, firm level
1 Introduction
Over the past decades, digitalization has played a significant role in transforming many production processes. Companies operating in the Information and Communication Technologies (ICT) industry have become major global players, while the digital sector has rapidly grown. The industry contributes innovative consumer goods and technological inputs for firms across many other sectors. The benefits of investing in ICT are evident because many firms can potentially gain in terms of efficiency (Brynjolfsson and Hitt, 2003) through reshaping innovation strategies (Nambisan et al., 2019). Thus, policymakers tend to attribute a high value to the ICT global industry as an engine of economic growth. However, concerns about a fast market concentration among a few Big-Tech global players have been raised. Thus, antitrust authorities in the U.S. and the European Union started their probes to check for abuses. The regime of Intellectual Property Rights (IPR) is among the prime suspects, as critics assume that companies can obtain unfair market advantages from excessive patent protection.
Against the previous background, we aim to empirically investigate the impact of patenting activity on firms’ dynamics in the global ICT sector in 2009-2017. We adopt a quasi-experimental design to focus on firms’ market shares and understand market advantages from a patent grant, while other firms’ outcomes (turnover, employment, productivity, profitability, and capital intensity) help identify the sources of that market advantage.
For our purpose, we exploit a sample of 179,660 firms active in 39 countries in 2009-2017 with matched information on financial accounts and patent grants. First, we provide insights into ICT firms’ heterogeneous patenting activity over time and across geography. Notably, we show that IPRs are highly concentrated in a few portfolios since less than of larger firms are responsible for about of patent grants. Moreover, most active patentees are in the United States and Asia, while EU firms lag in patenting ICT. When we drill down into the details, we find that very large firms in the US with more than 1,000 employees register up to 45 new patents on average in our period of analyses. Therefore, when we look at financial accounts, we find that the number of patent grants positively correlates with market shares, productivity, firm size and capital intensity.
Motivated by preliminary evidence, we challenge correlations by adopting a composite empirical strategy. Our main interest is:
-
1.
to understand the direction of causality, i.e., whether ICT firms grow on the market thanks to IPR or whether they obtain patent grants because they are already big and productive;
-
2.
to separate the impact of IPR per se on firms’ dynamics from the effect induced by the innovative content of the registered inventions.
The first is a classical problem of reverse causality, for which we apply a diff-in-diff strategy for panel data settings recently proposed by Callaway and Sant’Anna (2021), which is useful to us because we have multiple treatment periods and variation in treatment timing. The method also allows controlling that the assumption of parallel trends is valid, conditional on observed companies’ characteristics. Thus, having complete information on the timing of patents’ registration processes, we consider a firm treated if it has been granted patents in our period of analyses.
Interestingly, stronger correlations between firm-level outcomes and patenting activity fade after we challenge reverse causality. We find that the impact of patent grants is higher and more significant in the case of smaller firms, i.e., after considering firms with a number of employees below the median value. Although there are not many smaller firms that come to get a patent grant, once they get one, their average market shares (), sales ( and employment () increase. Notably, in the case of larger firms, we record a lower average impact on market shares (), sales (), and employment (). Quite surprisingly, patent grants in any of our specifications do not directly impact profits or productivity. Thus, we discuss the peculiarity of the ICT industry that arguably represents a poster child of a sector with R&D endogenous sunk costs444For a useful review on the different approaches to investigate market power in modern economies with an industrial theoretical perspective, see Berry et al. (2019).. Following the seminal works by Sutton (1998), we argue that ICT firms have the incentive to invest in R&D to increase market shares since consumers evaluate product differentiation by looking at innovative features available on the market. Yet, given high investments in R&D, successful patent grants do not allow assignees an immediate increase in capital returns. On the contrary, most active patentees in the ICT global industry seem to show short-term financial distress, possibly due to a rush in innovation.
In the second stage of our analyses, we focus on smaller firms that obtain unique grants in a technological domain at a country patent office. We aim to disentangle the impact of IPRs from the innovation content of the invention protected by the patent. We assume that previous diff-in-diff results still confound the roles of IPR and innovation. Companies could have increased market shares simply by selling more innovative products and not necessarily because they obtained the protection of intellectual property rights. From another perspective, we argue that the ability to ask for a patent and obtain a grant correlates with the ability to generate innovative products. Thus, pairwise correlations with market shares may be spurious.
Therefore, to distil the impact of IPR protection, we propose a novel instrumental variable strategy based on information collected at the level of patent offices. Our strategy exploits the exogenous experience of non-ICT firms in getting grants in the same ICT technology-office-year cells as ICT firms. Our intuition is that companies in other sectors do not compete with those in the ICT industry, hence our exclusion restriction assumption. Yet, regardless of a company’s affiliation industry, experts shall evaluate with the same criteria whether the inventions are innovative and thus worthy of protection. That’s why we expect the propensity of ICT firms to obtain a grant in a specific technology in a given year to be correlated with the number of grants and/or the share of grants out of total applications in the same technology and the same year (relevance assumption). Eventually, both tests for the exclusion restrictions and the relevance assumptions confirm the validity of the chosen instruments. We find that the positive impact on a firm’s market share of smaller firms is still there. Notably, an increase in market share after a unique patent grant is still high (29.7%) and statistically significant only in the first year after the grant.
Importantly, we make our findings robust to different corporate control strategies since we are aware that ICT headquarters can often delegate subsidiaries to hold their IPRs. It is the case when R&D labs are located within corporate boundaries, for example, in the case of multinational enterprises that use their subsidiaries across national borders to invest in innovation and to hold patent portfolios.
In conclusion, we argue that our results should inform a much needed IPR policy reform, which should consider the heterogeneous advantages of firms’ assignees. We believe that, in an industry where R&D sunk costs are relevant, smaller firms struggle relatively more to benefit from IPR for focal innovations. Yet, smaller firms are also the ones that most require incentives to invest in innovation efforts to avoid an increasing concentration of IPR. This is especially true in the case of the ICT industry, whose complex technologies gave rise to intricate patent thickets that are difficult to navigate and where patenting is increasingly used as a strategic moat to increase barriers to market entry.
| Fortune’s 500 | Company | Country | Revenues | N. employees | N. granted |
| Global rank | (bln USD) | patents | |||
| 1 | Apple | United States | 260,174 | 137,000 | 54,536 |
| 2 | Samsung Electronics | South Korea | 197,705 | 287,439 | 641,743 |
| 3 | Foxconn | Taiwan | 178,860 | 757,404 | 2,266 |
| 4 | Alphabet | United States | 161,857 | 118,899 | 60,049 |
| 5 | Microsoft | United States | 125,843 | 144,000 | 89,635 |
| 6 | Huawei | China | 124,316 | 194,000 | 98,880 |
| 7 | Dell Technologies | United States | 92,154 | 165,000 | 11,509 |
| 8 | Hitachi | Japan | 80,639 | 301,056 | 268,598 |
| 9 | IBM | United States | 77,147 | 383,056 | 216,837 |
| 10 | Sony | Japan | 75,972 | 111,700 | 219,092 |
| 11 | Intel | United States | 71,965 | 110,800 | 91,214 |
| 12 | United States | 70,697 | 44,942 | 12,381 | |
| 13 | Panasonic | Japan | 68,897 | 259,835 | 384,817 |
| 14 | HP Inc. | United States | 58,756 | 44,942 | 61,715 |
| 15 | Tencent | China | 54,613 | 62,885 | 18,552 |
| 16 | LG Electronics | South Korea | 53,464 | 74,000 | 315,038 |
| 17 | Cisco | United States | 51,904 | 75,900 | 17,997 |
| 18 | Lenovo | China | 50,716 | 63,000 | 27,716 |
-
•
Note: The table indicates the list of top ICT global firms in the year 2020 according to the Fortune Global 500 ranking and the total number of patents that have been granted at any time in their business history in the same year, as reported by the Orbis Intellectual Property database.
To grasp the relevance of patenting activity in the ICT global industry and its concentration, we report in Table 1 a match of the top ICT global firms according to Fortune Global 500 in the reference year 2020 with the stock of patents they have accumulated over time, as from our matched data set555Please note that in following analyses we will always focus on flows of grants by year, while Table 1 reports stocks of grants accumulated up to 2020, i.e., including grants that have been obtained since the incorporation.. Fortune’s ranking is originally based on global revenues. We consistently match in the last column with information on all the patents that could have been obtained historically by either a parent company in the origin country or its subsidiaries located wherever in the rest of the world.
Notably, we record an average stock of about 160 thousand by top ICT firms; the most historically active assignee has been Samsung Electronics in South Korea, with up to 641,743 grants obtained up to 2020. The younger Foxconn in Taiwan relies relatively less on patenting activity, with an albeit non-negligible stock of 2,266 patents. In the following analysis, we will go beyond bigger corporations to investigate the role of medium and smaller companies while showing how patenting activity can be heterogeneous within the global industry.
The rest of the paper is organized as follows. Section 2 relates our work to previous literature. Section 3 introduces data and provides preliminary evidence extracted from our matched patent-firm sample. In section 4, we discuss our identification strategy and comment results. Section 5 introduces some robustness and sensitivity checks. Finally, Section 6 concludes with a few remarks.
2 Related literature
First, we relate our contribution to the vast literature investigating the market impact of IPR protection. The latter is usually justified as a way to introduce artificial scarcity and amend non-rivalry and non-excludability in the consumption of knowledge. The economic rationale of IPR protection is to avoid knowledge producers underinvest in an industry that significantly contributes to social welfare and economic growth. In this context, patents should counterbalance market imperfections while generating a temporary legally enforced monopoly to guarantee producers profits from knowledge generation.
Over the last years, however, several scholars have raised concerns about the perverse mechanisms that IPR practices can bring. In their seminal works, Dosi et al. (2006) and Boldrin and Levine (2008) build cases against intellectual monopolies discussing evidence that IPR regimes have, at best, no impact or, in some cases, a negative impact on innovation rates. IPRs may favour rent-seeking behaviour by firms that benefit from the monopolistic power granted on the knowledge they generate, reducing the diffusion of innovation and social welfare. Interestingly for our case, Boldrin and Levine (2013) point out how there seems to be no positive relationship between patenting activity and productivity. Expressly, the authors point to an inconsistency between the partial equilibrium, where patents may still be able to raise incentives for incumbent producers, and the general equilibrium, where protection can reduce aggregate innovation rates.
Looking into specific domains, Henry and Stiglitz (2010) discuss solutions for slowing down climate change and enhancing environmental protection, where patenting is most problematic. In particular, they sketch the case study of research in genetically modified organisms, where a different regime has brought more comprehensive social benefits. Interestingly, Moser (2013) and van Gompel (2019) review other cases in economic history when, in the absence of modern IPR regimes, different forms of protection or knowledge sharing could also accompany waves of essential innovations. Eventually, Cimoli et al. (2014) discuss how modern IPR regimes could represent an obstacle to knowledge diffusion in developing countries, which may need to imitate prosperous developed countries to boost economic growth. Yet, on the other front of the controversy, other scholars stress that IPR protection should be even more critical in modern times if one considers the strategic role that intangible assets play for the economic potential of regions and countries (Ziedonis, 2008; Haskel and Westlake, 2018).
Nonetheless, the research strand based on the seminal works by Sutton (1986, 1991, 1998) supports the idea that some industries operate with endogenous sunk costs, with a structural lower bound in market shares. Briefly, some industries have to invest a relatively higher share in R&D, advertising and other activities to enhance consumers’ willingness to pay for the products they offer, independent of how big the demand already is. See also previous ideas in Shaked and Sutton (1983, 1987). In this case, a market equilibrium implies a relatively higher market share associated with higher technological barriers to market entry and, thus, a smaller pool of firms that can profitably operate in the industry.
For a competing framework, we refer to Acs and Audretsch (1988) and Geroski and Pomroy (1990), who underline how innovation may be negatively associated with market concentration. Aghion et al. (2005) suggest that the relationship between innovation and competition may be non-linear. Blundell et al. (1999) also challenge the association between market share and innovation. After exploiting dynamic count data models, they found a robust and positive effect of market shares on patent stocks, although increased product market competition in the industry tends to stimulate innovative activity.
Against the previous background, our primary concern is to investigate the case of the ICT industry as a typical example of an innovative segment of modern economic activities, which contributes to economic growth thanks to the widespread adoption of technologies that enhance the productivity of both private and public activities666Please note, however, the existence of a strand of research that questions the actual contribution of modern ICTs to aggregate productivity as unsatisfactory if measured against initial expectations. The argument follows that one should expect much more productivity from adopting new technologies than what is measured, hence a so-called productivity paradox. Among others, see Acemoglu et al. (2014)..
Of course, the role of IPRs in the ICT industry has been the subject of many previous studies777In Appendix Table A1, we summarize the main issues and authors that we think are relevant to our study888For a comprehensive review, see Comino et al. (2019).. For our scope, we only need to underline a few milestones about the evolving relationship between IPRs and ICT. The industry has been responsible for a patent explosion since the 1980s (Hall, 2004). Danguy et al. (2014) show that a patent explosion cannot be attributed to a surge in research productivity. Rather, it is the product of the globalization of IPRs, since companies can decide it is convenient to claim their rights in front of different country offices. Yet, when Venturini (2022) focus on so-called digital intelligent technologies, they noted how they contributed to productivity because they helped implement the Fourth Industrial Revolution (4IR). Thus, they estimate that the segment of intelligent digital technologies accounts for a range between 3% and 8% of observed aggregate productivity changes in a sample of industrialized economies in 1990-2014.
Notably, a surge of patents in ICT correlates with the fragmentation of IPRs. Patent thickets emerge because ICTs are complex technologies where innovation is cumulative, and improvements or recombinations of previous inventions are relevant. Thus, ICT assignees often have overlapping claims through patent thickets (von Graevenitz et al., 2013). More than often, property rights on different technological system components are dispersed among several operators, and single companies may want to secure all the licenses needed to ’hack their way through the patent thicket’ (Shapiro, 2000). As a result, several entities (patent pools, standard-setting organizations, and patent intermediaries) have emerged that help overcome patent fragmentation, especially when it is important to establish technological standards (Blind et al., 2023).
Against the previous background, ICT companies may use patents less to protect focal innovations and more as strategic tools in negotiations, litigations, and signalling their technological position. From a legal perspective, we can say that, in many situations, patents have become a way to preempt substitute inventions (Cappelli et al., 2023) and license them out in a consolidated market for ideas (Gambardella et al., 2007; Arora and Gambardella, 2010). Not surprisingly, producers seem particularly keen on claiming IPR protection through court proceedings (Graham and Vishnubhakat, 2013) in order to preserve their market advantages.
Beyond the ICT industry, we believe we need to relate to previous evidence on US industries published by Balasubramanian and Sivadasan (2011), according to which increases in patent stocks are positively associated with firm size, scope, skill intensity, and capital intensity. Please note, however, how Balasubramanian and Sivadasan (2011) do not specifically test an impact on market shares, thus leaving the reader agnostic about the consequences of IPR on market structures.
Eventually, we relate our study to recent efforts to study the decision to grant patents at the level of patent offices. See recent works by Farre-Mensa et al. (2020) and Kline et al. (2019), but also Petit et al. (2023). In our case, we leverage information from different country patent offices and in different domains, given the propensity to grant patents out of total applications. In our setup, we consider the exogenous variation that comes from applicant firms that operate in industries different from ICT that however apply for grants in ICT technologies.
More controversial is the relationship between patenting and productivity, which is not robust to reverse causality in our study. After using data similar to ours but in the U.S., Balasubramanian and Sivadasan (2011) find only a weak significance of the nexus. Unfortunately, we can only loosely relate to previous studies because we cannot retrieve similar indicators of R&D expenses (Griffith et al., 2006; Mairesse and Robin, 2009; Mohnen and Hall, 2013; Crespi and Zuniga, 2012). However, we recall the work by Bloom and Van Reenen (2002), who find that patents could significantly impact firm-level productivity only in the longer run once inventions are incorporated into the production processes, and efforts have been made to promote new products or production processes. Yet, from our viewpoint, the empirical evidence provided by Bloom and Van Reenen (2002) is not entirely convincing. We argue that the authors test their hypotheses on a highly self-selected sample of only about firms that can stay quoted at the stock exchange throughout the entire period of analyses, thus not representative of the underlying business population that would include smaller and medium-sized firms.
In conclusion, please note that we need always make our analyses robust to different definitions of the corporate perimeter, thus encompassing patents granted to parent companies or their subsidiaries. We know that an optimal strategy by multinational enterprises implies locating part of their R&D activities in countries where IPR regimes are more favourable or where taxation is relatively lower Skeie et al. (2017). It is the case of IPR regimes where patent boxes are allowed; thus, revenues from granted patents are exempted from taxes to benefit from higher profits from international activities (Bösenberg and Egger, 2017; Alstadsæter et al., 2018; Davies et al., 2020). Indeed, there is ample evidence that multinational enterprises in any sector can take advantage of technology developed across different geographic regions, thus exploiting local subsidiaries for reverse knowledge transfer (Driffield et al., 2016).
3 Data and preliminary evidence
3.1 Data on firms and patents
For our purpose, we exploit a matched data set of firms and registered patents in 2009-2017 sourced from the ORBIS database999The ORBIS database has become a standard source for global financial accounts. See for example Gopinath et al. (2017), Cravino and Levchenko (2016), Del Prete and Rungi (2017), and Fattorini et al. (2020), Rungi et al. (2023). The coverage of smaller firms and details about financial accounts may vary among countries depending on the requirements of national business registries, as observed in Kalemli-Ozcan et al. (2015)., compiled by the Bureau Van Dijk. In particular, the module on Intellectual Property links companies and other entities (i.e., assignees of IPR) to their original patent filings collected from PATSTAT, the global database maintained by the European Patent Office. Usefully for our scope, the IP module by Orbis follows: i) the evolution of each patent filing, from the publication to the moment the property right is granted; ii) the changes in property rights from one assignee to another, e.g., in case of companies’ mergers and acquisitions. Previous users of the same database include Noailly and Smeets (2015), who study the effect of technological change on environmental performance, and Alstadsæter et al. (2018), who investigate the determinants of patent registration. Andrews et al. (2014) also use a similar matched patent-firm data set to identify the impact of first patenting on firm performance across industries and countries.
Having different countries on a timeline, we apply exchange rates and deflate firms’ financial accounts to express nominal values in constant 2015 US dollars. Exchange rates from national currencies are originally provided by the Bureau Van Dijk. At the same time, deflators are primarily sourced from either the OECD STAN Database or Eurostat for gross output, intermediate, and capital goods by country and sector of activity, respectively. In cases where deflators are unavailable at the two-digit or a more aggregate sector level, we use the GDP deflators at the country level. Deflators for Taiwan do not appear in the OECD or Eurostat, and we source them from the official local statistics office.
Although the IP module by Orbis includes patents and assignees from all over the world, we can keep only patents held by firms for which we have the basic financial information for testing our hypotheses. Eventually, we ended up with a sample of firms active in 39 countries and operating in the ICT industry.
At first, it is not straightforward to define an ICT perimeter encompassing both firms and patents, as both come with different classification systems that do not always match. On the other hand, it is quite possible that ICT firms obtain patents in non-ICT domains and that non-ICT firms obtain grants in ICT domains. Usefully, the latter is a variation that we want to exploit for our identification strategy in Section 4.2. From now on, we will consider ICT firms those belonging to either manufacturing or services industries following the work by Benages et al. (2018), who compiled the 2018 PREDICT database for the European Commission. In Appendix Tables A3 and A2, we enlist countries and NACE 2-digit industries included in our sample. In the case of patents and related applications to patent offices, we will consider ICT technologies based on a classification proposed by Eurostat and based on 4-digit subclasses of the International Patent Classification (IPC) system101010For further details, please see the original document available at https://ec.europa.eu/eurostat/cache/metadata/Annexes/pat_esms_an2.pdf.
3.2 Preliminary evidence
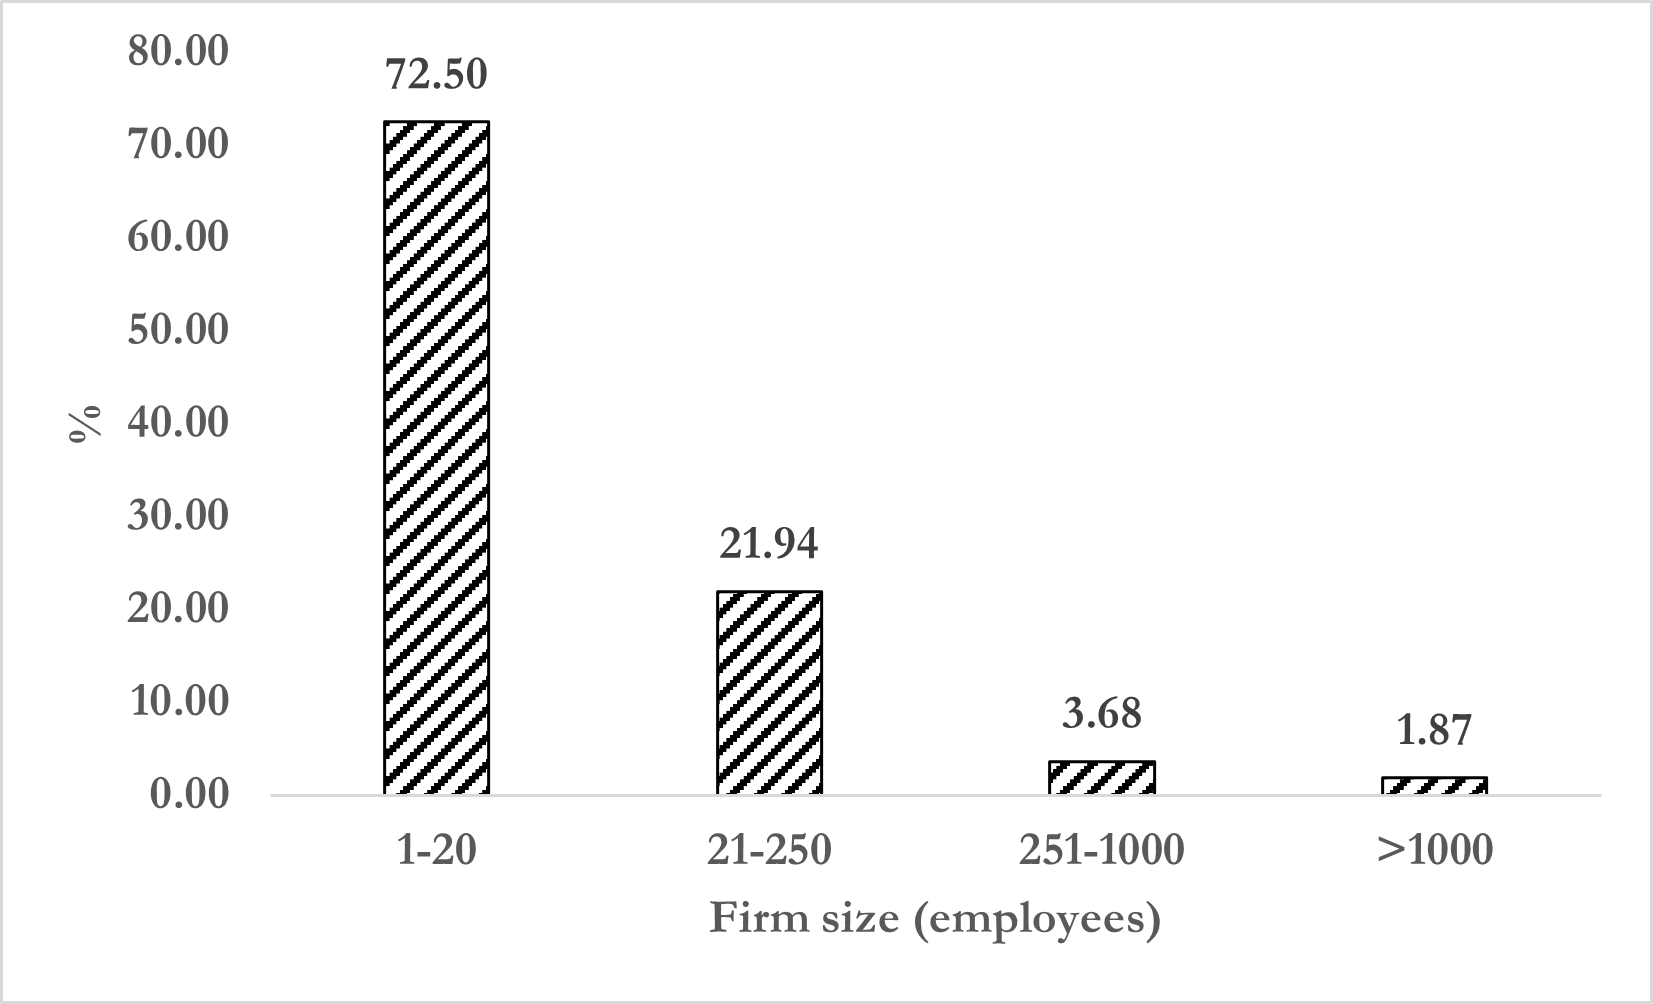
First, we provide a snapshot of ICT firms’ heterogeneous distributions of patents, and we compare it with firm size distribution. Figure 1 shows the frequency of firms in four main size categories based on the number of employees in the last sample year: 1-20; 21-250; 251-1000; higher than 1,000. As expected, the largest category is the one represented by smaller firms (), whereas bigger corporations with more than employees represent only of the sample. This aligns with most evidence about the heterogeneous distribution of firm size within any industry, not specifically of the ICT industry.
-
•
Note: The figure shows the sample distribution of ICT firms by size (number of employees) in 2017.
-
•
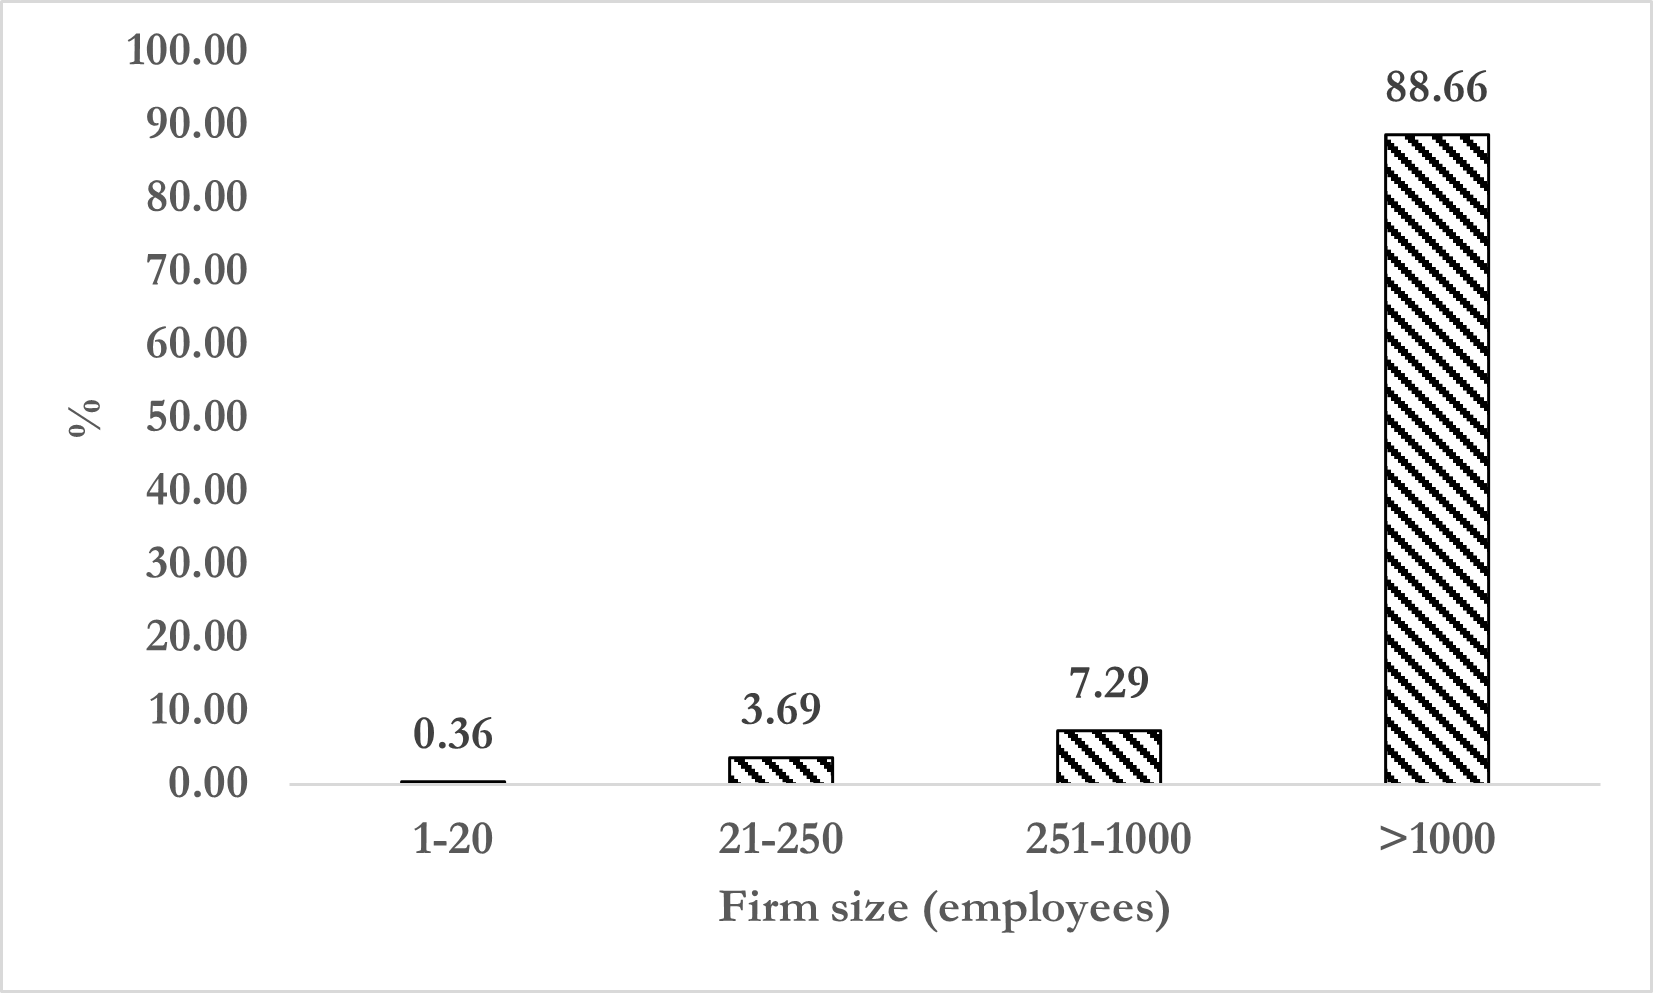
Note: The figure shows the distribution of patent grants obtained by ICT firms in 2009-2017, in percentage by class of firm size. Firm size is measured as the number of employees in 2017.
What is peculiar is the evidence reported in Figure 2, which shows that the category of very large firms, on the right of the distribution, actually accounts for of the patents that have been granted in our period of analyses. The latest is striking evidence that IPRs are highly concentrated in the ICT industry among a handful of larger players that can get a high number of grants, albeit in a short period of time. Notably, only a few firms active in the ICT industry are able to obtain patents, while a majority of them operate without getting any grants. We believe that such a concentration of IPRs among a few larger companies is preliminary evidence that is interesting per se.
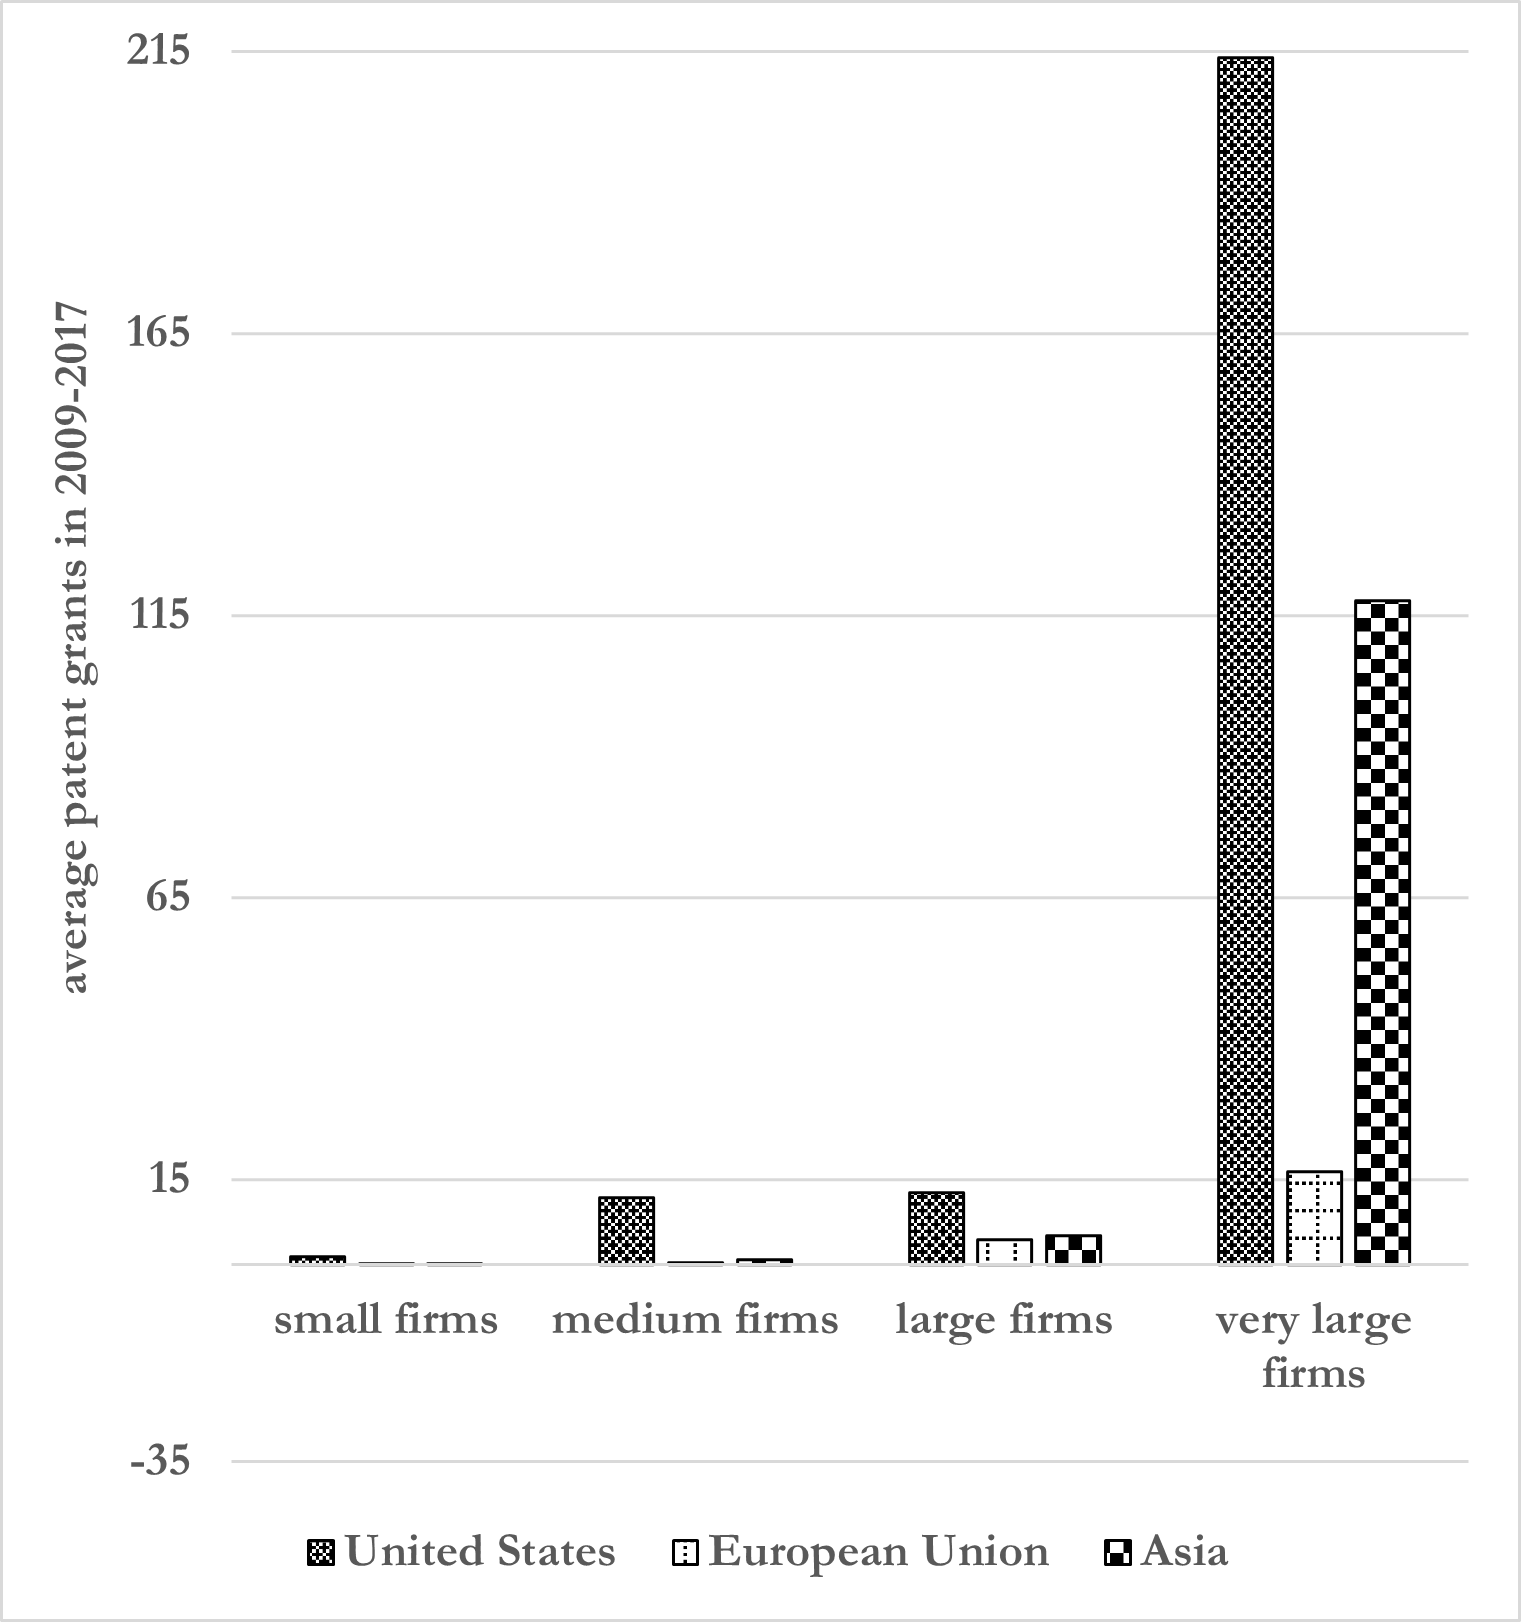
Patenting activity is, at the same time, a sparse and concentrated phenomenon that involves only a few bigger companies in the ICT industry. Indeed, ICTs are complex technologies that require high R&D sunk costs to operate. Such evidence motivates the following analyses to qualify how patent assignees look different from non-assignees, where they are, and the impact of patent grants on their firm-level outcomes. Let us start in Figure 3 to check where most active assignees are. After adopting the same classification by firm size of previous figures, we report on the x-axis the average number of grants that a firm obtained in 2009-2017.
-
•
Note: The figure shows the average number of granted patents by firm size and main geographic area in our period of analyses (2009-2017). Small firms are companies with up to 20 employees; medium firms with up to 250 employees; large firms with up to 1,000 employees; very large firms with more than 1,000 employees.
What we find is that the headquarters of the most active assignees are located first and foremost in the U.S., although very large firms with headquarters in Asia also obtain, on average, a relatively high number of patent grants, certainly higher than in the case of companies in the European Union.
Therefore, from our perspective, it is interesting to check whether and how assignees are statistically different from non-assignees. Table 2 provides preliminary evidence of firm-level outcomes’ differences with t-tests. We observe that assignees have, on average, a much higher market share; they are significantly more productive, bigger and more capital-intensive than non-assignees. Yet, we do not observe a significant difference in profits as measured by ROCE (Return on Capital Employed)111111Please note that we make our results robust to different definitions of profitability, both here and in the following paragraphs. Robustness checks on profitability are available upon request.. The average assignee generates about dollars per worker in a year, whereas non-assignees register on average about dollars per worker in a year. The representative assignee generates about million dollars while average annual revenues are only million dollars when a company is not granted any patent.
| % Market share | (log) Labour productivity | (log) Size | (log) Capital intensity | ROCE (levels) | |
| Assignees | .0199 | 12.1624 | 17.6055 | 11.2350 | 0.0050 |
| (.0009) | (.0068) | (0.0158) | (0.0098) | (0.0023) | |
| Non-assignees | .0004 | 11.1296 | 13.1669 | 8.8648 | 4.7349 |
| (.0001) | (.0014) | (0.0024) | (0.0023) | (4.6573) | |
| Difference | .0195*** | 1.0329*** | 4.4386*** | 2.3701*** | -4.7299 |
| (.0002) | (.0085) | (0.01469) | (0.0141) | (27.8492) |
-
•
Note: The table reports t-tests on the differences in market share, (log) labour productivity, (log) size, (log) capital intensity and profitability (ROCE) for companies having at least one patent vis á vis companies without patents. The unit of observation is firm-year level. Clustered standard errors in parentheses. *** denotes significance at .
Interestingly, in Appendix Tables A4 and A6, we also record that firm-level outcomes of interest positively correlate with the intensity of patenting activity. The higher the number of patent grants, the higher the market shares, productivity, firm size, and capital intensity. An exception is profitability measured by ROCE, which correlates negatively with patenting activity. Evidently, R&D costs needed to innovate in the industry may strain financial accounts.
Clearly, empirical evidence so far does not say anything about the causality direction; whether it is the case that bigger and more productive firms are more able to obtain patents or whether patent grants allow them to gain market shares and become bigger and more productive. On the other hand, it is also possible that positive correlations so far are spurious, as both firms’ outcomes and the ability to get patents both correlate with the unobserved innovative content of the registered inventions. The following paragraphs will fundamentally challenge reverse causality and develop a strategy to unveil the endogenous relationships between firm-level outcomes, IPR protection, and innovative abilities.
4 Empirical strategy and results
Our objective is to assess the impact of patenting on the ICT firm-level outcomes that are of interest to us because they provide useful information on the concentration of the industry and the sources of market advantages. For our purpose, we adopt:
-
•
An empirical setup for a difference-in-difference strategy introduced by Callaway and Sant’Anna (2021) allows treatment to occur at different moments on the timeline. Basically, the authors show that common two-way fixed effects estimators are biased in the presence of a panel dimension. The intuition is that a bias occurs when newly treated units in one period are compared to units that had already been treated in a previous period. In the following paragraphs, we introduce notation to clarify how the identification strategy works, and then we report the main findings.
-
•
A novel instrumental variable (IV) approach that considers the patenting decision as endogenous, for which we use information about the propensity to grant patents at the level of patent offices. This strategy can be implemented only for smaller firms, as we will discuss later. The intuition is that we can exploit exogenous variation on the propensity to grant a patent to non-ICT firms whose market outcomes are not directly correlated with the ones of the ICT industry.
4.1 The effects of patent grants
We implement a difference-in-difference on a panel data set following Callaway and Sant’Anna (2021) to identify the average treatment effect on the treated (ATT) for any group of firms that obtained at least a grant at a specific time , as follows:
| (1) |
where is a binary variable equal to one if a firm belongs to the group ; is a binary equal to one for firms that have never been granted a patent at any time period; is the firms’ outcome at time , i.e., market share, labour productivity, firm size, capital intensity or profits (ROCE). Then, is the probability of publishing a granted patent at time conditional on pre-treatment covariates and: i) either belonging in the group ; ii) or not being granted any patent at any time during the period. Then, is the population outcome regression for the control group made by firms that have never been granted a patent in our period of analyses121212Please note that Callaway and Sant’Anna (2021) provide alternative specifications to estimate group-time average treatment effects. In this application, we adopt the doubly robust estimator first proposed by Sant’Anna and Zhao (2020) because it is more challenging in identification than the alternatives..
Importantly, we always check that the assumption of parallel trends is made conditional on companies’ characteristics before treatment. This is generally useful in any difference-in-difference specification, and it is all the more necessary in our case because we work in a panel setup, where cohorts of treated and untreated observations alternate along the timeline. More precisely, we control for a firm’s capital intensity, its number of employees, age, 4-digit NACE rev. 2 industry-level dummies, and three location-specific fixed effects when headquarters located in the European Union, the United States, and the rest of the world.
Please note that, for this exercise to work, we must consider a balanced panel with complete information on labour productivity, employment, capital intensity and age. Thus, we exclude companies that registered patents in 2009 because we cannot check for what happens before treatment in that year. Eventually, we end up with a reduced sample of firms, of which only companies have been treated at some point in 2010-2017, and have never been granted any patents in the same period131313Please note that at this stage, we consider only patents granted directly to firms. In a robustness check reported in the Appendix Table A8, we repeat the exercises by considering treated those firms that were granted patents indirectly, because they delegated their subsidiaries. Results do not significantly change..
At this point, to estimate the overall impact of patenting on firm-level outcomes, we shall consider a weighted average of previously defined in the following way:
| (2) |
where,
and denotes the number of years. In other words, even if we work on a panel data set, where firms can be granted patents at different moments on the timeline, we can still obtain a unique parameter, , which tells us whether patents have an impact on firm-level outcomes. That parameter is finally a weighted average of time-specific parameters, as the latter are obtained considering groups of firms that have been treated in any observed period. The group-specific weights, ’s, are obtained considering the relevance of each group over the total sample.
Finally, we can test the persistence of the effect thanks to a classical event study analysis, for which we need to compute the length of exposure to the treatment, . The latter is another form of aggregation of the group-time specific effect, which we can define as:
| (3) |
In plain words, eq. 3 returns the average impact on firm-level outcomes after periods from being granted a patent, considering the heterogeneity across all cohorts participating in the treatment.
In Table 3, we report estimates of the impact of the patenting activity on firm-level outcomes. According to our findings, companies being granted patents in the period 2010-2017 benefit from an increase in market share by (log units: ), which comes with a parallel increase in revenues (; log units: ) and employment (, log units: ). As largely expected, firms obtain the legal protection of new technological advancements against potential imitators and benefit from a temporary monopolistic power on the new inventions.
| Variable | s. e. | N. treated firms | N. untreated firms | |
| All firms | ||||
| (log) Market share | 0.091*** | (0.031) | 432 | 24,090 |
| (log) Labor productivity | 0.003 | (0.023) | 432 | 24,090 |
| (log) Firm size (employees) | 0.067*** | (0.023) | 432 | 24,090 |
| (log) Firm size (turnover) | 0.093*** | (0.031) | 432 | 24,090 |
| (log) Capital intensity | 0.037 | (0.041) | 432 | 24,090 |
| ROCE (levels) | -0.015 | (0.014) | 330 | 18,332 |
| Small firms | ||||
| (log) Market share | 0.275*** | (0.103) | 71 | 12,190 |
| (log) Labor productivity | 0.059 | (0.079) | 71 | 12,190 |
| (log) Firm size (employees) | 0.172*** | (0.059) | 71 | 12,190 |
| (log) Firm size (turnover) | 0.291*** | (0.103) | 71 | 12,190 |
| (log) Capital intensity | 0.117 | (0.120) | 71 | 12,190 |
| ROCE (levels) | 0.010 | (0.053) | 50 | 9,570 |
| Large firms | ||||
| (log) Market share | 0.051* | (0.029) | 361 | 11,900 |
| (log) Labor productivity | -0.011 | (0.021) | 361 | 11,900 |
| (log) Firm size (employees) | 0.044* | (0.023) | 361 | 11,900 |
| (log) Firm size (turnover) | 0.055* | (0.029) | 361 | 11,900 |
| (log) Capital intensity | 0.015 | (0.042) | 361 | 11,900 |
| ROCE (levels) | -0.009 | (0.016) | 280 | 9,570 |
-
•
Note: The table illustrates average aggregate treatment effects after following the doubly robust version of the method by Callaway and Sant’Anna (2021), in the presence of a panel setting, under the assumption of parallel trends conditional on firm-level control variables, 4-digit NACE sector, and regional dummies. Treated firms are matched with untreated firms using inverse probability weights. Errors are clustered at the firm level. *, ** and *** denote significance at 10%, 5% and 1% respectively.
Yet, considering the heterogeneity in the distributions of both firm size and patenting activity observed before (Figures 1 and 2), it makes sense to check if the impact on smaller patentees is significantly different from the impact on bigger corporate players. In the second and third sections of Table 3, we split the sample considering the size (measured by revenues) before the treatment. We consider smaller firms the ones that report revenues below the sample median, and we separate them from bigger firms as they record revenues above the sample median.
Results clearly show that the magnitude of the impact for smaller firms is quite relevant on both market shares (; log units: ) and firm size measured as turnover (; log units: ) and employment (; log units: ). Notably, coefficients on labor productivity, capital intensity and profitability (ROCE) are never statistically significant. Evidently, after challenging reverse causality, a large part of the correlations of firm-level outcomes with patenting activity observed in Tables 2 and A4 fades away. In other words, our findings show that productivity and profitability are not a direct consequence of the grants that firms obtained, at least in the short run. We observe that the latter findings are coherent with cross-country general evidence on manufacturing companies beyond the ICT industry, as in Andrews et al. (2014). On the other hand, our evidence contrasts with Balasubramanian and Sivadasan (2011), who find a significant effect on productivity in the case of U.S. firms, although relatively smaller if compared to the impact on firm size. Interestingly, we can see at the bottom of Table 3 that the impact on larger firms’ accounts is also statistically relevant but with a significantly lower magnitude on market shares (; log units: ), turnover (; log units: ) and employment (; log units: ). From our viewpoint, it makes sense that bigger ICT players benefit less from additional patent grants at the margin since they already have a relevant dimension and they already hold, on average, a consistent portfolio of older patent grants.
Moreover, please note that our findings do not exclude that companies also benefit indirectly from patenting activities, e.g., when using patents strategically in litigations, negotiations, and as a signal vs potential competitors. As already discussed in Section 2, the ICT industry is a typical sector with complex technologies where strategic registrations of patents emerged in the latest decades. In this context, indirect benefits can emerge, such as lower competition on product lines already under a grant. Potentially, indirect effects explain the strongest correlations between patenting activity and firms’ outcomes, which we discussed in Section 3 before we challenge reverse causality.
Finally, we report event studies following the procedure described in eq. 3 in Appendix Figures A1-A6. We aim to check how our main firm-level outcomes of interest evolve as time passes from when the representative company has been granted a patent. As in any classical event study, we align events on a reference period, , which is the first year a firm has been granted a patent in our sample, . Therefore, after following eq. 3, we plot the impact on the outcome of the representative company at any following period, thereby checking that previous trends are conditional on firm-level characteristics, industry affiliations, and the firm’s location choices. Evidently, in any of the figures, we do not visualize any statistically significant trend before treatment, i.e., companies are not systematically showing that they were becoming bigger, more productive, or capital intensive before obtaining patent grants, in .
Please note that, at this stage, we have challenged the direction of causality between patents and market shares. However, we may still confound the impact of IPR with the one played by innovation. Even if, in the previous paragraphs, we control for the selection of most productive firms into the status of patentees, we could not separate the role of unobserved innovations. The main problem is that patent grants are both an indicator that companies were able to innovate and, simultaneously, of the legal protection they obtained from imitation by competitors that could otherwise challenge market shares. Therefore, in the following paragraphs, we focus on distilling the role of property rights protection on firms’ market shares.
4.2 IPR and firms’ dynamics: an IV approach
In previous paragraphs, we first detected a positive premium on firm-level outcomes by patentees over non-patentees. Then, we implemented a strategy to identify the direction of causality between patent grants and firms’ dynamics. We concluded that smaller assignees gain a higher advantage than bigger players in market shares and firm size. However, we were agnostic about the economic channel that drives the impact. Naturally, a patent grant is both an indicator of IPR protection and a proxy for the unobserved ability of firms to innovate. Thus, gains in market shares and firm size are expected after a grant as either the result of a higher demand for innovative ICT products and/or as a consequence of the protection granted by patent offices from imitation by competitors.
To focus on the role of IPR, we implement a novel instrumental variable strategy inspired by recent works on patent offices (see, among others, Kline et al. (2019), Farre-Mensa et al. (2020) and Petit et al. (2023)). For our scope, we consider as ’treated’ those firms that are granted unique patents in a technological domain/country/year in our period of analyses. This is the level at which we assume that an expert at the patent office decides the novelty of an invention and thus grants (or not) a patent. The control group encompasses, instead, firms that never registered any patent in our study period.
Our basic intuition is that we can use exogenous variation based on what happens to ICT technologies granted to firms outside the ICT industry. The exclusion restriction assumption is valid because non-ICT firms do not compete with players in the ICT global industry; therefore, we do not expect firms’ market shares to correlate across the two groups. Nonetheless, firms in non-ICT industries occasionally are interested in protecting their ICT innovations; therefore, when they apply for a grant, they are subject to the same evaluation process regardless of their economic activity141414A concern could be that experts at the patent office may evaluate ICT firms more favourably, either because they have a sort of bargaining power or because they have experience in how to apply in ICT technological domains. Yet, Appendix Figure A7 shows a high correlation between approval rates across the two categories of firms when they face evaluation by patent offices.. In this sense, we expect propensities to get patent grants in the same technologies and in the same year to be correlated with the propensity of an ICT firm to get a patent grant. The latter is our intuition for the instruments’ relevance assumption, which we preliminarily validate in Appendix Figure A7. In particular, we consider:
-
•
the approval rate of grants over the number of applications that non-ICT firms put forward in the same technologies of ICT firms, , evaluated by the same patent offices, , in each same year, , as follows:
-
•
the number of applications () by non-ICT firms at the same patent offices, , in the same technology classes, , and in the same year, 151515Please note how from the application to the actual patent grant there could be a few years distance. That’s why, in line with relevant literature, we consider priority years for applications and publication years for grants..
Eventually, the first equation of our IV approach can be written as:
| (4) |
where is a binary indicator equal to 1 when a firm at time is granted property rights by patent office for a patent in technology class . Besides the instruments mentioned above (, ), we also control for firm-level characteristics , namely firm size, capital intensity and related growth rates, as well as firm age. , , are, respectively, a set of countries’ patent offices, industry, and technology-year fixed effects.
Eventually, the outcome equation can be written as follows:
| (5) |
where is the outcome of firm operating in year , and is the predicted outcome from eq. 4. Please note that, for the scope of our analysis, we perform four separate models reported in the following tables by forwarding both the outcomes, , and the firm-level covariates, , to observe what happens in the years following the unique grant, . Eqs. 4 and 5 are a system of simultaneous equations to be run following a classical optimal generalized method of moments (GMM) with robust standard errors. Results161616Results on additional firm-level outcomes are available upon request. We decided to report only significant results on market shares and profitability for shortness’ sake. Main outcomes of interest are reported in Tables 4 and 5.
Evidently, the positive impact of patent grants on a firm’s market share remains after we check for the unobserved innovative contents of ICT technologies. Magnitudes are not distant from what we already observed in Table 3 for smaller firms.
In the second part of Tables 4 and 5, we report the GMM first-stage results of eq. 4 after a linear probability model (LPM). Tests for overidentification do not reject our instruments and are reported at the bottom of the table. Usefully, we also find that both the approval rates and the total applications in an ICT technology-country-year cell by firms operating in non-ICT markets correlate well with the endogenous binary outcome. In the case of the total number of applications, the coefficient is negative and significantly associated with the odds that a company obtains a patent grant, in line with our intuition that more crowded technological classes are less innovative at the margin.
| Dependent variable: (log of) Market share | |||||
| (t) | (t+1) | (t+2) | (t+3) | (t+4) | |
| 0.26** | 0.14 | 0.23 | 0.057 | 0.37 | |
| (0.12) | (0.13) | (0.14) | (0.14) | (0.19) | |
| (log of) Firm size | 1.07*** | 1.09*** | 1.11*** | 1.11*** | 1.16*** |
| (0.015) | (0.015) | (0.018) | (0.021) | (0.027) | |
| Firm growth | -0.37*** | -0.41*** | -0.35*** | -0.26*** | -0.16** |
| (0.042) | (0.057) | (0.066) | (0.068) | (0.072) | |
| (log of) Capital intensity | 0.15*** | 0.14*** | 0.16*** | 0.16*** | 0.19*** |
| (0.015) | (0.014) | (0.014) | (0.017) | (0.020) | |
| Capital intensity growth | -0.013 | -0.12*** | -0.063 | -0.028 | -0.087** |
| (0.027) | (0.031) | (0.047) | (0.040) | (0.035) | |
| Firm age | 0.011*** | 0.0058*** | 0.0056** | 0.0030 | -0.0086*** |
| (0.0020) | (0.0019) | (0.0024) | (0.0027) | (0.0031) | |
| Dependent variable: | |||||
| (t) | (t+1) | (t+2) | (t+3) | (t+4) | |
| Approval rate non-ICT firms | 0.52*** | 0.55*** | 0.47*** | 0.52*** | 0.55*** |
| (0.025) | (0.035) | (0.040) | (0.050) | (0.057) | |
| Total applications non-ICT firms | -0.030*** | -0.032*** | -0.040*** | -0.044*** | -0.040*** |
| (0.0040) | (0.0047) | (0.0049) | (0.0061) | (0.0078) | |
| (log of) Firm size | -0.015** | -0.014** | -0.015** | -0.011 | -0.012 |
| (0.0058) | (0.0061) | (0.0068) | (0.0085) | (0.010) | |
| Firm growth | 0.0043 | 0.027 | 0.058** | 0.037 | -0.087*** |
| (0.012) | (0.020) | (0.025) | (0.035) | (0.031) | |
| (log of) Capital intensity | -0.016*** | -0.016*** | -0.0051 | -0.0094 | -0.018** |
| (0.0054) | (0.0059) | (0.0065) | (0.0073) | (0.0082) | |
| Capital intensity growth | -0.011 | 0.015 | -0.015 | 0.013 | 0.018 |
| (0.0093) | (0.012) | (0.015) | (0.019) | (0.019) | |
| Firm age | 0.00017 | -0.00012 | 0.00082 | 0.0034** | 0.0043** |
| (0.00089) | (0.00091) | (0.0011) | (0.0014) | (0.0018) | |
| N. obs. | 4937 | 3568 | 2610 | 1933 | 1421 |
| R-squared | 0.729 | 0.750 | 0.777 | 0.734 | 0.748 |
| Adjusted R-squared | 0.711 | 0.727 | 0.753 | 0.700 | 0.712 |
| AIC | 12412.7 | 9051.9 | 6312.0 | 4737.1 | 3303.2 |
| Hansen’s J test | 11.45 | 8.08 | 1.12 | 2.88 | 0.76 |
| LM test statistics | 402.7 | 283.8 | 211.5 | 183.5 | 139.3 |
-
•
Note: The table illustrates the impact of a patent grant on firm-level market shares (outcome equation) after an IV approach that controls (first stage) the endogenous role of innovation contents after exogenous variation on assignees in non-ICT industries that obtain patents in the same technologies, countries, and years of ICT firms. At the bottom of the table, we record tests on the validity of instruments. Estimates are obtained after an optimal GMM estimation with robust standard errors in parentheses. ∗p0.1; ∗∗p0.05; ∗∗∗p0.01.
| Dependent variable: Return on capital employed (ROCE) | |||||
| (t) | (t+1) | (t+2) | (t+3) | (t+4) | |
| -0.008 | 0.170 | -0.170 | -0.191 | 0.430 | |
| (0.21) | (0.24) | (0.28) | (0.28) | (0.32) | |
| (log of) Firm size | 0.038* | 0.084*** | 0.10*** | -0.037 | 0.093* |
| (0.023) | (0.026) | (0.029) | (0.033) | (0.052) | |
| Firm growth | 0.220*** | 0.331*** | 0.11 | 0.222** | 0.240* |
| (0.060) | (0.085) | (0.097) | (0.10) | (0.13) | |
| (log of) Capital intensity | -0.151*** | -0.140*** | -0.120*** | -0.111*** | -0.099*** |
| (0.020) | (0.023) | (0.024) | (0.027) | (0.035) | |
| Capital intensity growth | 0.17*** | 0.130** | -0.090 | -0.004 | 0.077 |
| (0.045) | (0.053) | (0.070) | (0.077) | (0.064) | |
| Firm age | -0.005 | -0.013*** | -0.008* | 0.013** | -0.009 |
| (0.003) | (0.004) | (0.004) | (0.006) | (0.008) | |
| Dependent variable: | |||||
| (t) | (t+1) | (t+2) | (t+3) | (t+4) | |
| Approval rate non-ICT firms | 0.621*** | 0.530*** | 0.511*** | 0.490*** | 0.601*** |
| (0.042) | (0.047) | (0.053) | (0.065) | (0.076) | |
| Total applications non-ICT firms | -0.018*** | -0.034*** | -0.030*** | -0.049*** | -0.051*** |
| (0.006) | (0.006) | (0.007) | (0.008) | (0.010) | |
| (log of) Firm size | -0.017** | -0.010 | -0.020** | -0.012 | -0.023* |
| (0.007) | (0.008) | (0.009) | (0.011) | (0.014) | |
| Firm growth | -0.005 | -0.010 | 0.015 | 0.050 | -0.096** |
| (0.018) | (0.026) | (0.034) | (0.048) | (0.041) | |
| (log of) Capital intensity | -0.005 | -0.004 | -0.009 | -0.007 | -0.021* |
| (0.008) | (0.008) | (0.009) | (0.009) | (0.011) | |
| Capital intensity growth | -0.026* | 0.001 | -0.024 | 0.016 | 0.022 |
| (0.013) | (0.015) | (0.019) | (0.025) | (0.023) | |
| Firm age | 0.001 | -0.001 | 0.003 | 0.003 | |
| (0.001) | (0.001) | (0.001) | (0.002) | (0.002) | |
| N. obs. | 2579 | 2203 | 1746 | 1316 | 984 |
| R-squared | 0.035 | 0.037 | 0.042 | 0.021 | -0.014 |
| Adjusted R-squared | -0.072 | -0.082 | -0.097 | -0.141 | -0.202 |
| AIC | 8006.0 | 7071.9 | 5353.7 | 4032.0 | 3035.9 |
| Hansen’s J test | 0.34 | 2.03 | 13.6 | 0.18 | 0.070 |
| LM test statistic | 222.2 | 182.9 | 129.0 | 122.0 | 103.8 |
-
•
Note: The table illustrates the impact of a patent grant on firm-level profitability (outcome equation) measured by Returns On Capital Employed (ROCE) after an IV approach that controls (first stage) the endogenous role of innovation contents after exogenous variation on assignees in non-ICT industries that innovate in the same technologies, countries, and years of ICT firms. At the bottom of the table, we report the standard Sargan-Hansen tests and Kleinbergen-Paap LM statistics for overidentification. Estimates are obtained after an optimal GMM estimation with robust standard errors in parentheses. ∗p0.1; ∗∗p0.05; ∗∗∗p0.01.
In line with evidence from previous analyses, we do not find any significant impact on profitability measured by the ROCE index. More in general, we argue that the ensemble of our findings on profitability and market shares relates to existing frameworks that study the peculiar structure of innovative industries, as pertains to the case of the ICT global firms. From this perspective, our findings hint at the existence of endogenous sunk costs á la Sutton (1998). See also Shaked and Sutton (1983, 1987). Briefly, even in the presence of an increase in market shares, profit margins may not follow because firms must sustain the high sunk costs in R&D needed to keep up with innovation and meet customers’ demand for novel and differentiated ICT products.
5 Robustness and sensitivity checks
In this Section, we comment on a few robustness and sensitivity checks whose results are reported in Appendix Tables.
First, we checked whether the corporate perimeter matters for the magnitude and significance of the impact of patent grants. As we have an industry with global outreach, we cannot exclude that innovation and patenting activity are delegated to subsidiaries in the same country of headquarters or abroad. The main idea is that multinational companies can control important portfolios of patents and manage them through subsidiaries located in many countries. In bigger groups, considerations about fiscal optimization and local knowledge advantages can bring about the location of highly specialized R&D labs abroad (Bösenberg and Egger, 2017; Alstadsæter et al., 2018; Davies et al., 2020). For our purpose, we modified our treatment group to consider as also treated those companies whose subsidiaries have been granted a patent in our analysis period. In the second column of Appendix Table Appendix: Tables and Graphs, we visualize the change in the composition of the treatment group. On the other hand, the control group will encompass companies without patents, either at the headquarter or subsidiary levels. We show in Appendix Tables A7 and A8 how our main tenets on market shares are confirmed.
A second concern related to the computation of market shares. We performed a sensitivity analysis to check whether previous results were mediated exclusively by firms’ demography since market entry and exit dynamics may correlate with innovation abilities and IPR. Among other things, we know that market shares, firm size, and the number of competitors may evolve over a product life cycle. In other words, it is possible that the dynamics of IPR interact with an endogenous market selection process. Thus, some firms may find it difficult to outlive the market after competitors have been granted the use of fundamental innovations. On the other hand, new entrants may find it convenient to enter the market when a patent grant expires after they have the chance to imitate fundamental products. To be sure that changing barriers to entry are not driving our previous results, we repeat our previous exercises by computing market shares on a balanced sample, i.e., considering only incumbent firms for which we can estimate market shares within the sample, excluding entry and exit dynamics. Results are reported in Appendix Table A9. The coefficient of interest in the first year after the grant is still positive and significant, with a magnitude slightly lower than in baseline results.
A third concern relates to the geographical composition of the sample. Although we perform our tests on ICT companies located in 39 countries, we find that there is an uneven concentration of companies across countries. The composition of our sample is prima facie consistent with what we know about the geographical concentration of the global ICT industry. Countries like the United States, Japan and South Korea host headquarters of important global market players. On the other hand, in section 3, we showed how countries of the European Union present a relatively lower competitive advantage in the ability to patent innovations. Although the EU hosts an important number of companies in the ICT industry, these companies have a relatively lower propensity to obtain patent grants. Informed by previous evidence, we repeat our exercises on market shares by separating two subsets. In Appendix Table A10, we provide results for companies operating in the United States, Japan and South Korea, whereas the impact on European firms is registered in Appendix Table A11. Please note how our results are indeed sensitive to geographic location. When we consider only the US, Japan and South Korea, the impact on market shares is bigger and more persistent, up to the third year after the publication of the grant.
6 Conclusions
The global ICT industry is a fundamental source of growth in modern economies. Its products and services are purchased by final consumers who want to stay updated on the newest technologies. Importantly, ICTs are relevant inputs in the production processes of many other sectors.
Comprehensibly, the sector attracts the attention of both policymakers and scholars from different fields. Most recently, serious doubts have been raised about an excessive market concentration among a few Big-Tech global players. Antitrust authorities in the US and the European Union continue to investigate whether there is evidence of detrimental effects on social welfare. Certainly, IPR are possible channels through which a concentration of market power can be reached and sustained. In this context, we reconnect with the more general debate about the costs and benefits of the IPR regimes. There have always been several proposals for reform, albeit without success. Already in the 1950s, the U.S. Senate Judiciary Committee commissioned expert reports on the effects of the patent system and the need to reform it (Machlup, 1958). Opinions always range between abolition (Boldrin and Levine, 2008, 2013) and reform (Bessen and Meurer, 2009; Stiglitz, 2007). Most recently, the European Commission (2020) acknowledges that reform is necessary, and it proposes an action plan to help companies capitalise on their inventions and creations in times of digital and green transitions.
Specifically, in this contribution, we find that patent grants in the ICT industry are highly concentrated in larger firms, as about 2% of them, with more than 1,000 employees, own 89% of the patents registered globally. Yet, we also find that smaller firms are the ones that actually benefit from IPR, as they can increase, on average, their market shares in the first years after the grants up to %.
Briefly, we find that, albeit a few, smaller firms can still take advantage of their inventions, thanks to IPR, and establish the productive capacity needed to sell their innovative products. Notably, we find that albeit lower market advantages are granted to larger firms, even if they hold very large portfolios of patents.
Nonetheless, by now, we know from previous extensive literature (Comino et al., 2019) that ICT is an industry where IPR fragmentation is relevant, so much that it becomes increasingly difficult for companies to ’hack their way through the patent thicket’ (Shapiro, 2000). On the other hand, we also know that ICT is a poster child for an industry where R&D sunk costs are relevant, and companies need to keep a competitive advantage by continuing to invest in innovation (Sutton, 1991, 1998).
Against the present background, we argue that any IPR reform cannot neglect that firms have heterogeneous advantages from patent grants. Smaller firms struggle relatively more to outlive an R&D-intensive market. At the same time, smaller firms must handle an institutional environment favouring larger firms, which can better navigate intricate IPR regimes. In our view, important avenues of studies could help understand how an optimal IPR policy can respond to the needs of different categories of firm size, providing them with the right incentives to extend investment in innovation efforts.
References
- Acemoglu et al. (2014) Acemoglu, D., Autor, D., Dorn, D., Hanson, G. H., Price, B., May 2014. Return of the solow paradox? it, productivity, and employment in us manufacturing. American Economic Review 104 (5), 394–99.
- Acs and Audretsch (1988) Acs, Z. J., Audretsch, D. B., 1988. Innovation in large and small firms: an empirical analysis. The American economic review, 678–690.
- Aghion et al. (2005) Aghion, P., Bloom, N., Blundell, R., Griffith, R., Howitt, P., 2005. Competition and innovation: An inverted-U relationship. The quarterly journal of economics 120 (2), 701–728.
- Alstadsæter et al. (2018) Alstadsæter, A., Barrios, S., Nicodème, G., Skonieczna, A. M., Vezzani, A., 2018. Patent boxes design, patents location, and local R&D. Economic Policy 33 (93), 131–177.
- Andrews et al. (2014) Andrews, D., Criscuolo, C., Menon, C., 2014. Do resources flow to patenting firms?: Cross-country evidence from firm level data. OECD Economics Department Working Papers (1127).
- Arora and Gambardella (2010) Arora, A., Gambardella, A., 2010. Ideas for rent: an overview of markets for technology. Industrial and Corporate Change 19 (3), 775–803.
- Balasubramanian and Sivadasan (2011) Balasubramanian, N., Sivadasan, J., 2011. What happens when firms patent? new evidence from US economic census data. The Review of Economics and Statistics 93 (1), 126–146.
- Baron et al. (2014) Baron, J., Ménière, Y., Pohlmann, T., 2014. Standards, consortia, and innovation. International Journal of Industrial Organization 36 (C), 22–35.
- Bellemare and Wichman (2020) Bellemare, M. F., Wichman, C. J., 2020. Elasticities and the inverse hyperbolic sine transformation. Oxford Bulletin of Economics and Statistics 82 (1), 50–61.
- Benages et al. (2018) Benages, E., Hernández, L., Mínguez, C., Pérez, J., Robledo, J., Salamanca, J., Solaz, M., Cardona, M., López-Cobo, M., Righi, R., Samoili, S., 2018. The 2018 PREDICT dataset methodology. Tech. rep., Joint Research Centre, European Commission, https://ec.europa.eu/jrc/sites/jrcsh/files/jrc111922.pdf.
- Berry et al. (2019) Berry, S., Gaynor, M., Morton, F. S., 2019. Do increasing markups matter? lessons from empirical industrial organization. The Journal of Economic Perspectives 33 (3), 44–68.
- Bessen and Meurer (2009) Bessen, J., Meurer, M. J., 2009. Patent Failure: How Judges, Bureaucrats, and Lawyers Put Innovators at Risk. Princeton University Press.
- Blind et al. (2023) Blind, K., Kenney, M., Leiponen, A., Simcoe, T., 2023. Standards and innovation: A review and introduction to the special issue. Research Policy 52 (8), 104830.
- Blind et al. (2017) Blind, K., Petersen, S. S., Riillo, C. A., 2017. The impact of standards and regulation on innovation in uncertain markets. Research Policy 46 (1), 249–264.
- Bloom and Van Reenen (2002) Bloom, N., Van Reenen, J., 2002. Patents, real options and firm performance. The Economic Journal 112 (478), C97–C116.
- Blundell et al. (1999) Blundell, R., Griffith, R., Van Reenen, J., 1999. Market share, market value and innovation in a panel of British manufacturing firms. The review of economic studies 66 (3), 529–554.
- Boldrin and Levine (2008) Boldrin, M., Levine, D. K., 2008. Against intellectual monopoly. Cambridge University Press Cambridge.
- Boldrin and Levine (2013) Boldrin, M., Levine, D. K., February 2013. The case against patents. Journal of Economic Perspectives 27 (1), 3–22.
- Branstetter et al. (2019) Branstetter, L. G., Glennon, B., Jensen, J. B., 2019. The it revolution and the globalization of r&d. Innovation Policy and the Economy 19, 1–37.
- Brynjolfsson and Hitt (2003) Brynjolfsson, E., Hitt, L. M., 2003. Computing productivity: Firm-level evidence. Review of economics and statistics 85 (4), 793–808.
- Bösenberg and Egger (2017) Bösenberg, S., Egger, P. H., 01 2017. R&D tax incentives and the emergence and trade of ideas. Economic Policy 32 (89), 39–80.
- Callaway and Sant’Anna (2021) Callaway, B., Sant’Anna, P. H., 2021. Difference-in-differences with multiple time periods. Journal of Econometrics 225 (2), 200–230.
- Cappelli et al. (2023) Cappelli, R., Corsino, M., Laursen, K., Torrisi, S., 2023. Technological competition and patent strategy: Protecting innovation, preempting rivals and defending the freedom to operate. Research Policy 52 (6), 104785.
- Chih-Yi and Bou-Wen (2021) Chih-Yi, S., Bou-Wen, L., 2021. Attack and defense in patent-based competition: A new paradigm of strategic decision-making in the era of the fourth industrial revolution. Technological Forecasting and Social Change 167, 120670.
- Cimoli et al. (2014) Cimoli, M., Dosi, G., Maskus, K. E., Okediji, R. L., Reichman, J. H., Stiglitz, J. E., 2014. Intellectual property rights: legal and economic challenges for development. Oxford University Press.
- Cockburn and MacGarvie (2011) Cockburn, I. M., MacGarvie, M. J., 2011. Entry and patenting in the software industry. Management Science 57 (5), 915–933.
- Cohen et al. (2000) Cohen, W. M., Nelson, R. R., Walsh, J. P., 2000. Protecting their intellectual assets: Appropriability conditions and why u.s. manufacturing firms patent (or not). Working Paper 7552, National Bureau of Economic Research.
- Comino et al. (2019) Comino, S., Manenti, F. M., Thumm, N., 2019. The role of patents in information and communication technologies: a survey of the literature. Journal of Economic Surveys 33 (2), 404–430.
- Cravino and Levchenko (2016) Cravino, J., Levchenko, A. A., 2016. Multinational Firms and International Business Cycle Transmission*. The Quarterly Journal of Economics 132 (2), 921–962.
- Crespi and Zuniga (2012) Crespi, G., Zuniga, P., 2012. Innovation and productivity: Evidence from six latin american countries. World Development 40 (2), 273–290.
- Danguy et al. (2014) Danguy, J., de Rassenfosse, G., van Pottelsberghe de la Potterie, B., 2014. On the origins of the worldwide surge in patenting: an industry perspective on the R&D–patent relationship. Industrial and Corporate Change 23 (2), 535–572.
- Davies et al. (2020) Davies, R. B., Kogler, D. F., Hynes, R., 2020. Patent boxes and the success rate of applications. CESifo Working Paper No. 8375.
- Del Prete and Rungi (2017) Del Prete, D., Rungi, A., 2017. Organizing the global value chain: A firm-level test. Journal of International Economics 109, 16–30.
- Dosi et al. (2006) Dosi, G., Marengo, L., Pasquali, C., 2006. How much should society fuel the greed of innovators?: On the relations between appropriability, opportunities and rates of innovation. Research Policy 35 (8), 1110–1121.
- Driffield et al. (2016) Driffield, N., Love, J. H., Yang, Y., 2016. Reverse international knowledge transfer in the MNE:(where) does affiliate performance boost parent performance? Research Policy 45 (2), 491–506.
- Eberhardt et al. (2016) Eberhardt, M., Helmers, C., Yu, Z., 2016. What can explain the Chinese patent explosion? Oxford Economic Papers 69 (1), 239–262.
- European Commission (2020) European Commission, 2020. Making the most of the eu’s innovative potential. an intellectual property action plan to support the eu’s recovery and resilience. Communication from the Commission to the European Parliament, the Council, the European Economic and Social Committee and the Committee of the Regions, available at: https://eur-lex.europa.eu/legal-content/EN/TXT/?uri=CELEX
- Farre-Mensa et al. (2020) Farre-Mensa, J., Hegde, D., Ljungqvist, A., 2020. What is a patent worth? evidence from the us patent “lottery”. The Journal of Finance 75 (2), 639–682.
- Fattorini et al. (2020) Fattorini, L., Ghodsi, M., Rungi, A., 2020. Cohesion policy meets heterogeneous firms. JCMS: Journal of Common Market Studies 58 (4), 803–817.
- Galasso and Schankerman (2010) Galasso, A., Schankerman, M., 2010. Patent thickets, courts, and the market for innovation. The RAND Journal of Economics 41 (3), 472–503.
- Gambardella et al. (2007) Gambardella, A., Giuri, P., Luzzi, A., 2007. The market for patents in europe. Research Policy 36 (8), 1163–1183.
- Gans and Stern (2010) Gans, J. S., Stern, S., 2010. Is there a market for ideas? Industrial and Corporate Change 19 (3), 805–837.
- Geroski and Pomroy (1990) Geroski, P. A., Pomroy, R., 1990. Innovation and the evolution of market structure. The journal of industrial economics, 299–314.
- Gopinath et al. (2017) Gopinath, G., Kalemli-Ozcan, S., Karabarbounis, L., Villegas-Sanchez, C., 2017. Capital Allocation and Productivity in South Europe. The Quarterly Journal of Economics 132 (4), 1915–1967.
- Graham and Vishnubhakat (2013) Graham, S., Vishnubhakat, S., 2013. Of smart phone wars and software patents. Journal of Economic Perspectives 27 (1), 67–86.
- Graham et al. (2009) Graham, S. J., Merges, R. P., Samuelson, P., Sichelman, T., 2009. High technology entrepreneurs and the patent system: Results of the 2008 berkeley patent survey. Berkeley Technology Law Journal 24 (4), 1255–1327.
- Griffith et al. (2006) Griffith, R., Huergo, E., Mairesse, J., Peters, B., 12 2006. Innovation and Productivity Across Four European Countries. Oxford Review of Economic Policy 22 (4), 483–498.
- Hall (2004) Hall, B. H., 2004. Exploring the patent explosion. The Journal of Technology Transfer 30 (1), 35–48.
- Hall et al. (2020) Hall, B. H., Graevenitz, G. v., Helmers, C., 2020. Technology entry in the presence of patent thickets. Oxford Economic Papers 73 (2), 903–926.
- Hall and Ziedonis (2001) Hall, B. H., Ziedonis, R. H., 2001. The patent paradox revisited: An empirical study of patenting in the u.s. semiconductor industry, 1979-1995. The RAND Journal of Economics 32 (1), 101–128.
- Haskel and Westlake (2018) Haskel, J., Westlake, S., 2018. Capitalism without Capital: The Rise of the Intangible Economy. Princeton University Press.
- Heller and Eisenberg (2000) Heller, M. A., Eisenberg, R. S., 2000. Can patents deter innovation? the anticommons in biomedical research. Science 280, 698–701.
- Henry and Stiglitz (2010) Henry, C., Stiglitz, J. E., 2010. Intellectual property, dissemination of innovation and sustainable development. Global Policy 1 (3), 237–251.
- Kalemli-Ozcan et al. (2015) Kalemli-Ozcan, S., Sorensen, B., Villegas-Sanchez, C., Volosovych, V., Yesiltas, S., 2015. How to construct nationally representative firm level data from the orbis global database. Tech. rep., National Bureau of Economic Research.
- Kline et al. (2019) Kline, P., Petkova, N., Williams, H., Zidar, O., 03 2019. Who Profits from Patents? Rent-Sharing at Innovative Firms*. The Quarterly Journal of Economics 134 (3), 1343–1404.
- Lerner and Tirole (2004) Lerner, J., Tirole, J., June 2004. Efficient patent pools. American Economic Review 94 (3), 691–711.
- Lerner and Tirole (2008) Lerner, J., Tirole, J., July 2008. Public Policy toward Patent Pools. In: Innovation Policy and the Economy, Volume 8. NBER Chapters. National Bureau of Economic Research, Inc, pp. 157–186.
- Lerner and Tirole (2015) Lerner, J., Tirole, J., 2015. Standard-essential patents. Journal of Political Economy 123 (3), 547–586.
- Machlup (1958) Machlup, F., 1958. An economic review of the patent system. Tech. rep., U.S. Government Printing Office, Washington D.C., 85th Congress.
- Mairesse and Robin (2009) Mairesse, J., Robin, S., 2009. Innovation and productivity: a firm-level analysis for french manufacturing and services using CIS3 and CIS4 data (1998-2000 and 2002-2004). Paris: CREST-ENSAE.
- Mohnen and Hall (2013) Mohnen, P., Hall, B. H., 2013. Innovation and productivity: An update. Eurasian Business Review 3 (1), 47–65.
- Moser (2013) Moser, P., February 2013. Patents and innovation: Evidence from economic history. Journal of Economic Perspectives 27 (1), 23–44.
- Nambisan et al. (2019) Nambisan, S., Wright, M., Feldman, M., 2019. The digital transformation of innovation and entrepreneurship: Progress, challenges and key themes. Research Policy 48 (8), 103773.
- Noailly and Smeets (2015) Noailly, J., Smeets, R., 2015. Directing technical change from fossil-fuel to renewable energy innovation: An application using firm-level patent data. Journal of Environmental Economics and Management 72, 15–37.
- Noel and Schankerman (2013) Noel, M., Schankerman, M., 2013. Strategic patenting and software innovation. The Journal of Industrial Economics 61 (3), 481–520.
- Petit et al. (2023) Petit, E., van Pottelsberghe de la Potterie, B., Gimeno-Fabra, L., 2023. Are patent offices substitutes? Research Policy 52 (8), 104823.
- Rungi et al. (2023) Rungi, A., Fattorini, L., Huremović, K., 2023. Measuring the input rank in global supply networks. The World Economy forthcomin (n/a).
- Sant’Anna and Zhao (2020) Sant’Anna, P. H., Zhao, J., 2020. Doubly robust difference-in-differences estimators. Journal of Econometrics 219 (1), 101–122.
- Shaked and Sutton (1983) Shaked, A., Sutton, J., 1983. Natural oligopolies. Econometrica 51 (5), 1469–1483.
- Shaked and Sutton (1987) Shaked, A., Sutton, J., 1987. Product differentiation and industrial structure. The Journal of Industrial Economics 36 (2), 131–146.
- Shapiro (2000) Shapiro, C., 2000. Navigating the patent thicket: Cross licenses, patent pools, and standard setting. Innovation Policy and the Economy 1, 119–150.
- Skeie et al. (2017) Skeie, Ø. B., Johansson, Å., Menon, C., Sorbe, S., 2017. Innovation, patent location and tax planning by multinationals. OECD Economics Department Working Papers (1360).
- Stiglitz (2007) Stiglitz, J. E., 2007. Economic foundations of intellectual property rights. Duke LJ 57, 1693.
- Sutton (1986) Sutton, J., 1986. Vertical product differentiation: Some basic themes. The American Economic Review 76 (2), 393–398.
- Sutton (1991) Sutton, J., 1991. “Sunk Costs and Market Structure: Price Competition, Advertising, and the Evolution of Concentration”. MIT Press, Cambridge MA.
- Sutton (1998) Sutton, J., 1998. “Technology and Market Structure. Theory and History”. MIT Press, Cambridge MA.
- Swanson and Baumol (2004) Swanson, D. G., Baumol, W. J., 2004. ntitrust for patent pools: A century of policy evolution. Antitrust Law Journal 3, 1–49.
- Swanson and Baumol (2005) Swanson, D. G., Baumol, W. J., 2005. Reasonable and nondiscriminatory (rand) royalties, standards selection, and control of market power. Antitrust Law Journal 73 (1), 1–58.
- van Gompel (2019) van Gompel, S., 2019. Patent abolition: A real-life historical case study. American University International Law Review 34, 877–922.
- Venturini (2022) Venturini, F., 2022. Intelligent technologies and productivity spillovers: Evidence from the fourth industrial revolution. Journal of Economic Behavior and Organization 194, 220–243.
- von Graevenitz et al. (2013) von Graevenitz, G., Wagner, S., Harhoff, D., 2013. Incidence and growth of patent thickets: The impact of technological opportunities and complexity. The Journal of Industrial Economics 61 (3), 521–563.
- Ziedonis (2008) Ziedonis, R. H., 2008. On the apparent failure of patents: A response to bessen and meurer. Academy of Management Perspectives 22 (4), 21–29.
Appendix: Tables and Graphs
| Research stream | Contribution(s) | Issues |
| ICT surge | |Hall (2004), Danguy et al. (2014), Eberhardt et al. (2016), Branstetter et al. (2019), Venturini (2022) | The ICT industry is responsible for an increasing share of patents. In particular, software products and intelligent technologies are relevant for implementing Industry 4.0 revolution, and China emerges as a key player. |
| Changing strategies in IPRs | Cohen et al. (2000), Hall and Ziedonis (2001), Cockburn and MacGarvie (2011), Graham et al. (2009), Chih-Yi and Bou-Wen (2021), Cappelli et al. (2023) | Patents are increasingly used as firms’ strategic tools against potential entrants, in licensing and litigation; relatively less for direct IPR protection. |
| IPR Fragmentation and patent thickets | Heller and Eisenberg (2000), Shapiro (2000), Galasso and Schankerman (2010), von Graevenitz et al. (2013), Noel and Schankerman (2013); Hall et al. (2020) | Proliferation of patent filings also a consequence of the fragmentation of intellectual property rights, which gives rise to so-called patent thickets, i.e., patents belonging to many companies protecting overlapping technology. |
| Emergence of a market for patents and different institutional arrangements | Lerner and Tirole (2004), Swanson and Baumol (2004), Swanson and Baumol (2005) Lerner and Tirole (2008), Gans and Stern (2010), Arora and Gambardella (2010), Baron et al. (2014), Lerner and Tirole (2015), Blind et al. (2017), Blind et al. (2023) | A market for patents is imperfect because of the appropriability problem: different institutional arrangements emerge including Patent Pools, Standard Setting Organizations, Standard-Essential Patents, Fair Reasonable and Nondiscriminatory Licensing (FRAND), Patent Assertion Entities, Patent Intermediaries. |
-
•
Note: The table reports a few references for understanding the evolution of Intellectual Property Rights in complex technologies, with special attention to the Information and Communication industry.
| Austria | France | Lithuania | Slovenia |
| Belgium | Germany | Luxembourg | South Korea |
| Brazil | Greece | Malta | Spain |
| Bulgaria | Hungary | Netherlands | Sweden |
| Canada | India | Norway | Switzerland |
| China | Ireland | Poland | Taiwan |
| Croatia | Israel | Portugal | Turkey |
| Czech Republic | Italy | Romania | United Kingdom |
| Denmark | Japan | Russia | United States |
| Finland | Latvia | Slovakia |
-
•
Note: The table reports the geographic coverage of the firm-level sample for which financial information is available.
| NACE Rev. 2 | Description | |
| 26.1 | Manufacture of electronic components and boards | |
| 26.2 | Manufacture of computers and peripheral equipment | ICT manufacturing |
| 26.3 | Manufacture of communication equipment | |
| 26.4 | Manufacture of consumer electronics | |
| 58.2 | Software publishing | |
| 61 | Telecommunications | |
| 62 | Computer programming, consultancy and related activities | ICT services |
| 63.1 | Data processing, hosting and related activities; web portals | |
| 95.1 | Repair of computers and communication equipment |
-
•
Note: The table reports the NACE rev. 2 industries included in the sample and belonging to the ICT perimeter.
| Variable | Coeff. | s. e, | N. obs. |
| Market share | .043*** | (.006) | 931,613 |
| Labor productivity | .043*** | (.006) | 931,613 |
| Firm size | .083*** | (.007) | 931,613 |
| Capital intensity | .068*** | (.006) | 931,613 |
| ROCE (levels) | 2.961 | (3.080) | 884,051 |
-
•
Note: Each coefficient results from a least-square regression of the (log) firm-level outcomes (by row) vis á vis the number of patents granted each year. We scale the number of patents by using the hyperbolic sine transformation (), which allows approximating to the natural logarithm while retaining the zeros (Bellemare and Wichman, 2020). Firm-level controls, firm-level fixed effects, and country-year fixed effects are included. Standard errors are clustered at the firm level. *** stands for .
| Year | (1) | |
| (2) | ||
| Treated companies (robustness) | ||
| 2010 | 64 | 65 |
| 2011 | 70 | 70 |
| 2012 | 52 | 56 |
| 2013 | 44 | 46 |
| 2014 | 57 | 66 |
| 2015 | 49 | 52 |
| 2016 | 49 | 54 |
| 2017 | 47 | 45 |
| Total | 432 | 454 |
-
•
Note: Column (1) counts companies granted patents in 2010-2017, i.e., belonging to the treatment group. Column (2) counts companies granted patents at the headquarters or subsidiary level from 2010-2017. Please note that we cannot consider treated companies granted patents in 2009 and 2018, the first and last years for which we have firms in the sample, because we need at least one period before and one after the treatment.
| Variable | Coeff. | s. e. | N. obs. |
| Market share | .040*** | (.005) | 931,613 |
| Labor productivity | .040*** | (.005) | 931,613 |
| Firm size | .079*** | (.007) | 931,613 |
| Capital intensity | .070*** | (.006) | 931,613 |
| ROCE | -.003** | (.001) | 884,051 |
-
•
Note: Each coefficient is the result of a least-square regression of the (log) firm-level outcome (by row) vis á vis the sum of patents granted each year in the company and their subsidiaries standardized with the inverse of an inverse hyperbolic sine transformation () to approximate the natural logarithm while retaining zeros, as suggested by (Bellemare and Wichman, 2020). Firm-level controls, firm-level fixed effects, and country-year fixed effects are included. Firm-level clustered standard errors are reported.
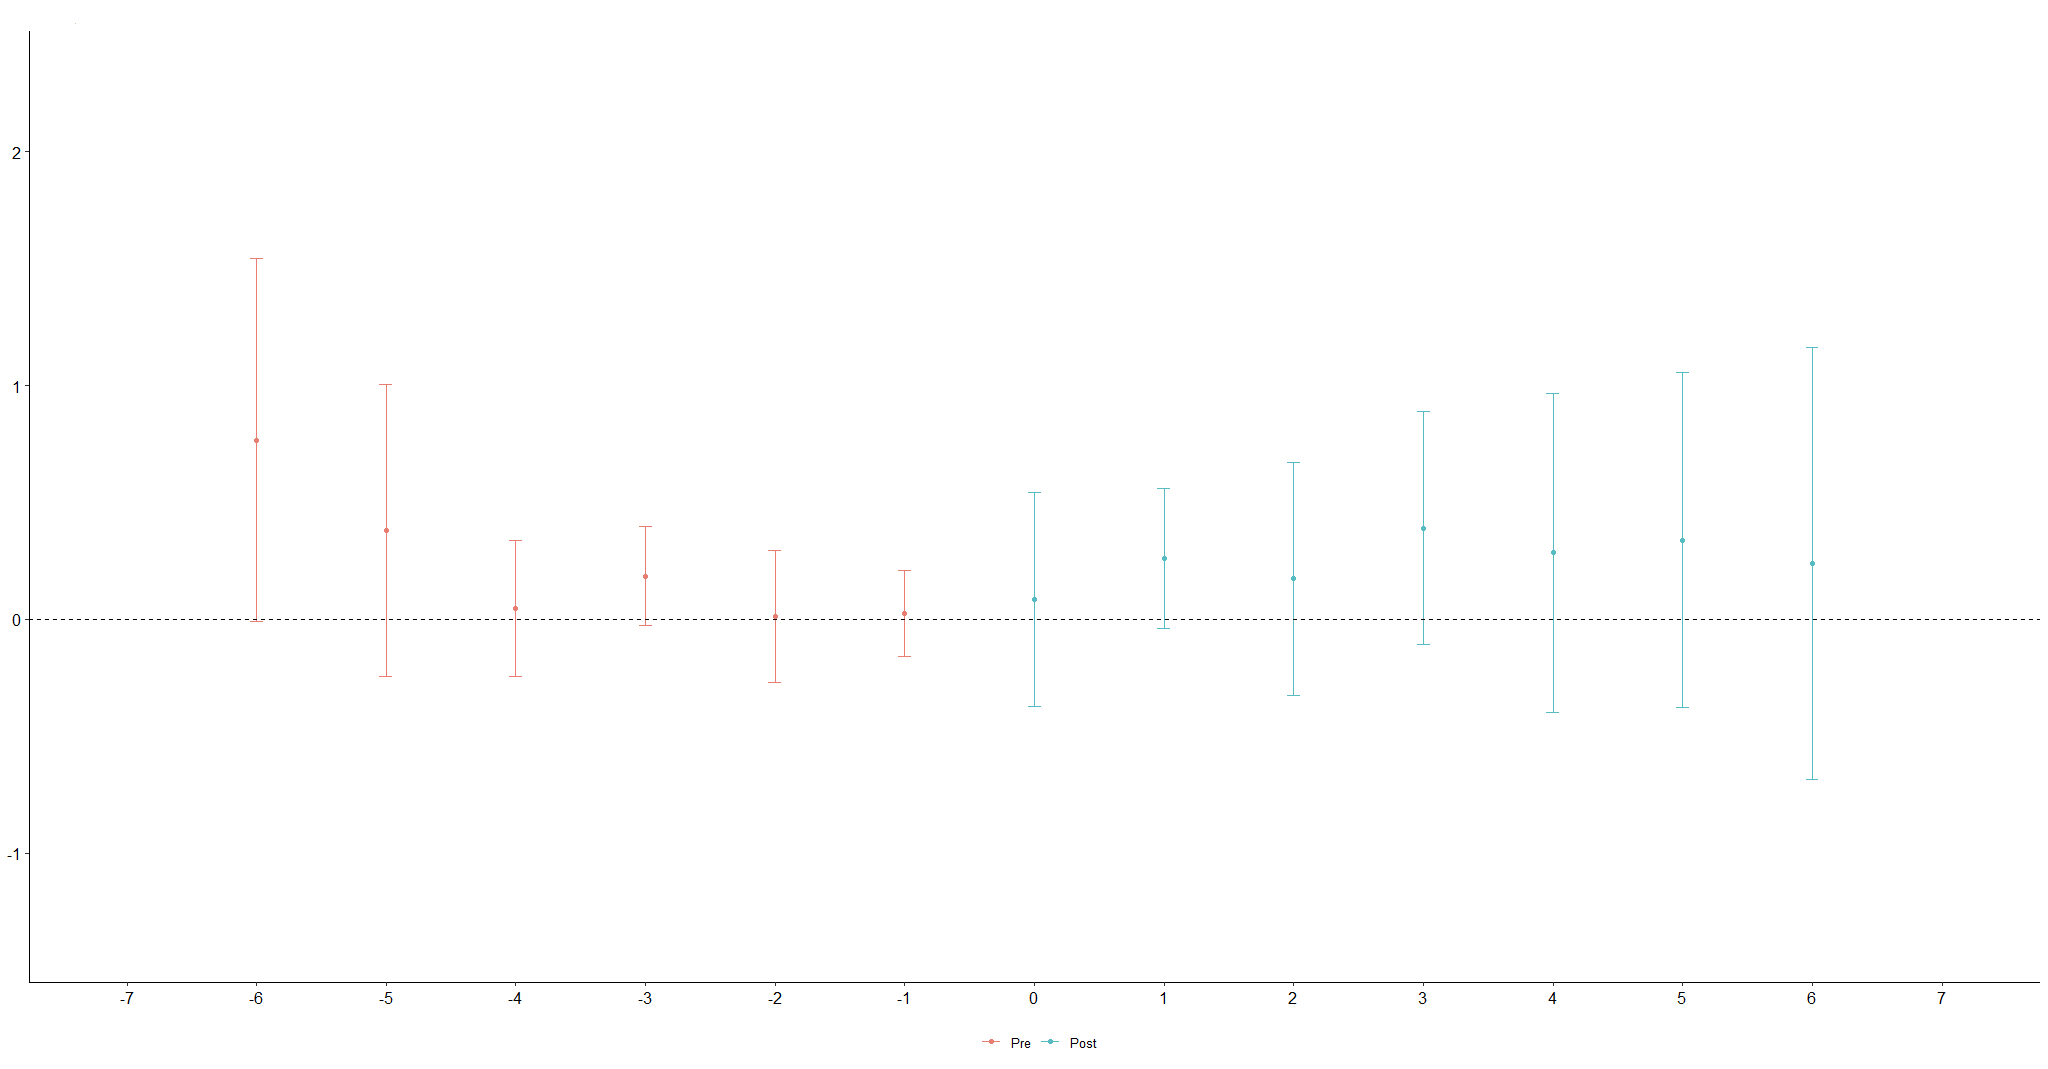
-
•
Note: Event study on market shares after patent grants following the approach by Callaway and Sant’Anna (2021). Smaller firms are below the median at the beginning of the period. Parameters are estimated under parallel trend assumptions conditional on the number of employees, capital intensity, age (in logs), 4-digit sector and regional dummies. Blue lines denote point estimates and simultaneous 99% confidence bands for the effect of the treatment.
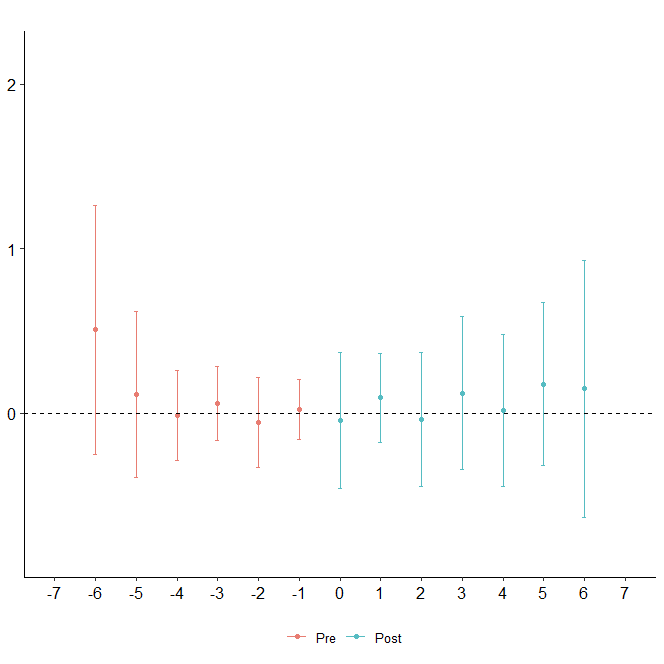
-
•
Note: Event study on labor productivity measured as value added per employee after patent grants following the approach by Callaway and Sant’Anna (2021). Smaller firms are below the median at the beginning of the period. Parameters are estimated under parallel trend assumptions conditional on the number of employees, capital intensity, age (in logs), 4-digit sector and regional dummies. Blue lines denote point estimates and simultaneous 99% confidence bands for the effect of the treatment.
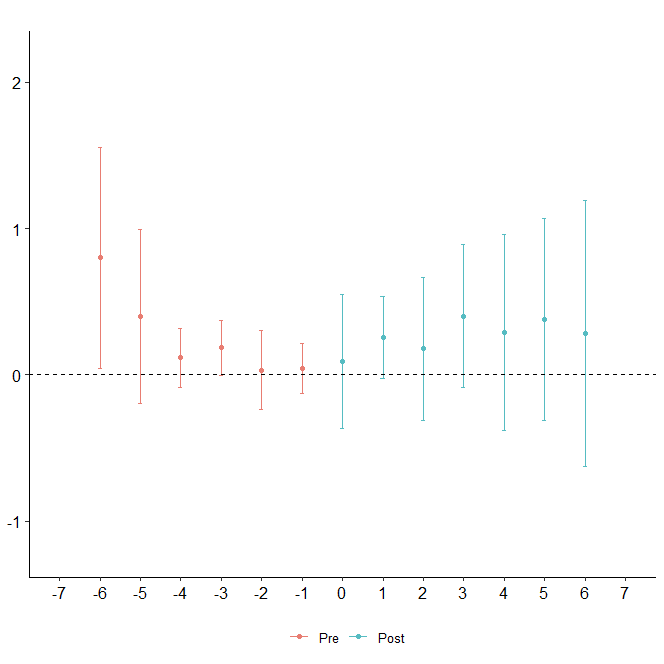
-
•
Note: Event study on firm size measured as log of revenues after patent grants following the approach by Callaway and Sant’Anna (2021). Smaller firms are below the median at the beginning of the period. Parameters are estimated under parallel trend assumptions conditional on the number of employees, capital intensity, age (in logs), 4-digit sector and regional dummies. Blue lines denote point estimates and simultaneous 99% confidence bands for the effect of the treatment.
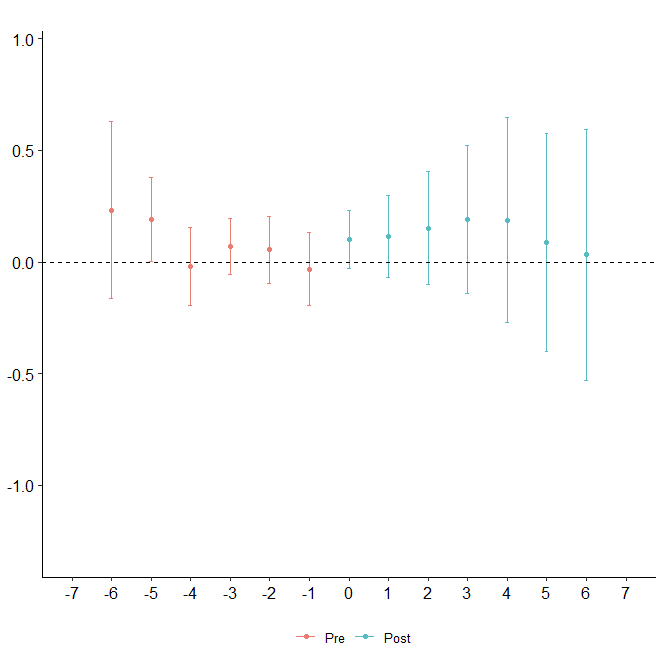
-
•
Note: Event study on the log of the number of employees after patent grants following the approach by Callaway and Sant’Anna (2021). Smaller firms are the ones below the median at the beginning of the period. Parameters are estimated under parallel trend assumptions conditional on capital intensity, age (in logs), 4-digit sector and regional dummies. Blue lines denote point estimates and simultaneous 99% confidence bands for the effect of the treatment.
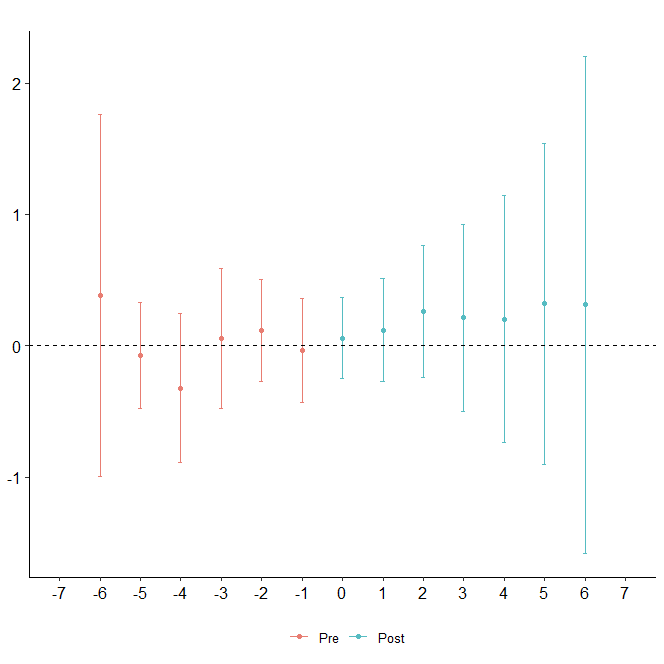
-
•
Note: Event study on capital intensity after patent grants following the approach by Callaway and Sant’Anna (2021). Smaller firms are below the median at the beginning of the period. Parameters are estimated under parallel trend assumptions conditional on the number of employees, age (in logs), 4-digit sector and regional dummies. Blue lines denote point estimates and simultaneous 99% confidence bands for the effect of the treatment.
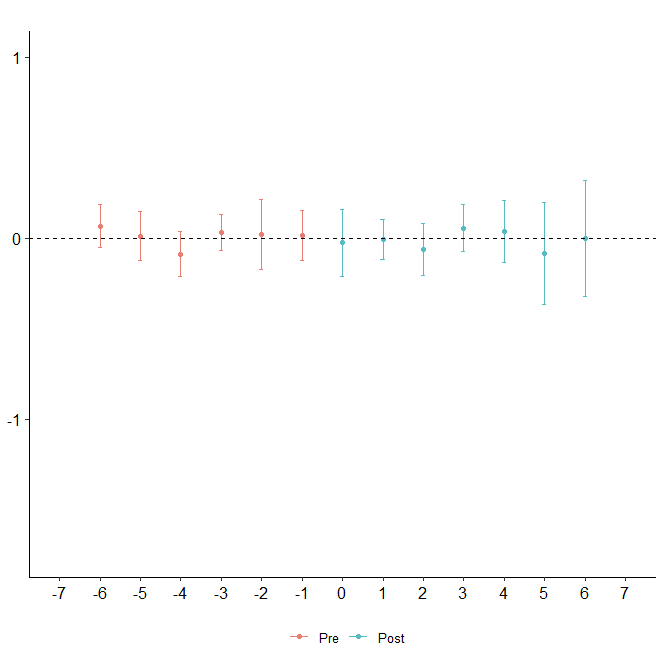
-
•
Note: Event study on profits (ROCE) after patent grants following the approach by Callaway and Sant’Anna (2021). Smaller firms are below the median at the beginning of the period. Parameters are estimated under parallel trend assumptions conditional on the number of employees, capital intensity, age (in logs), 4-digit sector and regional dummies. Blue lines denote point estimates and simultaneous 99% confidence bands for the effect of the treatment.
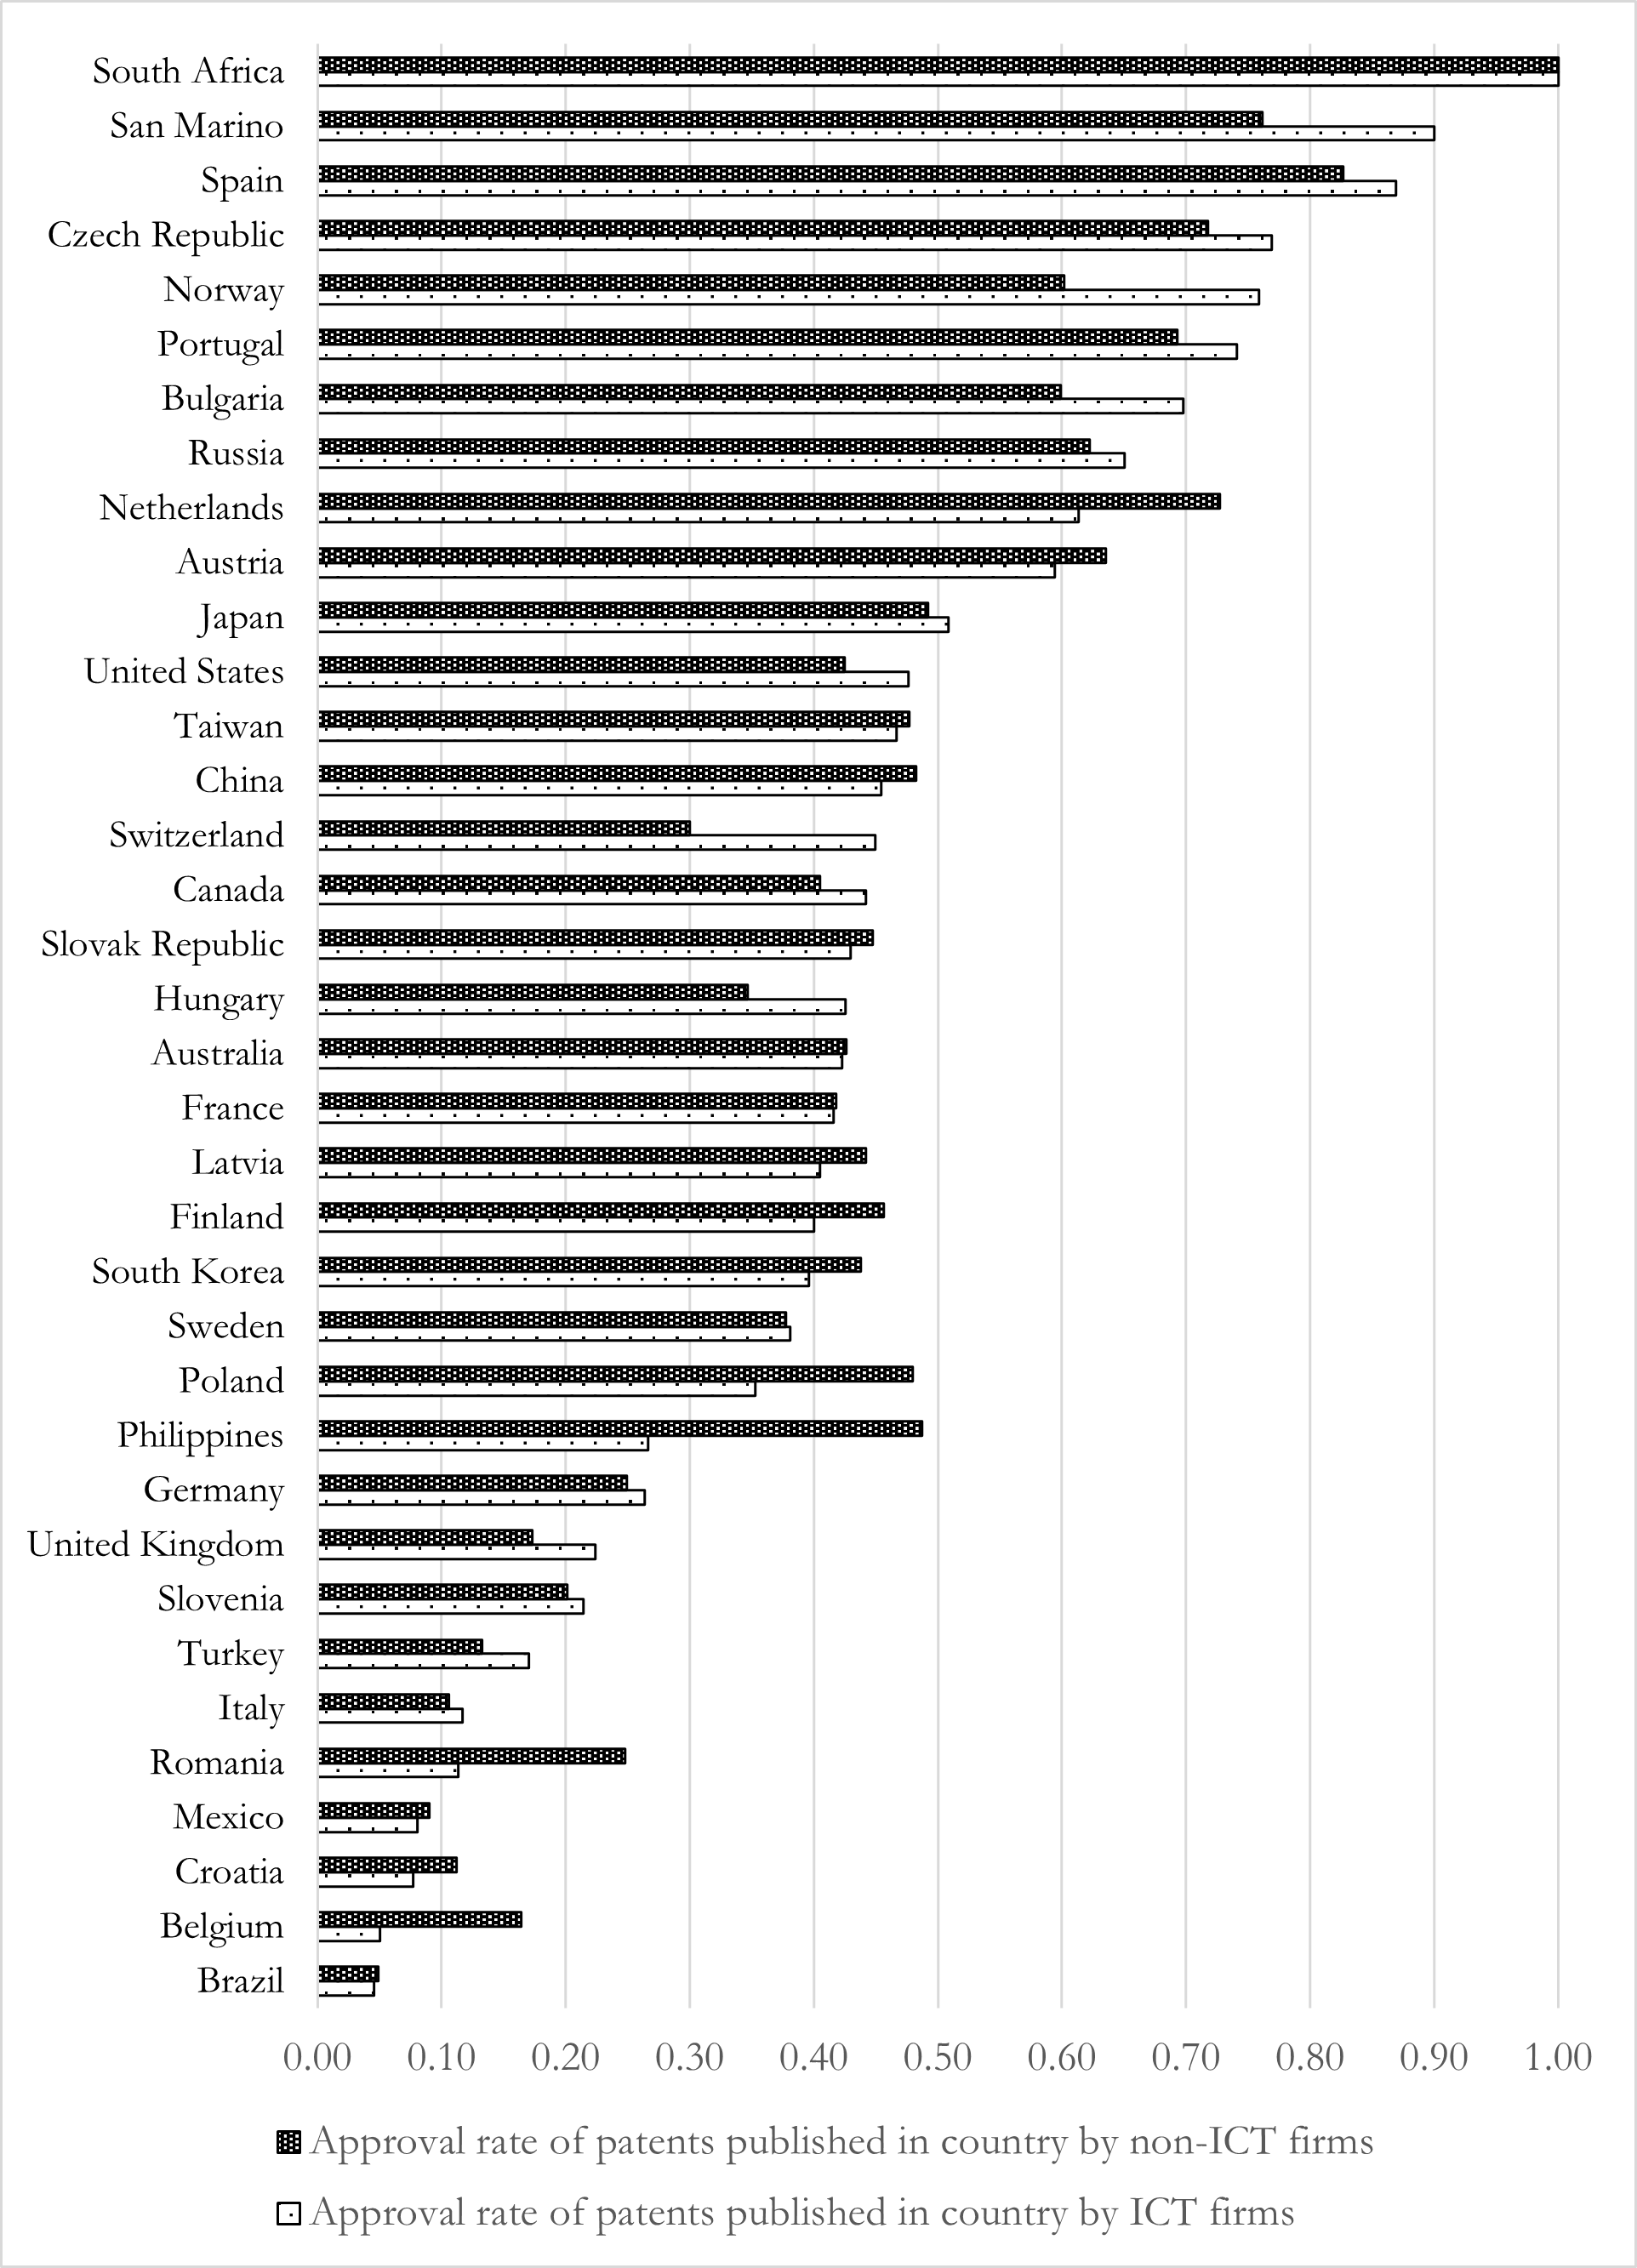
-
•
Note: The figure depicts propensities to grant patents for ICT inventions computed separately for ICT and non-ICT firms at the level of country patent offices. Patent offices with null propensities are excluded. We estimate a correlation between the approval rates of ICT and non-ICT firms.
| Variable | Coeff. | s. e. | No. of treated firms | No. of untreated firms |
| (log) Market share | 0.0701** | 0.0286 | 454 | 23,991 |
| (log) Labor productivity | 0.012 | 0.0205 | 454 | 23,991 |
| (log) Firm size (employees) | 0.0350 | 0.0244 | 454 | 23,991 |
| (log) Firm size (turnover) | 0.0711** | 0.0289 | 454 | 23,991 |
| (log) Capital intensity | 0.0734* | 0.0409 | 454 | 23,991 |
| ROCE (levels) | -0.0205 | 0.014 | 105 | 5,729 |
-
•
The table illustrates average aggregate treatment effects after following the doubly robust variant of the method by Callaway and Sant’Anna (2021), in the presence of a panel setting, under the assumption of parallel trends conditional on firm-level control variables, 4-digit sector and regional dummies. The treatment group consists of firms with patents granted either at the headquarter or in subsidiaries. Firms are matched using inverse probability weights. Errors are clustered at the firm level. *, ** and *** denotes significance at 10%, 5% and 1% respectively.
| Dependent variable: (log of) Market share | |||||
| (t) | (t+1) | (t+2) | (t+3) | (t+4) | |
| 0.21** | 0.24 | 0.26 | 0.23 | 0.25 | |
| (0.095) | (0.13) | (0.14) | (0.15) | (0.21) | |
| (log of) Firm size | 1.08*** | 1.09*** | 1.10*** | 1.09*** | 1.07*** |
| (0.0066) | (0.0079) | (0.0092) | (0.011) | (0.015) | |
| Firm size growth | -0.24*** | -0.21*** | -0.23*** | -0.14** | -0.10 |
| (0.040) | (0.046) | (0.046) | (0.063) | (0.072) | |
| (log of) Capital intensity | 0.22*** | 0.23*** | 0.22*** | 0.18*** | 0.15*** |
| (0.0095) | (0.011) | (0.012) | (0.015) | (0.019) | |
| Capital intensity growth | -0.066* | -0.100*** | 0.018 | 0.12*** | 0.11** |
| (0.035) | (0.025) | (0.037) | (0.041) | (0.046) | |
| (log of) Firm age | -0.0017*** | -0.0019*** | -0.0030*** | -0.0029*** | -0.0028*** |
| (0.00045) | (0.00047) | (0.00052) | (0.00063) | (0.00079) | |
| Dependent variable: | |||||
| (t) | (t+1) | (t+2) | (t+3) | (t+4) | |
| Approval rate non-ICT | 0.60*** | 0.64*** | 0.61*** | 0.60*** | 0.54*** |
| (0.021) | (0.027) | (0.031) | (0.036) | (0.044) | |
| Total applications non-ICT | -0.027*** | -0.031*** | -0.039*** | -0.042*** | -0.039*** |
| (0.0032) | (0.0036) | (0.0039) | (0.0046) | (0.0060) | |
| (log of) Firm size | -0.013*** | -0.010*** | -0.0080** | -0.0022 | -0.00031 |
| (0.0027) | (0.0029) | (0.0032) | (0.0038) | (0.0049) | |
| Firm size growth | 0.041*** | 0.059*** | 0.032* | 0.016 | -0.073*** |
| (0.010) | (0.016) | (0.017) | (0.025) | (0.024) | |
| (log of) Capital intensity | -0.0046 | -0.0069** | -0.0029 | -0.0078** | -0.015*** |
| (0.0030) | (0.0033) | (0.0034) | (0.0038) | (0.0047) | |
| Capital intensity growth | 0.0046 | 0.023** | -0.014 | 0.0100 | -0.0041 |
| (0.0076) | (0.010) | (0.013) | (0.017) | (0.016) | |
| (log of) Firm age | 0.00020 | 0.00023 | 0.00037* | 0.00033 | 0.00011 |
| (0.00021) | (0.00020) | (0.00021) | (0.00022) | (0.00026) | |
| No. obs, | 8058 | 6000 | 4445 | 3258 | 2330 |
| R-squared | 0.799 | 0.838 | 0.839 | 0.747 | 0.713 |
| Adjusted R-squared | 0.745 | 0.784 | 0.779 | 0.624 | 0.567 |
| AIC | 752.9 | 521.9 | 393.3 | 218.4 | 189.3 |
| Hansen J test | 11.5 | 0.19 | 0.011 | 9.31 | 5.92 |
| LM test statistic | 610.8 | 428.3 | 324.5 | 237.9 | 185.1 |
-
•
Note: The table illustrates the impact of a patent grant on firm-level market shares (outcome equation) after an IV approach that controls (first stage) the endogenous role of innovation contents after exogenous variation on assignees in non-ICT industries that innovate in the same technologies and the same year of ICT firms. At the bottom of the table, we report the standard Sargan-Hansen tests and Kleinbergen-Paap LM statistics for overidentification. Estimates are obtained after an optimal GMM estimation with robust standard errors in parentheses. ∗p0.1; ∗∗p0.05; ∗∗∗p0.01.
| Dependent variable: (log of) Market share | |||||
| (t) | (t+1) | (t+2) | (t+3) | (t+4) | |
| 0.17*** | -0.19 | 0.27 | 0.091 | 0.17 | |
| (0.06) | (0.20) | (0.24) | (0.22) | (0.21) | |
| (log of) Firm size | 1.03*** | 1.04*** | 1.06*** | 1.05*** | 0.98*** |
| (0.031) | (0.039) | (0.041) | (0.069) | (0.076) | |
| Firm growth | -0.40*** | 0.060 | -0.68*** | -0.21 | 0.041 |
| (0.15) | (0.21) | (0.18) | (0.16) | (0.27) | |
| (log of) Capital intensity | 0.12*** | 0.099*** | 0.0024 | -0.076 | -0.073 |
| (0.030) | (0.031) | (0.036) | (0.049) | (0.060) | |
| Capital intensity growth | -0.013 | -0.064 | 0.095 | -0.0099 | 0.0079 |
| (0.033) | (0.048) | (0.063) | (0.068) | (0.091) | |
| Firm age | -0.0088* | -0.0028 | -0.0040 | -0.014*** | -0.018*** |
| (0.0050) | (0.0049) | (0.0045) | (0.0051) | (0.0061) | |
| Dependent variable: | |||||
| (t) | (t+1) | (t+2) | (t+3) | (t+4) | |
| Approval rate non-ICT firms | 0.46*** | 0.40*** | 0.39*** | 0.44*** | 0.51*** |
| (0.078) | (0.10) | (0.12) | (0.15) | (0.18) | |
| Total applications non-ICT firms | -0.022** | -0.030*** | -0.037*** | -0.028 | -0.038** |
| (0.0093) | (0.011) | (0.014) | (0.018) | (0.019) | |
| (log of) firm size | -0.011 | -0.0086 | -0.021 | -0.075* | -0.061 |
| (0.023) | (0.026) | (0.027) | (0.044) | (0.054) | |
| Firm growth | -0.041 | -0.038 | 0.011 | -0.11 | -0.14 |
| (0.069) | (0.087) | (0.084) | (0.11) | (0.26) | |
| (log of) Capital intensity | -0.0071 | -0.014 | -0.021 | 0.0016 | 0.0015 |
| (0.021) | (0.024) | (0.025) | (0.036) | (0.038) | |
| Capital intensity growth | -0.042 | -0.037 | 0.022 | 0.089* | -0.093 |
| (0.030) | (0.032) | (0.049) | (0.053) | (0.061) | |
| Firm age | -0.0011 | 0.00054 | 0.0012 | 0.0045 | -0.00086 |
| (0.0029) | (0.0033) | (0.0036) | (0.0052) | (0.0050) | |
| N. obs. | 681 | 521 | 372 | 252 | 199 |
| R-squared | 0.799 | 0.838 | 0.839 | 0.747 | 0.713 |
| Adjusted R-squared | 0.745 | 0.784 | 0.779 | 0.624 | 0.567 |
| AIC | 752.9 | 521.9 | 393.3 | 218.4 | 189.3 |
| Hansen’s J test | 2.13 | 0.86 | 2.01 | 0.36 | 0.36 |
| LM test statistic | 45.5 | 30.5 | 28.1 | 22.4 | 19.8 |
-
•
Note: The table illustrates the impact of a patent grant on firm-level market shares (outcome equation) after an IV approach that controls (first stage) the endogenous role of innovation contents after exogenous variation on assignees in non-ICT industries that innovate in the same technologies and the same year of ICT firms. At the bottom of the table, we report the standard Sargan-Hansen tests and Kleinbergen-Paap LM statistics for overidentification. Estimates are obtained after an optimal GMM estimation with robust standard errors in parentheses. ∗p0.1; ∗∗p0.05; ∗∗∗p0.01.
| Dependent variable: (log of) Market share | |||||
| (t) | (t+1) | (t+2) | (t+3) | (t+4) | |
| 0.60*** | 0.61*** | 0.57*** | 0.56 | 0.31 | |
| (0.23) | (0.23) | (0.16) | (0.37) | (0.31) | |
| (log of) Firm size | 1.14*** | 1.17*** | 1.16*** | 1.12*** | 1.27*** |
| (0.027) | (0.035) | (0.042) | (0.041) | (0.042) | |
| Firm growth | -0.22*** | -0.28** | -0.25** | 0.024 | 0.16 |
| (0.053) | (0.11) | (0.10) | (0.11) | (0.14) | |
| (log of) Capital intensity | 0.20*** | 0.25*** | 0.28*** | 0.27*** | 0.28*** |
| (0.021) | (0.018) | (0.021) | (0.025) | (0.023) | |
| Capital intensity growth | 0.00063 | -0.040 | -0.023 | 0.17* | 0.26** |
| (0.043) | (0.061) | (0.079) | (0.095) | (0.10) | |
| Firm age | -0.0016 | -0.0047 | -0.00031 | -0.0062 | -0.024*** |
| (0.0035) | (0.0045) | (0.0056) | (0.0060) | (0.0056) | |
| Dependent variable: | |||||
| (t) | (t+1) | (t+2) | (t+3) | (t+4) | |
| Approval rate non-ICT firms | 0.81*** | 0.77*** | 0.73*** | 0.78*** | 0.91*** |
| (0.069) | (0.071) | (0.079) | (0.086) | (0.11) | |
| Total applications non-ICT firms | -0.035* | -0.059*** | -0.055** | -0.12*** | -0.28*** |
| (0.017) | (0.019) | (0.025) | (0.046) | (0.054) | |
| (log of) Firm size | -0.017 | -0.017 | -0.037*** | -0.0075 | -0.017 |
| (0.011) | (0.013) | (0.014) | (0.016) | (0.019) | |
| Firm growth | 0.030 | 0.035 | 0.11** | 0.088 | -0.084 |
| (0.028) | (0.034) | (0.046) | (0.062) | (0.078) | |
| (log of) Capital intensity | -0.0094 | -0.0075 | -0.014 | -0.015 | -0.021 |
| (0.012) | (0.012) | (0.012) | (0.013) | (0.013) | |
| Capital intensity growth | -0.0059 | 0.035 | 0.0050 | 0.018 | 0.023 |
| (0.022) | (0.027) | (0.036) | (0.048) | (0.051) | |
| Firm age | 0.0011 | -0.00012 | 0.0026 | 0.00062 | 0.0019 |
| (0.0018) | (0.0020) | (0.0022) | (0.0027) | (0.0033) | |
| N. obs. | 1496 | 1295 | 1046 | 859 | 626 |
| R-squared | 0.792 | 0.763 | 0.746 | 0.681 | 0.767 |
| Adjusted R-squared | 0.768 | 0.733 | 0.710 | 0.633 | 0.727 |
| AIC | 3534.8 | 3203.3 | 2602.4 | 2173.6 | 1393.7 |
| Hansen’s J test | 8.82 | 4.06 | 0.45 | 2.56 | 0.73 |
| LM test statistic | 91.6 | 80.0 | 61.8 | 64.6 | 64.6 |
-
•
Note: The table illustrates the impact of a patent grant on firm-level market shares (outcome equation) after an IV approach that controls (first stage) the endogenous role of innovation contents after exogenous variation on assignees in non-ICT industries that innovate in the same technologies and the same year of ICT firms. At the bottom of the table, we report the standard Sargan-Hansen tests and Kleinbergen-Paap LM statistics for overidentification. Estimates are obtained after an optimal GMM estimation with robust standard errors in parentheses. ∗p0.1; ∗∗p0.05; ∗∗∗p0.01.
| Dependent variable: (log of) Market share | |||||
| (t) | (t+1) | (t+2) | (t+3) | (t+4) | |
| 0.36** | 0.21 | 0.13 | -0.31 | 0.31 | |
| (0.14) | (0.14) | (0.18) | (0.21) | (0.23) | |
| (log of) Firm size | 1.01*** | 1.06*** | 1.11*** | 1.11*** | 1.15*** |
| (0.023) | (0.021) | (0.025) | (0.036) | (0.039) | |
| Firm growth | -0.42*** | -0.49*** | -0.47*** | -0.59*** | -0.29** |
| (0.072) | (0.093) | (0.11) | (0.14) | (0.12) | |
| (log of) Capital intensity | 0.12*** | 0.030 | 0.035 | 0.047* | 0.084** |
| (0.023) | (0.019) | (0.022) | (0.026) | (0.035) | |
| Capital intensity growth | -0.036 | -0.18*** | -0.042 | -0.040 | -0.15*** |
| (0.036) | (0.046) | (0.070) | (0.042) | (0.036) | |
| Firm age | 0.026*** | 0.019*** | 0.016*** | 0.011* | 0.00050 |
| (0.0030) | (0.0031) | (0.0038) | (0.0056) | (0.0056) | |
| Dependent variable: | |||||
| (t) | (t+1) | (t+2) | (t+3) | (t+4) | |
| Approval rate non-ICT | 0.56*** | 0.51*** | 0.32*** | 0.38*** | 0.44*** |
| (0.041) | (0.049) | (0.053) | (0.065) | (0.080) | |
| Total applications non-ICT | -0.031*** | -0.037*** | -0.051*** | -0.047*** | -0.039*** |
| (0.0051) | (0.0058) | (0.0059) | (0.0069) | (0.0096) | |
| (log of) Firm size | -0.0026 | -0.0085 | -0.0034 | -0.013 | 0.00052 |
| (0.0086) | (0.0089) | (0.0097) | (0.012) | (0.014) | |
| Firm growth | -0.022 | -0.069** | 0.026 | -0.050 | -0.029 |
| (0.019) | (0.027) | (0.040) | (0.048) | (0.052) | |
| (log of) Capital intensity | -0.012 | -0.013 | 0.000012 | 0.0016 | -0.0048 |
| (0.0073) | (0.0082) | (0.0089) | (0.010) | (0.016) | |
| Capital intensity growth | -0.021 | 0.0031 | -0.021 | -0.020 | 0.013 |
| (0.013) | (0.015) | (0.020) | (0.022) | (0.023) | |
| Firm age | 0.0019 | 0.0037** | 0.0022 | 0.0074*** | 0.0094*** |
| (0.0014) | (0.0016) | (0.0018) | (0.0021) | (0.0030) | |
| N. obs. | 2053 | 1611 | 1179 | 804 | 543 |
| R-squared | 0.712 | 0.793 | 0.802 | 0.786 | 0.812 |
| Adjusted R-squared | 0.675 | 0.761 | 0.766 | 0.737 | 0.761 |
| AIC | 5354.8 | 3709.3 | 2665.6 | 1725.3 | 1053.7 |
| Hansen’s J test | 10.5 | 15.5 | 2.75 | 2.62 | 0.28 |
| LM test statistic | 245.6 | 183.5 | 129.5 | 103.1 | 64.1 |
-
•
Note: The table illustrates the impact of a patent grant on firm-level market shares (outcome equation) after an IV approach that controls (first stage) the endogenous role of innovation contents after exogenous variation on assignees in non-ICT industries that innovate in the same technologies and the same year of ICT firms. At the bottom of the table, we report the standard Sargan-Hansen tests and Kleinbergen-Paap LM statistics for overidentification. Estimates are obtained after an optimal GMM estimation with robust standard errors in parentheses. ∗p0.1; ∗∗p0.05; ∗∗∗p0.01.