[a,b]Ellis R. Owen
The contribution of distant sources to the observed flux of ultra high-energy cosmic rays
Abstract
Ultra-high-energy (UHE) cosmic rays (CRs) interact with cosmic background radiation through hadronic processes, and the Universe would become ‘opaque’ to UHE CRs of energies (- ) eV over about several tens of Mpc, setting the Greisen-Zatsepin-Kuz’min (GZK) horizon. We demonstrate that a non-negligible fraction of the UHE CRs arriving on Earth could originate from beyond the GZK horizon when heavy nuclear CRs, and the population and evolution of UHE CR sources are taken into account. We show how the multi-particle CR horizon is modified by different source populations, and discuss how this leads to the natural emergence of an isotropic flux component in the observed UHE CR background. This component would coexist with an anisotropic foreground component contributed by nearby sources within the GZK horizon.
1 Introduction
The detection rate of ultra high-energy (UHE) cosmic ray (CR) events on Earth is about 1 particle per square km per century at , corresponding to a flux of [1]. Several origins of these particles have been proposed, where conditions exist to allow acceleration of particles to ultra-high energies over large scales or in strong magnetic fields [cf. the Hillas criterion, 2], such as in the relativistic jets of active galactic nuclei (AGN), neutron stars and in the large-scale shocks associated with galaxy clusters. However, their exact origins remain unsettled.
The low flux of UHE CRs is attributed both to the power-law nature of the intrinsic emission spectra from plausible sources [3], coupled with the attenuation of cosmologically propagating UHE particles with ambient radiation fields, leading to the development of a high-energy ‘ankle’ in the CR spectrum, i.e the Greisen-Zatsepin-Kuz’min (GZK) effect [4, 5]. The attenuation of UHE CRs is mainly caused by hadronic interactions with the cosmological microwave background (CMB) and, to a lesser extent, the infrared and optical components of the extra-galactic background light (EBL). The Universe becomes ‘optically thick’ to UHE CRs over distances of a few 10s Mpc (at energies of ), setting a GZK ‘horizon’. The extent of this horizon depends on the energy and nuclear mass of a CR particle. In general, more energetic particles are attenuated over shorter distances. CRs of higher atomic number would undergo erosive processes (e.g. photo-spallation), allowing their surviving descendant particles to continue propagating over a large distance.
The extent of the GZK ‘horizon’ is therefore not a sharp upper-limit on the distance over which UHE CRs are allowed propagate. It is instead a rough distance scale over which a substantial reduction of the CR flux attenuation would be expected. Thus, UHE CRs arriving on Earth (1) originate from either the nearby sources within this GZK horizon, and/or (2) are the residual attenuated flux from populations of sources distributed over cosmological distances. If sources are predominantly distant, and the detected UHE CRs on Earth comprises a substantial component of their residual attenuated flux contribution, an isotropic diffuse background of UHE CRs would be expected. Support for this has emerged in observational studies, with correlations between UHE CR arrival directions and possible local sources being strengthened if the UHE CR flux arriving on Earth is assumed to be comprised of a diffuse isotropic background component from distant source populations superposed with an anisotropic foreground flux originating from nearby cosmic accelerators [6, 7]. In this work [see also 8, for further details and discussion], we consider the emergence of such a background component arising from distant source populations. We investigate four possible source populations (adopting the fitted models of [9]), and show that the emerging UHE CR background can contribute a substantial fraction of the UHE CR flux arriving on Earth.
2 Interactions of CR nuclei in cosmological radiation fields
2.1 CR interactions
UHE CR nuclei propagating through intergalactic space predominantly interact with ambient radiation fields (1) via Beth-Heitler (BH) photo-pair production [10], which we model as a cooling process; (2) Photo-pion production [11], which we model as an absorption process, and (3) Photo-spallation [12], which we model as a disintegration process for nuclei with mass number . Other processes, such as radiative cooling and adiabatic cooling of the cosmologically-propagating particles also operate. In a black-body radiation field, the cooling rate due to BH pair-production for a CR of energy (where is the proton rest mass, and is the speed of light) is
| (1) |
where the dimensionless variable , is the dimensionless temperature ( is the Boltzmann constant, is the electron rest-mass) and the function takes the same form as that in [13]. is the dilution factor of the radiation field ( for the CMB), is the fine structure constant, is the Compton wavelength of an electron, and is the Thomson cross section. Radiative cooling is dominated by Compton scattering, and arises at a rate of
| (2) |
[12], where is the radiation energy density (at redshift ), , and is the nuclear charge.111In this work, we relate atomic mass to nuclear charge using the relation presented in [12]. Adiabatic losses experienced by UHE CR nuclei due to cosmological expansion occur at a rate of , for , where , and are the normalized density parameters for matter, radiation and dark energy respectively. The present value of the Hubble parameter , where [14].
If approximating the photo-pion interaction cross section as a delta function [15], the CR interaction rate in a black-body radiation field can be written as
| (3) |
where , , and . The corresponding particle absorption rate is then . The photo-disintegration rate takes a similar form, if again approximating the interaction cross section with a delta-function [16] and assuming single-nucleon emission:
| (4) |
Here, , , and for , and for [17]. Strictly, this is equivalent to the production rate of or nuclei due to the spallation of nucleus of mass number . The corresponding particle absorption (or secondary nuclear production) rate, if assuming single-nucleon emission in each photo-disintegration process, is given by . The total absorption rate for UHE CR nuclei is then given by , while the source term for secondary nuclei produced in photo-spallation follows as:
| (5) |
which proceeds while CR energies (including the secondary nuclei) have sufficient energy to continue to interact, thus forming an extended particle cascade along UHE CR propagation paths.
2.2 Cosmological radiation fields
| Component | |||
|---|---|---|---|
| CMB | |||
| EBL – Dust | | ||
| EBL – UV/O (1) | | ||
| EBL – UV/O (2) | | ||
| EBL – UV/O (3) | | ||
| EBL – UV/O (4) | | ||
| EBL – UV/O (5) | |
The CMB permeates the Universe and provides a strong target field to drive the interactions described in section 2.1. Additionally, the EBL can also act to attenuate more massive UHE CRs with energies slightly lower than those principally affected by the CMBs [18, 8]. The EBL is comprised of radiation emitted from astrophysical objects [for an overview, see 19]. Its energy is mainly concentrated in two spectral peaks – one at optical wavelengths, being broadly associated with stellar emission from within populations of galaxies, while the other is at infrared wavelengths, and is presumably dominated by dust-reprocessed astrophysical emission.
We model the CMB as a black-body radiation field, and adopt a simple analytic representation of the EBL, comprised of five superposed diluted black-body components, given by
| (6) |
where one component is attributed to dust (infrared) emission and the rest approximate the ultraviolet/optical (UV/O) emission in an analytically-tractable manner. The values for the dimensionless temperatures and weights are given in Table 1, where adopted values represent a maximum plausible EBL model to consider the greatest attenuating effect on our results. Here, the redshift weighting evolutionary function is given by
| (7) |
up to , where , which follows the ‘baseline’ EBL redshift evolution model of [18].
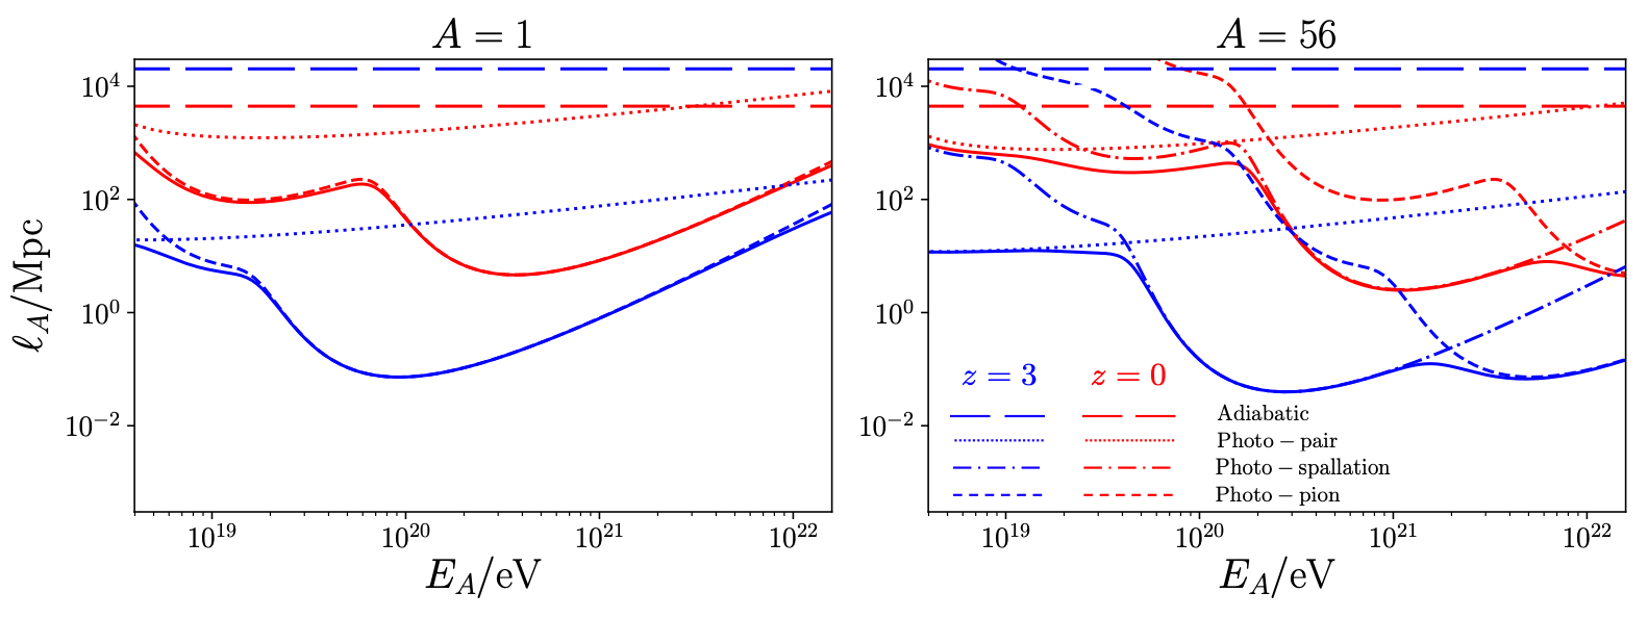
2.3 Nuclei path lengths
The relative importance of the cooling and interaction processes of UHE CRs described in section 2.1 in the EBL and CMB can be characterized in terms of an effective energy-loss path length, . This is the characteristic distance over which a CR nucleus of energy would lose its energy due to its interactions, and can be estimated from the CR cooling rate for a given process using . In the case of stochastic absorption processes, may be approximated as a cooling rate for the purposes of comparison, i.e. for pion-production, or as for photo-spallation.222Strictly, this is only appropriate for the purposes of rough comparison between different interactions. Absorption interactions are stochastic in nature, and are not truly continuous cooling processes. This would introduce statistical broadening to the absorption locations, which can change the mean path length by a factor of a few, and is particularly severe at high energies. This is properly accounted for in our later calculations. In Figure 1, we compare the effective loss lengths for UHE CR nuclei ( for protons and for 56Fe nuclei) in intergalactic conditions at both and . This shows that the more intense background radiation fields at compared to reduce photo-pion and photo-spallation path lengths, however adiabatic losses are noticeably weaker at due to the accelerated rate of cosmic expansion in the later Universe. Radiative losses are inconsequential in all cases.
3 CR source models
The UHE CR injection rate by source populations may be written as:
| (8) |
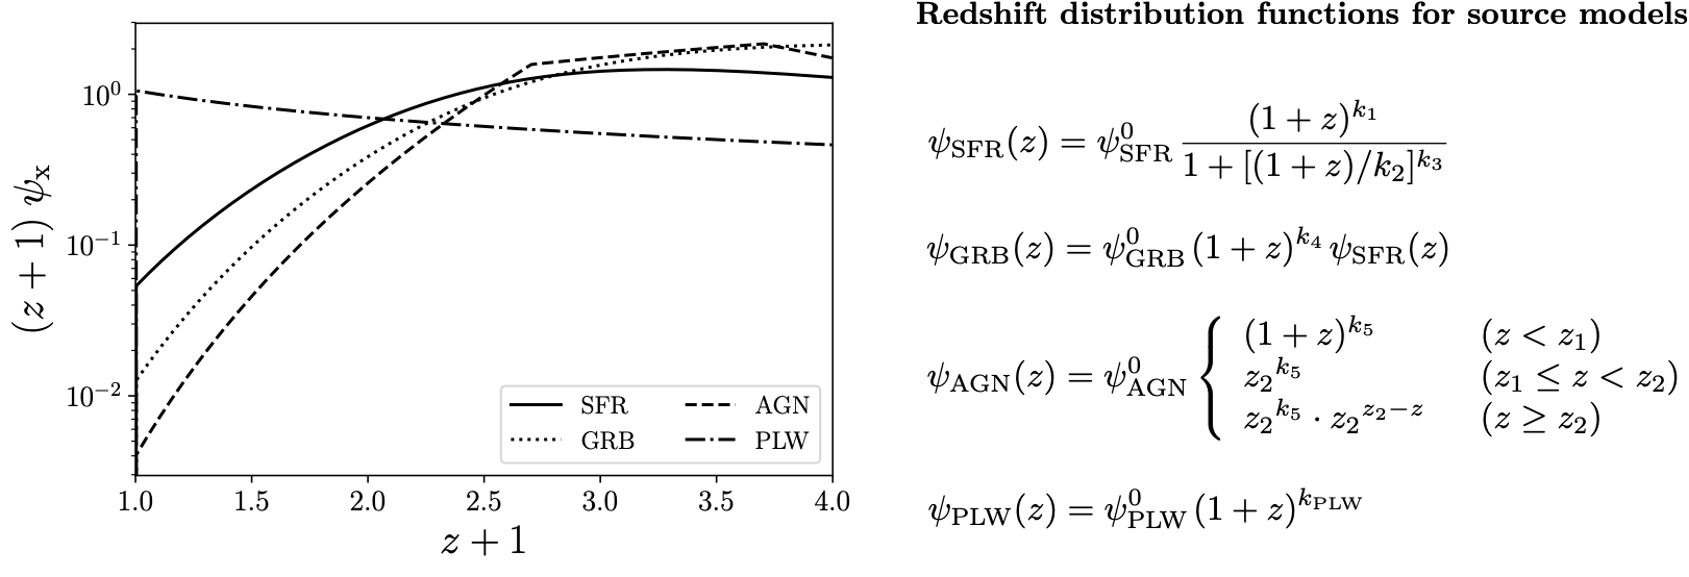
where and are the comoving and physical source terms, respectively. is the evolutionary function describing the distribution of a CR source population with respect to redshift , up to (the specific model is denoted by ). We consider four possible source models, as described in the annotation in Figure 2. The normalization is defined according to the UHE CR luminosity density,
| (9) |
which we treat as a model parameter, with values given by Table 2 for each considered source population. Here, is the volumetric spectral injection rate of CRs by a given source population, with a parametrised injection spectrum
| (12) |
[e.g. 9], where , is the rigidity, and the energy limits are and . The values of the spectral index and the rigidity are shown in Table 2. The spectral composition adopts fitted values obtained by [9], where the full range of injected species are represented by abundances of 1H, 4He, 14N, 28Si and 56Fe.
| Model | Normalization | Spectral index | / erg Mpc-3 yr-1 | |
|---|---|---|---|---|
| (1) SFR | 18.2 | 0.5 | ||
| (2) GRB | 18.2 | 2.0 | ||
| (3) AGN | 18.2 | 0.04 | ||
| (4) PLW | 18.7 | 15.0 |
4 Results
The CR spectrum, expected to be observed at , is computed by numerically solving the transport equation under a quasi-steady condition for each of the four source models:
| (13) |
The numerical integration proceeds from to . Here, , primary CR injection as well as secondary nuclear production arising from interactions was encoded into the source term, where , for , where is given by equation 8 and is given by equation 5.
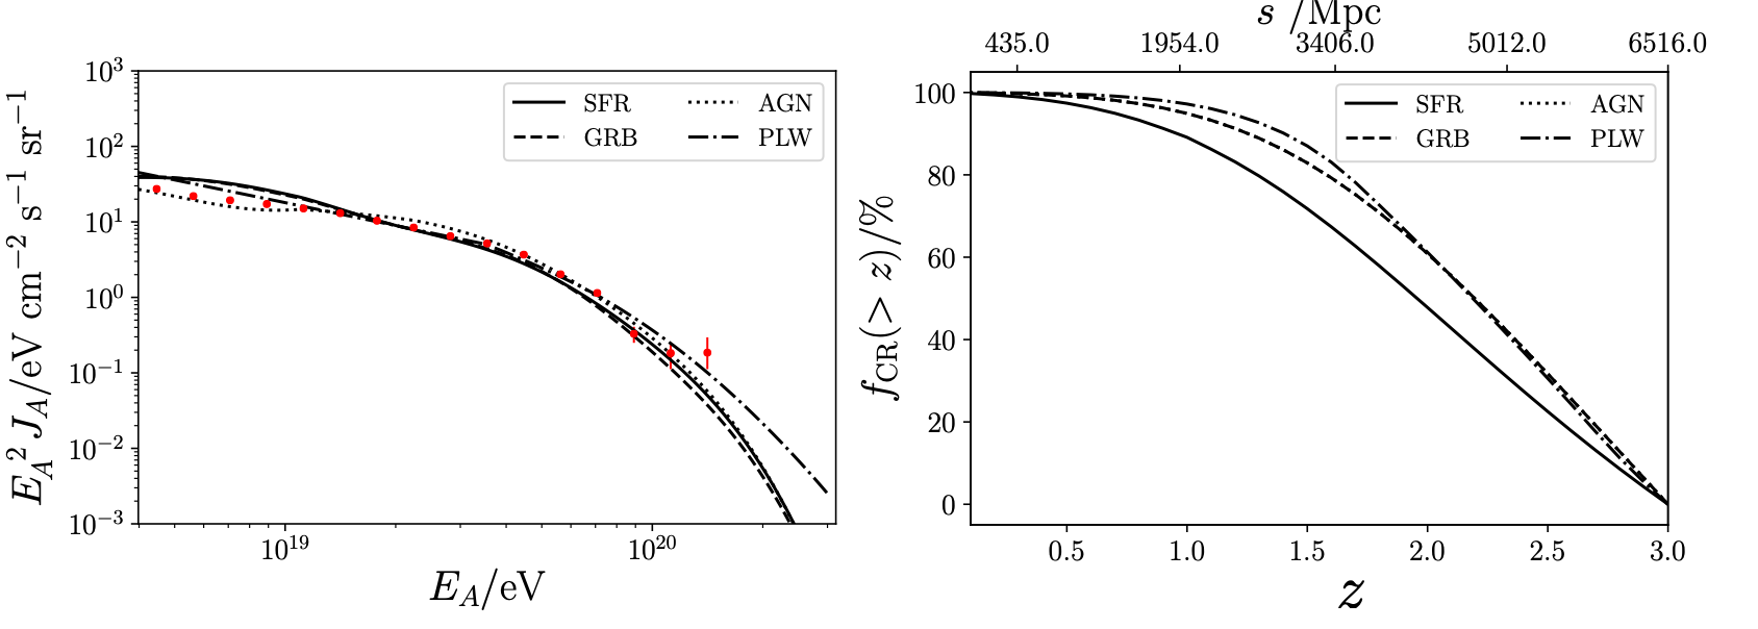
Figure 3 shows the UHE CR spectrum at in the case of the four source population models in the left panel. Data obtained by the Pierre Auger Observatory [20] are included for comparison (for more detailed comparisons with data, see [8]). In the right panel of Figure 3, the fractional contribution from sources above a given redshift, , for the four source models is shown. This shows, in all cases, a large faction of UHE CR flux observed at Earth can not be attributed to local sources, regardless of the uncertainties in existing models of the EBL at high redshift or CR composition. Moreover, the curves for the GRB and AGN models are practically indistinguishable. This is because the curve is a manifestation of where the redshift locations of the underlying source population make the most significant contribution to the UHE CR flux. The dominant redshift locations of the GRB and AGN CR sources are very similar to one another (see Figure 2) which, together with the small numbers of GRBs and AGN below leads to their almost identical curves.
5 Conclusions
Our calculations show that distant UHE CR sources at redshifts as high as contribute substantially to UHE CRs detected on Earth, naturally leading to the formation of a strong, isotropic background in the UHE CR flux. Moreover, we find that most of the UHE CRs from these distant sources are primary particles, despite the large cosmological distances they have traversed, with their spectra and composition at being almost indistinguishable from that injected by the source population, even when fully accounting for photo-spallation of nuclei along CR propagation paths. We find our results to be robust, and not strongly dependent on CR composition, source redshift distribution (if reasonable) or EBL intensity up to redshifts as high as .
Acknowledgments
ERO is supported by the Center for Informatics and Computation in Astronomy (CICA) at National Tsing Hua University (NTHU), funded by the Ministry of Education (MoE) of Taiwan. YXJY is supported by a NTHU International Student Scholarship, and by a grant from the Ministry of Science and Technology (MoST) of Taiwan, 109-2628-M-007-005-RSP. This work used high-performance computing facilities operated by CICA at NTHU, funded by MoE and MoST.
References
- [1] D. Ivanov, Report of the Telescope Array - Pierre Auger Observatory Working Group on Energy Spectrum, PoS ICRC2017 (2017) 498.
- [2] A.M. Hillas, The Origin of Ultra-High-Energy Cosmic Rays, ARA&A 22 (1984) 425.
- [3] E. Fermi, On the Origin of the Cosmic Radiation, Physical Review 75 (1949) 1169.
- [4] K. Greisen, End to the Cosmic-Ray Spectrum?, PhRvL 16 (1966) 748.
- [5] G.T. Zatsepin and V.A. Kuz’min, Upper Limit of the Spectrum of Cosmic Rays, Soviet Journal of Experimental and Theoretical Physics Letters 4 (1966) 78.
- [6] H.B. Kim and J. Kim, Statistical analysis of the correlation between active galactic nuclei and ultra-high energy cosmic rays, JCAP 2011 (2011) 006 [1009.2284].
- [7] Pierre Auger Collaboration, A. Aab et al., Observation of a large-scale anisotropy in the arrival directions of cosmic rays above 8 × 10¹⁸ eV, Science 357 (2017) 1266 [1709.07321].
- [8] E.R. Owen, Q. Han et al., Ultra high-energy cosmic rays from beyond the Greisen-Zatsepin-Kuz’min horizon, arXiv e-prints (2021) [2107.12607].
- [9] R. Alves Batista, R.M. de Almeida et al., Cosmogenic photon and neutrino fluxes in the Auger era, JCAP 2019 (2019) 002 [1806.10879].
- [10] H. Bethe and W. Heitler, On the stopping of fast particles and on the creation of positive electrons, Proc. R. Soc. A 146 (1934) 83.
- [11] V.S. Berezinsky and A.Z. Gazizov, Production of high-energy cosmic neutrinos in and scattering. I. Neutrino yields for power-law spectra of protons and neutrons, Phys. Rev. D 47 (1993) 4206.
- [12] J.L. Puget, F.W. Stecker et al., Photonuclear interactions of ultrahigh energy cosmic rays and their astrophysical consequences., ApJ 205 (1976) 638.
- [13] E.R. Owen, K. Wu et al., Starburst and post-starburst high-redshift protogalaxies. The feedback impact of high energy cosmic rays, A&A 626 (2019) A85 [1905.00338].
- [14] Planck Collaboration, N. Aghanim et al., Planck 2018 results. VI. Cosmological parameters, A&A 641 (2020) A6 [1807.06209].
- [15] M. Unger, G.R. Farrar et al., Origin of the ankle in the ultrahigh energy cosmic ray spectrum, and of the extragalactic protons below it, PhRvD 92 (2015) 123001 [1505.02153].
- [16] X.-Y. Wang, S. Razzaque et al., On the Origin and Survival of Ultra-High-Energy Cosmic-Ray Nuclei in Gamma-Ray Bursts and Hypernovae, ApJ 677 (2008) 432 [0711.2065].
- [17] S. Karakula and W. Tkaczyk, The formation of the cosmic ray energy spectrum by a photon field, Astroparticle Physics 1 (1993) 229.
- [18] R. Aloisio, V. Berezinsky et al., Analytic calculations of the spectra of ultra high energy cosmic ray nuclei. II. The general case of background radiation, Astroparticle Physics 41 (2013) 94 [1006.2484].
- [19] A. Cooray, Extragalactic background light measurements and applications, Royal Society Open Science 3 (2016) 150555 [1602.03512].
- [20] V. Verzi, Measurement of the energy spectrum of ultra-high energy cosmic rays using the Pierre Auger Observatory, PoS ICRC2019 (2019) 450.