Human-AI Interaction for Diverse Humans:
What Cognitive Style Disaggregation Reveals
Abstract.
Although guidelines for human-AI interaction (HAI) provide important advice on how to help improve user experiences with AI products, little is known about HAI for diverse users’ experiences with AI. Without understanding factors that lie behind differences among diverse users’ experiences with AI products, designers lack information they need to make AI products more equitable and inclusive. To investigate whether and how diverse users’ different cognitive styles might help account for their differences, we used data from 16 experiments on Amershi et al.’s HAI Guidelines, and disaggregated by the participants’ cognitive styles. The results of disaggregating revealed 112 phenomena that were not apparent without taking cognitive style diversity into account. We also show how the cognitive style differences can explain demographic differences among genders and among gender-age intersectional groupings, and can point the way toward making HAI experiences more equitable and inclusive.
1. Introduction
The focus of AI research is evolving beyond how to make such systems more accurate, reliable, or algorithmically inclusive towards how to empower end-users with usable AI-powered interfaces to support Human-AI Interaction (HAI), what Wei Xu (Xu, 2019) calls “third-wave AI”. There have been attempts towards considering usability through the user experience of the people during their interaction with such systems, such as supporting end-users via principles/guidelines for human-AI interaction (Amershi et al., 2019; Kulesza et al., 2015; Wickramasinghe et al., 2020), supporting them through AI-generated explanations to improve transparency in the system (Lim et al., 2019; Anderson et al., 2020; Dodge et al., 2019; Mueller et al., 2019; Kulesza et al., 2013), and empirically evaluating the user experience while users interact and collaborate with AI-powered systems (Oh et al., 2018; Lee et al., 2020b), but little remains known about HAI for diverse users’ experiences with AI.
Just as the individual differences among people in our world are myriad and complex, so too are the individual differences among people who interact with AI-powered systems. Research within HAI to address this have considered dimensions of diversity such as how users’ backgrounds help explain their interactions with AI-powered technologies, if they are native English speakers (Pal et al., 2019), if their socio-econonomic status impacts their annotation behavior for AI training data (Fan et al., 2022), if demographic information influenced users’ fear of AI (Liang and Lee, 2017), or if their familiarity with the domains of interest influence how they feel about certain intelligent systems (Guzdial and Riedl, 2016).
We posit that considering users’ cognitive diversity, which cuts across users’ demographic dimensions, may be a useful way to derive actionable insights for researchers and designers of AI-powered systems. Although there are multiple ways to define cognitive diversity, one definition from Patrick Thobodeau (Thibodeau, 2018) captures how it differs from the more traditional demographic diversity:
“Cognitive diversity is the inclusion of people who have different styles of problem-solving and can offer unique perspectives because they think differently. Unlike demographic diversity, which focuses on achieving a mixture of statistical characteristics such as gender or age, cognitive diversity focuses on achieving a mixture of how people carry out intellectual activities, such as making associations or drawing conclusions.”
This paper uses one method of considering end users’ cognitive diversity, namely through their Gender Inclusiveness Magnifier (GenderMag) cognitive style types. GenderMag (Burnett et al., 2016b) has helped researchers investigate users’ needs by considering five cognitive style types to find (and fix) barriers that users with certain cognitive style values may run into when thinking their way through a problem or obstacle to achieve some outcomes or at least some understanding of an outcome.
To investigate how cognitively diverse users’ experiences were impacted by design decisions in AI-powered systems, we launched a second phase of analyses on 1,016 HAI participants’ data who had filled out GenderMag’s cognitive style survey (Hamid et al., 2023). The first phase, reported in Li et al. (Li et al., pear), investigated how violating or applying Amershi et al.’s (Amershi et al., 2019) guidelines for human-AI interaction impacted users’ experiences while using productivity software with AI-powered features (e.g., Microsoft PowerPoint, Google Slides, Apple Keynote, etc.), finding that participants felt generally better when the guidelines were applied.
This paper reports on phase two of that investigation, which considers whether cognitive style disaggregation uncovers previously unseen insights into HAI data. As an example of the pertinence of cognitive styles, other research has indicated the growing risks of Artificial Intelligence (e.g., (Yigitcanlar et al., 2020; Boukherouaa et al., 2021; Zanetti et al., 2020)), and one of GenderMag’s cognitive style types captures an individual’s attitudes toward risks in technology. Thus, our first hypothesis was:
-
H1-CognitiveDiversity-RiskStyle: Risk-averse and risk-tolerant HAI users’ experiences will exhibit disparities in UX metrics for human-AI interaction.
Beyond risk, prior research with non-AI systems has shown that various technology features can disparately impact people via any one of GenderMag’s five cognitive style types. Our second hypothesis considers this possibility with AI-powered systems:
-
H2-CognitiveDiversity-5Styles: Insights found in human-AI interaction data by disaggregating participants’ data by their attitudes toward risk will also be found in the remaining four GenderMag cognitive style types.
Last, we hypothesized that, if H1-CognitiveDiversity-RiskStyle or H2-CognitiveDiversity-5Styles are supported, then cognitive style disaggregation can also shed light on demographic differences in people’s HAI experiences. The demographics we focused on were gender and intersectional gender-age:
-
H3-Demographics: Human-AI interaction participants’ cognitive style values will cluster by gender groupings and will cluster by intersectional groupings of gender and age.
Thus, the new contributions of our research are:
-
•
Three abstract patterns of HAI inclusivity insights that capture disparate impacts of HAI products on risk-averse users vs. risk-tolerant users.
-
•
Generalized insights showing that the abstract patterns for risk also emerge with all five cognitive styles.
-
•
An actionable approach to gain insights into demographic differences through cognitive style disaggregation.
2. Background & Related Work
2.1. The GenderMag cognitive style spectra
We disaggregated our data using the five GenderMag cognitive style types. GenderMag is an inclusive design and evaluation method, shown to be effective at identifying and removing user experience issues that disproportionately impact people by gender (Burnett et al., 2016b; Vorvoreanu et al., 2019). GenderMag has a dual gender-cognitive focus. Although it finds issues that statistically align with gender, it finds the issues not by using people’s gender identity, but rather by their cognitive style types. GenderMag’s five cognitive style types are shown in Table 1.
![[Uncaptioned image]](/html/2108.00588/assets/x1.png)
Each cognitive style type (rows) has a range of possible values (columns). Personas are used to illustrate the range of possible values of each cognitive style type. Specifically, values at one end are assigned to a persona named “Abi,” those at the other end are assigned to a persona named “Tim,” and a mix of values are assigned to a persona named “Pat.” For example, Abi and Pat are risk-averse about technology risks, whereas Tim is risk-tolerant about technology risks.
This paper uses cognitive style data collected via the GenderMag cognitive style survey, a validated instrument (Hamid et al., 2023) that gathers respondents’ five cognitive style values relative to their peers. Participants in Li et al.’s study answered the 36-question GenderMag cognitive style survey, which is included in Appendix A. We expand upon the analysis process for these data in Section 3.2.1.
2.2. Empirical evaluations of user experiences in Human-AI interaction
Our work investigates how users’ cognitive diversity can influence their experiences with AI-powered systems, and others have also started to measure the user experience of such systems with similar measurements seen in this paper. For example, while investigating human-AI collaboration in creating artworks, Oh et al. (Oh et al., 2018) measured participants’ user experience with metrics that included how useful their system was, how fun it was, etc. They found that the introduction of an AI partner to complement the user’s artistic endeavor led to significantly higher feelings of usefulness and fun than when no AI was present. However, they demonstrated that such increases traded off with significantly lower feelings of predictibility and comprehensibility. Lee et al. (Lee et al., 2020b) measured user experience not only by how participants perceived the system, but also how participants felt while using it. They investigated how GUIComp might help people design graphical user interfaces when compared to a base tool. They found that participants perceived GUIComp as significantly more efficient and effective. Further, participants felt that they had significantly more fun, were significantly more comfortable, satisfied, and fulfilled when using GUIComp.
Other researchers explicitly accounted for how users’ demographic or behavioural diversity impacted their experiences in human-AI interaction. Even as early as 2010, Sundar & Marathe (Sundar and Marathe, 2010) found that as participants’ degrees of “power use” increased, so too did their perceived control when they had to customize their own experience; however, their sense of control decreased when an intelligent system personalized their experience. Seaborn & Urakami (Seaborn and Urakami, 2021) performed a review of works dealing with the user experience of voice-based systems. Their paper found works where user demographics impacted the user experience with such systems, such as sex (Lee et al., 2000), degree of extroversion (Lee et al., 2020a), and users’ emotions (Nass et al., 2005). Other works have considered different dimensions of user characteristics, such as Pal et al.’s (Pal et al., 2019) investigation into satisfaction levels between native English speakers and non-native English speakers using voice assistants, finding that the native English speakers were significantly more satisfied with their experience than the non-native speakers. Chen et al. (Chen et al., 2021) investigated factors like people’s trust in the government, along with 3 other factors, finding that aesthetics and personalization of AI-based self-service technologies were related to a more positive user experience, whereas if their participants felt that they would spend a lot of time, their user experience score decreased.
Researchers have also considered the alignment of users’ self-confidence and their perceptions to AI-powered systems. For example, Jiang et al. (Jiang et al., 2000) considered participants’ self-confidence and found that the greater the participants’ self-confidence, the less likely they were to accept the expert system’s proposed solution. While studying how explanations of expert systems aligned with participants’ cognitive styles, Giboney et al. (Giboney et al., 2015) defined cognitive style by propensity to stereotype. They found that the more that participants’ cognitive style aligned with an explanation’s presentation, the higher the perceived quality of the system was.
As with our paper, some researchers have considered the effect of participants’ genders and ages on how they perceived AI-powered systems. Rzepka & Berger (Rzepka and Berger, 2018) provided a comprehensive review of information-systems literature, collecting works that considered how system characteristics, interactions, task & context, outcomes, and user characteristics influenced their perceptions of intelligent systems. The latter material (user characteristics) is pertinent to ours. For example, Gillath et al. considered how participants’ ages might influence their attitudes toward AI, finding that older people were significantly less likely to trust AI (Gillath et al., 2021). Both Shahid et al. (Shahid et al., 2014) and Martinez-Miranda (Martínez-Miranda et al., 2018) found that age impacted their participants’ perceptions of AI-powered robots. Their participants were much younger than ours (i.e., under 18 years old). Shahid et al. went on to find that cultural background similarly influenced such perceptions, a result that Rau & Li (Rau et al., 2009) also found when comparing German vs. Chinese students. van Berkel et al. (van Berkel et al., 2021) studied how participants’ gender identity influenced their attitudes toward fairness (recidivism and loans) and found that their participants who identified as men were significantly more likely than those who identified as women to say that both the loan-provision and recidivism systems were fairer. Others have found similar results across domains, such as de Graaf et al. (De Graaf et al., 2015), who found that gender and age influenced participants’ willingness to accept robotic technologies. Derrick & Ligon (Derrick and Ligon, 2014) also found gender differences on how likable the AI was, depending on how it behaved.
The nearest neighbor to our work is the first phase of analyses (Li et al., pear), performing an empirical investigation of the efficacy of Amershi et al.’s (Amershi et al., 2019) guidelines for human-AI interaction with 1,042 participants. The results found that in almost all of the experiments, participants preferred products which applied the guidelines, and applying the guidelines positively impacted participants’ user experience. Our work builds on these results by disaggregating participants’ data by their five cognitive style types. A more detailed discussion of Li et al.’s methodology is in Section 3.1, but since
2.3. Frameworks, Guidance, and Guidelines for Human-AI Interaction
This investigation occurred within the context of Amershi et al.’s guidelines for human-AI interaction, but there are other ongoing efforts to support human-AI interaction. On January, 2022, Xu et al. identified that “there is a lack of design standards and guidelines that specifically support Human Computer AI-based systems” (Xu et al., 2021), which corroborates Yang et al.’s (Yang et al., 2020) reporting—designing for human-AI interaction remains a challenge for researchers and designers. Some of the challenges for the user experience they identified included assisting users in understanding AI capabilities, how to craft thoughtful interactions, and even collaborating with AI engineers throughout the design process. Their proposed framework identified two attributes of AI that they thought were central to the struggles of human-AI interaction: 1) uncertainty around what the system can do (and how well it can do it), and 2) the complexity of the system’s outputs. Others have generated frameworks to facilitate human-AI interaction, such as Abedin et al.’s (Abedin et al., 2022) framework for designing and managing human-AI interactions, which included information about the User Interface Design.
Sundar (Sundar, 2020) proposed a framework revolving around the psychology of human-AI interaction, to look deeper into how fruitful it would be for research and design to understand the trade-offs between human and machine agency, as well as generating strategies to negotiate such trade-offs. Also grounded in cognitive psychology, yet focused more on the human-AI interaction of eXplainable AI (XAI), Wang et al.’s (Wang et al., 2019) framework looked at how understanding how people reason, make decisions, and seek explanations (accounting for cognitive factors that bias or compromise decision-making) can inform how to explain AI, from the underlying engineering to the ways that XAI supports reasoning and mitigates errors.
Shneiderman’s (Shneiderman, 2020a) framework was geared toward safe, reliable, and trustworthy AI, highlighting further trade-offs between human control and computer automation, particularly in situations where the risks were higher (e.g., life-critical systems). Lastly, Xu’s (Xu, 2019) framework for human-AI interaction’s third part considered human factors design, in order to ensure that AI solutions are explainable, comprehensible, useful, and usable.
Other works have proposed principles for human-AI interaction. In 1999, Eric Horvitz (Horvitz, 1999) identified 12 critical factors for mixed-initiative user interfaces, since humans would transition towards performing collaborative tasks with intelligent agents. Some of the critical factors pointed towards the need to consider things like the uncertainty of a user’s goals, as well as how to empower the user to infer ideal actions in light of costs, benefits, and uncertainties. Since then, researchers have proposed multiple principles towards aspects of human-AI interaction, such as Kulesza et al.’s (Kulesza et al., 2015) principles of explanatory debugging, with situational considerations like principles for explaining how an AI made its decisions in the event that is wrong. Other proposed principles focus on specific technologies, such as Ahmad et al.’s (Ahmad et al., 2022) focus on personality-adaptive conversational agents, developing six principles, some of which suggest a need to design agents in such a way that they can support diverse users in a mental health setting.
Lastly, researchers have investigated methods of informing the design of human-AI interaction are through guidelines. Wright et al. (Wright et al., 2020) surveyed all guidelines from three major companies—Apple, Google, and Microsoft— and unified more than 200 guidelines into multiple categories. In their work, they classified their guidelines into categories such as Initial considerations of AI, curating the models themselves, the deployment of the AI-powered system, and the human-AI interface. Wright et al. identified that both Apple’s (Inc., 2019) and Google’s (Google, 2019) guidelines were developed with the developer in mind, whereas Amershi et al.’s guidelines focused on how the design pertained to the user.
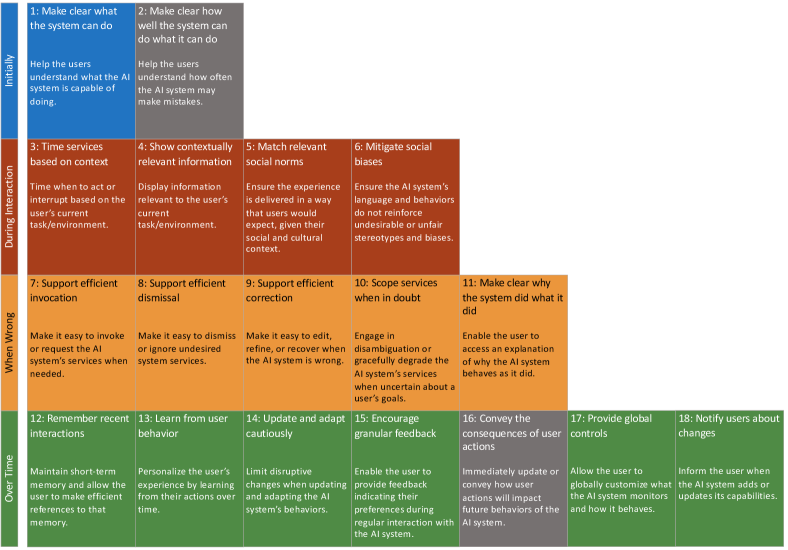
Amershi et al.’s (Amershi et al., 2019) set of 18 guidelines for human-AI interaction, depicted in Figure 1, provided high-level advice for designers about what the user should expect from AI-powered systems. Each guideline had three components 1) a number, 2) a name which provides high-level advice for designers (e.g., “Make clear what the system can do”), and 3) a brief description of what the guideline means (e.g., “Help the user understand what the AI system is capable of doing”). Amershi et al. also ran an initial study to investigate if HCI practitioners, the designers of AI-powered systems, could find examples of the guidelines and if the guidelines were clear. Our work differs by considering the impact of violating/applying these guidelines on the user experience of cognitively diverse users of AI-powered systems.
3. Methodology
3.1. Experimental Methodology & Phase One Result Summary
The investigation wanted to gauge the efficacy of Amershi et al.’s (Amershi et al., 2019) guidelines for Human-AI interaction, recruiting 1,043 participants and randomly assigning them to one of 18 experiments, one for each guideline. Each experiment was a 2 x 2 factorial experiments, and the experimental independent variables were 1) adherence to the guidelines as a within-subjects factor (levels: Guideline Violation & Guideline Application) and 2) AI-quality as a between-subjects factor (levels: optimal & sub-optimal). For example, Experiment 11 was the experiment to gauge the efficacy of Guideline 11.
Like several other human-AI works (e.g., (Lima et al., 2021; Abendschein et al., 2021; McKee et al., 2021; Davis et al., 2022; Lee et al., 2022)), each AI system was represented by a vignette111All vignettes for both guideline violations and applications can be found in Appendix B; in a random order, participants saw a vignette which described an interaction with a system that applied the studied guideline (i.e., the Application AI product) and a vignette which described an interaction with a system that violated the guideline (i.e., the Violation AI product). All vignettes described systems from productivity software systems: document and slide editors, search engines, email applications, and spreadsheet applications.
For each vignette, participants answered questions (Table 3) on a 7-point Likert scale from “Strongly Disagree” (encoded as a “1”) to “Strongly Agree” (encoded as a “7”), with an option to reply with “I don’t know”. After participants saw both vignettes, they were asked to describe the differences between the two products and which of the two products they would prefer (and why). Finally, they filled out demographic information, including the GenderMag cognitive style survey.
Table 2 provides an example of one experiment’s pair of vignettes. Each vignette had three parts:
-
(1)
The introduction to the product and feature set up the context for the product, describing what the product did and the AI-powered feature that the participant would interact with.
-
(2)
The product behavior description described how the product behaved in the Application AI product and the Violation AI product, which manipulated the independent variable.
-
(3)
The AI performance description described how well the product did its job, which could be optimal (i.e., it worked well most of the time) or sub-optimal (i.e., the product sometimes made mistakes and sometimes worked well).
For (3), the phase one analysis showed that the AI performance factor had a substantial practically significant interaction effect for only Guideline 13’s (learn from user behavior) experiment. Therefore, AI optimality was not considered as a factor across all experiments. We keep this finding in phase two.
![[Uncaptioned image]](/html/2108.00588/assets/x3.png)
| Dependent Variable | Wording |
|---|---|
| I would feel in control | “I would feel in control while using the product.” |
| I would feel secure | “I would feel secure while using the product.” |
| I would feel inadequate | “I would feel inadequate while using the product.” |
| I would feel uncertain | “I would feel uncertain while using the product.” |
| I would feel productive | “I would feel productive while using the product.” |
| I perceived it as useful | “I would find the product useful.” |
| I would be suspicious | “I would be suspicious of the intent, action, or outputs of the product.” |
| It would be harmful | “I would expect the product to have a harmful or injurious outcome.” |
| I find the product reliable | “I would expect the product to be reliable.” |
| I would trust the product | “I would trust the product.” |
3.1.1. Phase One Result Summary
The phase one analyses found that for the 16 successful experiments, the Application AI product (which applied the guidelines) generally resulted in products being perceived as more useful and better for the user experience. However, in some instances, participants may perceive that when designers apply some of the guidelines (such as Guideline 4 and Guideline 13), users may find that designs to personalize the system might be limiting.
3.2. Phase Two Analysis Methodology
Phase two of the analyses on these data seeks to uncover how users with certain cognitive style values may (or may not) have been impacted by violations and applications of Amershi et al.’s guidelines using the GenderMag cognitive style survey. To the best of our knowledge, this was the first attempt to study the user experience of such cognitively diverse users with such guidelines, seeking to uncover additional information such as: 1) when the guidelines were violated, were such violations worse for some users than for others, and 2) when the guidelines were applied, were such applications better for some users more than others.
Of the 1,043 participants who passed the experimental attention checks, 27 participants did not pass an attention check in the GenderMag cognitive style survey, leaving a total of 1,016 participants. They came from all walks of life, from different ages (18—74), educational backgrounds (less than high school to Masters or higher), occupations, and the gender identity/identities they reported to us (Appendix C).
3.2.1. Computing Participants’ Cognitive Styles
Participants responded to the GenderMag cognitive style survey on 9-point agreement scales for 36 statements, with an option to reply with “I don’t know” if needed.
There are five subsets that partition the 36 survey statements, one subset for each of the five cognitive style types. We computed participants’ cognitive style values twice, once relative to their participant peers in the same experiment (analyzed in Section 4) and the other relative to participants across all experiments (analyzed in Section 5). To compute participants’ cognitive style values for each cognitive style type, we summed up the responses to the questions that were not “I don’t know” to create a score for that cognitive style type. To account for the “I don’t know” responses, we adjusted each participants’ score by dividing it by the percentage of responses they answered.
To illustrate the need for such a correction method, consider that there are seven questions for attitudes toward risk. Suppose Participant X answered four of them with “I don’t know”, but they answered with “9” for the other three questions. This would sum to a “risk score” of 27. Now suppose that Participant Y answered all seven questions with “4’s”, so Participant Y’s score would have a score of 28. Without adjustment, this would create a possibility of both participants being classified as having the same attitude towards risk, despite the average of their answered questions being completely different (9 vs. 4). Our correction technique took each participants’ score (Participant X: 27) and divide it by the percentage of questions they answered (Participant X: 0.429). Therefore, their adjusted score for attitudes toward risk was . In keeping with precedent (Hilderbrand et al., 2020; Guizani et al., 2022; Kanij et al., 2022), participants’ scores were classified relative to the median of each distribution after the adjustment. For attitudes toward risk, those who were above the median were categorized as more risk-averse than their risk-tolerant peers whose scores were below the median222 The classification rules for all five cognitive style types can be found in Appendix A.. Specifically to attitudes toward risk, using the median as the classification threshold enables researchers to derive actionable insights, because users can be classified as “more” or “less” risk-averse than others.
3.2.2. Statistical Testing Paradigm
Each of the 16 independent experiments had its own pool of data, and we analyzed each independently of the other 15 experiments. Within each experiment, after plotting the data, we measured the distance between the means of each dependent variable for both the Violation AI product and Application AI product, and we ran a test if that distance was greater than 0.5. We validated the t-test’s assumption of equal variance by using Levene’s test, to decide whether Student’s t-test (i.e., Levene’s test ) or Welch’s t-test (i.e., Levene’s test ) was more applicable. We did not draw inferences from “marginally significant” results (i.e., ), but we count having ran these tests for correction purposes, and we applied Bonferroni correction for the Application AI product or Violation AI product separately in each experiment by multiplying each p-value by the number of tests run on that product, in the interest of transparency.
4. Results: What participants’ cognitive diversity revealed
4.1. An Illustrative Case: Guideline 11 meets Diverse Attitudes Toward Risk
To detail the kinds of insights disaggregating by cognitive styles can reveal, we begin by focusing on one case—what one cognitive style type’s range of values revealed about one dependent variable’s results for one guideline.
The cognitive style type we consider is Attitude toward Risk; its values range from risk-averse to risk-tolerant. The dependent variable is participants’ responses to “I would feel in control” (recall Table 3)333Appendix D enumerates results for all guidelines in guideline number order. . The experimental setting was the Guideline 11 experiment (guideline text: make clear why the system did what it did).
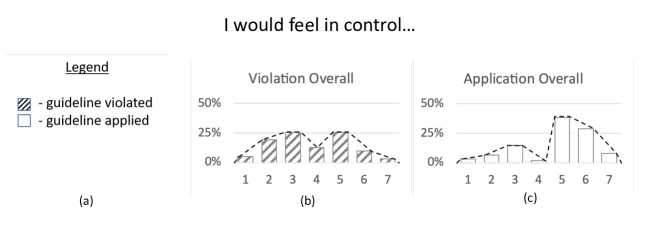
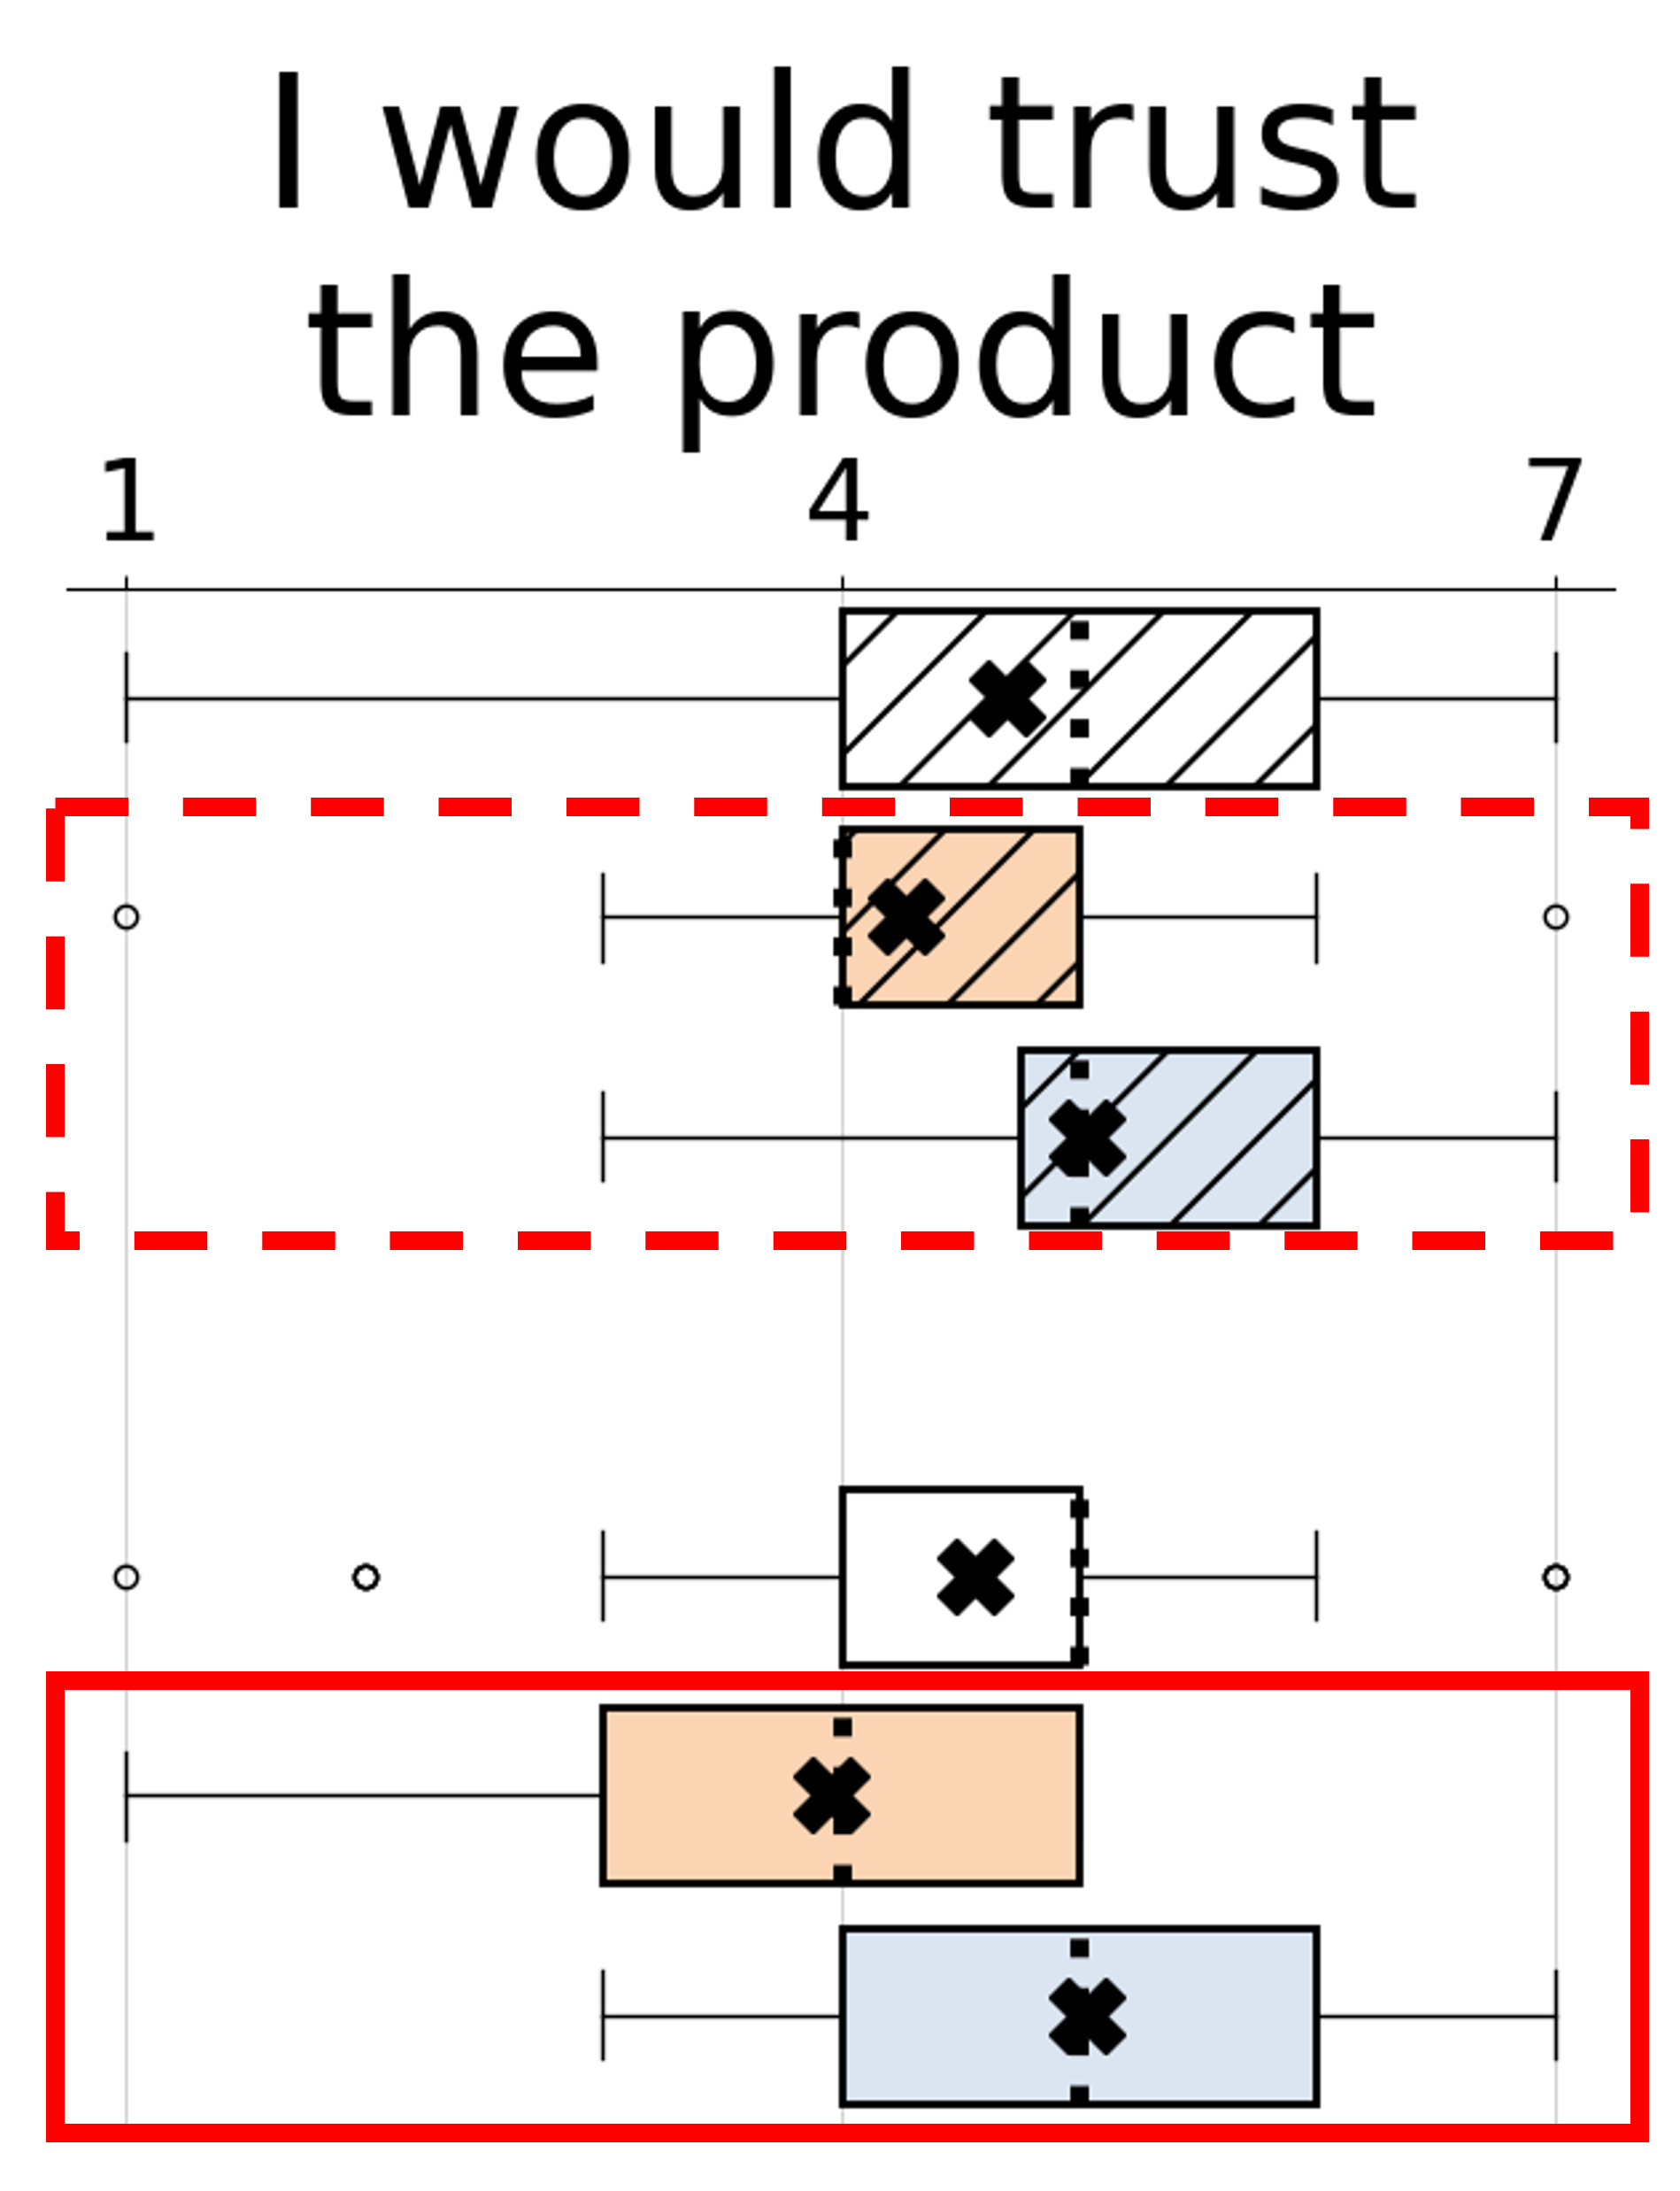
Figure 2444Fig. 2(a) and Fig. 3(a) are legends for all figures in Sections 4.1 and 4.2. shows participants’ responses for this dependent variable in this experiment, for the Violation AI product (b) and the Application AI product (c), before disaggregating participants’ data by their attitudes toward risk. As Li et al. previously reported, the Application AI product helped participants feel significantly more in control than they had with the Violation AI product (Li et al., pear); a paired t-test corroborates this finding (t(62) = 6.0739, p .0001). This alone is a useful result, showing that applying Guideline 11 was an effective way to improve participants’ feelings of control.
That said, disaggregating these data by participants’ attitudes toward risk reveals information not otherwise apparent. For example, not only did applying Guideline 11 help, but applying it significantly helped participants with diverse attitudes toward risk. Specifically, both the risk-averse (paired t-test, t(29) = 4.5916, p .0001; (Figure 3(b)’s orange vs. (c)’s orange) and the risk-tolerant (paired t-test, t(32) = 3.9710, p = .0004; (b)’s blue vs. (c)’s blue) felt significantly more in control with the Application AI product than they had with the Violation AI product. This suggests that in this experiment, applying Guideline 11 was not only beneficial for users on average, it was also inclusively beneficial for users with diverse attitudes toward risk.
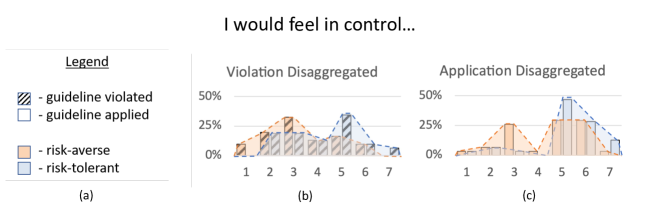
Disaggregating data by users’ attitudes toward risk also has explanatory value; here it provides an explanation for the bimodal distributions in Figure 2. For example, as Figure 3(b) helps illustrate, of the participants who did not feel in control with the Violation AI product (i.e., responses ), 61.3% were risk-averse in using technology. On the other hand, 66.7% of the participants who did feel in control (i.e., responses ) were those who were risk-tolerant in using technology. This suggests that failing to apply Guideline 11 was particularly problematic for participants who are risk-averse in using technology.
Implications for Researchers and Practitioners: The results of disaggregating in this particular case have three implications.
First, disaggregating by cognitive style value can help researchers and designers answer questions about mysterious peaks and valleys in HAI user experience data. For example, the results suggests that violating Guideline 11 (i.e., not explaining why the AI Product did what it did) may result in users who are more risk-averse in using technology viewing such products much less favorably than users who are risk-tolerant.
Second, disaggregating data by participants’ attitude toward risk helped to explain these data, pointing the way toward potential design remedies that HAI designers can consider to help improve more users’ experiences with the product, or at least clarify what additional data needs to be collected from user studies. In the Guideline 11 vignette, the Application AI product offered an explanation button, but participants did not see the actual explanation. Here, risk-tolerant individuals felt in control just from knowing an explanation would be available, but risk-averse individuals may have needed to see what the explanation would actually explain before they could feel in control.
Finally, an implication from these results for designers of AI products is that failing to follow Guideline 11 by providing an explanations of the AI’s outputs may lead risk-averse users to abandon the AI-powered feature because they may not feel in control.
4.2. Beyond the Illustrative Case: Results of H1-CognitiveDiversity-RiskStyle
Do results like those in Section 4.1 extend beyond that single case? H1-CognitiveDiversity-RiskStyle hypothesizes that risk-averse and risk-tolerant HAI users’ experiences will exhibit disparities in UX metrics for human-AI interaction across experiments. To investigate this hypothesis, we considered each of the 16 experiments, disaggregating participants’ data by their attitudes toward risk. This disaggregation by risk revealed 33 insights, which exhibited three abstract patterns.
4.2.1. Pattern #1: Applying Guidelines Closed Inclusivity Disparities
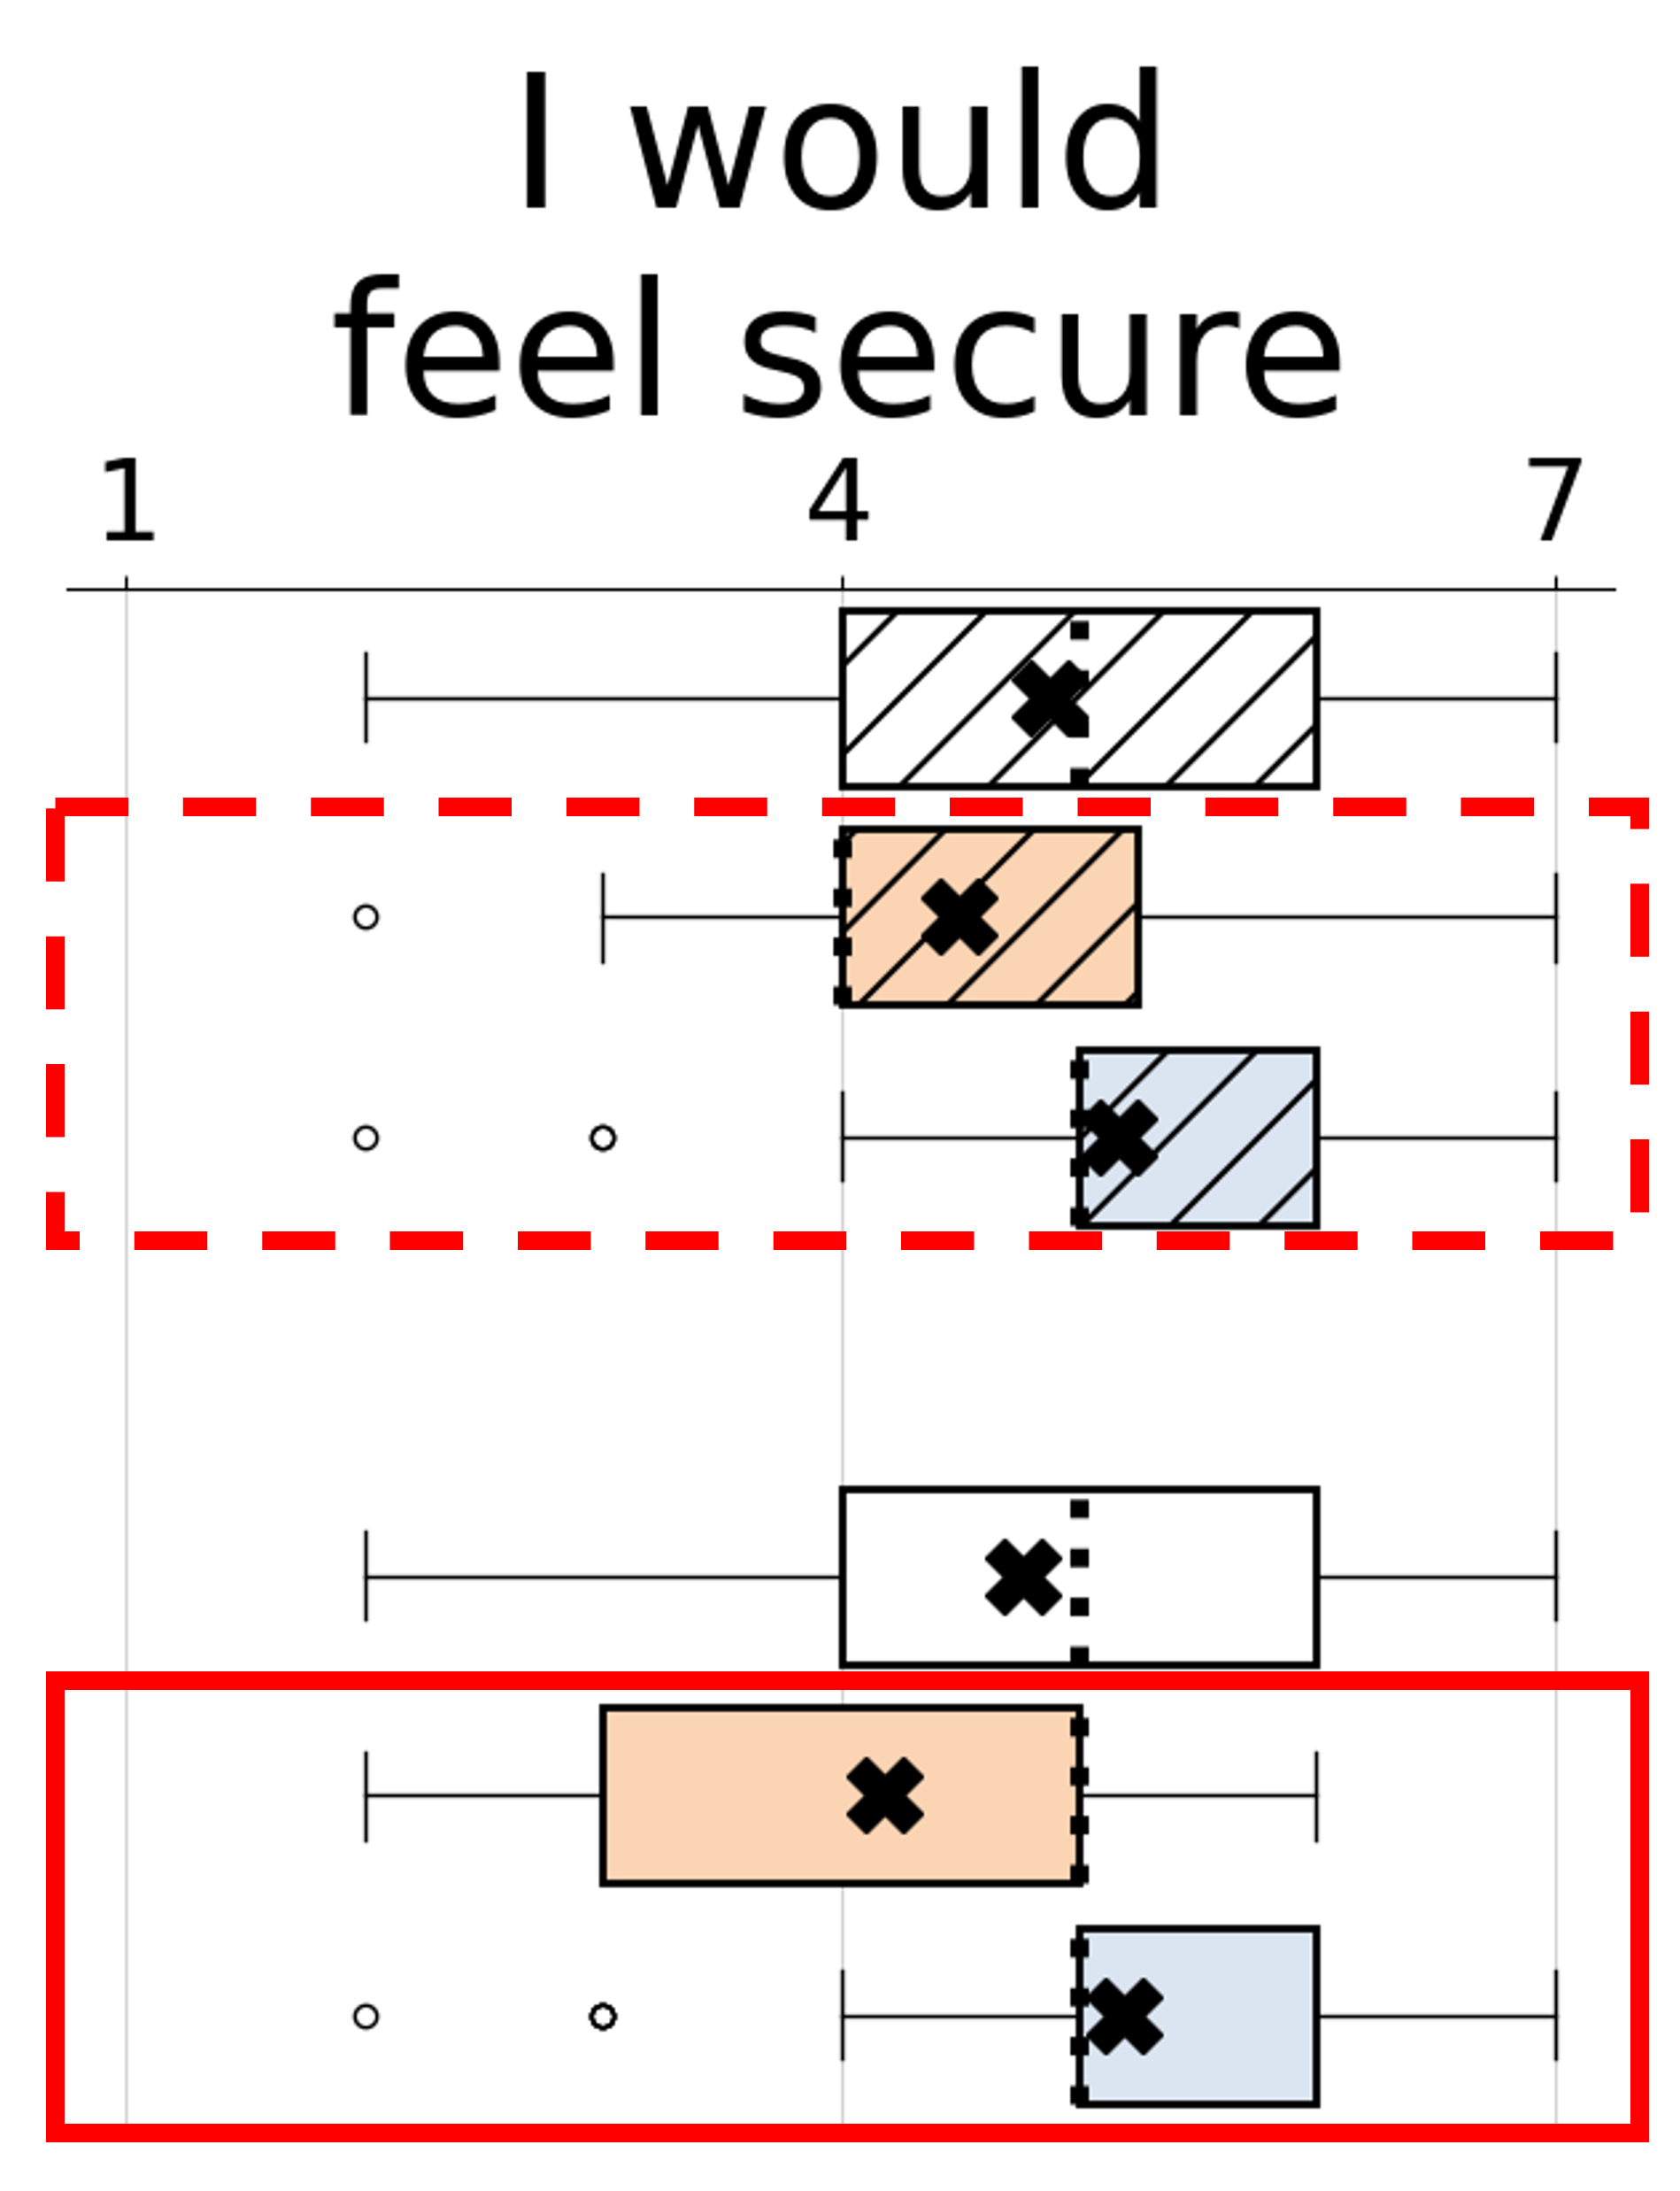
This pattern shows what it means to achieve the ideal outcome of applying some guidelines—improving inclusivity and achieving equity. A guideline exhibited this pattern if there was a statistically significant difference between the risk-averse and risk-tolerant participants in the Violation AI product, but there was no significant difference between the two risk attitudes in the Application AI product for at least one dependent variable. The four instances of this pattern were in Guidelines 4, 7, 8, and 11.
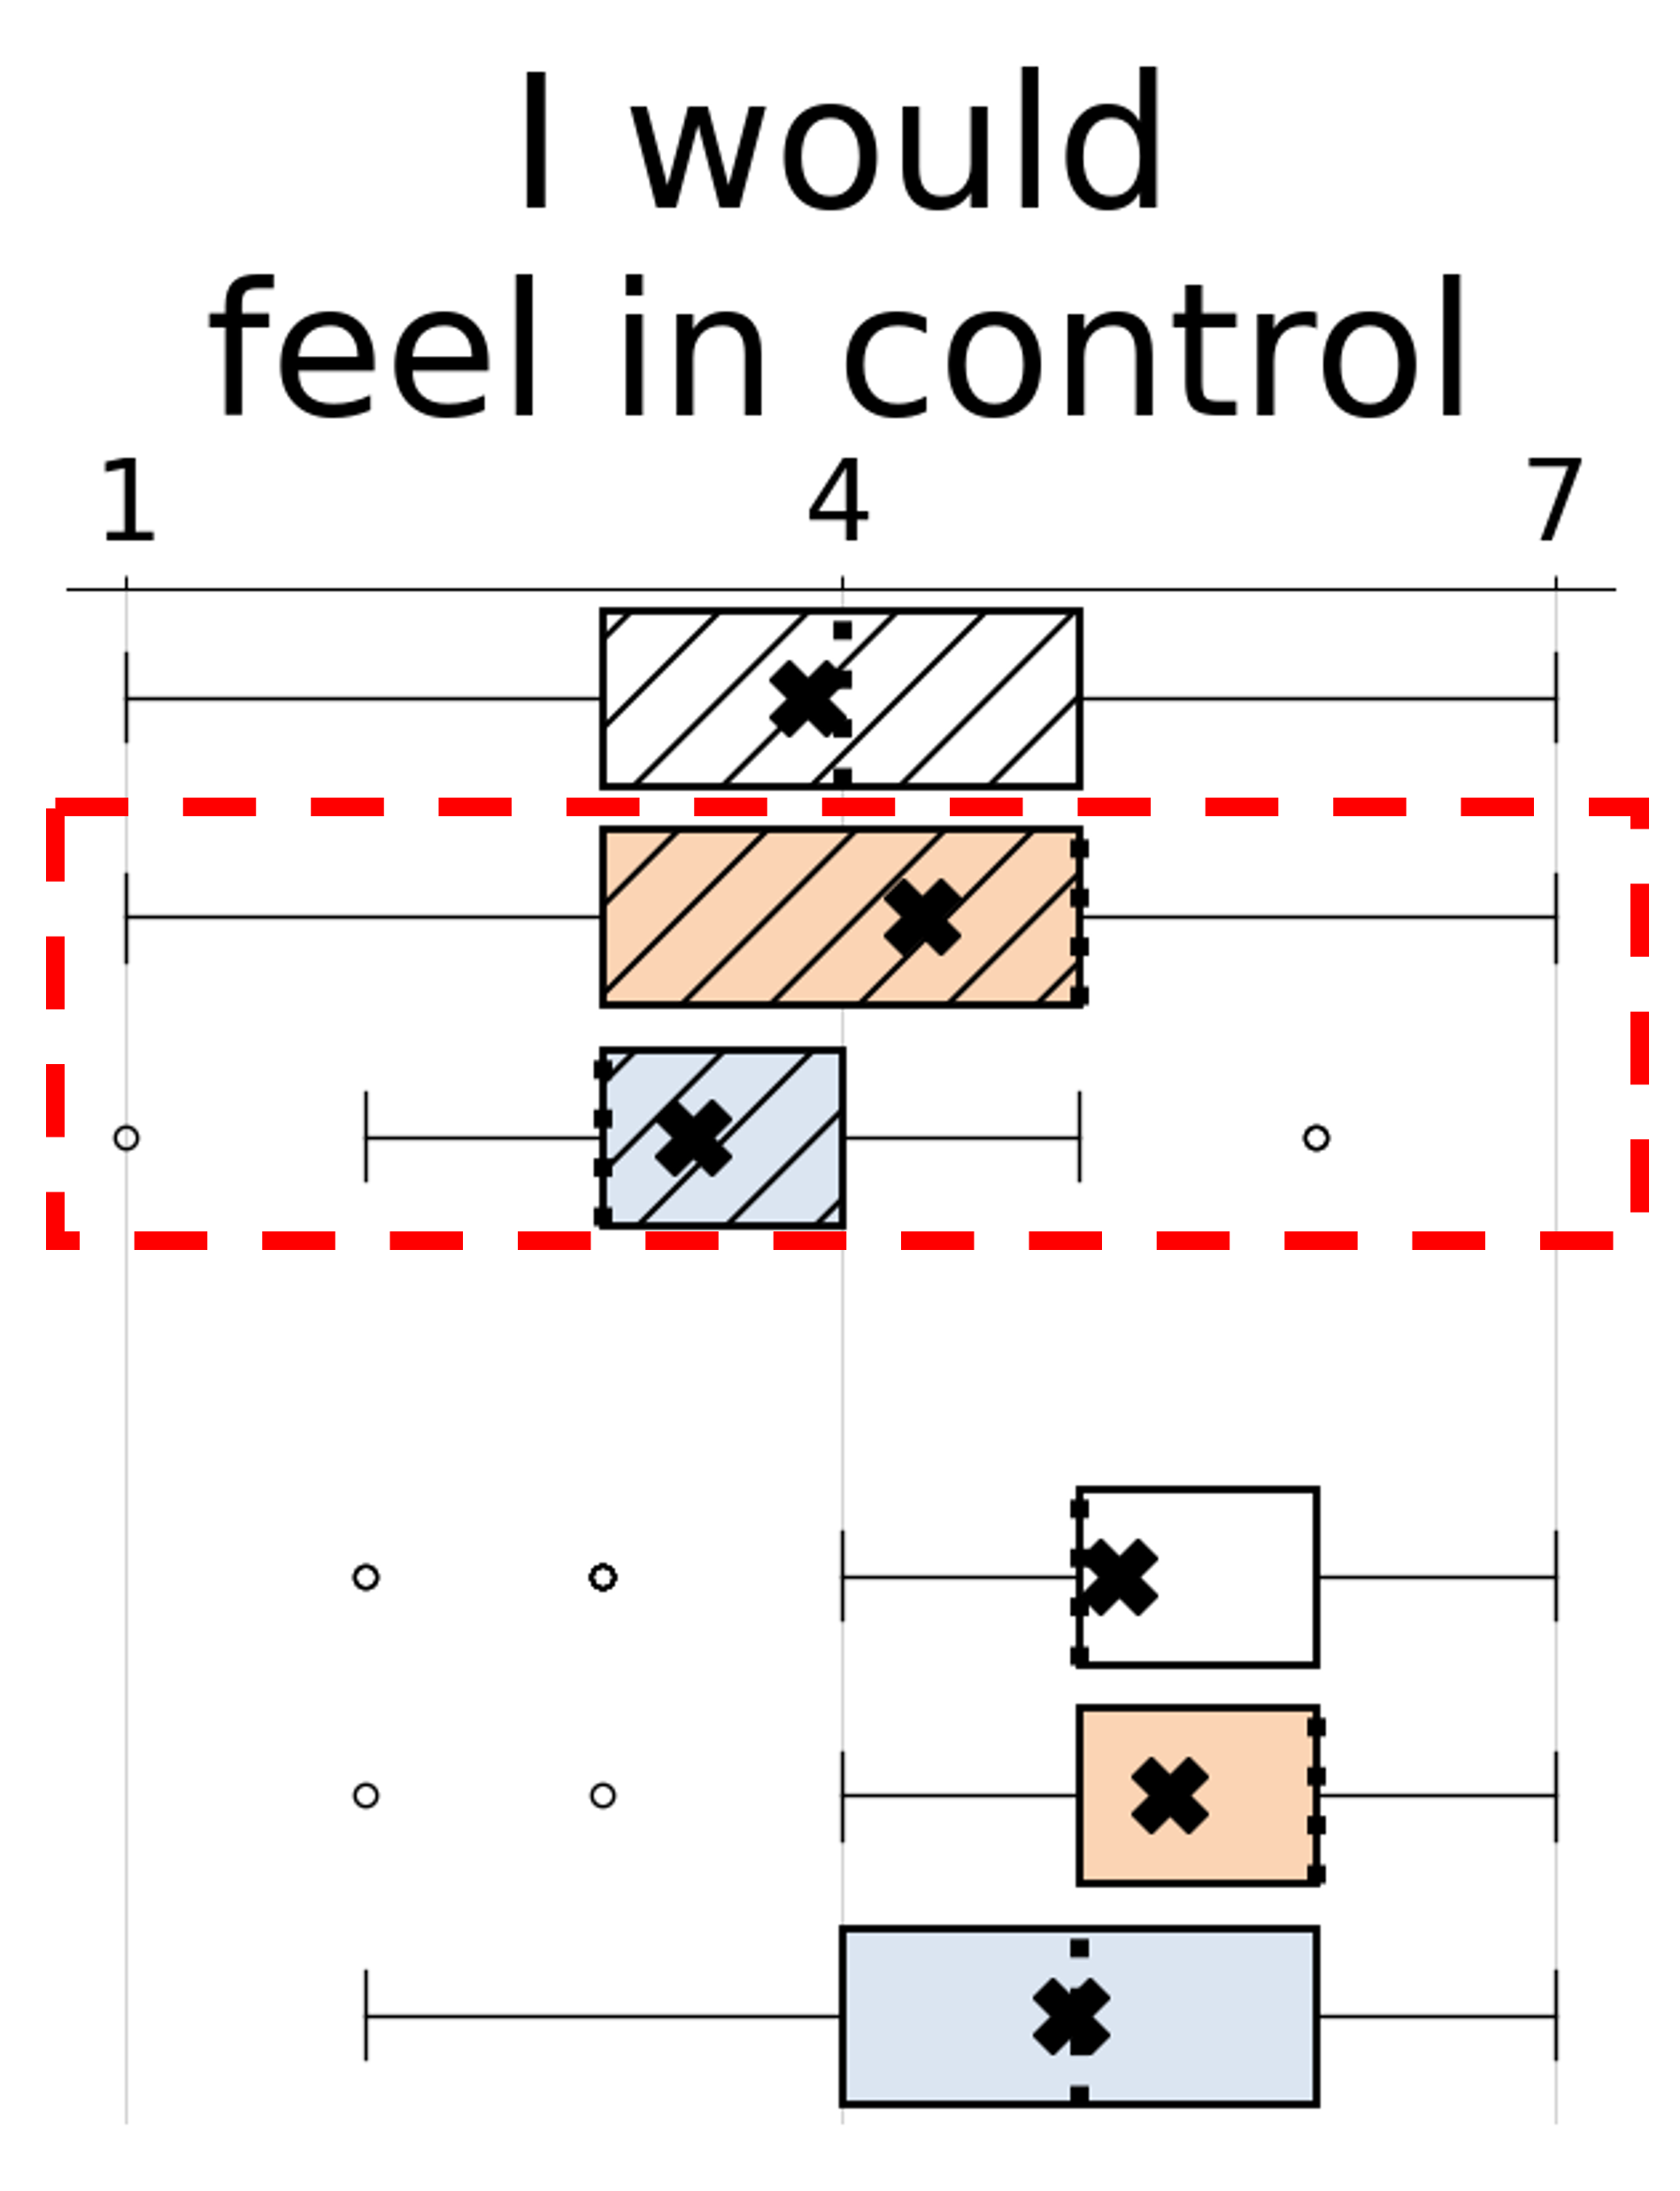
Figure 4 (left) shows an instance of this pattern for Guideline 7’s dependent variable of feeling in control. In contrast to the Guideline 11 case with this variable shown in Section 4.1, with Guideline 7 the risk-averse participants felt significantly more in control on average than the risk-tolerant participants when seeing the Violation AI product (t(56) = 2.7112, p = .009, d555Cohen’s d measures practical significance (Ramsey and Schafer, 2012), where is unsubstantiated, is small, medium, and is large = .538)666Appendix D has all statistics for all tests we ran.. (The difference between the Violation AI product and Application AI product was that the button to toggle the AI-powered feature was visible in the Application AI product but not in the Violation AI product.) Similar to the Guideline 11 case (statistical details in Appendix D), Guideline 7’s Application AI product closed the disparity statistically between these two sets of participants (t(56) = 1.3941, p = .169, d = .368). Across the 16 experiments, this was one of only three instances where the risk-averse participants had a significantly higher average rating for a dependent variable than the risk-tolerant. This highlights for researchers and practitioners the importance of considering the needs on both ends of the attitudes toward risk cognitive style type. The infrequency of results where the risk-averse did not have significantly lower UX metrics leaves it an open question on what the risk-tolerant may need to avoid disparities between them and the risk-averse when some guidelines are violated.
 |
 |
|||
| t(56) = 2.7112 | t(59) = -2.1958 | |||
| p: .009 | d: .716 | p: .032 | d: .569 | |
 |
 |
|||
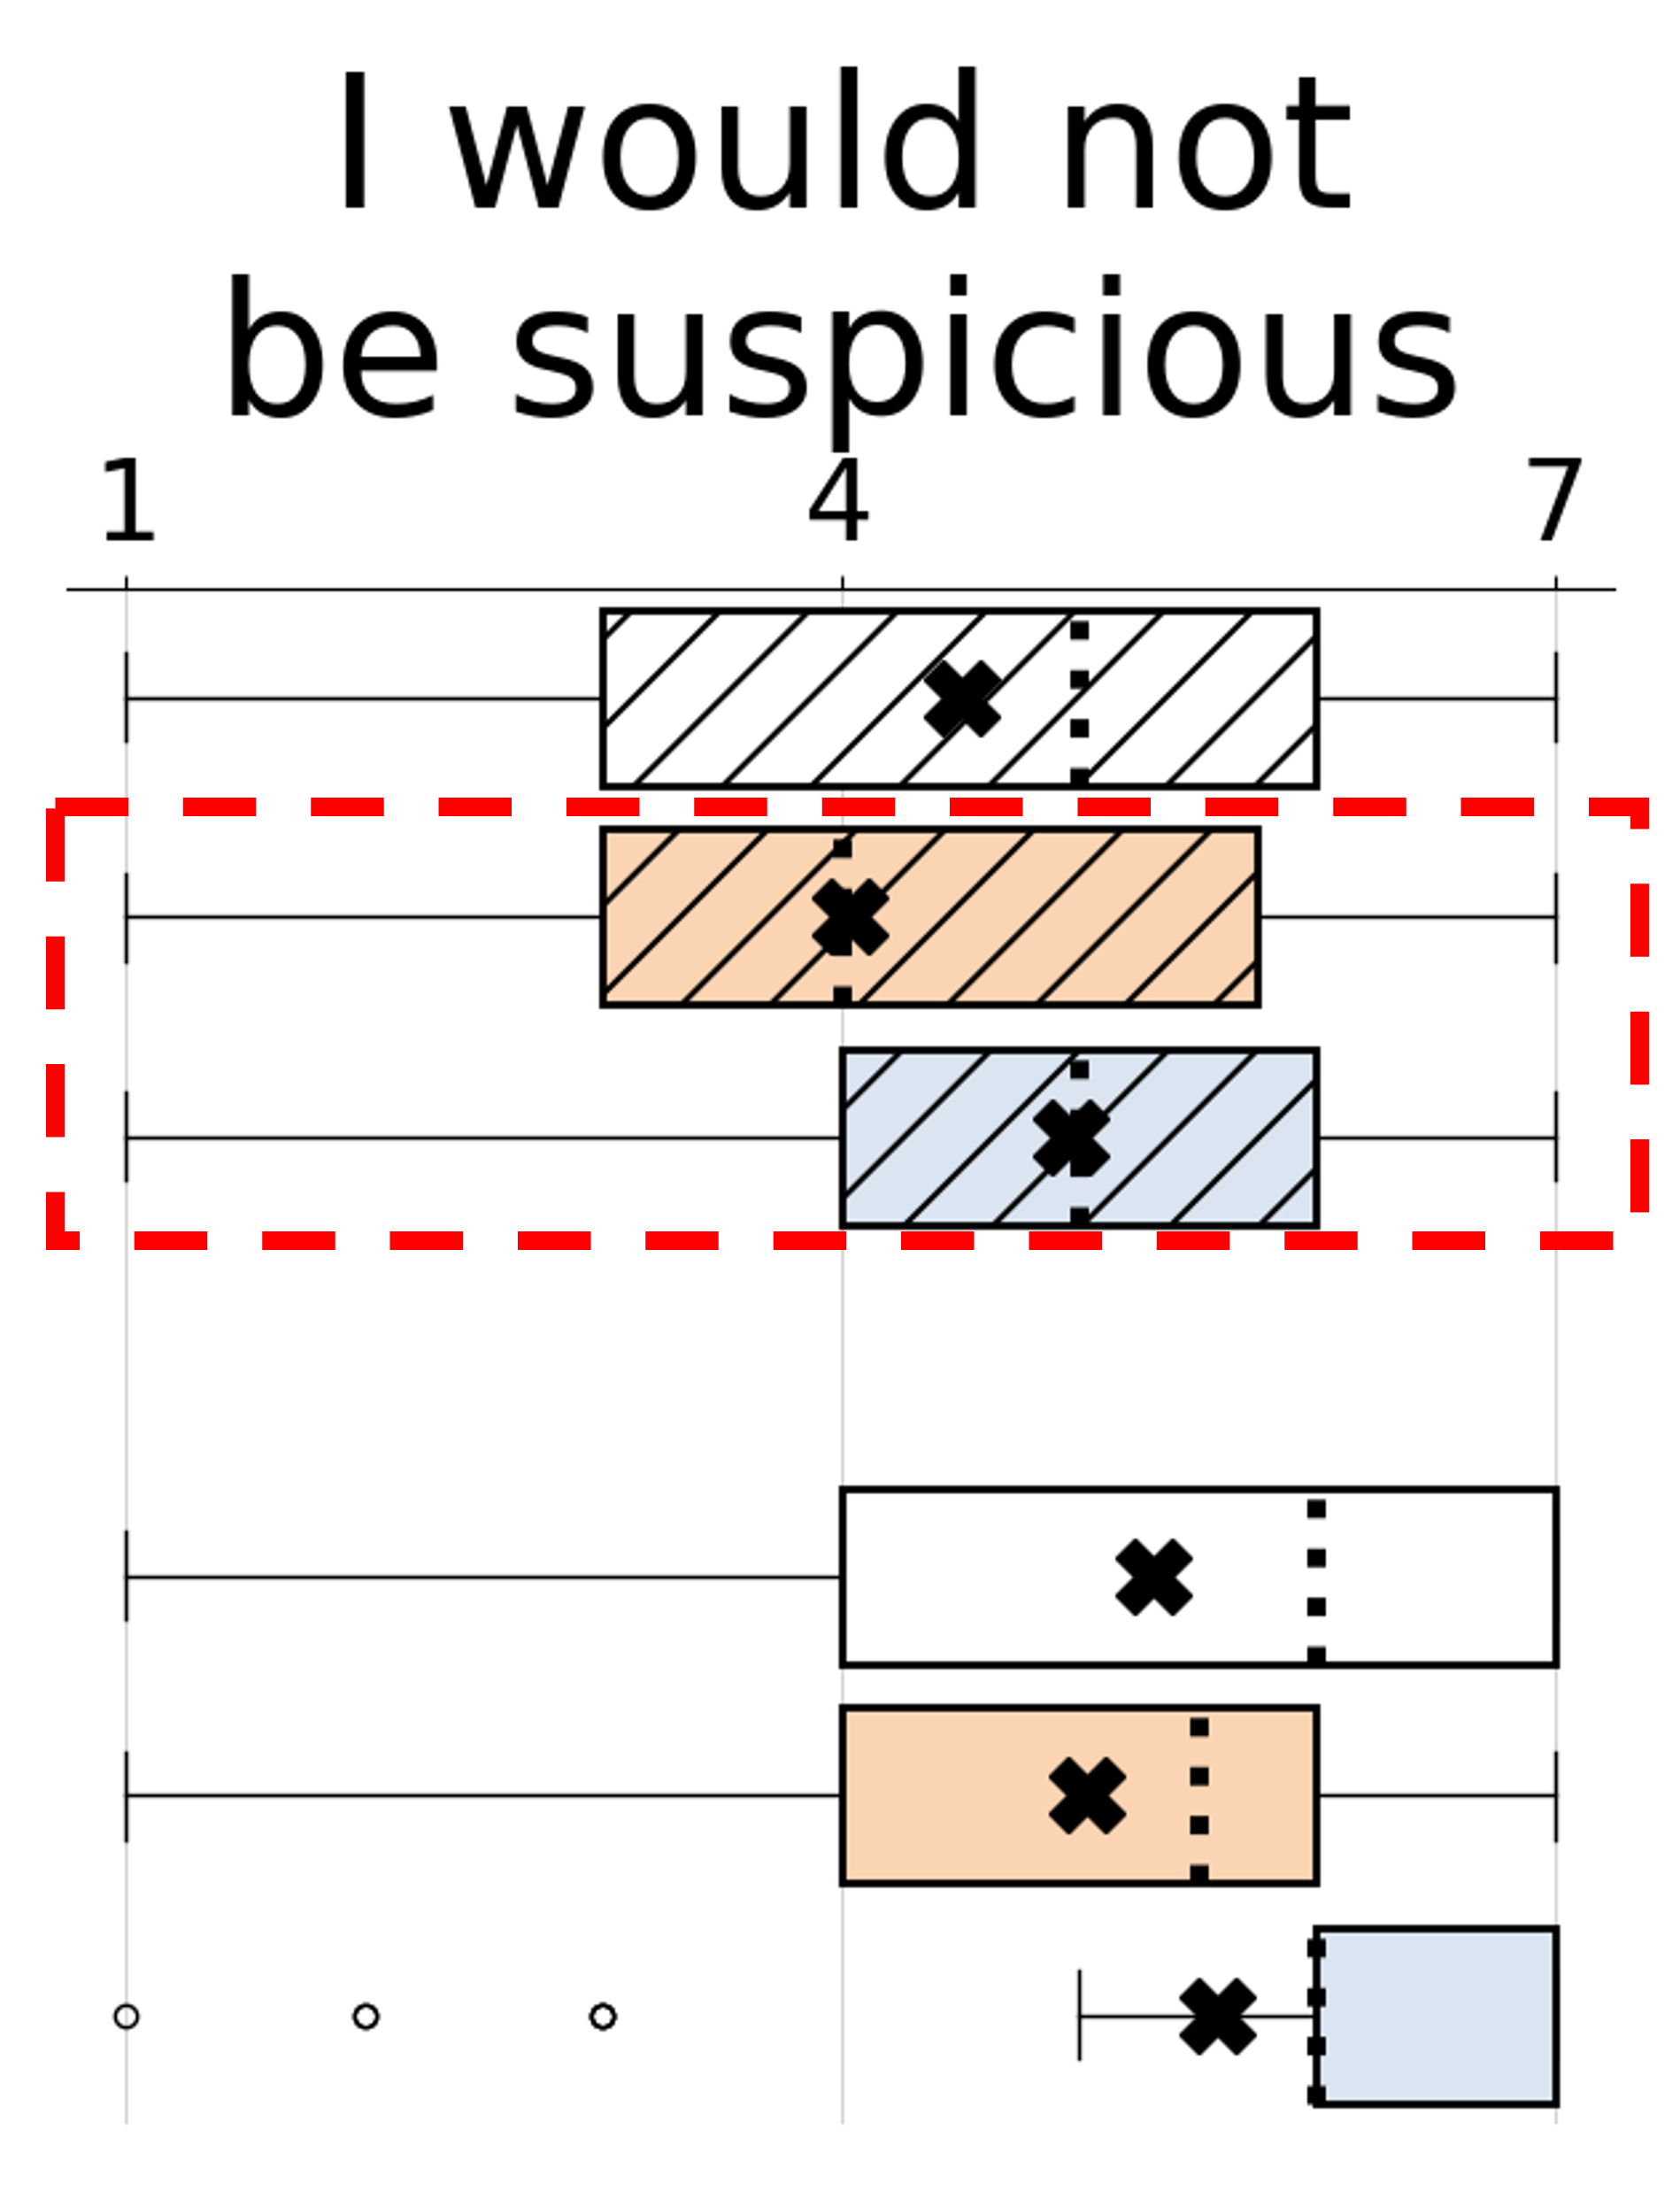
Guideline 8’s experiment (Figure 4, right), showed this statistical pattern with a different variable: the risk-averse participants felt significantly more suspicious of the Violation AI product (t(59) = -2.1958, p = .032, d = .569) than the risk-tolerant did. Appendix D also shows this pattern statistically in Guideline 4 participants’ feelings of productivity.
Implications for Researchers and Practitioners: For practitioners, disaggregating participants’ quantitative and qualitative data by their attitudes toward risk can provide actionable avenues to apply these guidelines. For example, when participants were asked to explain which of the two systems they preferred, some of the risk-averse participants’ responses suggested how designers may better support efficient invocation (i.e., Guideline 7) by ensuring that the invocation method is easy to locate:
G7-2138-risk-averse : “I like that [the Application AI product’s feature] is easy to locate … nothing more frustrating than trying to find something and not being able to…”
Further, some participants sent warning signals to designers about their experiences when explanations were not provided in the Violation AI product for Guideline 11:
G11-2921-risk-averse : “[Violation AI product] would be a call to the help desk and a big time suck…”
G7-2138-risk-averse’s and G11-2921-risk-averse’s comments are reminiscent of Blackwell’s theory of Attention Investment (Blackwell, 2002). In this theory, users weigh their expectation of the cost of learning/using the new feature set against their expectation of benefits they will receive (including time saved)—tempered by their expectation of risk (probability) that spending that time will not result in benefits after all. This is pertinent within AI-powered systems, since not only are risk-averse users often hesitant to spend extra time learning unfamiliar technologies (Charness and Gneezy, 2012), but users can also become wary of accessing features of AI-powered technologies where there is a high perceived cost of obtaining uncertain benefits from using them (Bunt et al., 2012).
As such, a possibility is to empower users to “guess-timate” cost/benefit/risk trade offs reasonably correctly. To accomplish this, designers may have to design for users’ expectations of the trade offs between accepting an AI’s decision (expecting low cost, potentially good benefits if the AI is right, but potentially high risk it is wrong), vs. arriving at the decision themselves (expecting higher cost for the same benefits, at lower risk if they trust themselves). If designers do not consider how to help users’ expectations align reasonably well with the AI feature’s actual costs, benefits, and risk, risk-averse users could choose to avoid using the AI feature, opting to do the work themselves to reduce risks arising if the AI makes an inappropriate decision.
4.2.2. Pattern #2: Applying Guidelines Improved Inclusivity, but Not Equity
Like Pattern #1, this inclusivity pattern is an indicator of progress. In Pattern #2, applying the guideline resulted in improved inclusivity; however, unlike Pattern #1, this improvement did not achieve equity. We define a guideline as exhibiting this pattern if 1) the Violation AI product did not significantly differ between the risk-averse and risk-tolerant participants; 2) participants with both attitudes towards risk were more positive in the Application AI product, i.e., inclusivity improved; but 3) risk-averse and risk-tolerant participants then statistically differed in the Application AI product. Thus, in this pattern, the Application AI product results were better for everyone, but also introduced an inequity.
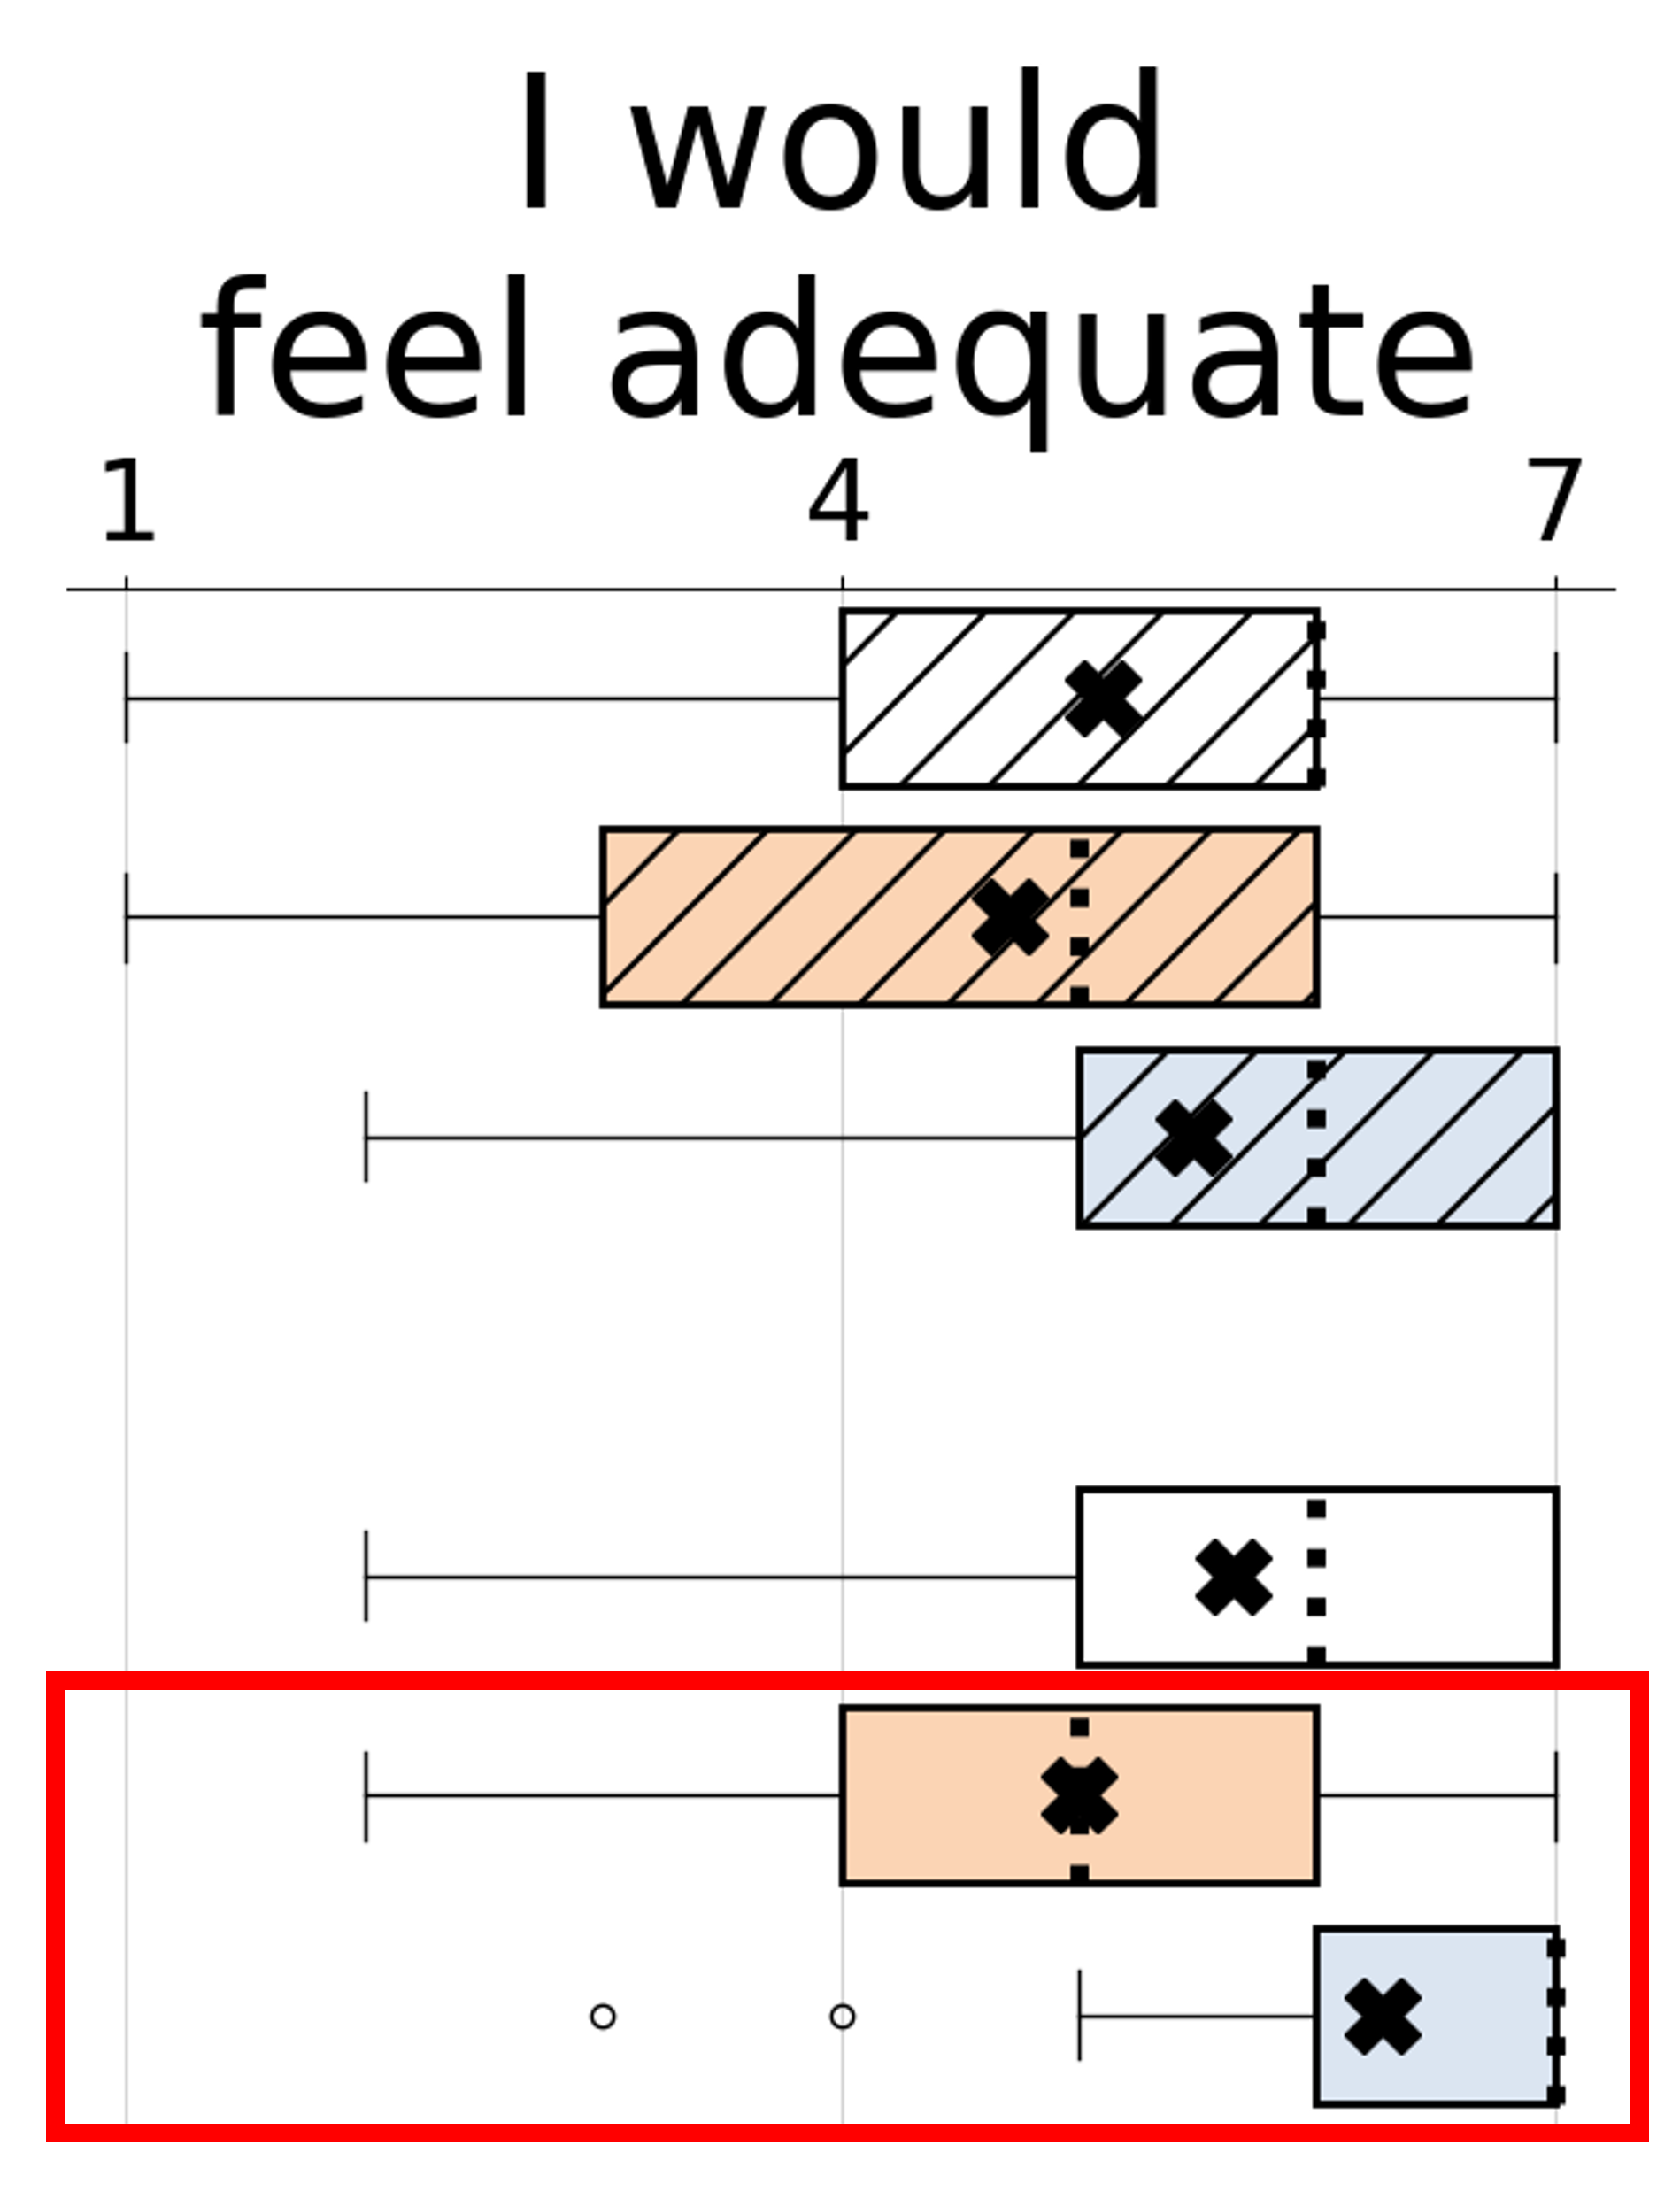
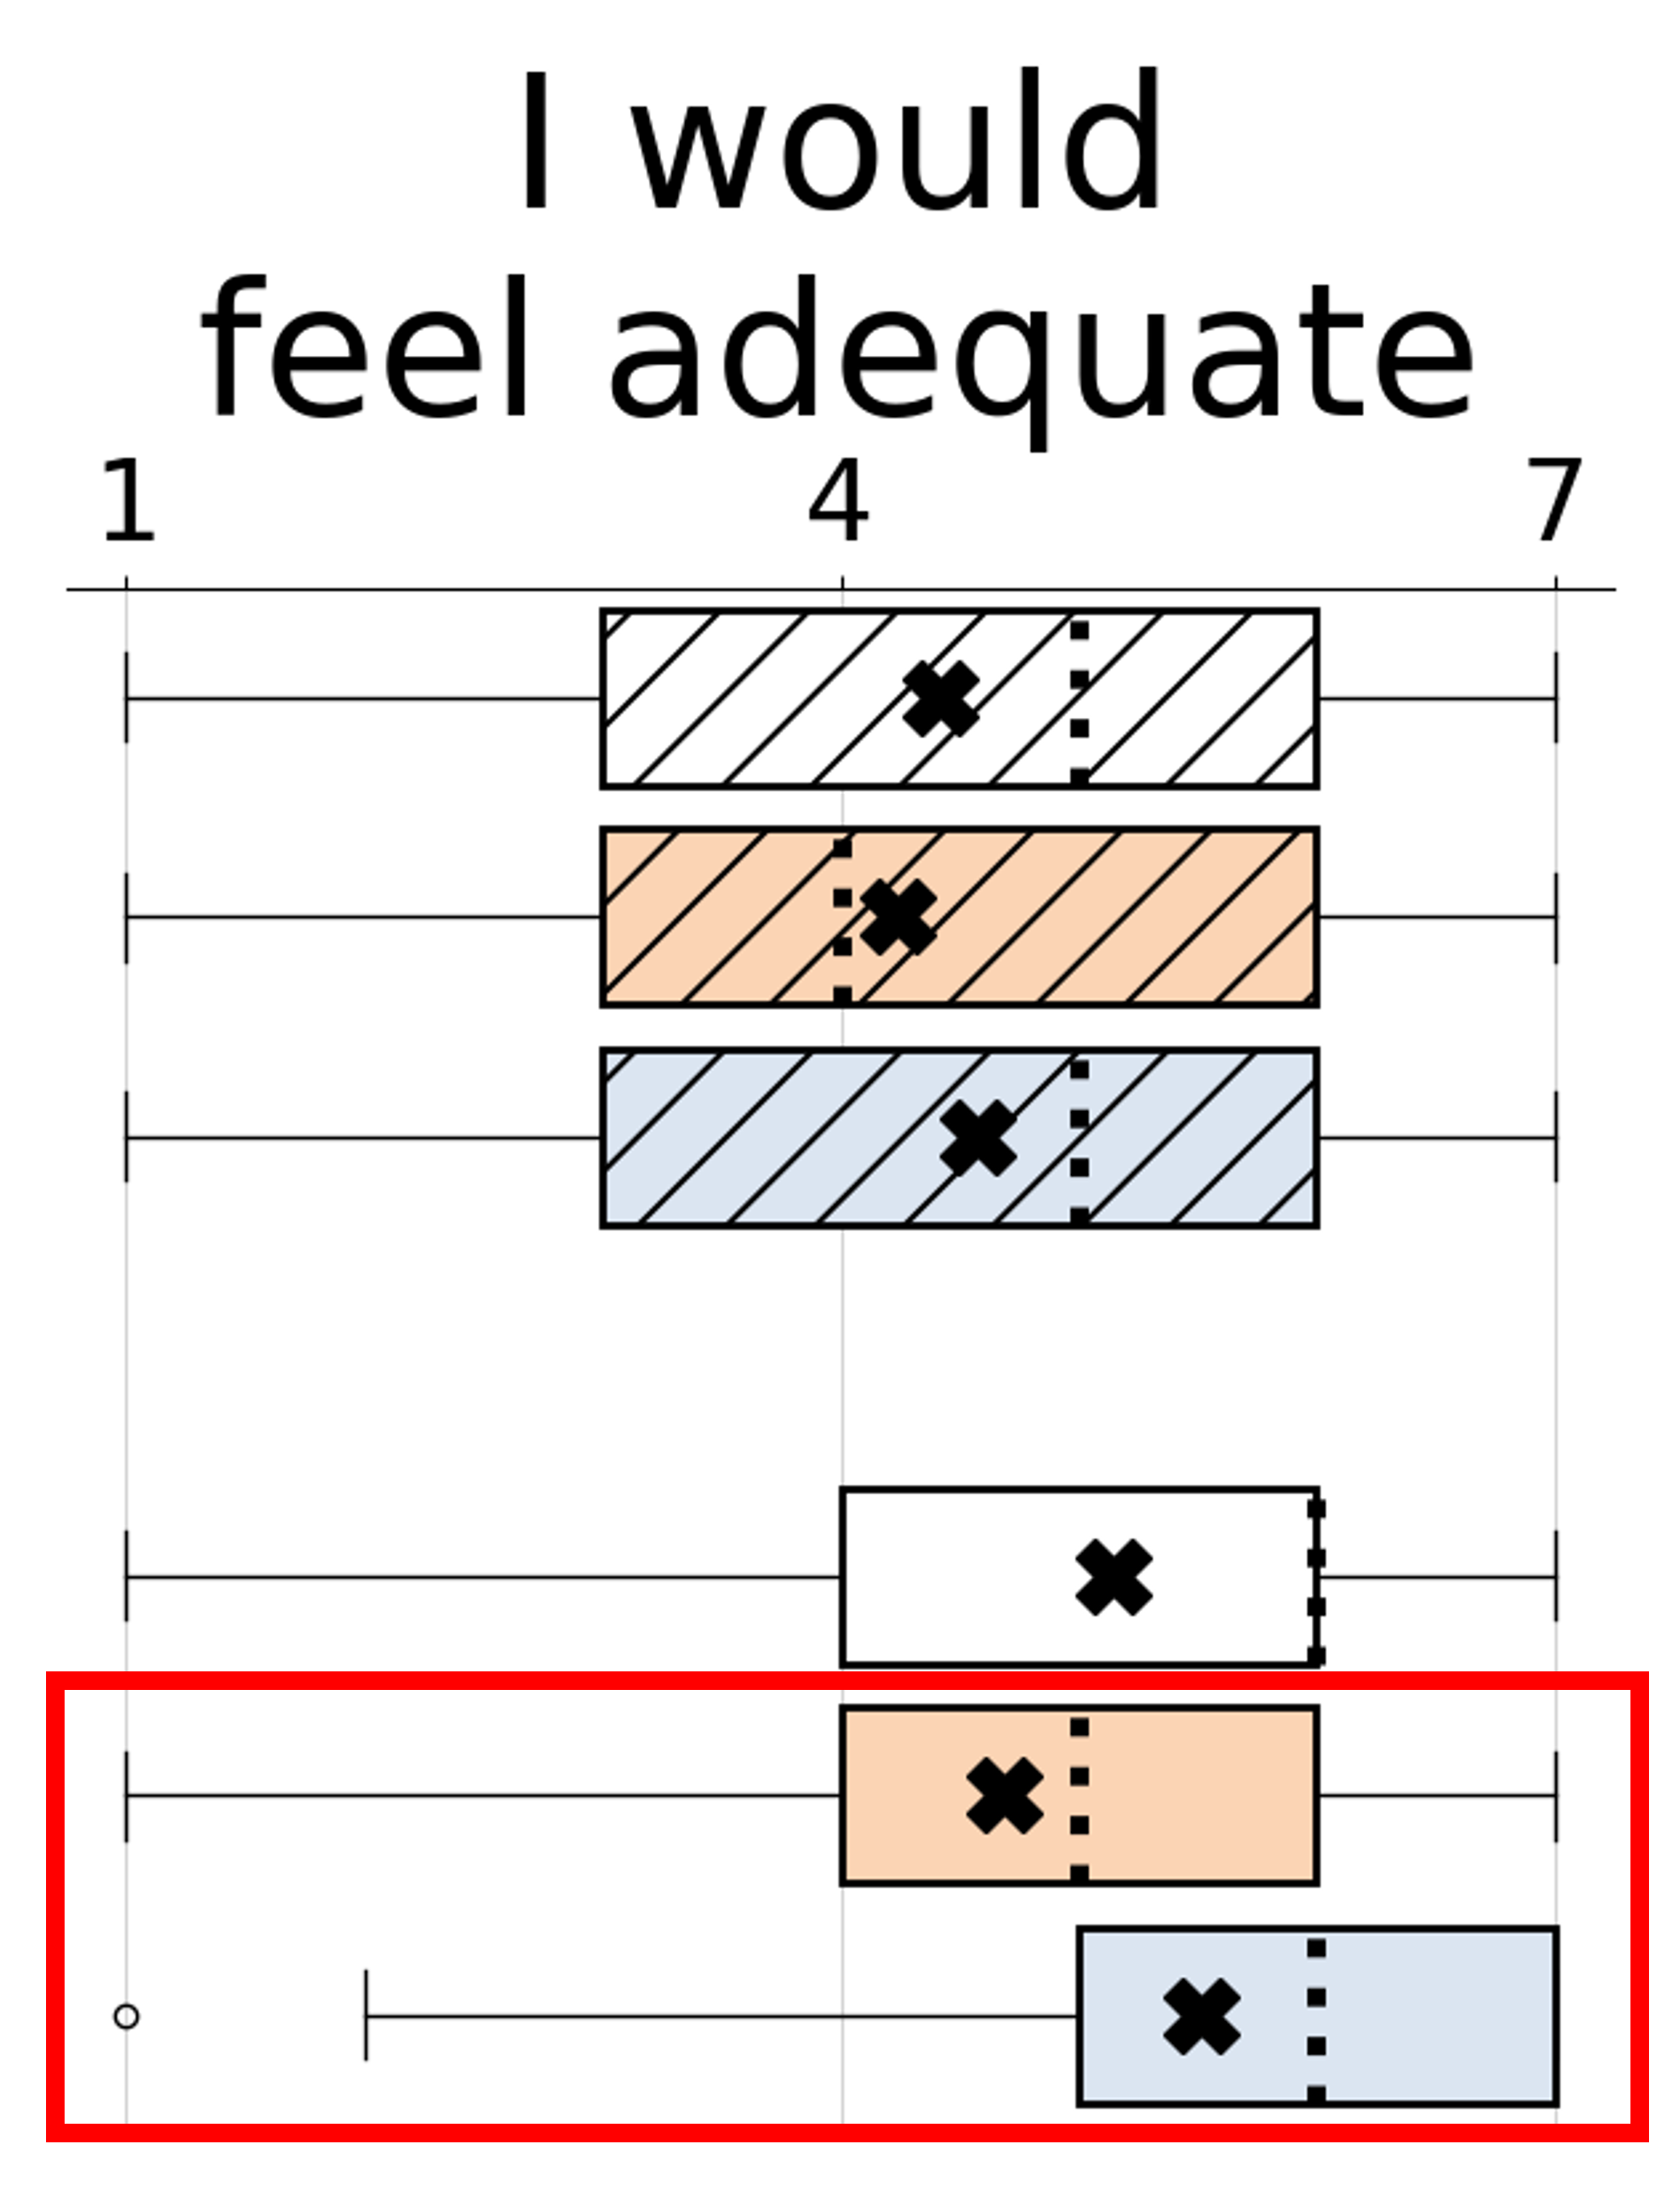
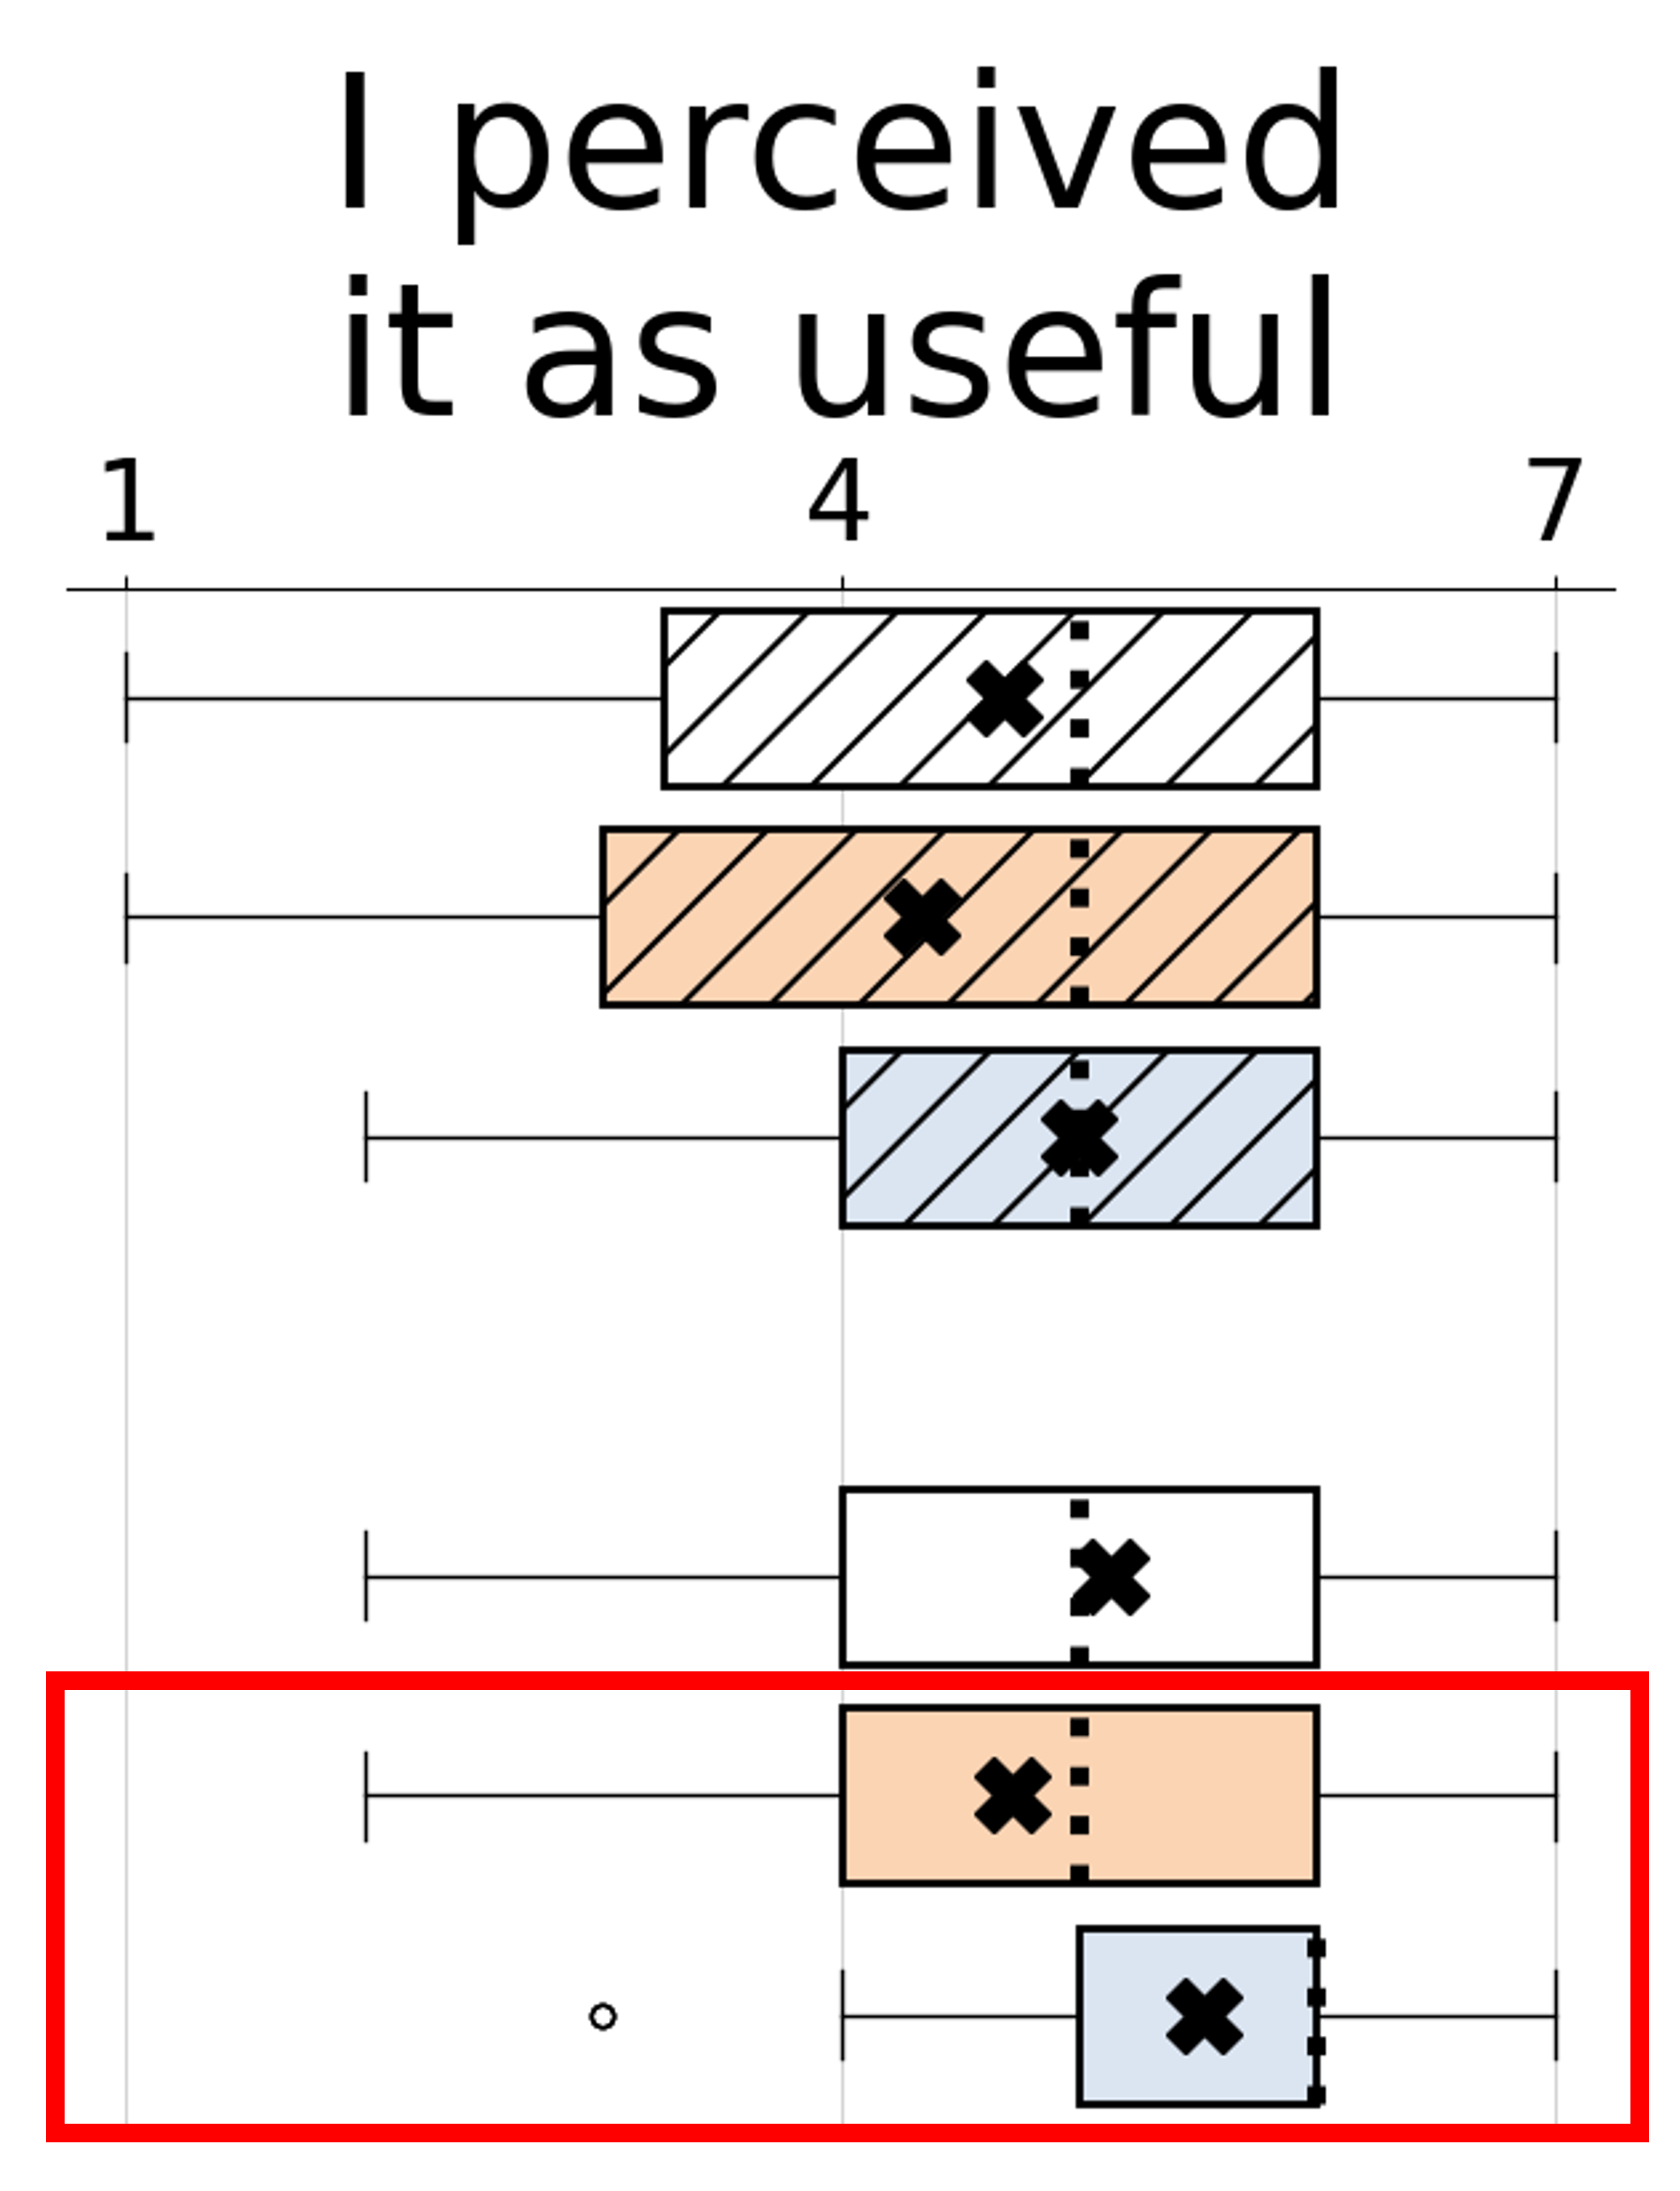
Of the three patterns, this pattern occurred the most frequently, with 16 instances arising over eight of the experiments. Figure 5 shows an instance of Pattern #2 from each of these experiments.
 |
 |
 |
 |
 |
 |
 |
 |
||||||||
| t(63) = -2.9810 | t(67) = -2.0600 | t(56) = -2.2058 | t(62) = 2.13524 | t(61) = -2.1964 | t(55) = -3.2194 | t(62) = -2.0013 | t(64) = -2.8148 | ||||||||
| p: .0040 | d: .744 | p: .0433 | d: .497 | p: .0320 | d: .582 | p: .0350 | d: .539 | p: .0320 | d: .554 | p: .0020 | d: .854 | p: .0497 | d: .503 | p: .0060 | d: .694 |
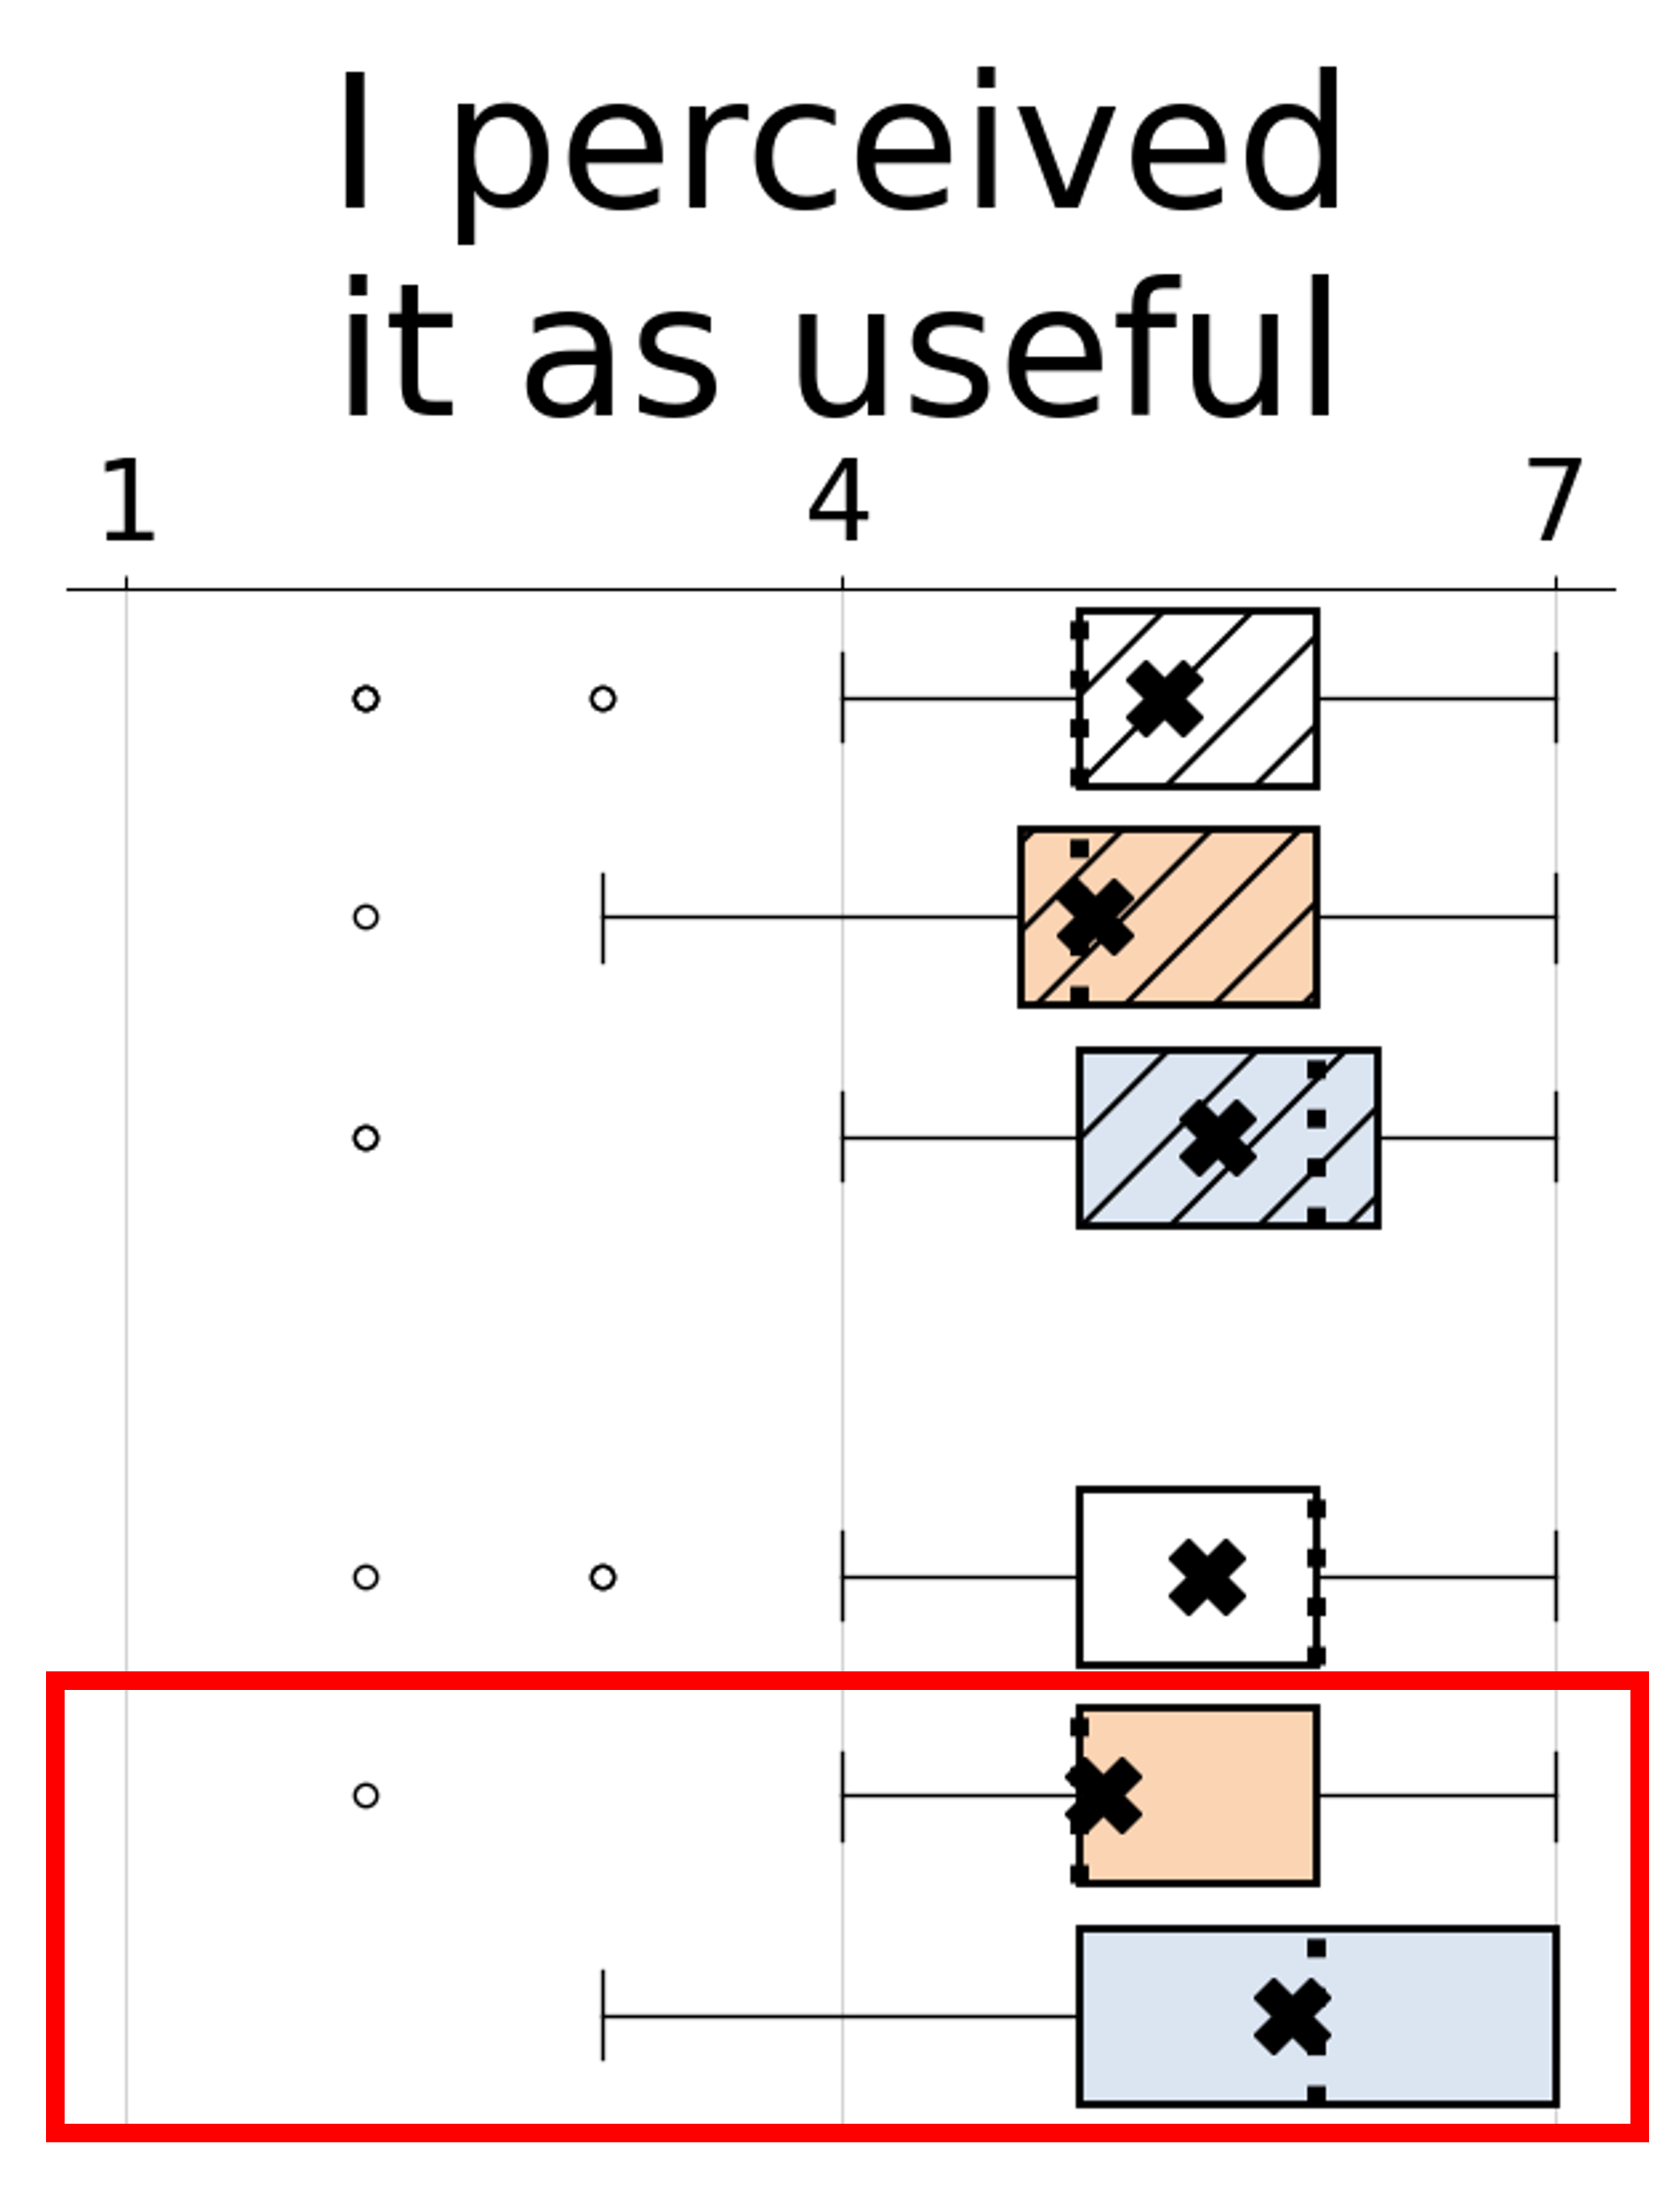
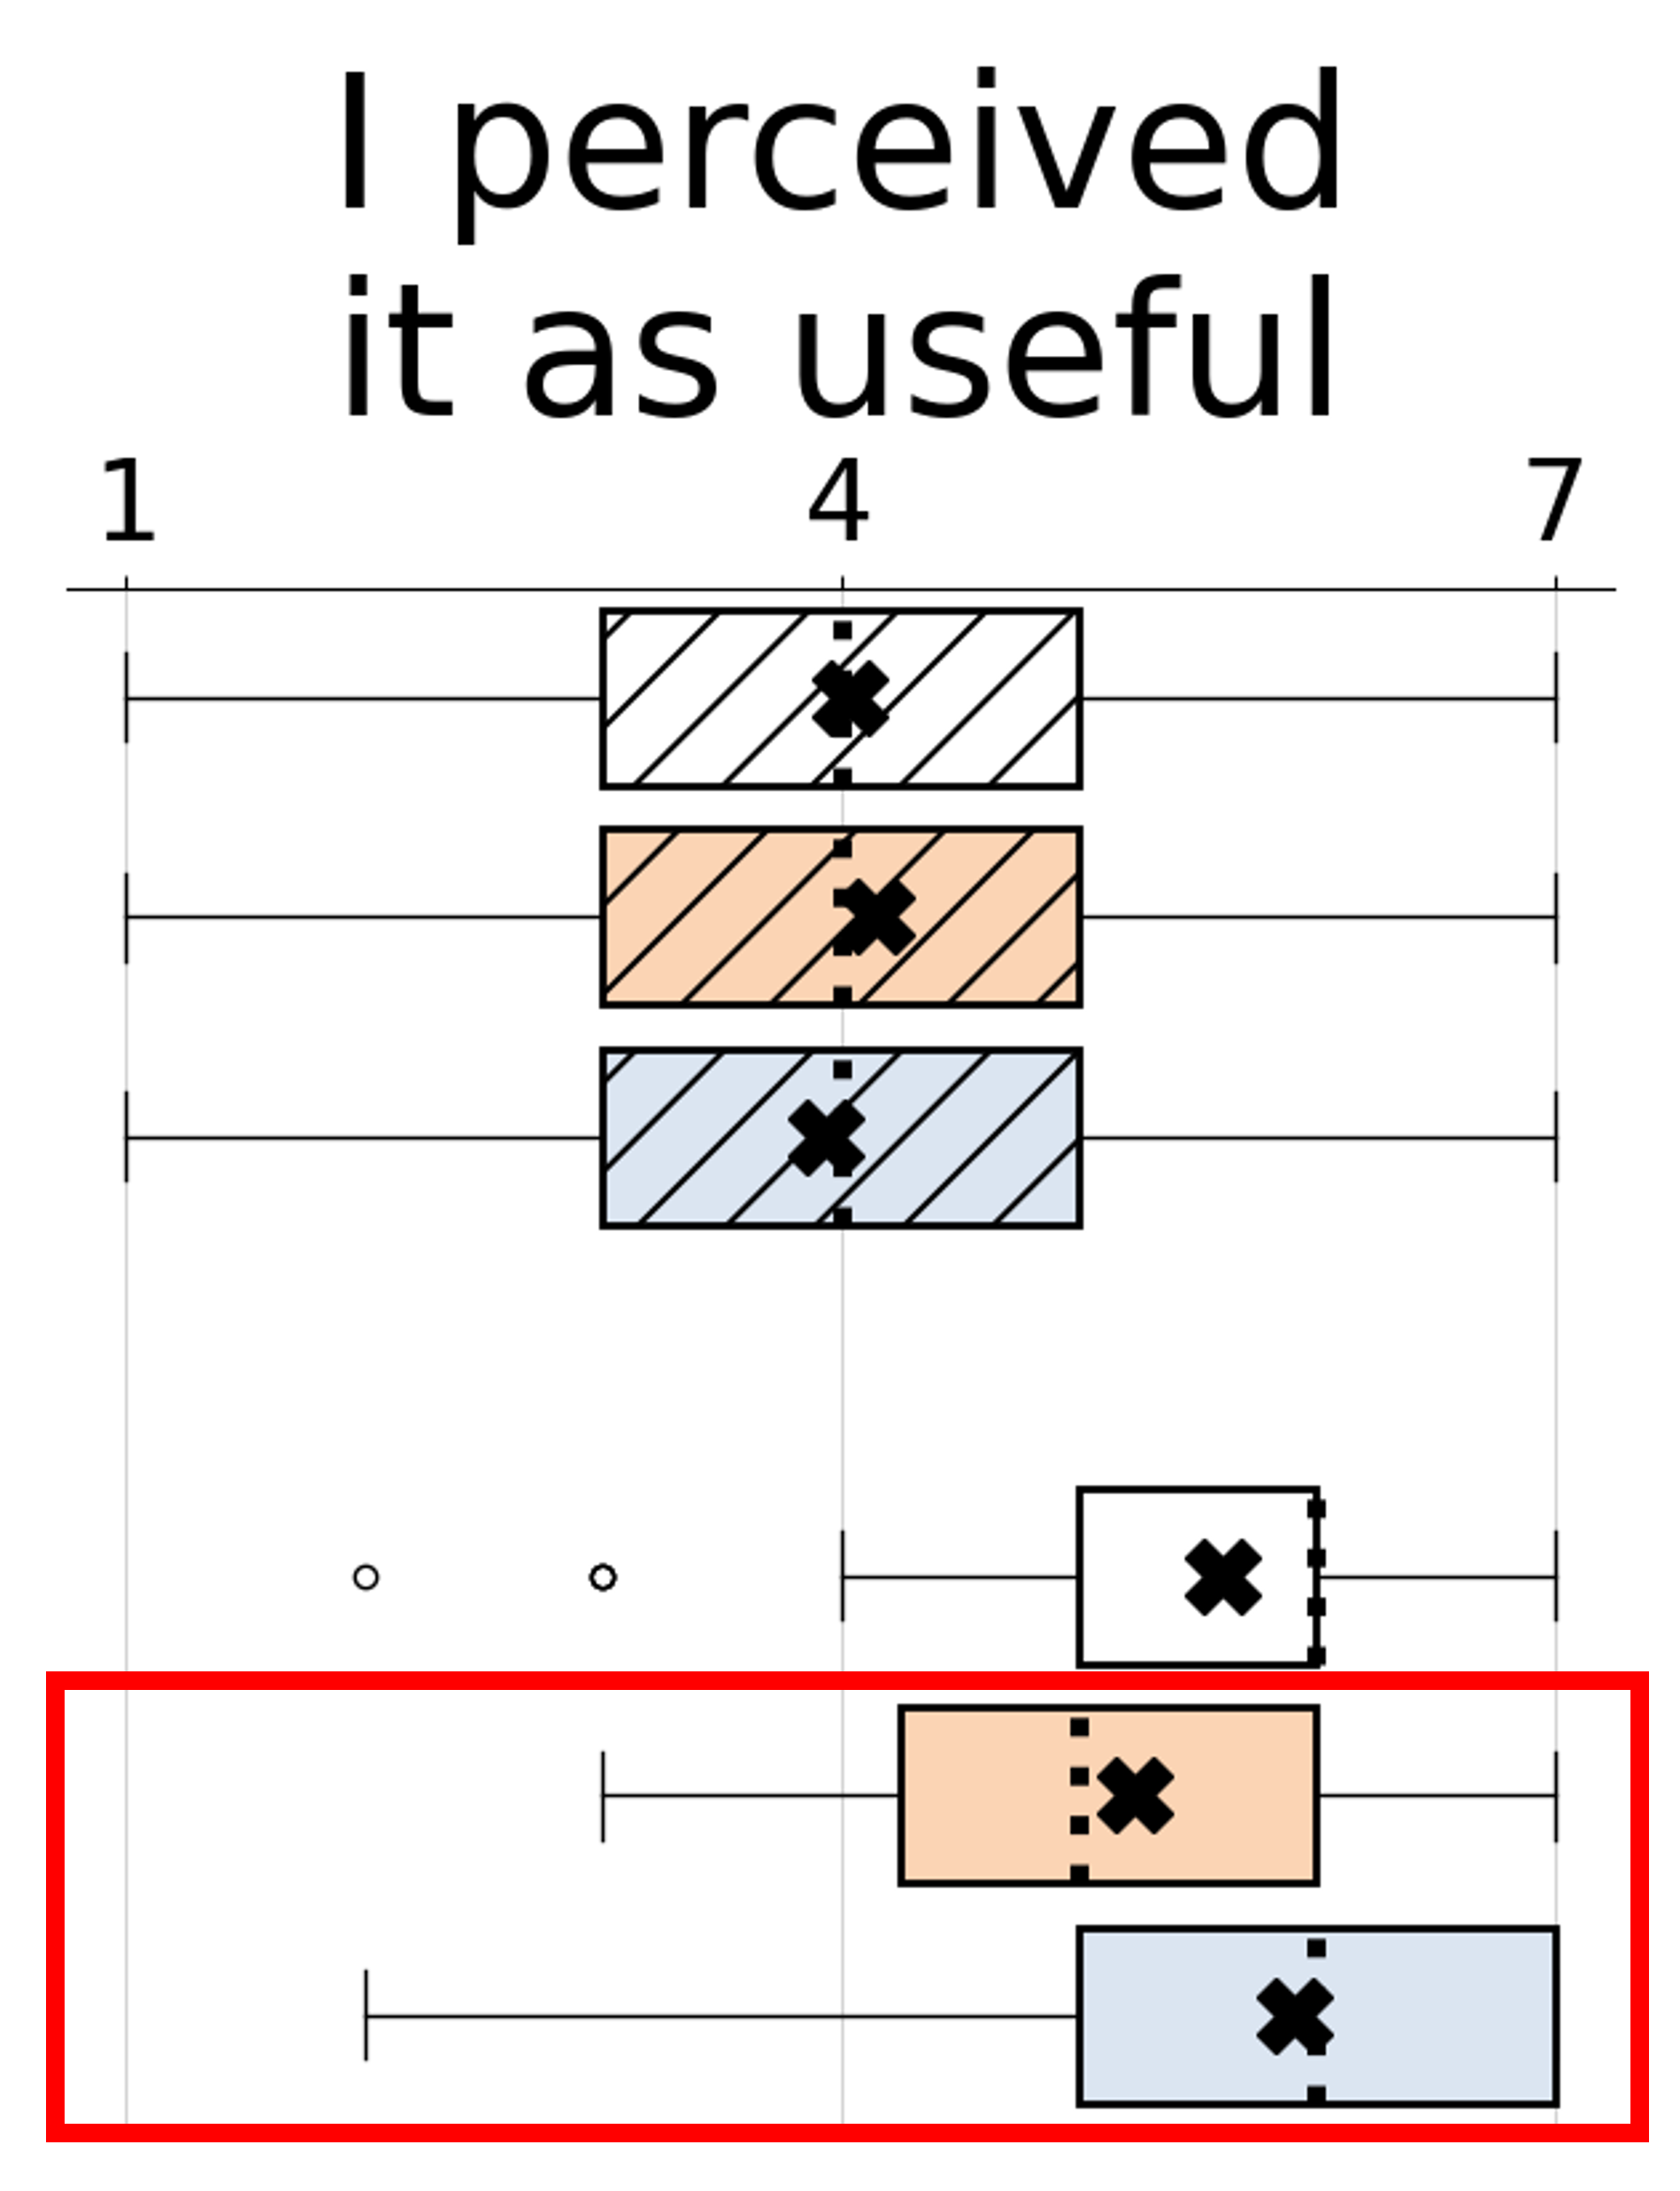
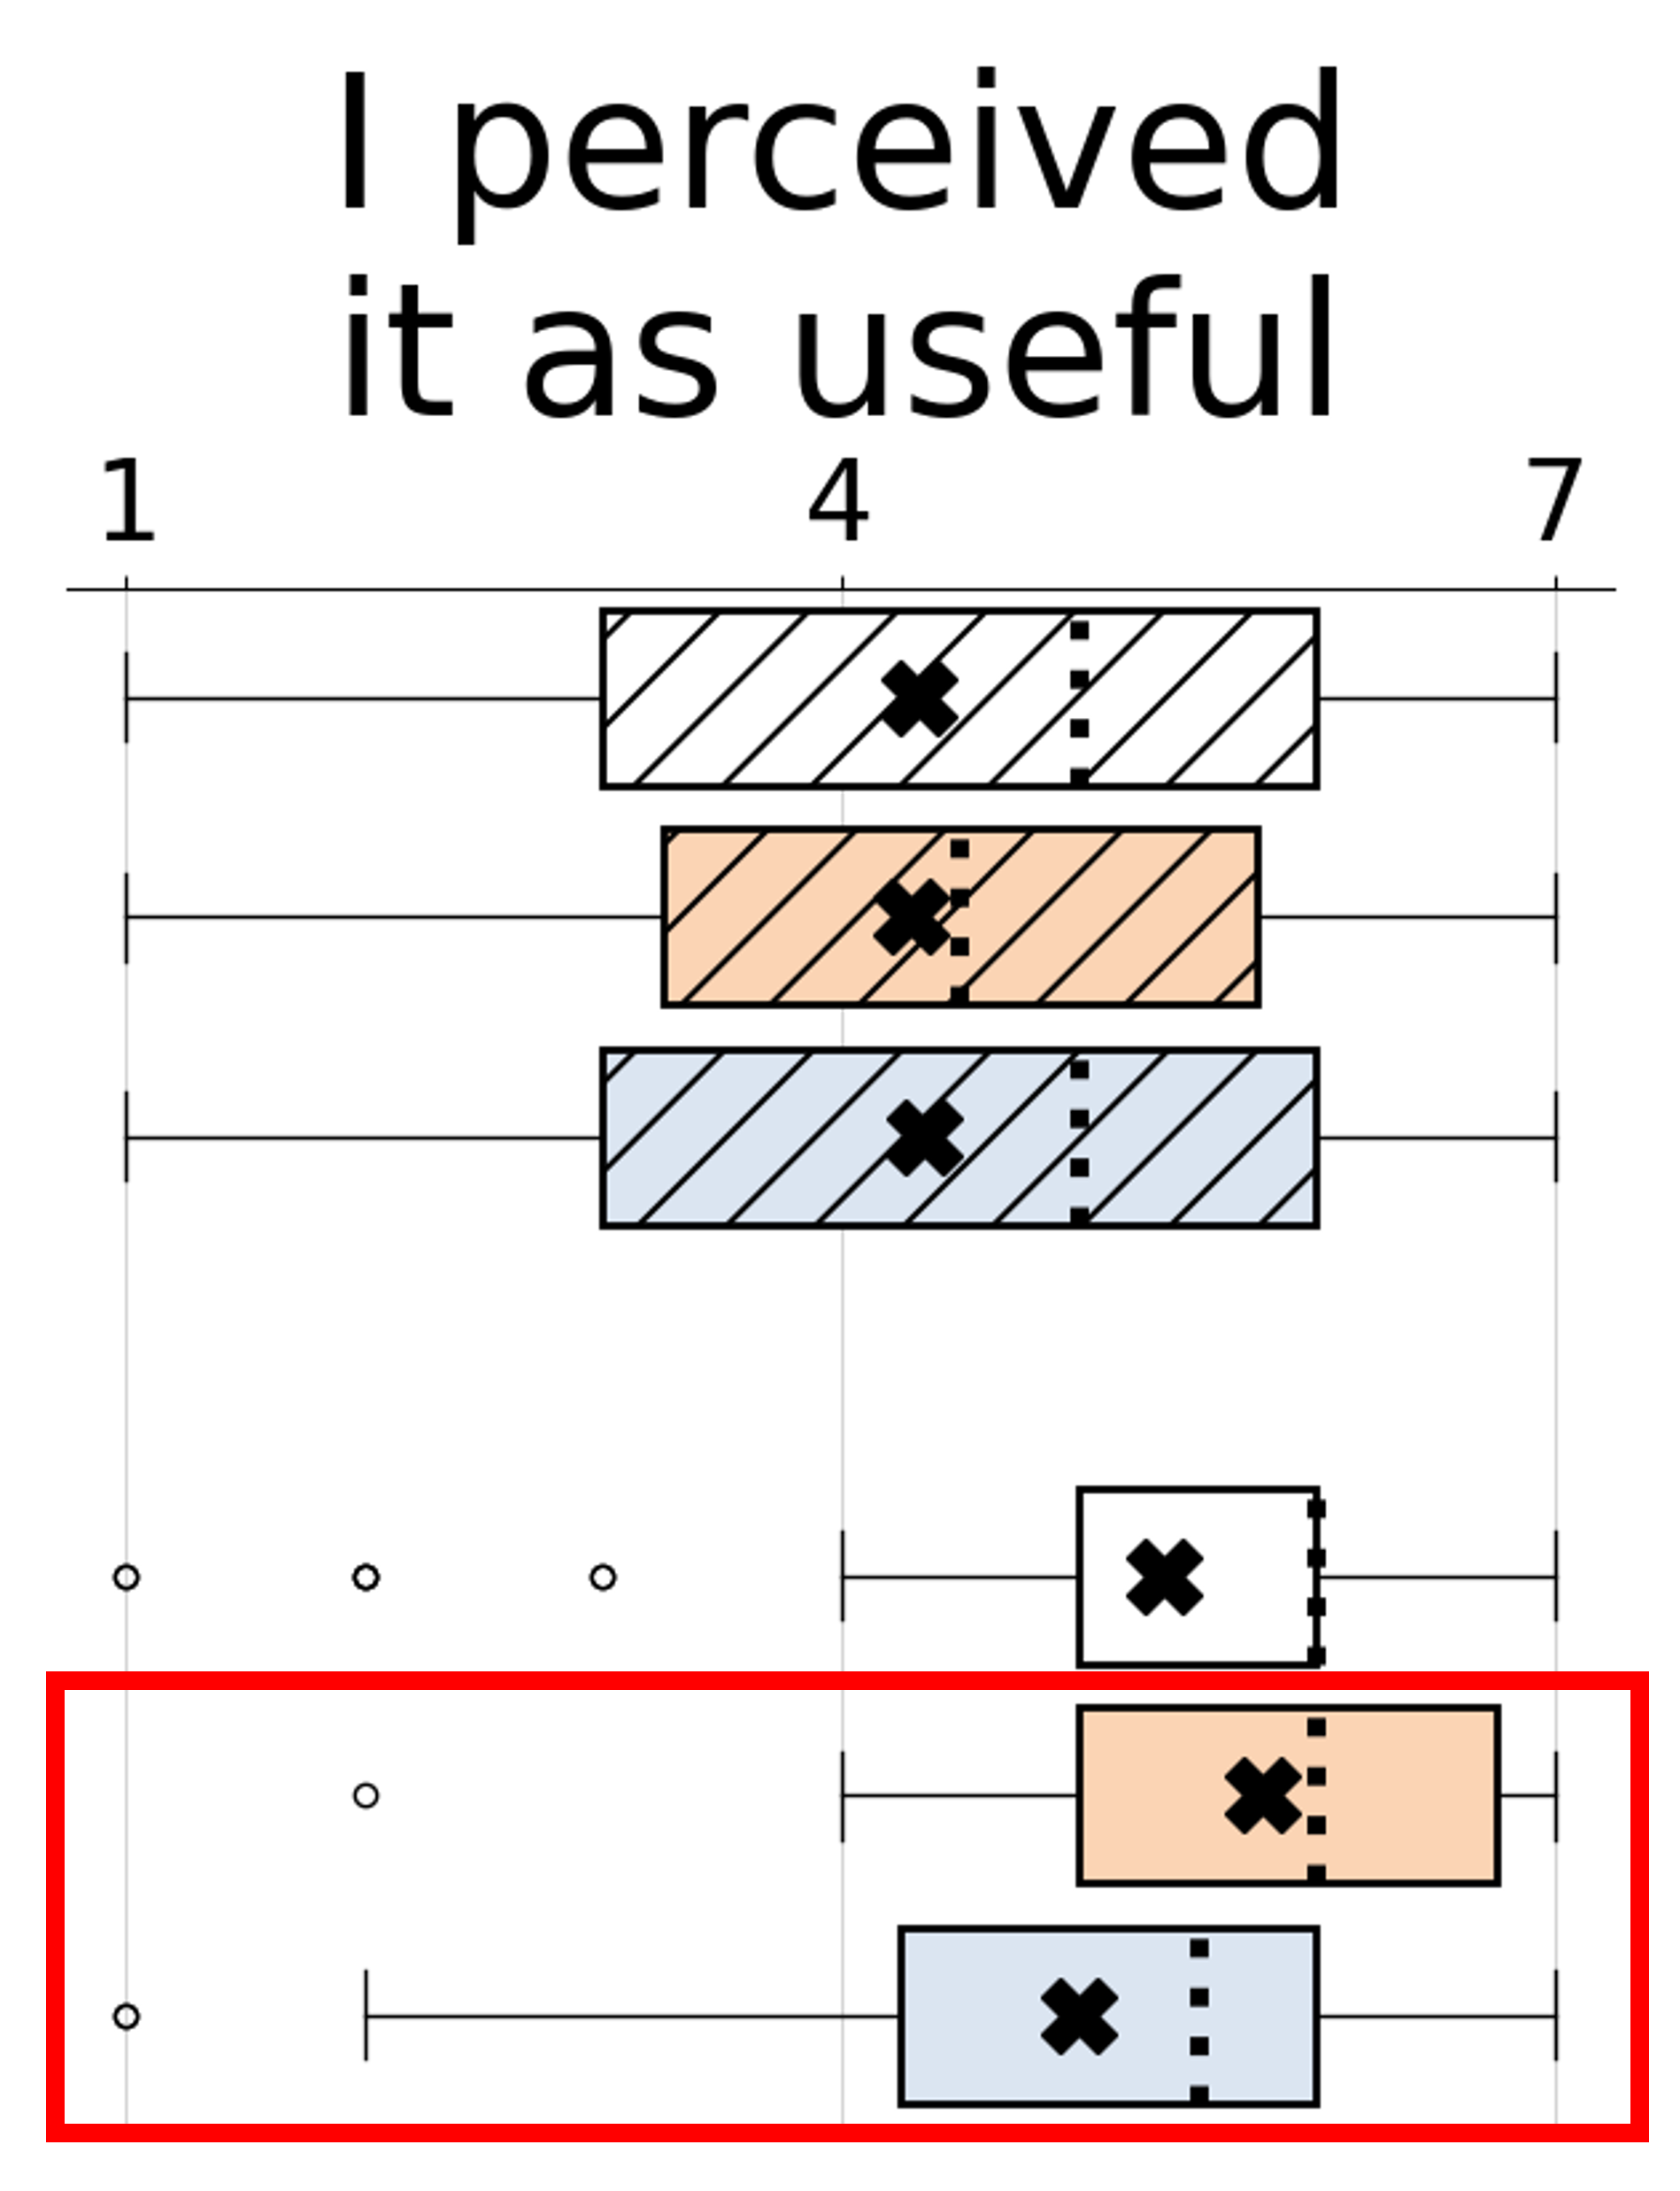
For example, in Guideline 4’s experiment (left), the risk-averse and risk-tolerant participants’ rated the Violation AI product similarly useful on average (i.e., the distance between their average ratings was less than 0.5). Although both the risk-averse and risk-tolerant participants rated the usefulness of the Application AI product higher on average, the risk-averse participants benefited less than the risk-tolerant: risk-averse participants reported the Application AI product to be significantly less useful (t(63) = -2.9810, p = .004, d = .744) than their risk-tolerant peers did. Guideline 4 is discussed in more detail in Section 4.2.3, expanding upon why such patterns may have arisen in these data.
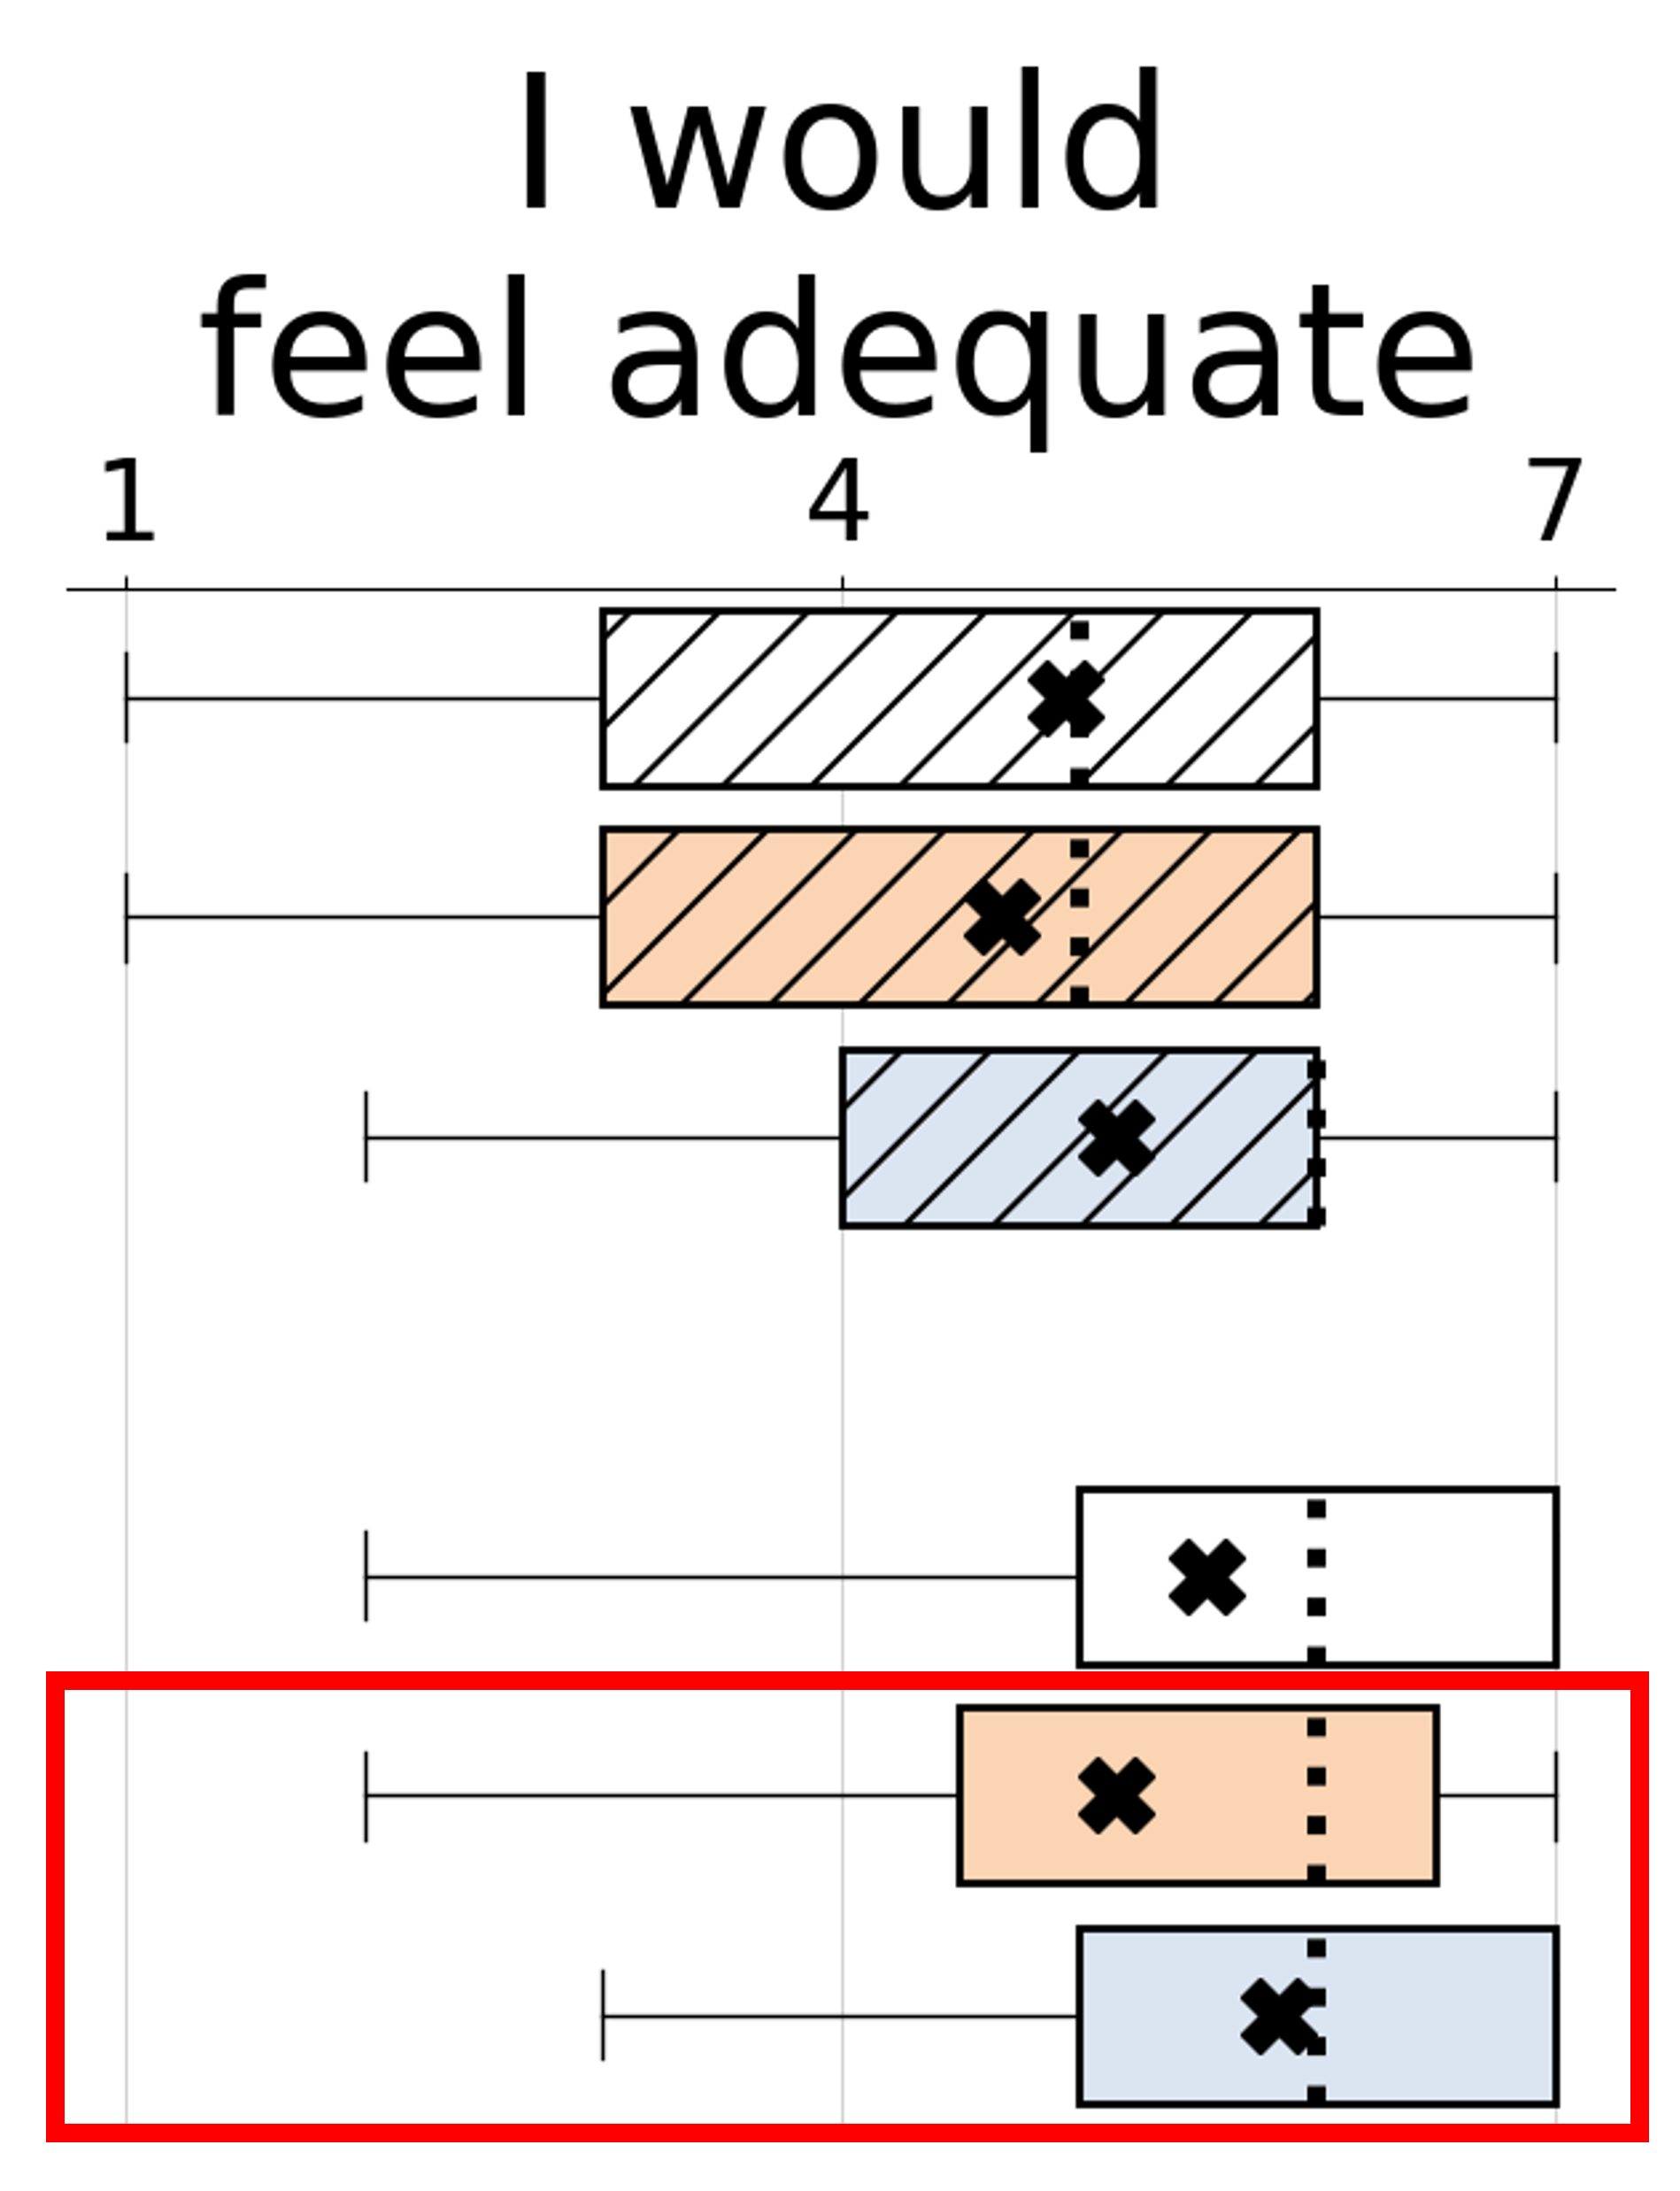
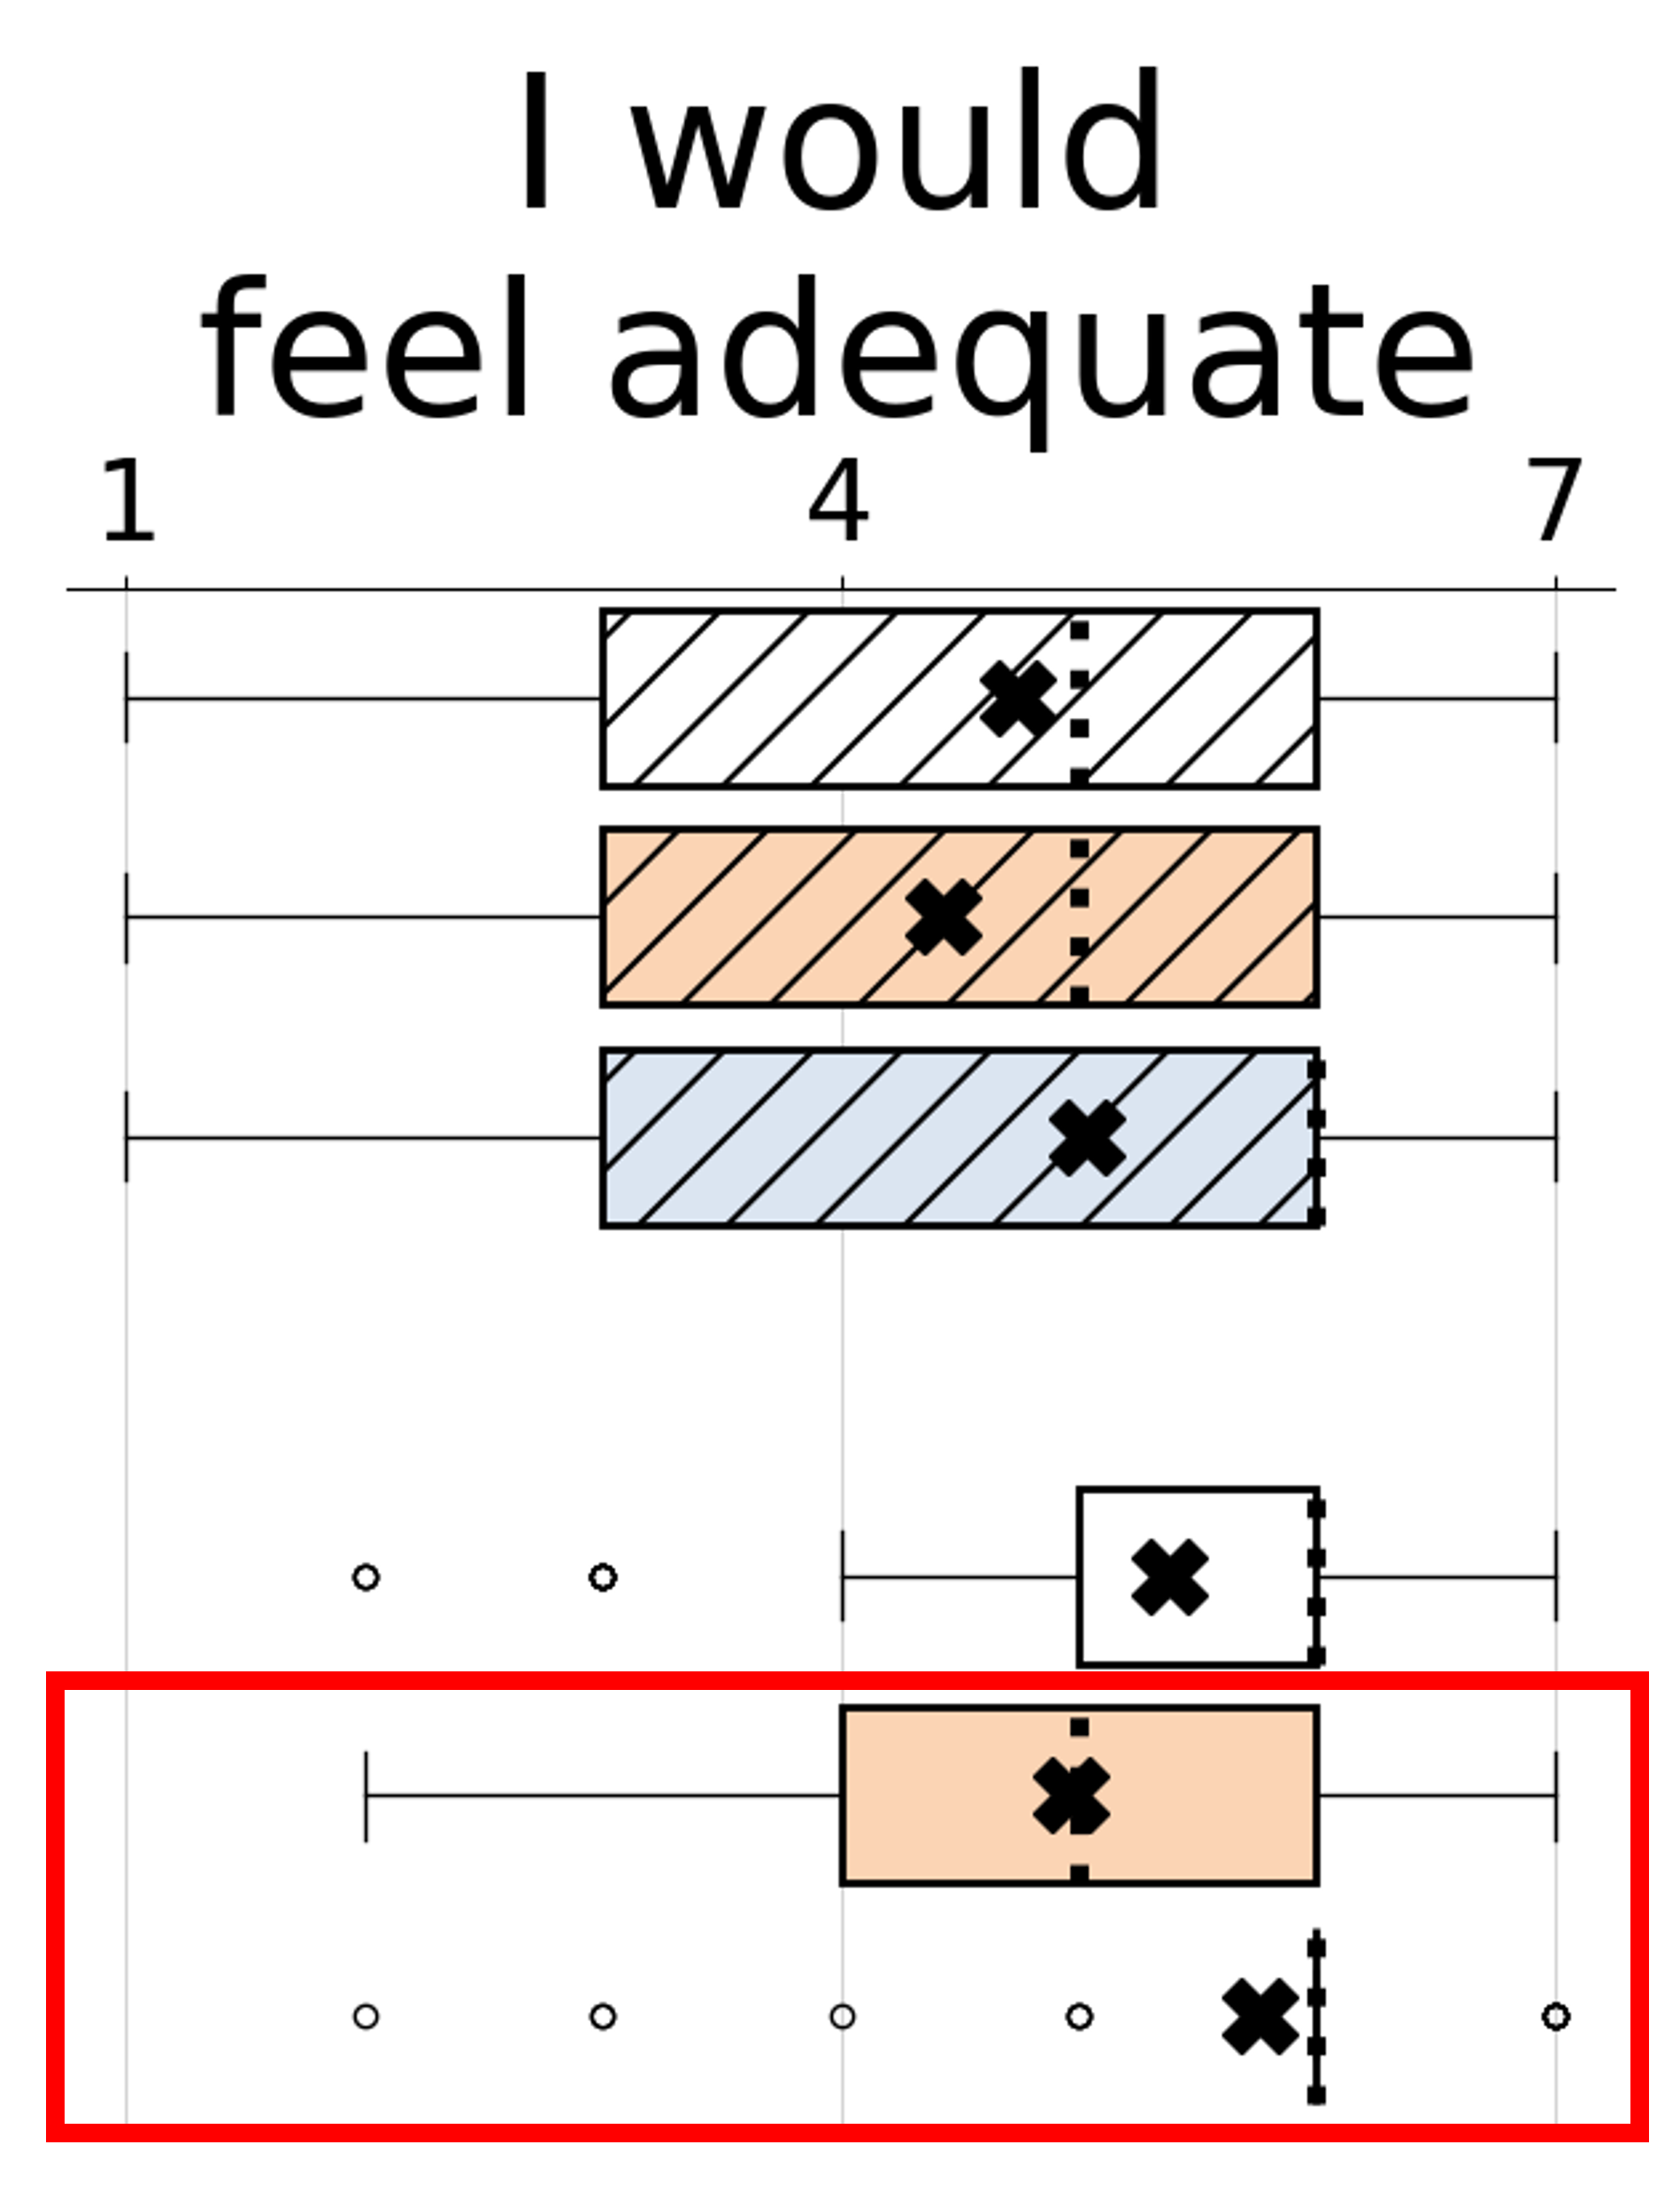
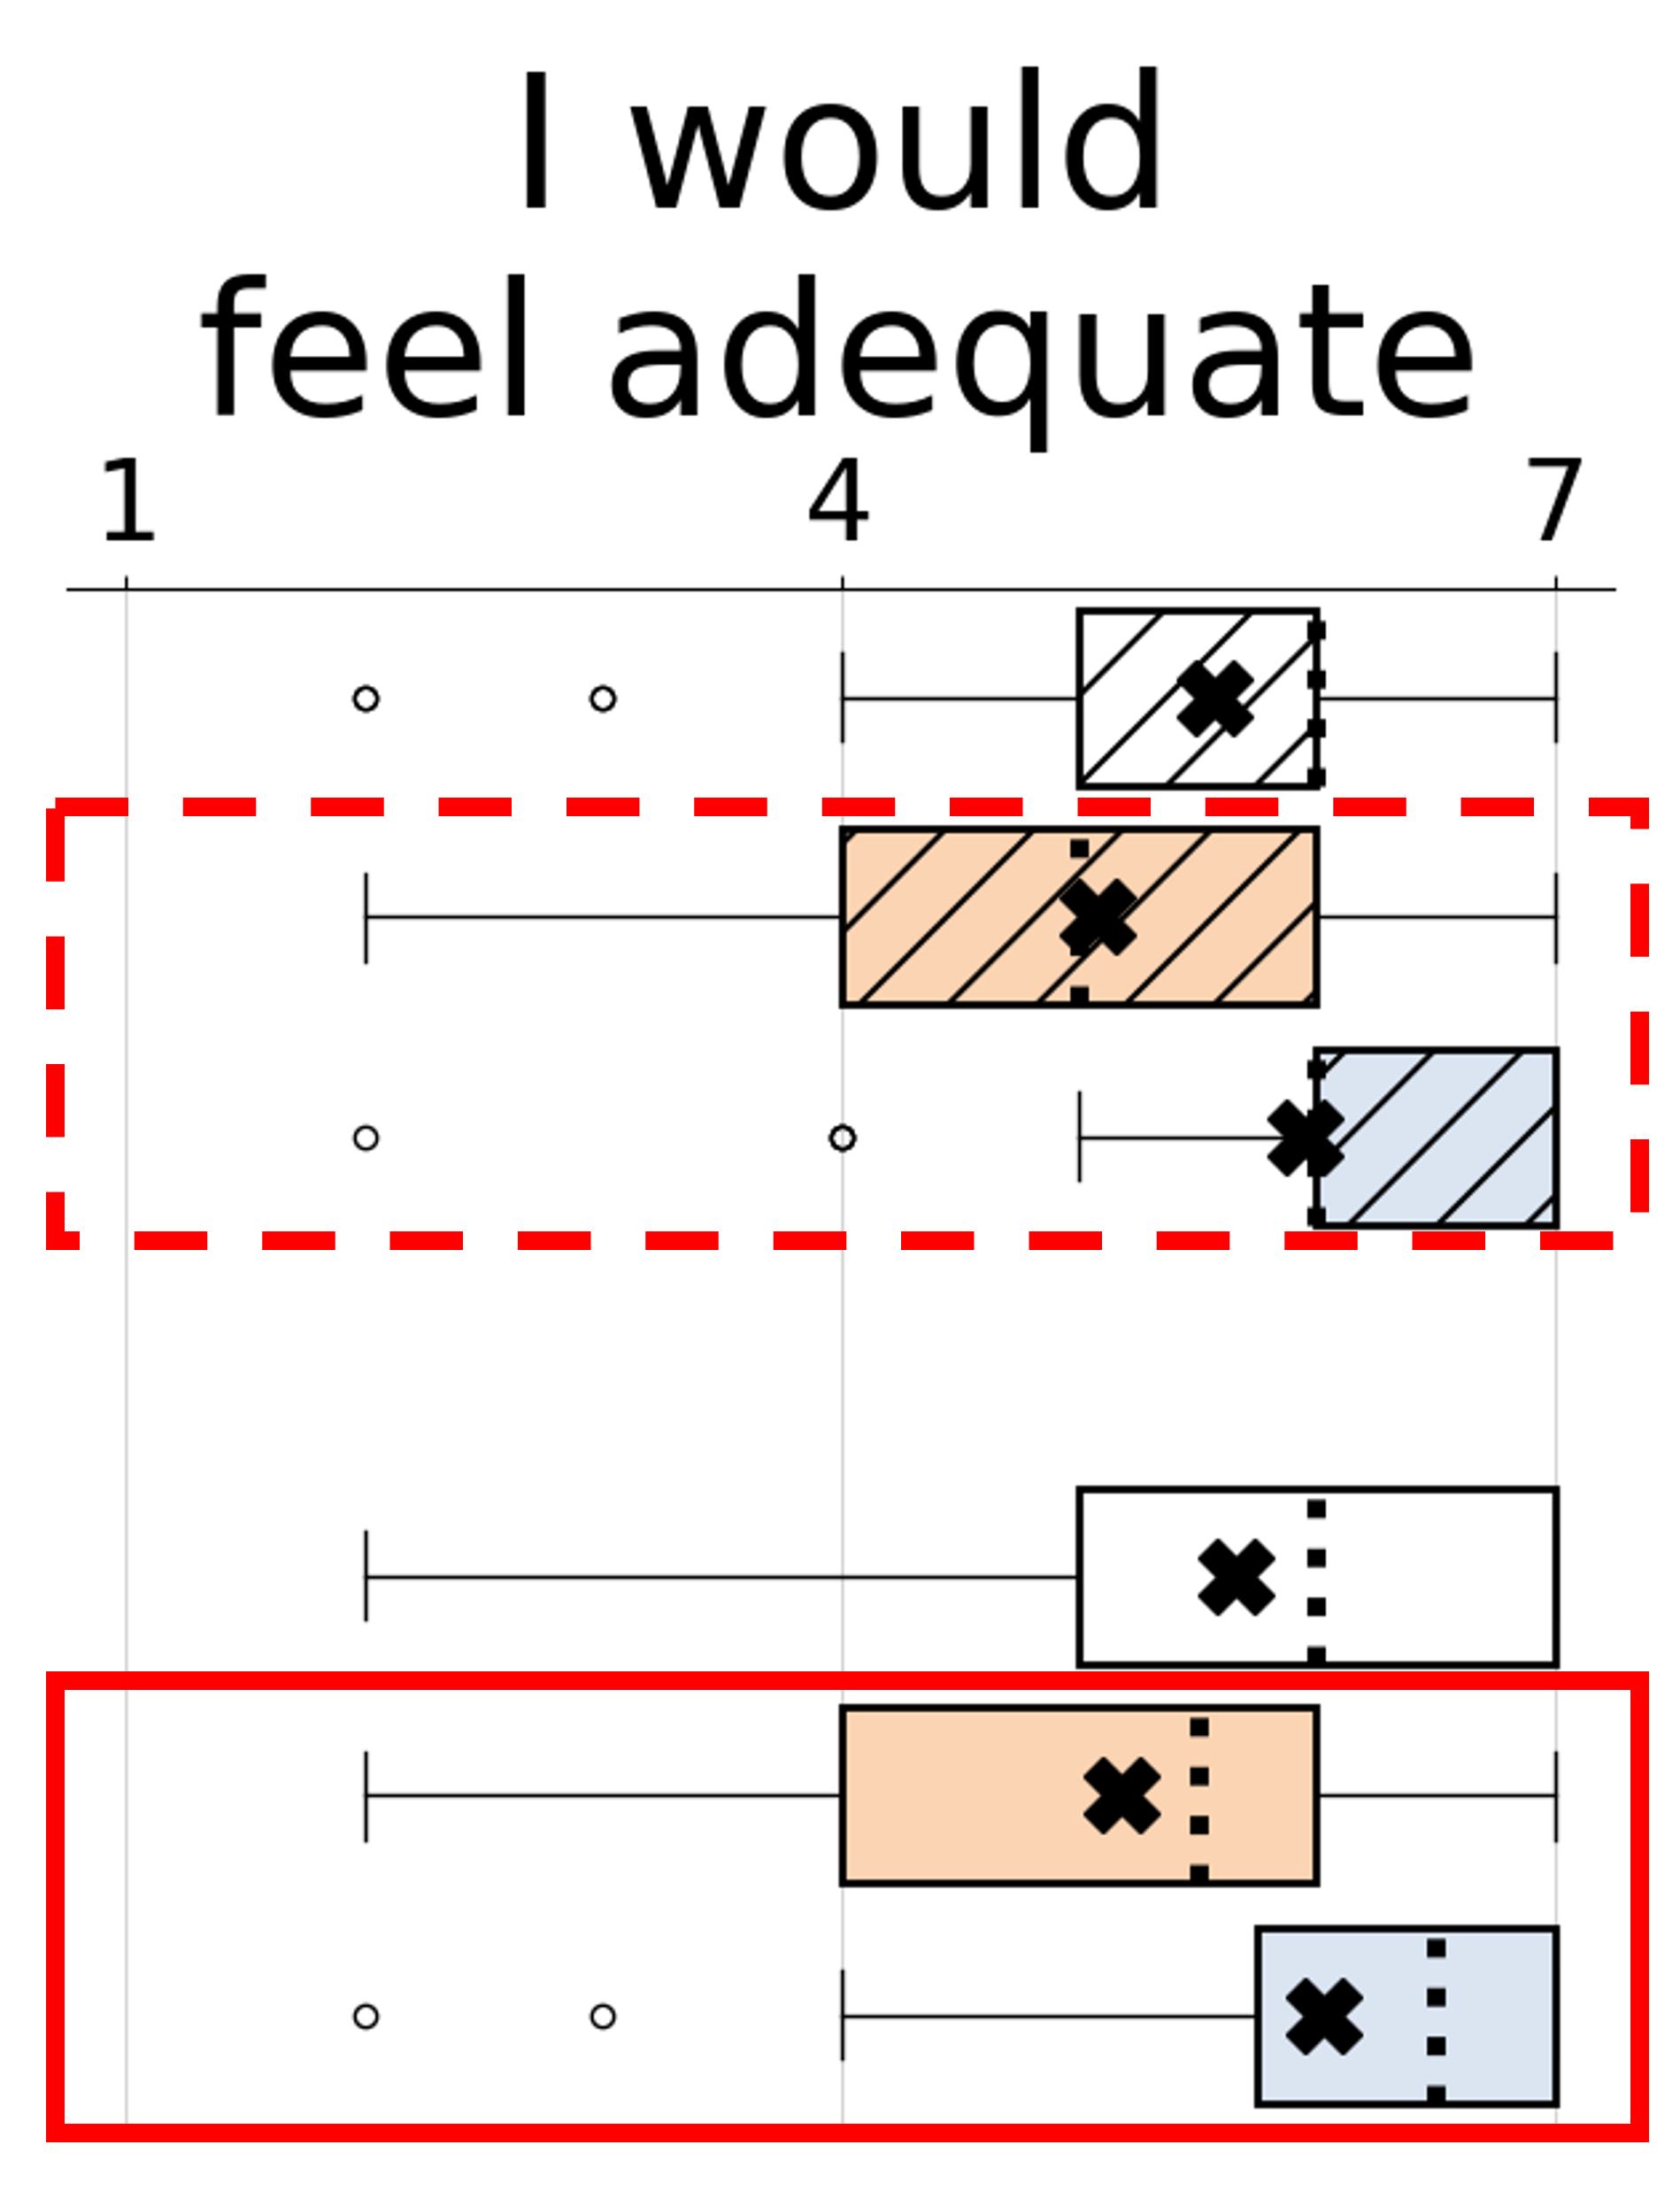
Across the eight experiments exhibiting this pattern, two dependent variables were especially common: the “I perceived it as useful” (Guidelines 4, 9, 10, and 18) and “I would feel adequate” (Guidelines 5, 11, 13, and 15) dependent variables. This raises the possibility for practitioners that, when evaluating user experiences after applying some of the guidelines in an AI product, these dependent variables may have particular pertinence to whether that design is inclusive across the full range of users’ diverse attitudes toward risk.
Implications for Researchers and Practitioners: The 16 occurrences of Pattern #2 reveal two implications.
First, users’ diverse attitudes toward risk can affect their experiences in multiple ways, as the significant differences across multiple dependent variables show. For researchers and practitioners who analyze user data, this points out the need to analyze user data by not only diversity input variables (here, attitude toward risk) but also by multiple outcome variables (e.g., feeling of control).
Second, even when a design change is an inclusivity “win” by helping users with diverse values across the risk cognitive style type, inequities can remain or even emerge as the result of the change. This points out that improving inclusivity for the whole risk spectrum is not the only goal—the other goal is for the user experience to be equitable across the risk spectrum.
4.2.3. Pattern #3: Applying Guidelines Did Not Change Inclusivity
The last inclusivity pattern occurred when the risk-averse and risk-tolerant participants differed significantly from each other in their ratings, in both the Violation AI product and the Application AI product.
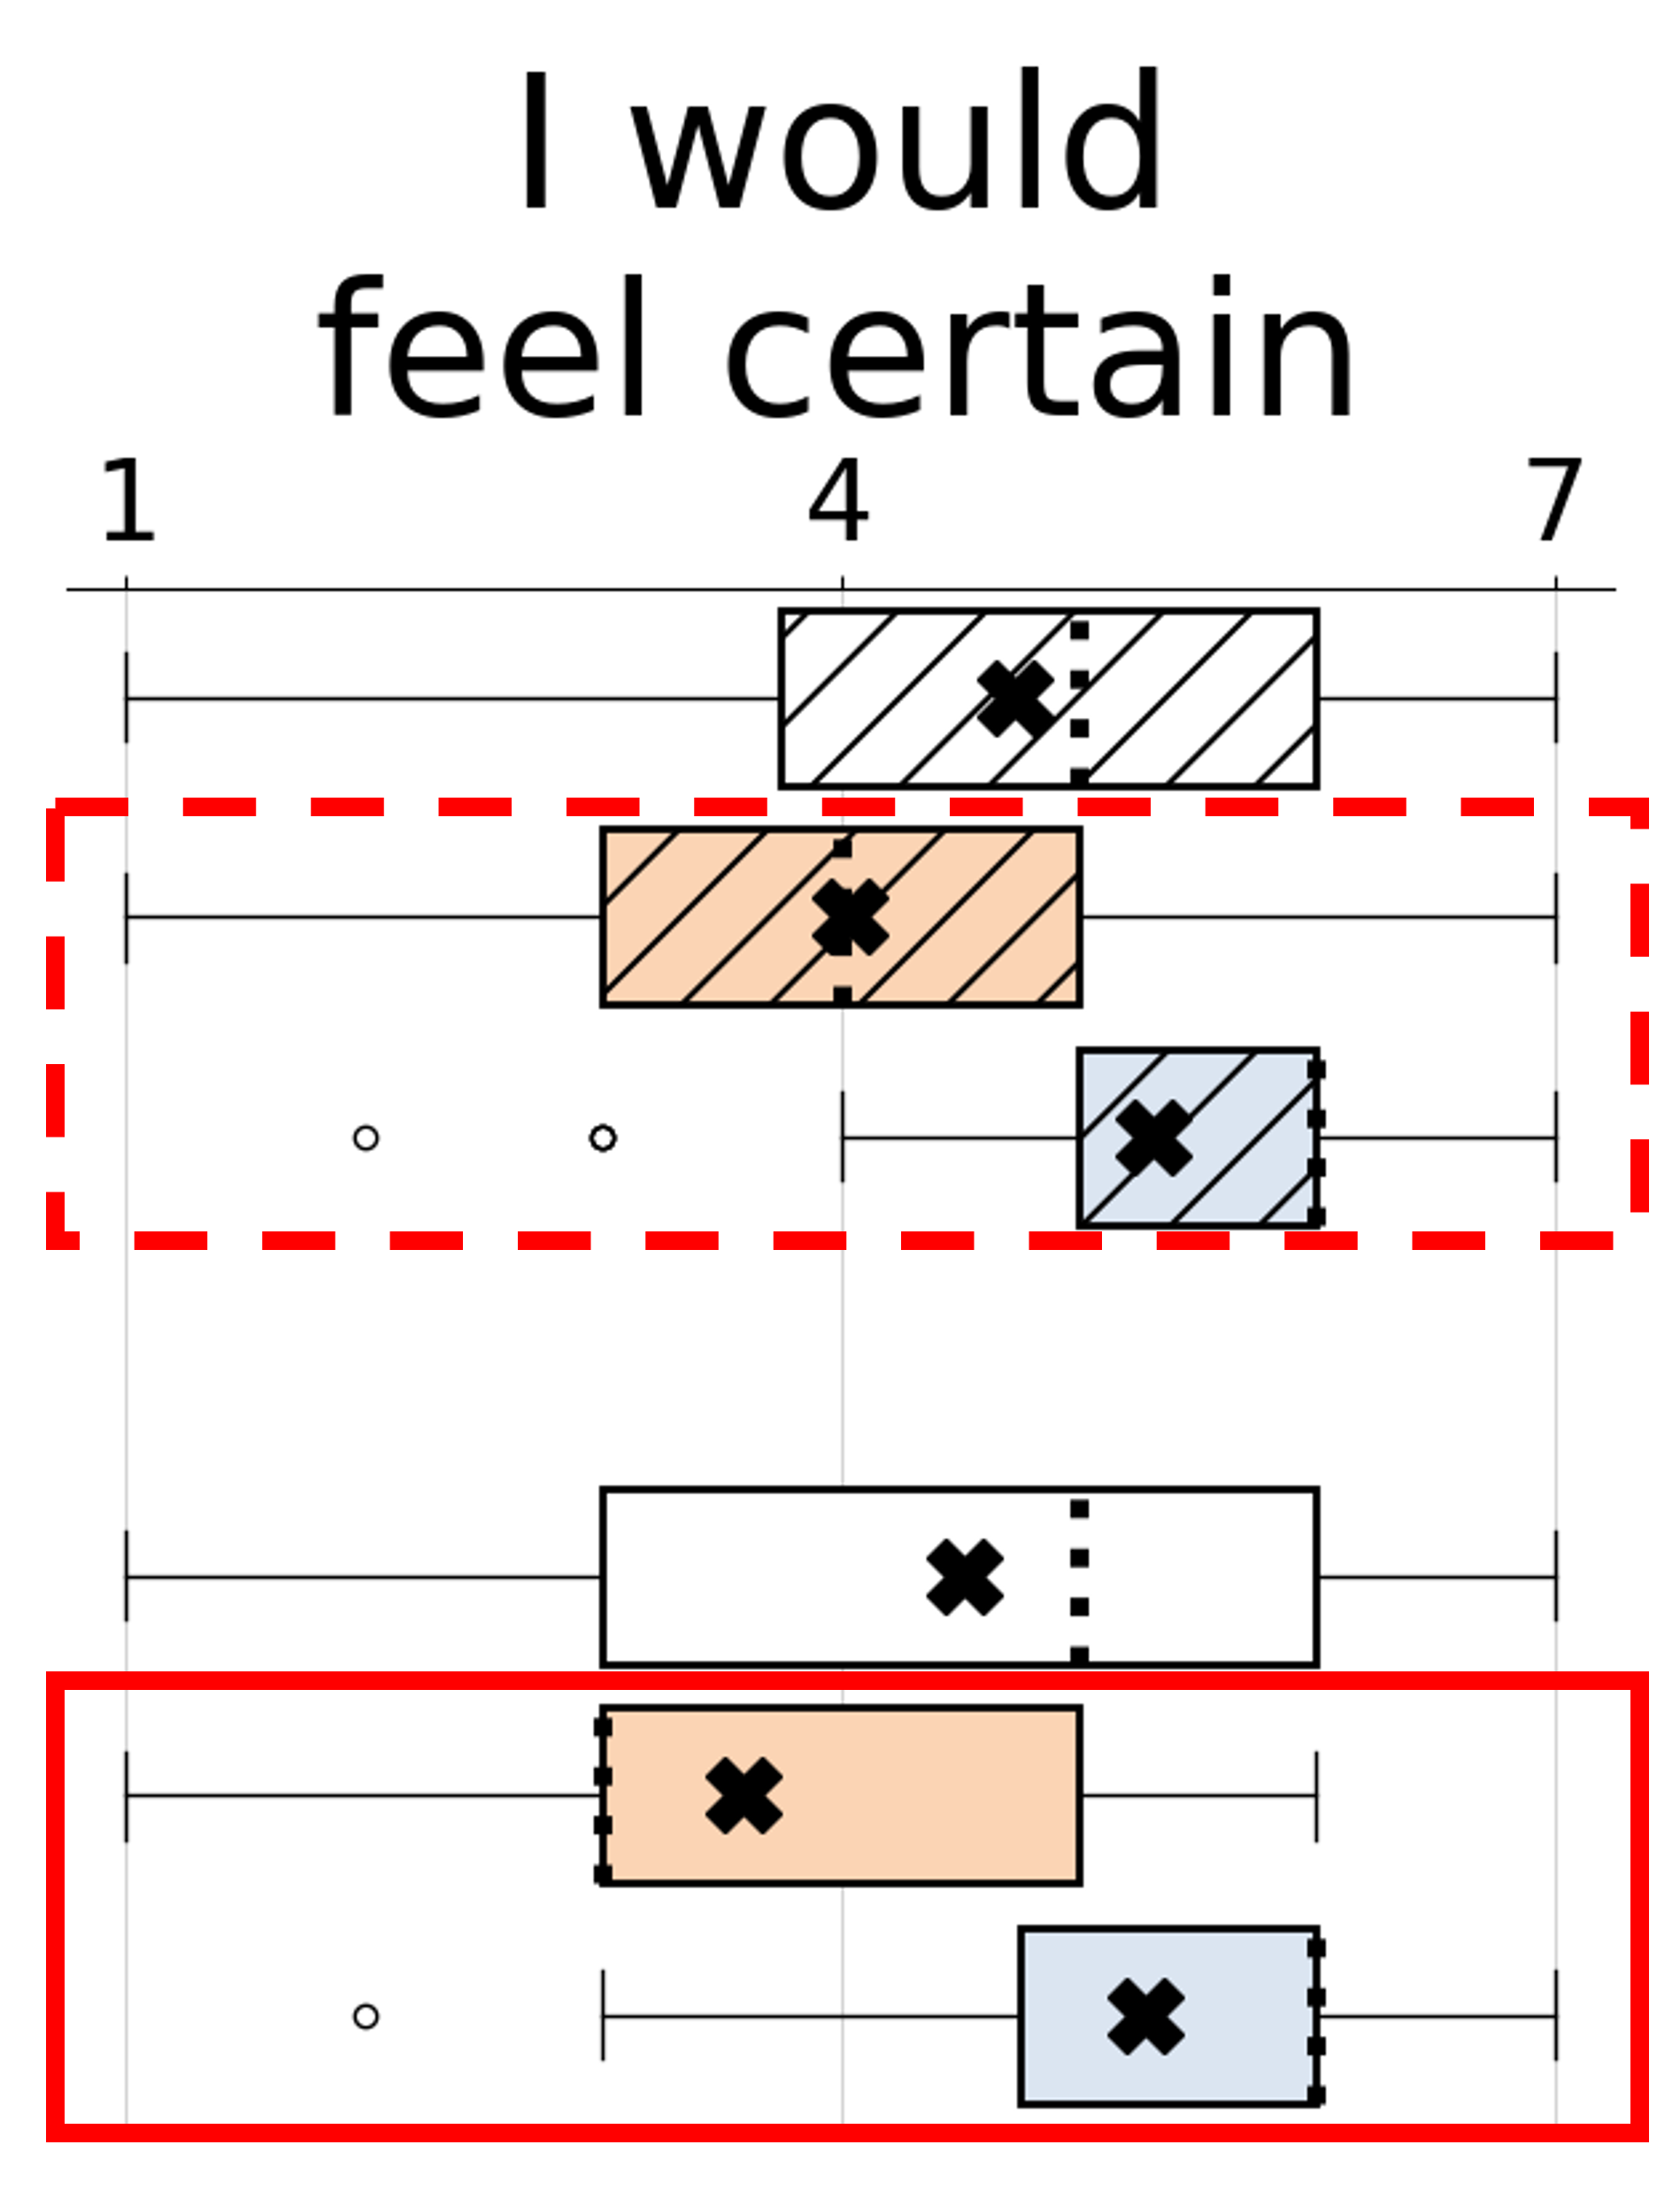
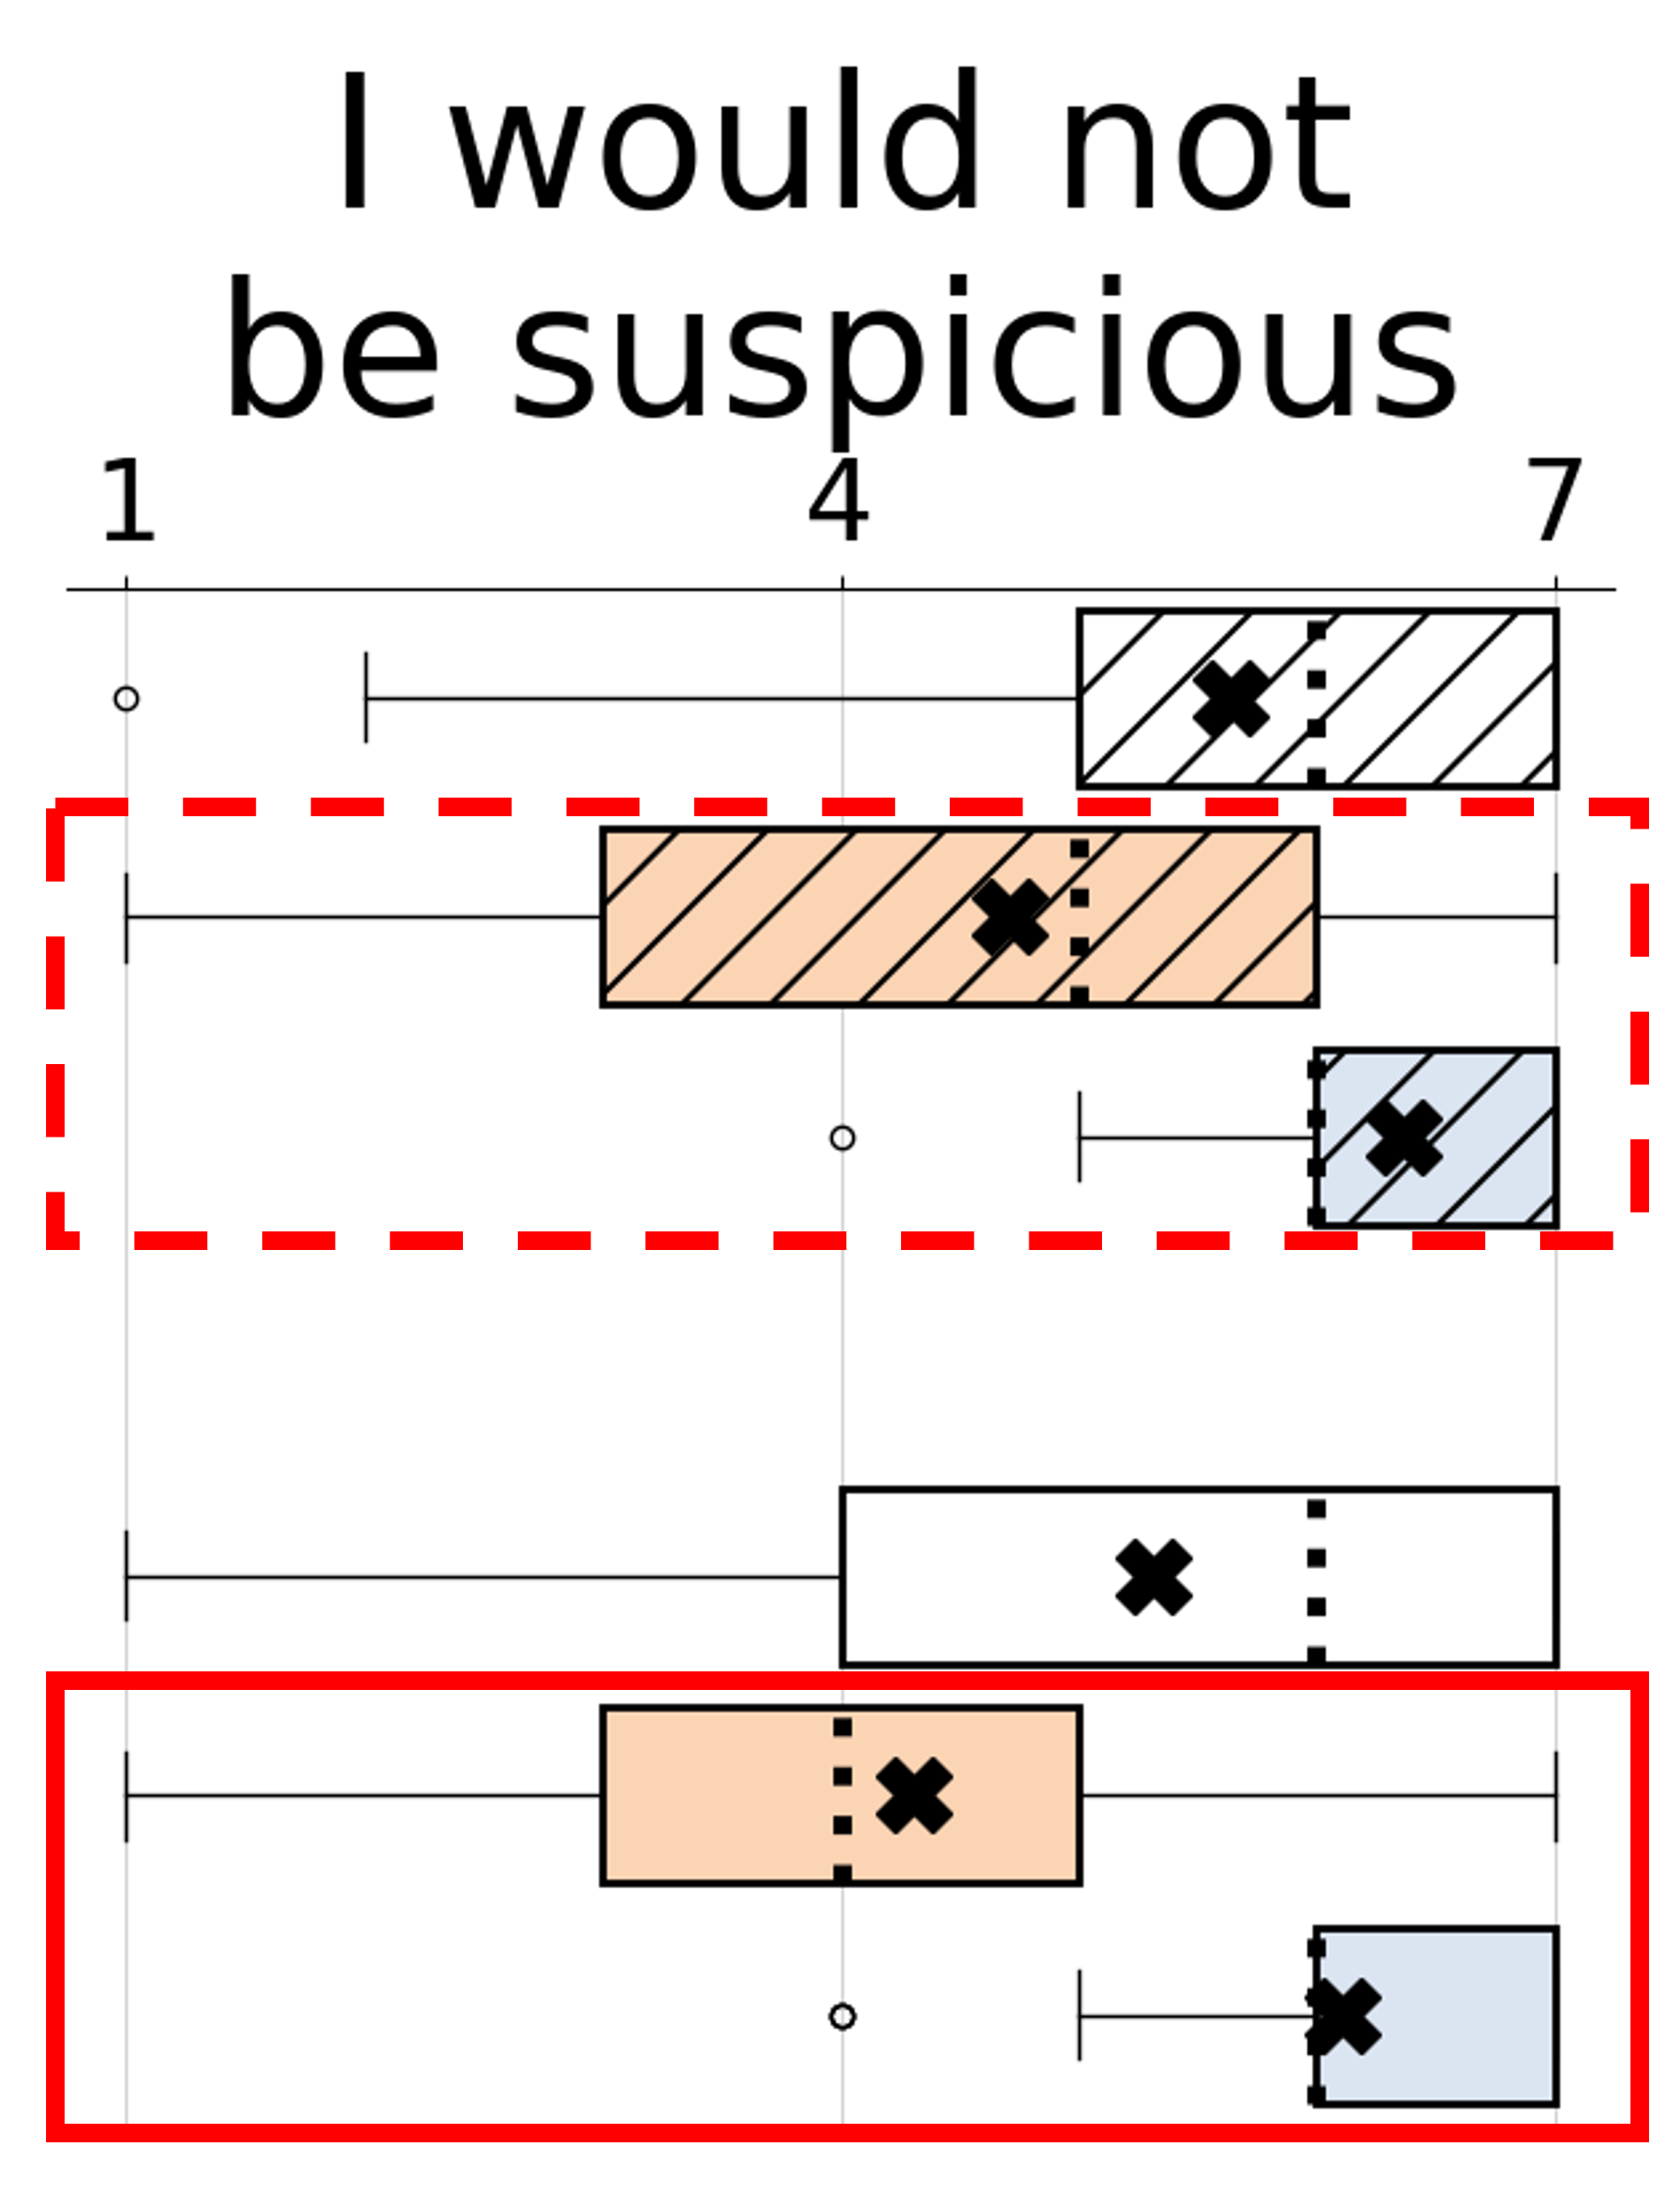
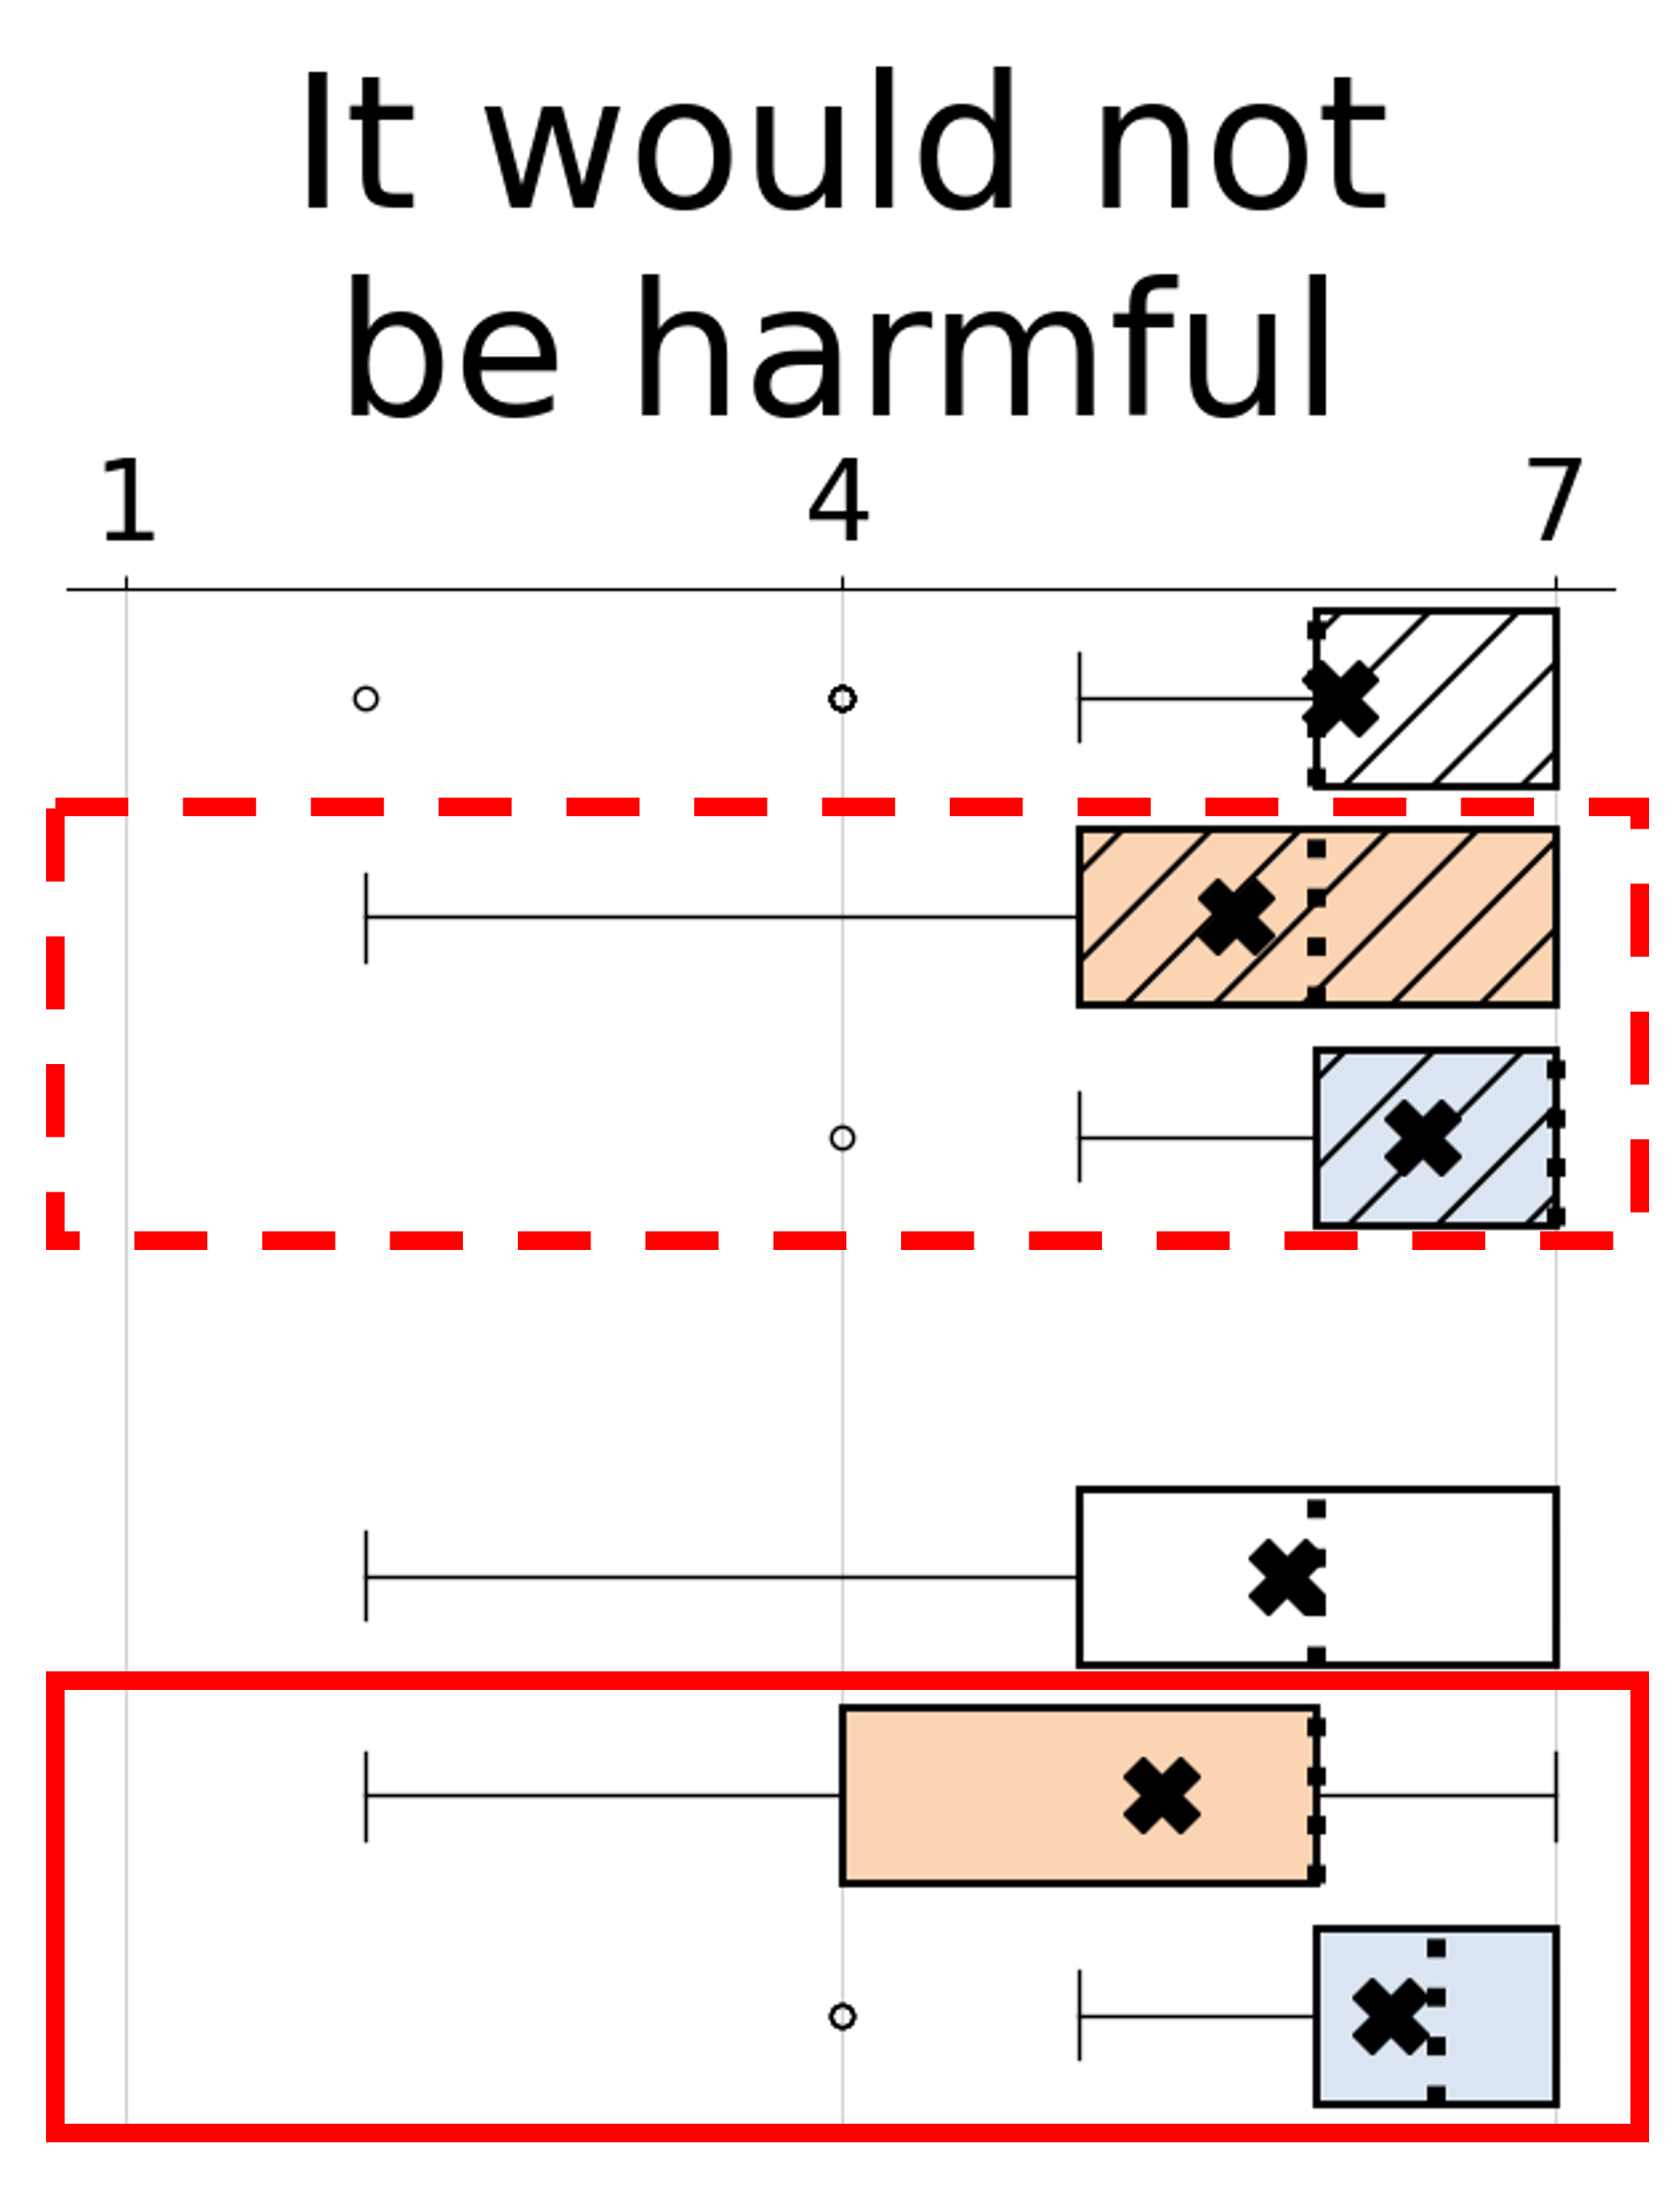
Participants in Guideline 4’s experiment (“show contextually relevant information”) exhibited this pattern in six dependent variables (Figure 6). In fact, in this experiment the risk-averse participants always gave significantly lower ratings than the risk-tolerant participants in both the Violation AI product (Table 4, top, p-value column) and the Application AI product (bottom). Even with Bonferroni corrected p-values (sixth column), the risk-averse participants felt significantly less certain with the Violation AI product (t(62) = 3.6258, , d = .910) and with the Application AI product (t(63) = 4.7513, , d = 1.186) than the risk-tolerant participants did. The same pattern also manifested in their responses to the “I would be suspicious” dependent variable.
Implications for Researchers and Practitioners: These six instances of Pattern #3 suggest that sometimes applying such guidelines is not enough to meet the needs of risk-averse participants. In this experiment, one possible reason for the risk-averse participants’ lower ratings might have arisen over concerns about privacy with the Application AI product:
G4-3905-risk-averse : “I would prefer to use [Violation AI product] because [Application AI product] feels a bit more intrusive. I would be nervous that [Application AI product] is pulling data from things like my other software and my browsing history.”
For designers, one possible way to address such privacy concerns may be using AI explanations to increase transparency into how the system makes its decisions. For example, Lim & Dey’s “inputs” and “outputs” intelligibility types (Lim et al., 2019) provide one possible direction. Mueller et al. (Mueller et al., 2019) provide a compilation of works from the eXplainable AI (XAI) literature with other possible directions.
| t(62) = -2.3006 | t(61) = -2.9179 | t(62) = -3.6258 | t(34) = -4.8630 | t(39) = -2.8694 | t(63) = -2.6615 | ||||||
| p: .0248 | d: .580 | p: .0049 | d: .743 | p: .0005 | d: .910 | p: .0001 | d: 1.337 | p: .0066 | d: .763 | p: .0100 | d: .664 |
 |
 |
 |
 |
 |
 |
||||||
| t(61) = -3.1984 | t(62) = -2.4955 | t(63) = -4.7513 | t(42) = -5.1692 | t(44) = -3.1328 | t(62) = -2.6615 | ||||||
| p: .0022 | d: .814 | p: .0153 | d: .629 | p: .0001 | d: 1.186 | p: .0001 | d: 1.364 | p: .0031 | d: .821 | p: .0004 | d: .937 |
| Violation AI Product | |||||||
|---|---|---|---|---|---|---|---|
| Dependent | Distance b/w | Bonferroni | |||||
| variable | Means | df | t-val | p-value | correction | Cohen’s d | Pattern # |
| I would feel in control | 0.4444 | 61 | 1.6268 | .109 | 1 | 0.410 | #2 |
| I would feel secure | 0.6667 | 62 | 2.3006 | .0248* | .248 | 0.580 | #3 |
| I would feel adequate | 0.8704 | 61 | 2.9179 | .0049* | .049* | 0.743 | #3 |
| I would feel certain | 1.2798 | 62 | 3.6258 | .0005* | .005* | 0.910 | #3 |
| I would feel productive | 0.5397 | 62 | 2.2066 | .0311* | .311 | 0.556 | #1 |
| I perceived it as useful | 0.5119 | 62 | 1.6623 | .102 | 1 | 0.419 | #2 |
| I would not be suspicious | 1.6468 | 34 | 4.8630 | * | * | 1.337 | #3 |
| It would not be harmful | 0.7893 | 39 | 2.8694 | .0066* | .066 | 0.763 | #3 |
| I find the product reliable | 0.6312 | 49 | 2.0046 | .051 | .510 | 0.518 | #2 |
| I would trust the product | 0.7519 | 63 | 2.6615 | .010* | .100 | 0.664 | #3 |
| Application AI Product | |||||||
| Dependent | Distance b/w | Bonferroni | |||||
| variable | Means | df | t-val | p-value | correction | Cohen’s d | Pattern # |
| I would feel in control | 0.9643 | 62 | 3.2128 | .0021* | .021* | 0.810 | #2 |
| I would feel secure | 1.0093 | 61 | 3.1984 | .0022* | .022* | 0.814 | #3 |
| I would feel adequate | 0.8492 | 62 | 2.4955 | .0153* | .153 | 0.629 | #3 |
| I would feel certain | 1.6916 | 63 | 4.7513 | * | * | 1.186 | #3 |
| I would feel productive | 0.4598 | 63 | 1.8462 | .0696 | .696 | 0.461 | #1 |
| I perceived it as useful | 0.7854 | 63 | 2.981 | .0041* | .041* | 0.744 | #2 |
| I would not be suspicious | 1.8008 | 42 | 5.1692 | * | * | 1.364 | #3 |
| It would not be harmful | 0.9607 | 44 | 3.1328 | .0031* | .031* | 0.821 | #3 |
| I find the product reliable | 0.8170 | 50 | 2.6298 | .0113* | .113 | 0.678 | #2 |
| I would trust the product | 1.0635 | 62 | 3.7170 | .0004* | .004* | 0.937 | #3 |
Overall, Sections 4.1 and 4.2 have shown the data repeatedly supported H1-CognitiveDiversity-RiskStyle. 10 of the dependent variables in the Guideline 4 experiment exhibited instances of all three patterns; Table 4 shows all the results from that experiment. Complete results from the remaining experiments are given in Appendix D. Across all experiments, the data revealed a total of 33 disparities between risk-averse and risk-tolerant human-AI interaction participants.
Of these 33 instances, in 30 of them (90.9%) the risk-averse participants rated the AI products significantly lower than the risk-tolerant participants did. This suggests that when designers apply the guidelines for human-AI interaction, additional considerations beyond the guidelines may be needed to reduce inclusivity gaps among users who have diverse attitudes toward risk in using technology.
4.3. Beyond Risk: H2-CognitiveDiversity-5Styles
![[Uncaptioned image]](/html/2108.00588/assets/x16.png)
Row-wise: The patterns were triangulated by at least 8 instances (Motivations, 2nd row) for every cognitive style type.
Column-wise: The patterns were triangulated by at least 2 instances in multiple experiments.
Going beyond attitudes toward risk, H2-CognitiveDiversity-5Styles posited that disaggregating HAI participants’ data by any of their five cognitive style types will reveal the same abstract patterns as those that emerged for the risk style. Our analyses across experiments supported this hypothesis for every cognitive style. To spare the reader pages and pages of statistical tables here, we simply summarize the evidence in Table 5.
Table 5’s summary shows that evidence of all three abstract patterns…
-
(1)
…triangulated across all five cognitive style types for every abstract pattern except one, namely Information Processing’s Pattern #3 (rows).
-
(2)
…triangulated across multiple experiments: when pattern instances arose in any experiment, they tended to arise across multiple cognitive style types with at least two instances of each pattern (columns).
-
(3)
…arose for participants with both “Abi”-like 777For each cognitive style type, participants were “Abi”-like if their value for that style was the left column of Table 1 (i.e., risk-averse, task-oriented motivations, process-oriented learning style, comprehensive information processing style, or lower computer self-efficacy) and “Tim”-like 888For each cognitive style type, participants were “Tim”-like if their value for that style was the right column of Table 1 (i.e., risk-tolerant, tech-oriented motivations, tinkering-oriented learning style, selective information processing style, or higher computer self-efficacy) values across all five cognitive style types
For item (3), the disparities between participants with “Abi”-like and “Tim”-like cognitive style values most often showed that the “Abi”-like participants had the significantly lower average responses to the UX metrics in 95 of the 112 (84.8%) pattern instances. Of the 17 pattern instances uncovered about the participants with “Tim”-like cognitive style values, 10 were for those with selective information processing styles.
Implications for Researchers and Practitioners: The mix of results for participants with “Abi”-like and “Tim”-like cognitive style values, along with the concentration of insights about the selective information processors, suggests that the focus of researchers and practitioners designing AI products should not exclusively be on those with certain cognitive style values instead of others (e.g., exclusively the risk-averse or the selective information processors ). Instead, researchers and practitioners of AI-powered systems should consider the needs of HAI users who have diverse cognitive style values to support their user experiences both inclusively and equitably.
5. How participants’ cognitive style types aligned with their demographics
Research in human-computer interaction has often taken a demographic perspective (e.g., (Schlesinger et al., 2017; Offenwanger et al., 2021)). Although the subfield of HAI is much younger than HCI, some HAI research has also suggested demographic differences in different AI systems’ HAI usability (e.g., (Zwakman et al., 2021; Kulesza et al., 2011; Flandorfer, 2012)). Here, we consider whether the results like those throughout Section 4 shed light on why such differences might exist.
5.1. Cognitive Style Diversity meets Demographic Diversity: An actionable approach
For researchers and practitioners to gain insights into demographic diversity through cognitive style disaggregation, we demonstrate the approach we took for our own data. We started by counting the number of “Abi”-like and “Tim”-like styles each participant had, and grouped the counts demographically. We begin with the two genders for whom enough data are present for inferential statistics—women and men, who provided 98.7% of the data—and then non-statistically present the data for the participants in the LGBTQIA* community.
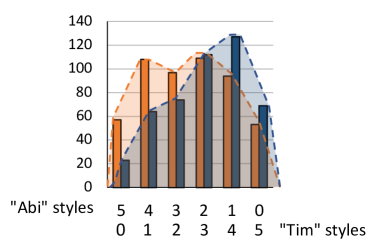
Figure 7 shows the number of “Abi”-like cognitive style values and number of “Tim”-like cognitive style values the women and men had. For example, the leftmost pair of bars show that 59 women and 24 men had five Abi-like cognitive style values (0 Tim-like styles). As the figure shows, women were split almost equally between having three or more “Abi”-like styles (first three orange bars, 50.6%), versus having two or fewer (49.4%). In contrast, the men skewed heavily toward the right; only 34.5% of the men had three or more “Abi”-like styles (first three blue bars). Vorvoreanu et al. (Vorvoreanu et al., 2019) found similar gender skew results while investigating an academic search tool.
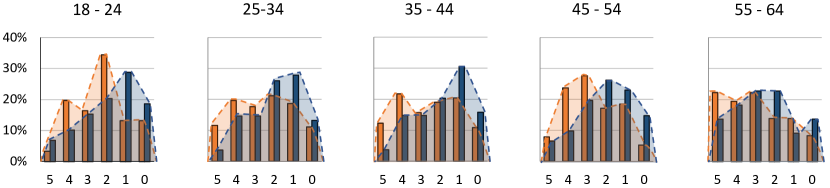
The observed gender skew differences in Figure 7 were statistically significant under Fisher’s exact test (Table 6, )999For this test, we used the threshold that minimized the chance of showing significance by maximizing the sum of p-values (Ramsey and Schafer, 2012). . Taking an intersectional gender-age approach (Figure 8), there were similar visible skews in each of the five age groups, and the results were also significant in the three age groups between ages 25—54 (Table 7).
FIXME
| 3 or more | less than 3 | |
| “Abi”-like styles | “Abi”-like styles | |
| Woman | 262 | 256 |
| Man | 161 | 308 |
| Estimate (k) | 222 | |
| p-value | ||
FIXME
| 18 – 24 | 25 – 34 | 35 – 44 | 45 – 54 | 55 – 64 | ||||||
| Woman | 24 | 37 | 97 | 101 | 73 | 74 | 45 | 31 | 23 | 13 |
| Man | 19 | 40 | 72 | 147 | 36 | 72 | 22 | 39 | 12 | 10 |
| Estimate (k) | 22 | 81 | 63 | 38 | 14 | |||||
| p-value | .4507 | .0010* | .0105* | .0100* | .583 | |||||
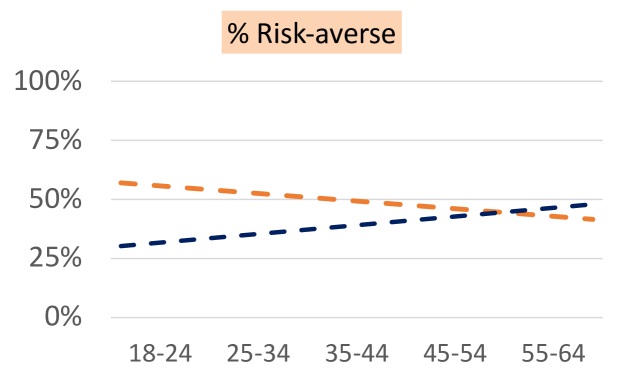
Do such gender-age intersectional results exist when investigating each of the cognitive style types? Figure 9 provides evidence to suggest that they do. For attitudes toward risk (Figure 9(a)), our results by age for men are consistent with those of other researchers who have found an inverse relationship between people’s age and their willingness to take risks. Our results for the men resemble, for example, Dohmen et al.’s (Dohmen et al., 2017) findings, in which their participants’ risk-aversion increased linearly until around 65 years old. Our results also add to Dohmen et al.’s results: our analysis showed that, in contrast to the men, the women became decreasingly risk-averse. These differences in attitudes toward risk by gender and by age may help explain other researchers’ reports (e.g., (Hulse et al., 2018; Gish et al., 2017; van der Goot and Pilgrim, 2019)) of demographic differences between people’s experiences with AI products.
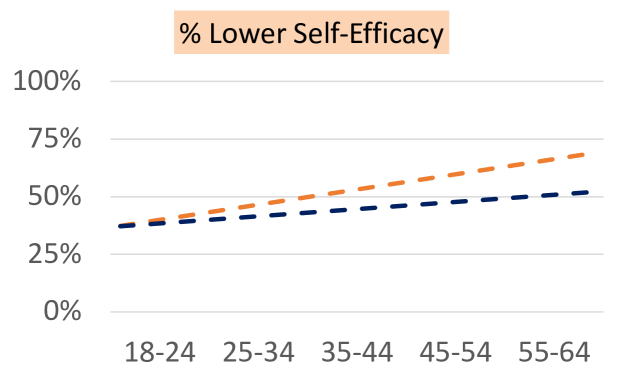
For computer self-efficacy (Figure 9(b)), other researchers have found a relationship between people’s gender and/or age and their computer self-efficacy (López-Vargas et al., 2017; Schreder et al., 2013; Flandorfer, 2012; Chang et al., 2014; Liberatore and Wagner, 2022; Dutta et al., 2018; Gunbatar and Karalar, 2018). For example, Vsabic et al. (Šabić et al., 2021) found an interaction between computer self-efficacy, gender, and age. Specifically, their study reported gender differences in self-efficacy for using Information Communication Technology that were prevalent among older teachers and practically non-existent among younger teachers. Our participants’ trends seem to mirror Vsabic et al.’s finding; there was hardly any difference in the proportion of lower self-efficacy women and men in the 18—24 years old group. However, the gap in the proportions between these two genders increased across the age groups, where the women had a greater percentage of lower self-efficacy participants than the men. Thus, gender and age differences in computer self-efficacy may provide an additional possible explanatory factor to help explain demographic differences in people’s experiences with some AI products.
For information processing style (no figure shown), others’ research has shown both gender differences (Meyers-Levy and Loken, 2015; Showkat and Grimm, 2018) and age differences (Geerligs et al., 2018; Guest et al., 2015; McIntosh et al., 2021; Torrens-Burton et al., 2020). In contrast to these findings, our sample of participants showed no evidence of a difference in participants’ information processing style across gender or age.
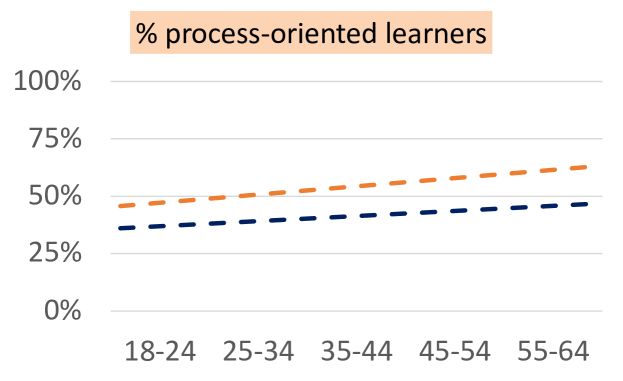
For styles of learning new technologies (Figure 9(c)), both Papavlasopoulou et al. (Papavlasopoulou et al., 2020) and Ichinco et al. (Ichinco et al., 2017) found gender difference suggesting that male101010Male & female used for faithfulness to their terminology. children relied more on tinkering, whereas female children followed a more process-oriented style. In samples of older participants, researchers have also discovered this same trend (Showkat and Grimm, 2018; Meyers-Levy and Loken, 2015). Our participants echo such findings, where women had more process-oriented learners in each age group—the greater the age, the greater the percentage of process-oriented learners for both of these genders. These results suggest that styles of learning new technologies may be a possible third explanation for gender and/or age differences.
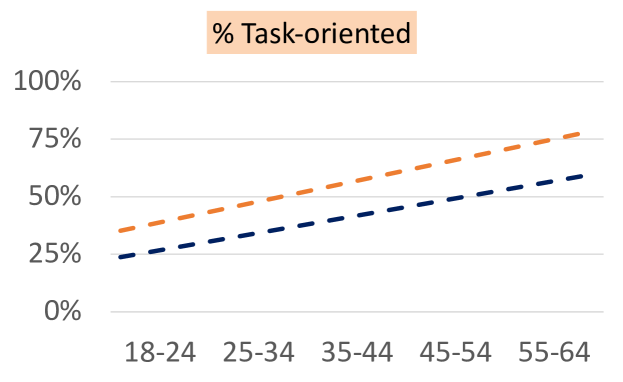
For motivations for using technologies (Figure 9(d)), researchers have found both gender (Hallström et al., 2015; Noguti et al., 2019) and age differences (van der Goot and Pilgrim, 2019; Gish et al., 2017) about their participants’ motivations to interact with technologies. Consistent with these findings, our data showed differences across both gender and age, which provides a fourth possible avenue by which gender and/or age differences in user experiences with AI products may be explained.
For designers, these results suggest that removing AI products’ age and gender “inclusivity bugs” may be possible by improving support across an entire range of cognitive style values. For example, adding support for process-oriented learners and people with task-oriented motivations (Figure 9(c) and 9(d)) may make such technologies more gender inclusive across a spectrum of age groups.
![[Uncaptioned image]](/html/2108.00588/assets/x23.png)
5.2. The LGBTQIA* Community
The genders “woman” and “man” are only two points on the gender spectrum. Table 8 shows the first reporting of the GenderMag cognitive style values for the 13 participants who were members of the LGBTQIA* community111111LGBTQIA* used based on Scheuerman et al.’s living document (Scheuerman et al., 2020).. Although one data set of 13 participants is small, we hope it will add to literature being populated by other researchers with data sets of LGBTQIA* participants (e.g., (Freeman et al., 2022; Acena and Freeman, 2021; Hardy and Vargas, 2019)), to enable the possibility of future meta-analyses to broaden our understanding of how to inclusively design for users of all gender identities.
6. Threats to Validity & Limitations
Every empirical study has limitations and threats to validity (Wohlin et al., 2000; Ko et al., 2015).
In any study, researchers cannot ask participants every possible question, having to balance research goals with participant fatigue. As such, the dependent variables we analyzed may not have captured all information about people’s reactions; For example, consider that some participants mentioned their privacy while interacting with certain products. However, because there was no dependent variable explicitly measuring how they felt their privacy might be impacted, so we cannot be certain if these were isolated cases or a more prevalent trend.
Another threat to validity was how to handle missing data. As we mentioned in Section 3, participants had the option to say “I don’t know” for any of the questions. We had to decide whether to 1) impute the data or 2) drop the “idk” values, costing degrees of freedom in our statistical tests. We chose the latter, because although there are many imputation methods to leverage (e.g., hot-deck, cold-deck, regression), the inferences are then limited to the imputed data, rather than the original data.
Another threat to validity was how to handle the potentially huge number of statistical tests to run in total in the 16 experiments. Section 3.2.2 details our testing paradigm, but choosing a distance between two means like we did (i.e. for any two averages, such that ) may have meant that we did not run tests that we should have, leaving missing inferences in the data.
One limitation of this investigation is that such results cannot be generalized to AI-powered systems outside of productivity software, suggesting the need to investigate whether such UX impacts exist across a spectrum of domains, from the low-stakes domains (e.g., music recommender systems) to the high-stakes ones (e.g., automated healthcare or autonomous vehicles).
Threats and limitations like these can only be addressed through additional studies across a spectrum of empirical methods and situations, in order to isolate different independent variables of study and establish generality of findings across different AI applications, measurements, and populations.
7. Concluding Remarks
In this paper, we have considered how cognitively diverse humans’ user experiences may be significantly different when they interact with an AI-powered software product. Our results suggest that disaggregating participant data by their five GenderMag cognitive style types can provide a way to understand the nuances of diverse users’ user experience outcomes. Among our results, we found:
-
•
Three patterns—Helping equitably, helping inequitably, or not helping/hurting: Our results revealed three patterns in the data of inclusivity insights for human-AI interaction. In some cases, applying the Human-AI guidelines not only helped participants overall, but also helped diverse participants equitably (Section 4.2.1). In other cases, applying guidelines helped participants, but not equitably, which opens new opportunities for design of AI products (Section 4.2.2). The third pattern revealed persistent disparities that need further research to resolve (Section 4.2.3).
-
•
These patterns were common across experiments: Phenomena in these patterns occurred pervasively. Each arose in at least 6 experiments, and collectively arose in 15 of the 16 experiments…
-
•
…and across cognitive style types: They also arose for all five of participants’ cognitive style types (Section 4.3).
-
•
Cognitive style types meet demographics: For participants who identified as men or women, (1) their cognitive style values clustered by gender identity (similar to prior findings (Vorvoreanu et al., 2019; Guizani et al., 2022)), and (2) skewed by gender in consistent ways across age groups. (3) Results also showed intersectional gender/age differences for 3 of the cognitive style values (Section 5).
Perhaps most telling was the prevalence of results suggesting inequities: 95 of these participants’ 112 inclusivity instances occurred with participants whose cognitive style values were “Abi”-like (statistically clustering around women’s styles). Although prior literature has reported results like these for non-AI-powered technologies (Burnett et al., 2010; Burnett et al., 2016a; Guizani et al., 2022; Padala et al., 2020; Stumpf et al., 2020; Vorvoreanu et al., 2019), this is the first to reveal the importance of cognitive style disaggregation to understanding how equitably AI-powered technologies are serving their many diverse users. Our work provides a direct, actionable answer to one of Shneiderman’s three ideas for Human-Centered Artificial Intelligence (Shneiderman, 2020b), the “shift from emulating humans to empowering people”. We believe that our work provides a way for human-AI interaction practitioners to uncover potential disparities in the experiences of cognitively diverse users during human-AI interaction, that can help move current efforts beyond who needs empowering to begin considering how—a critical step toward how to empower more people in using AI products.
Acknowledgments
We thank Rupika Dikkala, Catherine Hu, Christopher Perdriau, Caleb Matthews, and Sai Raja for their help with this paper. This work was supported in part by DARPA #N66001-17-2-4030; by NSF #1901031 and #2042324; and by USDA-NIFA/NSF #2021-67021-35344. Any opinions, findings, conclusions, or recommendations expressed are the authors’ and do not necessarily reflect the views of the sponsors.
References
- (1)
- Abedin et al. (2022) Babak Abedin, Christian Meske, Iris Junglas, Fethi Rabhi, and Hamid R Motahari-Nezhad. 2022. Designing and Managing Human-AI Interactions. Information Systems Frontiers 24, 3 (2022), 691–697.
- Abendschein et al. (2021) Bryan Abendschein, Chad Edwards, and Autumn Edwards. 2021. The influence of agent and message type on perceptions of social support in human-machine communication. Communication Research Reports 38, 5 (2021), 304–314.
- Acena and Freeman (2021) Dane Acena and Guo Freeman. 2021. “In My Safe Space”: Social Support for LGBTQ Users in Social Virtual Reality. In Extended Abstracts of the 2021 CHI Conference on Human Factors in Computing Systems. 1–6.
- Ahmad et al. (2022) Rangina Ahmad, Dominik Siemon, Ulrich Gnewuch, and Susanne Robra-Bissantz. 2022. Designing personality-adaptive conversational agents for mental health care. Information Systems Frontiers (2022), 1–21.
- Amershi et al. (2019) Saleema Amershi, Dan Weld, Mihaela Vorvoreanu, Adam Fourney, Besmira Nushi, Penny Collisson, Jina Suh, Shamsi Iqbal, Paul N Bennett, Kori Inkpen, et al. 2019. Guidelines for human-AI interaction. In Proceedings of the 2019 CHI Conference on Human Factors in Computing Systems. ACM, 3.
- Anderson et al. (2020) Andrew Anderson, Jonathan Dodge, Amrita Sadarangani, Zoe Juozapaitis, Evan Newman, Jed Irvine, Souti Chattopadhyay, Matthew Olson, Alan Fern, and Margaret Burnett. 2020. Mental Models of Mere Mortals with Explanations of Reinforcement Learning. ACM Transactions on Interactive Intelligent Systems (TiiS) 10, 2 (2020), 1–37.
- Blackwell (2002) Alan F Blackwell. 2002. First steps in programming: A rationale for attention investment models. In Proceedings IEEE 2002 Symposia on Human Centric Computing Languages and Environments. IEEE, 2–10.
- Boukherouaa et al. (2021) El Bachir Boukherouaa, Khaled AlAjmi, Jose Deodoro, Aquiles Farias, and Rangachary Ravikumar. 2021. Powering the Digital Economy: Opportunities and Risks of Artificial Intelligence in Finance. Departmental Papers 2021, 024 (2021).
- Bunt et al. (2012) Andrea Bunt, Matthew Lount, and Catherine Lauzon. 2012. Are explanations always important? A study of deployed, low-cost intelligent interactive systems. In Proceedings of the 2012 ACM international conference on Intelligent User Interfaces. 169–178.
- Burnett et al. (2010) Margaret Burnett, Scott D Fleming, Shamsi Iqbal, Gina Venolia, Vidya Rajaram, Umer Farooq, Valentina Grigoreanu, and Mary Czerwinski. 2010. Gender differences and programming environments: Across programming populations. In Proceedings of the 2010 ACM-IEEE international symposium on empirical software engineering and measurement. 1–10.
- Burnett et al. (2016a) Margaret Burnett, Anicia Peters, Charles Hill, and Noha Elarief. 2016a. Finding gender-inclusiveness software issues with GenderMag: A field investigation. In Proceedings of the 2016 CHI Conference on Human Factors in Computing Systems. 2586–2598.
- Burnett et al. (2016b) Margaret Burnett, Simone Stumpf, Jamie Macbeth, Stephann Makri, Laura Beckwith, Irwin Kwan, Anicia Peters, and William Jernigan. 2016b. GenderMag: A method for evaluating software’s gender inclusiveness. Interacting with Computers 28, 6 (2016), 760–787.
- Chang et al. (2014) Shuo Chang, Vikas Kumar, Eric Gilbert, and Loren G Terveen. 2014. Specialization, homophily, and gender in a social curation site: Findings from Pinterest. In Proceedings of the 17th ACM conference on Computer supported cooperative work & social computing. 674–686.
- Charness and Gneezy (2012) Gary Charness and Uri Gneezy. 2012. Strong evidence for gender differences in risk taking. Journal of Economic Behavior & Organization 83, 1 (2012), 50–58.
- Chen et al. (2021) Tao Chen, Wenshan Guo, Xian Gao, and Zhehao Liang. 2021. AI-based self-service technology in public service delivery: User experience and influencing factors. Government Information Quarterly 38, 4 (2021), 101520.
- Davis et al. (2022) Jenny L Davis, Daniel B Shank, Tony P Love, Courtney Stefanik, and Abigail Wilson. 2022. Gender Dynamics in Human-AI Role-Taking. (2022).
- De Graaf et al. (2015) Maartje Ma De Graaf, Somaya Ben Allouch, and Tineke Klamer. 2015. Sharing a life with Harvey: Exploring the acceptance of and relationship-building with a social robot. Computers in human behavior 43 (2015), 1–14.
- Derrick and Ligon (2014) Douglas C Derrick and Gina Scott Ligon. 2014. The affective outcomes of using influence tactics in embodied conversational agents. Computers in Human Behavior 33 (2014), 39–48.
- Dodge et al. (2019) Jonathan Dodge, Q. Vera Liao, Yunfeng Zhang, Rachel K. E. Bellamy, and Casey Dugan. 2019. Explaining Models: An Empirical Study of How Explanations Impact Fairness Judgment. In Proceedings of the 24th International Conference on Intelligent User Interfaces (IUI ’19). Association for Computing Machinery, New York, NY, USA, 275–285. https://doi.org/10.1145/3301275.3302310
- Dohmen et al. (2017) Thomas Dohmen, Armin Falk, Bart HH Golsteyn, David Huffman, and Uwe Sunde. 2017. Risk attitudes across the life course.
- Dutta et al. (2018) Bireswar Dutta, Mei-Hui Peng, and Shu-Lung Sun. 2018. Modeling the adoption of personal health record (PHR) among individual: the effect of health-care technology self-efficacy and gender concern. Libyan Journal of Medicine 13, 1 (2018).
- Fan et al. (2022) Shaoyang Fan, Pinar Barlas, Evgenia Christoforou, Jahna Otterbacher, Shazia Sadiq, and Gianluca Demartini. 2022. Socio-Economic Diversity in Human Annotations. In 14th ACM Web Science Conference 2022. 98–109.
- Flandorfer (2012) Priska Flandorfer. 2012. Population ageing and socially assistive robots for elderly persons: the importance of sociodemographic factors for user acceptance. International Journal of Population Research 2012 (2012).
- Freeman et al. (2022) Guo Freeman, Divine Maloney, Dane Acena, and Catherine Barwulor. 2022. (Re) discovering the Physical Body Online: Strategies and Challenges to Approach Non-Cisgender Identity in Social Virtual Reality. In CHI Conference on Human Factors in Computing Systems. 1–15.
- Geerligs et al. (2018) Linda Geerligs, Karen L Campbell, et al. 2018. Age-related differences in information processing during movie watching. Neurobiology of Aging 72 (2018), 106–120.
- Giboney et al. (2015) Justin Scott Giboney, Susan A Brown, Paul Benjamin Lowry, and Jay F Nunamaker Jr. 2015. User acceptance of knowledge-based system recommendations: Explanations, arguments, and fit. Decision Support Systems 72 (2015), 1–10.
- Gillath et al. (2021) Omri Gillath, Ting Ai, Michael S Branicky, Shawn Keshmiri, Robert B Davison, and Ryan Spaulding. 2021. Attachment and trust in artificial intelligence. Computers in Human Behavior 115 (2021), 106607.
- Gish et al. (2017) Jessica Gish, Brenda Vrkljan, Amanda Grenier, and Benita Van Miltenburg. 2017. Driving with advanced vehicle technology: A qualitative investigation of older drivers’ perceptions and motivations for use. Accident Analysis & Prevention 106 (2017), 498–504.
- Google (2019) Google. 2019. The UX of AI - Library. https://design.google/library/ux-ai/
- Guest et al. (2015) Duncan Guest, Christina J Howard, Louise A Brown, and Harriet Gleeson. 2015. Aging and the rate of visual information processing. Journal of vision 15, 14 (2015), 10–10.
- Guizani et al. (2022) Mariam Guizani, Igor Steinmacher, Jillian Emard, Abrar Fallatah, Margaret Burnett, and Anita Sarma. 2022. How to Debug Inclusivity Bugs? A Debugging Process with Information Architecture. In ACM/IEEE International Conference on Software Engineering, Software Engineering in Society Track (ICSE-SEIS’22). ACM, 1–12.
- Gunbatar and Karalar (2018) Mustafa Serkan Gunbatar and Halit Karalar. 2018. Gender differences in middle school students’ attitudes and self-efficacy perceptions towards mBlock programming. European Journal of Educational Research 7, 4 (2018), 925–933.
- Guzdial and Riedl (2016) Matthew Guzdial and Mark Riedl. 2016. Game level generation from gameplay videos. In Twelfth artificial intelligence and interactive digital entertainment conference.
- Hallström et al. (2015) Jonas Hallström, Helene Elvstrand, and Kristina Hellberg. 2015. Gender and technology in free play in Swedish early childhood education. International journal of technology and design education 25, 2 (2015), 137–149.
- Hamid et al. (2023) Md Montaser Hamid, Amreeta Chatterjee, Mariam Guizani, Andrew Anderson, Fatima Moussaoui, Sarah Yang, Isaac Escobar, Anita Sarma, and Margaret Burnett. 2023. How to measure diversity actionably in technology. In Equity, Diversity, and Inclusion in Software Engineering: Best Practices and Insights. Springer Nature/Apress.
- Hardy and Vargas (2019) Jean Hardy and Stefani Vargas. 2019. Participatory design and the future of rural LGBTQ communities. In Companion Publication of the 2019 on Designing Interactive Systems Conference 2019 Companion. 195–199.
- Hilderbrand et al. (2020) Claudia Hilderbrand, Christopher Perdriau, Lara Letaw, Jillian Emard, Zoe Steine-Hanson, Margaret Burnett, and Anita Sarma. 2020. Engineering gender-inclusivity into software: ten teams’ tales from the trenches. In Proceedings of the ACM/IEEE 42nd International Conference on Software Engineering. 433–444.
- Horvitz (1999) Eric Horvitz. 1999. Principles of mixed-initiative user interfaces. In Proceedings of the SIGCHI conference on Human Factors in Computing Systems. 159–166.
- Hulse et al. (2018) Lynn M Hulse, Hui Xie, and Edwin R Galea. 2018. Perceptions of autonomous vehicles: Relationships with road users, risk, gender and age. Safety science 102 (2018), 1–13.
- Ichinco et al. (2017) Michelle Ichinco, Wint Yee Hnin, and Caitlin L. Kelleher. 2017. Suggesting API Usage to Novice Programmers with the Example Guru. In Proceedings of the 2017 CHI Conference on Human Factors in Computing Systems. Association for Computing Machinery, New York, NY, USA, 1105–1117. https://doi.org/10.1145/3025453.3025827
- Inc. (2019) Apple Inc. 2019. Machine learning. https://developer.apple.com/design/human-interface-guidelines/technologies/machine-learning/introduction/
- Jiang et al. (2000) JJ Jiang, Gary Klein, and RG Vedder. 2000. Persuasive expert systems: the influence of confidence and discrepancy. Computers in Human Behavior 16, 2 (2000), 99–109.
- Kanij et al. (2022) Tanjila Kanij, John Grundy, Jennifer McIntosh, Anita Sarma, and Gayatri Aniruddha. 2022. A new approach towards ensuring gender inclusive SE job advertisements. In Proceedings of the 2022 ACM/IEEE 44th International Conference on Software Engineering: Software Engineering in Society. 1–11.
- Ko et al. (2015) A J Ko, T D Latoza, and M M Burnett. 2015. A practical guide to controlled experiments of software engineering tools with human participants. Empirical Software Engineering 20, 1 (2015), 110–141.
- Kulesza et al. (2015) Todd Kulesza, Margaret Burnett, Weng-Keen Wong, and Simone Stumpf. 2015. Principles of explanatory debugging to personalize interactive machine learning. In ACM Intl. Conf. on Intelligent User Interfaces (IUI ’15). ACM, 126–137.
- Kulesza et al. (2013) Todd Kulesza, Simone Stumpf, Margaret Burnett, Sherry Yang, Irwin Kwan, and Weng-Keen Wong. 2013. Too much, too little, or just right? Ways explanations impact end users’ mental models. In 2013 IEEE Symposium on Visual Languages and Human Centric Computing. IEEE, 3–10.
- Kulesza et al. (2011) Todd Kulesza, Simone Stumpf, Weng-Keen Wong, Margaret M. Burnett, Stephen Perona, Amy J. Ko, and Ian Oberst. 2011. Why-Oriented End-User Debugging of Naive Bayes Text Classification. 1, 1 (2011). https://doi.org/10.1145/2030365.2030367
- Lee et al. (2020b) Chunggi Lee, Sanghoon Kim, Dongyun Han, Hongjun Yang, Young-Woo Park, Bum Chul Kwon, and Sungahn Ko. 2020b. GUIComp: A GUI design assistant with real-time, multi-faceted feedback. In Proceedings of the 2020 CHI conference on human factors in computing systems. 1–13.
- Lee et al. (2000) Eun Ju Lee, Clifford Nass, and Scott Brave. 2000. Can computer-generated speech have gender? An experimental test of gender stereotype. In CHI’00 extended abstracts on Human factors in computing systems. 289–290.
- Lee et al. (2022) Min Hun Lee, Daniel P. Siewiorek, Asim Smailagic, Alexandre Bernardino, and Sergi Bermúdez i Badia. 2022. Towards Efficient Annotations for a Human-AI Collaborative, Clinical Decision Support System: A Case Study on Physical Stroke Rehabilitation Assessment. In 27th International Conference on Intelligent User Interfaces (IUI ’22). Association for Computing Machinery, New York, NY, USA, 4–14. https://doi.org/10.1145/3490099.3511112
- Lee et al. (2020a) Sunok Lee, Minji Cho, and Sangsu Lee. 2020a. What If Conversational Agents Became Invisible? Comparing Users’ Mental Models According to Physical Entity of AI Speaker. Proceedings of the ACM on Interactive, Mobile, Wearable and Ubiquitous Technologies 4, 3 (2020), 1–24.
- Li et al. (pear) Tianyi Li, Mihaela Vorvoreanu, Derek DeBellis, and Saleema Amershi. 2022 (to appear). Assessing Human-AI Interaction Early through Factorial Surveys: A Study on the Guidelines for Human-AI Interaction. ACM Transactions on Computer-Human Interaction (ToCHI) (2022 (to appear)).
- Liang and Lee (2017) Yuhua Liang and Seungcheol Austin Lee. 2017. Fear of autonomous robots and artificial intelligence: Evidence from national representative data with probability sampling. International Journal of Social Robotics 9, 3 (2017), 379–384.
- Liberatore and Wagner (2022) Matthew J Liberatore and William P Wagner. 2022. Gender, performance, and self-efficacy: a quasi-experimental field study. Journal of Computer Information Systems 62, 1 (2022), 109–117.
- Lim et al. (2019) Brian Y Lim, Qian Yang, Ashraf M Abdul, and Danding Wang. 2019. Why these Explanations? Selecting Intelligibility Types for Explanation Goals.. In IUI Workshops.
- Lima et al. (2021) Gabriel Lima, Nina Grgić-Hlača, and Meeyoung Cha. 2021. Human Perceptions on Moral Responsibility of AI: A Case Study in AI-Assisted Bail Decision-Making. (2021).
- López-Vargas et al. (2017) Omar López-Vargas, Leydy Duarte-Suárez, and Jaime Ibáñez-Ibáñez. 2017. Teacher’s computer self-efficacy and its relationship with cognitive style and TPACK. Improving Schools 20, 3 (2017), 264–277.
- Martínez-Miranda et al. (2018) Juan Martínez-Miranda, Humberto Pérez-Espinosa, Ismael Espinosa-Curiel, Himer Avila-George, and Josefína Rodríguez-Jacobo. 2018. Age-based differences in preferences and affective reactions towards a robot’s personality during interaction. Computers in Human Behavior 84 (2018), 245–257.
- McIntosh et al. (2021) Jennifer McIntosh, Xiaojiao Du, Zexian Wu, Giahuy Truong, Quang Ly, Richard How, Sriram Viswanathan, and Tanjila Kanij. 2021. Evaluating Age Bias In E-commerce. In 2021 IEEE/ACM 13th International Workshop on Cooperative and Human Aspects of Software Engineering (CHASE). IEEE, 31–40.
- McKee et al. (2021) Kevin McKee, Xuechunzi Bai, and Susan Fiske. 2021. Understanding human impressions of artificial intelligence. (2021).
- Meyers-Levy and Loken (2015) Joan Meyers-Levy and Barbara Loken. 2015. Revisiting gender differences: What we know and what lies ahead. Journal of Consumer Psychology 25, 1 (2015), 129–149.
- Mueller et al. (2019) Shane T Mueller, Robert R Hoffman, William Clancey, Abigail Emrey, and Gary Klein. 2019. Explanation in human-AI systems: A literature meta-review, synopsis of key ideas and publications, and bibliography for explainable AI. arXiv preprint arXiv:1902.01876 (2019).
- Nass et al. (2005) Clifford Nass, Ing-Marie Jonsson, Helen Harris, Ben Reaves, Jack Endo, Scott Brave, and Leila Takayama. 2005. Improving automotive safety by pairing driver emotion and car voice emotion. In CHI’05 extended abstracts on Human factors in computing systems. 1973–1976.
- Noguti et al. (2019) Valeria Noguti, Sonika Singh, and David S Waller. 2019. Gender differences in motivations to use social networking sites. In Gender economics: Breakthroughs in research and practice. IGI Global, 676–691.
- Offenwanger et al. (2021) Anna Offenwanger, Alan John Milligan, Minsuk Chang, Julia Bullard, and Dongwook Yoon. 2021. Diagnosing bias in the gender representation of HCI research participants: how it happens and where we are. In Proceedings of the 2021 CHI Conference on Human Factors in Computing Systems. 1–18.
- Oh et al. (2018) Changhoon Oh, Jungwoo Song, Jinhan Choi, Seonghyeon Kim, Sungwoo Lee, and Bongwon Suh. 2018. I lead, you help but only with enough details: Understanding user experience of co-creation with artificial intelligence. In Proceedings of the 2018 CHI Conference on Human Factors in Computing Systems. 1–13.
- Padala et al. (2020) Susmita Hema Padala, Christopher John Mendez, Luiz Felipe Dias, Igor Steinmacher, Zoe Steine Hanson, Claudia Hilderbrand, Amber Horvath, Charles Hill, Logan Dale Simpson, Margaret Burnett, et al. 2020. How gender-biased tools shape newcomer experiences in OSS projects. IEEE Transactions on Software Engineering (2020).
- Pal et al. (2019) D. Pal, C. Arpnikanondt, S. Funilkul, and V. Varadarajan. 2019. User Experience with Smart Voice Assistants: The Accent Perspective. In 2019 10th International Conference on Computing, Communication and Networking Technologies (ICCCNT). 1–6. https://doi.org/10.1109/ICCCNT45670.2019.8944754
- Papavlasopoulou et al. (2020) Sofia Papavlasopoulou, Kshitij Sharma, and Michail N Giannakos. 2020. Coding activities for children: Coupling eye-tracking with qualitative data to investigate gender differences. Computers in Human Behavior 105 (2020), 105939.
- Ramsey and Schafer (2012) Fred Ramsey and Daniel Schafer. 2012. The statistical sleuth: a course in methods of data analysis. Cengage Learning.
- Rau et al. (2009) PL Patrick Rau, Ye Li, and Dingjun Li. 2009. Effects of communication style and culture on ability to accept recommendations from robots. Computers in Human Behavior 25, 2 (2009), 587–595.
- Rzepka and Berger (2018) Christine Rzepka and Benedikt Berger. 2018. User interaction with AI-enabled systems: a systematic review of IS research. (2018).
- Šabić et al. (2021) Josip Šabić, Branislava Baranović, and Silvia Rogošić. 2021. Teachers’ self-efficacy for using information and communication technology: The interaction effect of gender and age. Informatics in education (2021).
- Scheuerman et al. (2020) Morgan Klaus Scheuerman, Katta Spiel, Oliver L Haimson, Foad Hamidi, and Stacy M Branham. 2020. HCI guidelines for gender equity and inclusivity. UMBC Faculty Collection (2020).
- Schlesinger et al. (2017) Ari Schlesinger, W Keith Edwards, and Rebecca E Grinter. 2017. Intersectional HCI: Engaging identity through gender, race, and class. In Proceedings of the 2017 CHI conference on human factors in computing systems. 5412–5427.
- Schreder et al. (2013) Günther Schreder, Michael Smuc, Karin Siebenhandl, and Eva Mayr. 2013. Age and computer self-efficacy in the use of digital technologies: an investigation of prototypes for public self-service terminals. In International conference on universal access in human-computer interaction. Springer, 221–230.
- Seaborn and Urakami (2021) Katie Seaborn and Jacqueline Urakami. 2021. Measuring voice UX quantitatively: A rapid review. In Extended Abstracts of the 2021 CHI Conference on Human Factors in Computing Systems. 1–8.
- Shahid et al. (2014) Suleman Shahid, Emiel Krahmer, and Marc Swerts. 2014. Child–robot interaction across cultures: How does playing a game with a social robot compare to playing a game alone or with a friend? Computers in Human Behavior 40 (2014), 86–100.
- Shneiderman (2020a) Ben Shneiderman. 2020a. Human-centered artificial intelligence: Reliable, safe & trustworthy. International Journal of Human–Computer Interaction 36, 6 (2020), 495–504.
- Shneiderman (2020b) Ben Shneiderman. 2020b. Human-centered artificial intelligence: Three fresh ideas. AIS Transactions on Human-Computer Interaction 12, 3 (2020), 109–124.
- Showkat and Grimm (2018) Dilruba Showkat and Cindy Grimm. 2018. Identifying gender differences in information processing style, self-efficacy, and tinkering for robot tele-operation. In 2018 15th international conference on ubiquitous robots (UR). IEEE, 443–448.
- Stumpf et al. (2020) Simone Stumpf, Anicia Peters, Shaowen Bardzell, Margaret Burnett, Daniela Busse, Jessica Cauchard, and Elizabeth Churchill. 2020. Gender-Inclusive HCI Research and Design: A Conceptual Review. Foundations and Trends in Human-Computer Interaction 13, 1 (2020), 1–69.
- Sundar (2020) S Shyam Sundar. 2020. Rise of machine agency: A framework for studying the psychology of human–AI interaction (HAII). Journal of Computer-Mediated Communication 25, 1 (2020), 74–88.
- Sundar and Marathe (2010) S Shyam Sundar and Sampada S Marathe. 2010. Personalization versus customization: The importance of agency, privacy, and power usage. Human communication research 36, 3 (2010), 298–322.
- Thibodeau (2018) Patrick Thibodeau. 2018. What is cognitive diversity? - definition from whatis.com. https://www.techtarget.com/searchhrsoftware/definition/cognitive-diversity
- Torrens-Burton et al. (2020) Anna Torrens-Burton, Claire J Hanley, Rodger Wood, Nasreen Basoudan, Jade Eloise Norris, Emma Richards, and Andrea Tales. 2020. Lacking pace but not precision: Age-related information processing changes in response to a dynamic attentional control task. Brain Sciences 10, 6 (2020), 390.
- van Berkel et al. (2021) Niels van Berkel, Jorge Goncalves, Daniel Russo, Simo Hosio, and Mikael B Skov. 2021. Effect of Information Presentation on Fairness Perceptions of Machine Learning Predictors. (2021).
- van der Goot and Pilgrim (2019) Margot J van der Goot and Tyler Pilgrim. 2019. Exploring age differences in motivations for and acceptance of chatbot communication in a customer service context. In International Workshop on Chatbot Research and Design. Springer, 173–186.
- Vorvoreanu et al. (2019) Mihaela Vorvoreanu, Lingyi Zhang, Yun-Han Huang, Claudia Hilderbrand, Zoe Steine-Hanson, and Margaret Burnett. 2019. From gender biases to gender-inclusive design: An empirical investigation. In Proceedings of the 2019 CHI Conference on Human Factors in Computing Systems. 1–14.
- Wang et al. (2019) Danding Wang, Qian Yang, Ashraf Abdul, and Brian Y Lim. 2019. Designing Theory-Driven User-Centric Explainable AI. In Proceedings of the SIGCHI Conference on Human Factors in Computing Systems. CHI, Vol. 19.
- Wickramasinghe et al. (2020) Chathurika S Wickramasinghe, Daniel L Marino, Javier Grandio, and Milos Manic. 2020. Trustworthy AI development guidelines for human system interaction. In 2020 13th International Conference on Human System Interaction (HSI). IEEE, 130–136.
- Wohlin et al. (2000) Claes Wohlin, Per Runeson, Martin Höst, Magnus Ohlsson, Björn Regnell, and Anders Wesslén. 2000. Experimentation in Software Engineering: An Introduction. Kluwer Academic Publishers, Norwell, MA, USA.
- Wright et al. (2020) Austin P Wright, Zijie J Wang, Haekyu Park, Grace Guo, Fabian Sperrle, Mennatallah El-Assady, Alex Endert, Daniel Keim, and Duen Horng Chau. 2020. A comparative analysis of industry human-AI interaction guidelines. arXiv preprint arXiv:2010.11761 (2020).
- Xu (2019) Wei Xu. 2019. Toward human-centered AI: a perspective from human-computer interaction. interactions 26, 4 (2019), 42–46.
- Xu et al. (2021) Wei Xu, Marvin J Dainoff, Liezhong Ge, and Zaifeng Gao. 2021. From human-computer interaction to human-AI Interaction: new challenges and opportunities for enabling human-centered AI. arXiv preprint arXiv:2105.05424 5 (2021).
- Yang et al. (2020) Qian Yang, Aaron Steinfeld, Carolyn Rosé, and John Zimmerman. 2020. Re-examining whether, why, and how human-ai interaction is uniquely difficult to design. In Proceedings of the 2020 chi conference on human factors in computing systems. 1–13.
- Yigitcanlar et al. (2020) Tan Yigitcanlar, Kevin C Desouza, Luke Butler, and Farnoosh Roozkhosh. 2020. Contributions and risks of artificial intelligence (AI) in building smarter cities: Insights from a systematic review of the literature. Energies 13, 6 (2020), 1473.
- Zanetti et al. (2020) Margot Zanetti, Stefano Rendina, Luigi Piceci, and Francesco Peluso Cassese. 2020. Potential risks of artificial intelligence in education. Form@ re-Open Journal per la formazione in rete 20, 1 (2020), 368–378.
- Zwakman et al. (2021) Dilawar Shah Zwakman, Debajyoti Pal, and Chonlameth Arpnikanondt. 2021. Usability evaluation of artificial intelligence-based voice assistants: The case of Amazon Alexa. SN Computer Science 2, 1 (2021), 1–16.
Appendix A Links to Online Appendices
-
(1)
Appendix A provides the cognitive style survey, along with the rules for discerning participants’ cognitive style values for each of the cognitive style types.
-
(2)
Appendix B shows the vignettes for both the Violation AI product and Application AI product for all 16 experiments.
-
(3)
Appendix C provides the demographic data for all participants.
-
(4)
Appendix D shows both the data and the statistical tests for all experiments and all cognitive style types.