footnote
Realised Volatility Forecasting: Machine Learning
via Financial Word Embedding
Abstract
This study develops FinText, a financial word embedding compiled from 15 years of business news archives. The results show that FinText produces substantially more accurate results than general word embeddings based on the gold-standard financial benchmark we introduced. In contrast to well-known econometric models, and over the sample period from 27 July 2007 to 27 January 2022 for 23 NASDAQ stocks, using stock-related news, our simple natural language processing model supported by different word embeddings improves realised volatility forecasts on high volatility days. This improvement in realised volatility forecasting performance switches to normal volatility days when general hot news is used. By utilising SHAP, an Explainable AI method, we also identify and classify key phrases in stock-related and general hot news that moved volatility.
Keywords: Realised Volatility Forecasting, Machine Learning, Natural Language Processing, Word Embedding, Explainable AI, Big Data.
JEL: C22, C45, C51, C53, C55, C58
1 Introduction
Many studies have attributed news as a major contributor to volatility (Engle and Ng, 1993; Engle and Martins, 2020; Conrad and Engle, 2021). In recent years, researchers have also shown an increased interest in using natural language processing (NLP) and machine learning (ML) models to extract relevant information from textual data such as news. So far, however, despite dramatic successes in other fields, these new techniques have attracted very little attention from the finance and economic scholarly communities (Gentzkow et al., 2019).
This paper explores the use of news in realised volatility (RV) forecasting using a state-of-the-art yet simple NLP model together with word embedding. Instead of using well-known general word embeddings, we develop FinText111FinText word embeddings are available for download from FinText.ai., a purpose-built financial word embedding for financial textual analysis which covers a variety of news stories around the world with added emphasis on financial news. Unlike the Loughran-McDonald (LM) dictionary approach (Loughran and McDonald, 2011) that relies on predefined lists of words for extracting sentiment, our approach extracts a substantial amount of information from a big financial textual dataset without using any manually predefined resources and model assumptions. Moreover, to analyse the explanatory power of different phrases on volatility forecasts and to identify the volatility movers, we use Explainable AI (XAI) to make the ML forecasting performance evaluation more transparent and understandable.
Most RV forecasting studies use historical RV as the primary source to forecast RV with a linear model. Heterogeneous autoregressive (HAR) models (Corsi (2009) are simple yet effective linear models for RV forecasting. The further development continued with HAR-J (HAR with jumps) and CHAR (continuous HAR) of Corsi and Reno (2009), SHAR (semivariance-HAR) of Patton and Sheppard (2015), and HARQ model of Bollerslev et al. (2016). The study of Rahimikia and Poon (2020a) provides a valuable comparison of the HAR-family of models and shows that the CHAR model is the best-performing model among the major HAR models. The authors also tested CHARx by supplementing the CHAR model with limit order book (LOB) data and sentiment variables extracted from financial news using LM predefined word lists. Although Rahimikia and Poon (2020a) has successfully demonstrated that news and LOB data helped to improve RV forecasting, it has the limitations of just using predefined sentiment word lists and capturing only linear relationships.
During the last decade, there has been a growing number of studies on the theory and application of ML in finance. Recent evidence suggests that ML models can outperform traditional financial models in portfolio optimisation (Ban et al., 2018), LOB models for short-term price predictions (Zhang et al., 2019; Sirignano and Cont, 2019; Zhang and Zohren, 2021), momentum strategies (Lim et al., 2019; Poh et al., 2021; Wood et al., 2021), estimation of stochastic discount factor (Chen et al., 2020), equity premium prediction using newspaper articles (Adämmer and Schüssler, 2020), measuring asset risk premiums (Gu et al., 2020), image processing for return prediction (Jiang et al., 2020), classifying venture capitalists (Bubna et al., 2020), designing trading strategies (Zhang et al., 2020), latent factor modelling (Gu et al., 2021), hedge fund return prediction (Wu et al., 2020), bond return prediction (Bianchi et al., 2021), and return forecasting using news photos (Obaid and Pukthuanthong, 2021), to name a few. In the context of RV forecasting, Rahimikia and Poon (2020b) comprehensively examined the performance of long short-term memory (LSTM), a leading ML model for sequence modelling (Goldberg, 2016), using LOB data and news sentiments. They show that LOB data has strong forecasting power compared to the HAR-family of models, and adding news sentiment variables to the dataset only improves the forecasting power marginally. However, Rahimikia and Poon (2020b) deals only with sentiment extracted from news using the LM lists of words. The two principal limitations of the LM dictionary are that it does not consider language complexities and it is developed from 10-K reports.
There are a few studies focusing on statistical and ML models for sentiment extraction to predict asset returns (Ke et al., 2019), textual factor analysis (Cong et al., 2019), topic modelling (Bybee et al., 2020), sentiment-scoring in economic news articles (Shapiro et al., 2020), and developing word embedding for analysing corporate culture during the COVID-19 pandemic (Li et al., 2020). However, to date, there has been little focus on more advanced NLP models for financial forecasting. Much of the current trend on NLP focuses on word embedding (Mikolov et al., 2013), a more sophisticated word representation that paved the way for more advanced text-oriented ML models. As a major review of textual analysis in accounting and finance, Loughran and McDonald (2016) warns that these more complex ML models potentially add more noise than signal. We believe the signal-to-noise of ML models is manageable if the ML models can simultaneously improve performance and generate transparent results via XAI or other similar approaches. Indeed, we will demonstrate the use of XAI to interrogate the ML models implemented here.
We develop FinText, a financial word embedding compiled from 15 years of business news archives. The usefulness of FinText will be compared with two well-known general word embeddings by Google and Facebook using industry-standard general-purpose benchmarks. Since FinText is developed using specialist business news archives, we proposed further evaluation using the new gold-standard financial benchmark developed in this study. We show that FinText, our specialist financial word embedding, is more sensitive to financial context compared with the general word embeddings. The gold-standard financial benchmark contains 2660 unique analogies, and the results show that FinText is about 8 (512) times more accurate than Google Word2Vec (WikiNews) word embedding. Despite being developed based on a much smaller corpus, FinText outperformed well-known general word embeddings in this benchmark.
In this study, we also investigate the usefulness of word embeddings by introducing a simple NLP model for RV forecasting. Using 23 NASDAQ stocks for the period from 27 July 2007 to 27 January 2022 and by using just previous day stock-related news headlines, this model with FinText word embedding performs better in RV forecasting, especially for high volatility days. Interestingly, this improvement in RV forecasting performance switches to normal volatility days when general hot news covering major economic, financial, political, and geopolitical news stories is used. We also find the general word embeddings are better in this case as the general hot news covers a much bigger collection of vocabularies, and more common semantics better match general word embeddings that were trained using much bigger corpora. Moreover, Since FinText was compiled using financial news up to 2015, we show a gradual decrease in forecasting performance over time as more words appear as out of vocabulary (OOV).
Next, we test ensemble models by combining the base model that has good performance for forecasting RV on high volatility days with three ML models that have good performance for forecasting RV on normal volatility days in this study and in Rahimikia and Poon (2020b). We find the base model in this study produces the best results when combined with the best-performing model in Rahimikia and Poon (2020b) utilising financial data viz. HAR and LOB variables together; the composite forecasts from this ensemble model produce the best forecasts for both normal and high volatility days. This outcome shows that financial numbers and textual news complement each other; both are important and useful for volatility forecasting.
Last but not least, we identify the list of top phrases (n-grams) in stock-related and general hot news headlines that can be considered as volatility movers by utilising SHAP, an XAI method. Then we manually put these phrases into n-gram groups. For stock-related news, groups like analyst opinions, company events, numbers, and announcements are identified as volatility movers. For general hot news, person names, places, and legal entities are among volatility movers. Discovering such clear and in-depth information about the key phrases that moved volatility is not feasible in the classical dictionary-based approaches.
The remaining of this paper is organised as follows: Section 2 deals with the theory of word embedding, Word2Vec, and FastText algorithms. Section 3 covers FinText, the financial word embedding developed here. News preprocessing steps are covered in Subsection 3.1, and evaluation and representation of this proposed word embedding are covered in Subsection 3.2. Section 4 gives a brief review of RV and HAR models for RV forecasting in Subsection 4.1. Subsection 4.2 proposes the NLP model for RV forecasting, and Subsection 4.3 introduces the XAI method. Next, Section 5 presents the findings of the research, focusing on the stock-related news in Subsection 5.1, general hot news in Subsection 5.2, and ensemble models in Subsection 5.3. Section 6 presents the XAI results by comparing the XAI and LM dictionary in Subsection 6.1 and identify and classify volatility movers in Subsection 6.2. Section 7 looks at robustness checks and finally, Section 8 concludes with a discussion.
2 Word Embedding
Word embedding is one of the most important recent developments in NLP, where a token222In NLP, a token is a sequence of characters representing a single unit of meaning, such as a word, number, or punctuation mark. is represented by a real-valued vector, such that words that are closer in the vector space are similar in meaning. Before the development of word embedding, each token in one-hot encoding was defined by a binary vector of zeroes except the index for that token. The vectors of any two tokens are orthogonal to each other. Hence, word embedding is a better representation of semantics. Specifically, word embedding is an matrix, where is the dimension size, and is the number of unique tokens in the vocabulary list. A vector of values represents each token, which is usually about 300 in the literature. Word2Vec (Mikolov et al., 2013) and FastText (Bojanowski et al., 2017) are among the most efficient algorithms for training word embedding. Subsection 2.1 and Subsection 2.2 briefly review these two simple and efficient algorithms.
2.1 Word2Vec
Mikolov et al. (2013) proposed supervised learning models with skip-gram and continuous bag-of-words (CBOW) log likelihoods for the Word2Vec algorithm as shown below:
| (1a) | |||
| (1b) | |||
where is the total number of tokens in the sequence , is the window size around the chosen token , and and are the probability of correct predictions of skip-gram and CBOW models, respectively. In skip-gram, the input (middle) token is used to predict the context (surrounding tokens), whereas the context (surrounding) tokens are used to predict the middle token in CBOW. It is generally agreed that the faster CBOW is suited for training larger datasets, while the skip-gram is more efficient for training smaller datasets. Both models aim to maximise the aggregate predictive probability in Equation 1a and Equation 1b based on a simple neural network.
For both skip-gram and CBOW, the softmax operation for calculating the conditional probability, , is defined as follows:
| (2a) | |||
| (2b) | |||
where and are context and target tokens, and are the trainable vector of and , and is the number of tokens in the vocabulary. For the CBOW model in Equation 2b, as there is more than one context token, the average of the context token vectors, , is used. Both models are trained using stochastic gradient descent. When is large, Equation 2a and Equation 2b are computationally expensive. In this case, hierarchical softmax (Morin and Bengio, 2005) can be used instead. An alternative is the negative sampling method with a binary logistic regression (Mikolov et al., 2013).
2.2 FastText
FastText is an extension of Word2Vec, particularly useful in the case of rare words by making use of character-level information. Each word is represented as a bag of character n-grams in addition to the word itself. Take ‘profit’ as an example, and set in character n-gram; the FastText representation is {¡pr, pro, rof, ofi, fit, it¿, ¡profit¿}. The boundary symbols, ¡ and ¿, are added to help preserve the meaning of shorter words that may appear as n-grams of other words, e.g. ‘fit’ vs ¡fit¿. Inherently, FastText also allows one to capture meaning for suffixes and prefixes. More formally, for token , where is the vector of token , is the number of n-gram of this token, and is the vector of each sub-token. Compared with the Word2Vec algorithm, this approach is more powerful for learning rare and OOV tokens and morphologically rich languages (MRL) (Bojanowski et al., 2017). In contrast, Word2Vec can only generate embeddings for words that are present in the training data, making it less effective for handling OOV tokens.
3 Financial Word Embedding: FinText
At the time of writing, several well-known word embeddings are available. These include Mikolov et al. (2018) three-million-unique-tokens word embedding trained using Word2Vec algorithm and the Google news dataset with about 100 billion words, and Joulin et al. (2016) one-million-unique-tokens word embedding trained using FastText algorithm and Wikipedia 2017, UMBC webbase corpus and statmt.org news dataset. It is arguable if these general word embeddings are suitable for specialist financial research because some words will have a very different meaning when used in a specific financial context, e.g., apple as fruit and Apple as the technology company. To address this concern, we train FinText word embedding using the Dow Jones Newswires Text News Feed database from 1 January 2000 to 14 September 2015. This big news database, specialised in business news, is among the best, covering different news agencies worldwide. Subsection 3.1 describes the database, the preprocessing steps and the properties of the word embedding developed from it, and Subsection 3.2 compares our FinText with the general word embeddings mentioned above.
3.1 News Data, Preprocessing Steps and Model Properties
This study uses all news stories in the Dow Jones Newswires Text News Feed for the period from January 1, 2000, to September 14, 2015, to develop different word embeddings. All duplicate news stories and stories without headlines and bodies are removed. Extensive text pre-processing of the text is required to eliminate redundant characters, sentences, and structures. LABEL:table_textual_cleaning_rules in the Appendix presents a brief review of the cleaning rules applied. Each rule is defined by a regular expression and may contain different variations. For brevity, only one variation is shown in this table. The text cleaning procedures fall into five main categories: 1) Primary, 2) Begins with, 3) Ends with, 4) General, and 5) Final checks. ‘Primary’ extracts the body of news from the extensible markup language (XML), removing XML-encoding characters (XMLENCOD), converting XML to text (parsing), converting uppercase to lowercase letters, and removing tables. ‘Begins with’ and ‘Ends with’ remove, respectively, parts begin and end with the specified structures. ‘General’ caters for patterns that may appear in any part of the news stories. Finally, ‘Final checks’ removes links, emails, phone numbers, short news (lower than 25 characters), and the leading and trailing space(s). These five sets of rules are applied to news headlines and bodies separately.

Notes: This figure shows the total number of words (billion) in the corpus used for training Google Word2Vec (Mikolov et al., 2018), WikiNews (Joulin et al., 2016) and FinText word embedding. Google Word2Vec, WikiNews, and FinText corpora contain 100 billion, 16 billion, and 4.32 billion words, respectively.
Due to the importance of numbers in accounting and finance, all numbers are kept when training FinText. This is important in keeping the sentences intact when the order of tokens is an essential source of information.333As an example, removing numbers changes ‘Over 540,000 apps wiped from Apple App Store in Q3 reaching lowest number in 7 years’ to ‘Over apps wiped from Apple App Store in Q reaching lowest number in years’. This substantial change in meaning is harmful when the model is not just counting single-word tokens like the dictionary approach, but the order of tokens is essential. Figure 1 shows the total number of words (in billion) used for training Google Word2Vec (Mikolov et al., 2018), WikiNews (Joulin et al., 2016) and FinText word embedding. Google Word2Vec, WikiNews, and FinText corpora contain 100 billion, 16 billion, and 4.32 billion words, respectively. Quite clearly, FinText uses a substantially much smaller corpus compared with the other two well-known general word embeddings. Regarding Google Word2Vec, the data period is not clearly defined, but 2013 is the approximate end year. The data period for WikiNews is from 2007 to 2017.
After cleaning the data, tokenisation breaks the headlines and news bodies into sentences and, then, words. Common bigram phrases are detected and replaced with their bigram form. All tokens with less than five times of occurrences are ignored, the proposed bigram scoring function in Mikolov et al. (2013) is used with ten as the threshold value, and the maximum vocabulary size is set to 30 million to keep the memory usage under control. Finally, the ‘_’ character is used for glueing pairs of tokens together, e.g., ‘financial’ and ‘statement’ become ‘financial_statement’. Altogether, FinText consists of 2,733,035 unique tokens. Following the pre-processing steps, Word2Vec and FastText algorithms are applied with window size, minimum count444The model ignores tokens with lower frequency than this value., negative sampling555Number of added noisy tokens matched with each chosen token., and the number of iterations666Number of epochs over the corpus. all set equal to 5. The initial learning rate (alpha) is 0.025, the minimum learning rate is 0.0001, and the exponent for negative sampling distribution is 0.75. Also, the dimension of word embedding is 300. All these parameter values are chosen following the developers’ recommendations.
3.2 Evaluation and Representation
In total, we trained four versions of FinText word embedding, viz. Word2Vec(skip-gram), Word2Vec(CBOW), FastText(skip-gram), and FastText(CBOW), indicating the utilised algorithm(model). In this subsection, we compare the accuracy of FinText against the two pre-trained word embeddings, Google’s Word2Vec(skip-gram)777Word2Vec algorithms are downloadable from https://code.google.com/archive/p/word2vec/ and WikiNews’ FastText(skip-gram)888FastText algorithms are downloadable from https://fasttext.cc/ using three sets of benchmarks.
Word2Veca FastText Section FinTextb (CBOW)c FinText (skip-gram) Google (skip-gram) WikiNews (skip-gram) FinText (skip-gram) FinText (CBOW) capital-common-countries 77.27 85.50 83.60 100 85.93 47.40 capital-world 63.60 75.87 82.72 98.78 71.06 35.79 currency 22.49 36.69 39.84 25.00 32.54 10.65 city-in-state 19.93 60.48 74.64 81.41 58.20 15.83 family 63.46 70.51 90.06 98.69 58.97 59.62 gram1-adjective-to-adverb 27.47 33.00 32.27 70.46 50.59 79.45 gram2-opposite 33.33 32.50 50.53 73.91 50.83 71.67 gram3-comparative 77.65 75.04 91.89 97.15 77.06 87.39 gram4-superlative 61.67 55.00 88.03 98.68 62.14 90.71 gram5-present-participle 62.30 61.24 79.77 97.53 70.63 76.06 gram6-nationality-adjective 88.11 93.23 97.07 99.12 94.05 79.05 gram7-past-tense 42.02 39.92 66.53 87.25 37.98 31.09 gram8-plural 59.23 62.46 85.58 98.69 70.92 79.54 gram9-plural-verbs 53.26 54.53 68.95 97.38 61.59 79.17 overall 53.65 62.86 77.08 91.44 65.00 55.74 a For learning word embedding from textual datasets, Word2Vec is developed by Mikolov et al. (2013) and FastText, as an extension to Word2Vec algorithm, is developed by Bojanowski et al. (2017). b Developed financial word embedding in this study (FinText); Publicly available word embedding trained on a part of Google news dataset (Google); Publicly available word embedding trained on Wikipedia 2017, UMBC webbase corpus and statmt.org news dataset (Mikolov et al., 2018) (WikiNews). c CBOW and skip-gram are the proposed supervised learning models for learning distributed representations of tokens in Mikolov et al. (2013).
Word2Veca FastText Benchmark FinTextb (CBOW)c FinText (skip-gram) Google (skip-gram) WikiNews (skip-gram) FinText (skip-gram) FinText (CBOW) WordSim-353d (relatedness) 0.3821 0.4993 0.6096 0.6018 0.4425 0.1677 WordSim-353 (similarity) 0.6126 0.6436 0.7407 0.6713 0.6393 0.4722 Simlex 0.2657 0.2650 0.3638 0.3985 0.2772 0.2574 a For learning word embedding from textual datasets, Word2Vec is developed by Mikolov et al. (2013) and FastText, as an extension to Word2Vec algorithm, is developed by Bojanowski et al. (2017). b Developed financial word embedding on Dow Jones Newswires Text News Feed database (FinText); Publicly available word embedding trained on a part of Google news dataset (Google); Publicly available word embedding trained on Wikipedia 2017, UMBC webbase corpus and statmt.org news dataset (Mikolov et al., 2018) (WikiNews). c CBOW and skip-gram are the proposed supervised learning models for learning distributed representations of tokens in Mikolov et al. (2013). d WordSim-353 (Agirre et al., 2009) is a gold-standard collection for measuring word relatedness and similarity, and Simlex (Hill et al., 2015) is another gold-standard collection tending to focus on similarity rather than relatedness or association.
Word embedding Analogy Google WikiNews FinTexta debit:credit :: positive:X positive negative negative bullish:bearish :: rise:X rises rises fall apple:iphone :: microsoft:X windows_xp iphone windows us:uk :: djia:X NONEb NONE ftse_100 microsoft:msft :: amazon:X aapl hmv amzn bid:ask :: buy:X tell ask- sell creditor:lend :: debtor:X lends lends borrow rent:short_term :: lease:X NONE NONE long_term growth_stock:overvalued :: value_stock:X NONE NONE undervalued us:uk :: nyse:X nasdaq hsbc lse call_option:put_option :: buy:X NONE NONE sell a FinText is the financial word embedding developed using the Word2Vec algorithm and skip-gram model. b Not in the vocabulary list.
3.2.1 General-Purpose Benchmarks
Table 1 compares four versions of FinText against general word embeddings based on the Google analogy benchmark. Each section in the Google analogy benchmark contains a group of analogies. For example, under the ‘capital-common-countries’ section, the word embedding is challenged with questions like ‘London to England is like Paris to ?’. From Table 1, it is apparent that, except for ‘currency’ and ‘gram1-adjective-to-adverb’, WikiNews has the highest predictive accuracy. The overall evaluation score confirms this finding. For this general-purpose benchmark, FinText is outperformed by Google under Word2Vec and outperformed by WikiNews under FastText. The individual and overall scores for FinText suggest the skip-gram model works better than CBOW.
Table 2 presents the predictive accuracy based on the gold-standard collections, viz. WordSim-353 (Agirre et al., 2009) for measuring word relatedness and similarity, and Simlex (Hill et al., 2015) that focuses on similarity. All collections contain human-assigned judgements about the relatedness and similarity of word pairs. Performance is measured by Spearman’s rank correlation coefficient. It is apparent from Table 2 that the Google word embedding outperformed under WordSim-353 and the WikiNews word embedding outperformed under Simlex. As before, FinText is outperformed by Google under Word2Vec and outperformed by WikiNews under FastText. Also, for both Word2Vec and FastText algorithms, except for one case, the skip-gram model is better than the CBOW model.
3.2.2 Financial-Purpose Tasks; examples
While the two general word embeddings, Google Word2Vec and WikiNews, outperformed under the general-purpose benchmarks in Subsubsection 3.2.1, FinText also showed relatively fair performance for those general tasks. Here, we compare these word embeddings using financial tasks and financial relationships. LABEL:2D_visualisation_word_embedding presents the 2D visualisation of the principal component analysis (PCA) of the word embedding 300-dimensional vectors. (x-axis) and (y-axis) show the first and second obtained dimensions. The tokens are chosen from groups of technology companies (‘microsoft’, ‘ibm’, ‘google’, and ‘adobe’), financial services and investment banks (‘barclays’, ‘citi’, ‘ubs’, and ‘hsbc’), and retail businesses (‘tesco’ and ‘walmart’). Word2Vec is shown in the top row, and FastText is shown in the bottom row. LABEL:2D_visualisation_word_embedding shows that only FinText clusters all sector groups correctly, and Word2Vec produces generally better results than FastText.
Next, we challenged all six word embeddings to return three top tokens that are closest to ‘morningstar’.999Morningstar is an American financial services firm founded in 1984. For Google Word2Vec, This token is not among the training tokens. The answer from WikiNews is {‘daystar’, ‘blazingstar’, and ‘evenin’} which is wrong. The only logical answer is from FinText (Word2Vec/skip-gram) {‘researcher_morningstar’, ‘tracker_morningstar’, and ‘lipper’}.101010Thomson Reuters Lipper is an American financial services firm was founded in 1973. When asked to find the unmatched token in {‘usdgbp’, ‘euraud’, ‘usdcad’}, a collection of exchange rates mnemonics, the results were as follows: Google Word2Vec and WikiNews could not find these tokens, while FinText (Word2Vec/skip-gram) produces the sensible answer, ‘euraud’. Word embeddings are also expected to solve word analogies such as king:man :: woman:queen.111111‘:’ means ‘is to’ and ‘::’ means ‘as’. Table 3 lists the responses for some financial challenges produced by these word embeddings. It is clear that FinText is more sensitive to financial contexts and able to capture very subtle financial relationships.
3.2.3 Introducing Gold-Standard Financial Benchmark
Word2Veca FastText Group FinTextb (CBOW)c FinText (skip-gram) Google (skip-gram) WikiNews (skip-gram) FinText (skip-gram) FinText (CBOW) \@slowromancapi@ Ticker to City (US) 14.74 23.68 0.26 0.00 15.00 1.05 \@slowromancapii@ Name to Ticker (US) 38.55 43.29 0.13 0.00 34.61 19.08 \@slowromancapiii@ Name to Incorporation year (US) 25.70 28.86 0.09 0.00 23.07 12.72 \@slowromancapiv@ Name to Exchange (US) 26.71 23.03 4.08 0.07 17.37 9.54 \@slowromancapv@ Name to State (US) 27.32 19.53 6.47 0.11 13.95 7.63 \@slowromancapvi@ Name to Country (US & UK) 27.32 19.53 6.47 0.11 13.95 7.63 \@slowromancapvii@ Name to Country (US, UK, China, & Japan) 21.84 15.75 4.62 0.08 10.94 5.45 Overall 25.63 24.54 3.01 0.05 18.12 8.83 a For learning word embedding from textual datasets, Word2Vec is developed by Mikolov et al. (2013) and FastText, as an extension to Word2Vec algorithm, is developed by Bojanowski et al. (2017). b Developed word embedding in this study (FinText); Publicly available word embedding trained on a part of Google news dataset with about 100 billion words (Google); Publicly available word embedding trained on Wikipedia 2017, UMBC webbase corpus and statmt.org news dataset (Mikolov et al., 2018) (WikiNews). c CBOW and skip-gram are the proposed supervised learning models for learning distributed representations of tokens in Mikolov et al. (2013).
Subsubsection 3.2.2 showed that FinText has superior performance in financial-purpose tasks. Here, we introduce the first gold-standard financial benchmark for systematically comparing word embeddings using a financial language framework.121212This gold-standard financial benchmark is available for download from FinText.ai. Table 4 consists of seven groups of financial analogies. All financial analogies are developed using the Bureau van Dijk’s Orbis database. The first five groups cover publicly listed US companies, the sixth group mixes US and UK publicly listed companies, and the last group mixes US, UK, China, and Japan publicly listed companies. In Table 4, ‘Ticker’ is the security ticker identifier, ‘Name’ is the full name of the company, ‘City’ is the headquarters location, ‘Exchange’ is the stock exchange where the company’s share is traded, ‘Country’ is the country where headquarters is located, ‘State’ (for US companies) is the state where the headquarters is located, and finally ‘Incorporation year’ is the incorporation year of the company.
To generate sufficient challenges, we chose the top 20, 10 and 5 companies from the ‘very large companies’ class for groups \@slowromancapi@-\@slowromancapv@, \@slowromancapvi@ and \@slowromancapvii@, respectively. The permutation of chosen companies in each group generates 380 unique analogies for each group and 2660 analogies in total. An answer is considered correct when it is among the top five answers.131313We found five as a fair value for this benchmark. A smaller value makes the benchmark stricter, and a larger value makes it more lenient. The accuracy of each word embedding is reported for each group and all groups (overall). There are some important considerations in the development of the gold-standard financial benchmark. First, these key company information are chosen because they do not change over time. Second, to have a fair benchmark, only unigram key elements are kept, and the rest is removed from the list. Finally, UK, China, and Japan are among the countries with the largest stock markets in the world. Therefore, we expanded our benchmark by including these countries in the last two groups.
Table 4 shows clearly that FinText has substantially better performance than all other word embeddings; it is 8 times better than Google Word2Vec, and 512 times better than WikiNews. WikiNews accuracy is lower than 0.1% for all sections, with an overall accuracy of 0.05%. For Google Word2Vec, the overall accuracy is 3.01%. Among different variations of FinText, Word2Vec(CBOW) shows slightly better performance than the skip-gram variant. The results here clearly indicate that even though the two general word embeddings were developed using a substantially larger corpus, their performance in financial tasks is poor; therefore, a smaller financial word embedding is much more efficient for financial tasks. In Section 4 below, we will design an NLP model to exploit word embeddings in RV forecasting.
4 NLP for Realised Volatility Forecasting
Engle and Ng (1993) and Engle and Martins (2020) showed news is an important driver for stock market volatility. Here, we develop an NLP model to exploit news headlines’ content in forecasting the RV of individual stocks. It is worth noting that this NLP model has a flexible structure; therefore, it can be used to model and forecast any financial attribute, such as stock returns. Here, we focus on using this NLP model in forecasting RV; Subsection 4.1 gives a brief review of RV forecasting models, Subsection 4.2 presents our NLP model, and Subsection 4.3 introduces XAI.
4.1 Realised Volatility Forecasting
Assume asset price follows the stochastic process below:
| (3) |
where is the drift, is the standard Brownian motion, and is the volatility process (càdlàg function). RV, defined below, is used as a proxy for the unobserved integrated variance, :
| (4) |
where is the sampling frequency and .
To date, the HAR-family of models is the most popular group of econometric models for forecasting RV. All HAR models follow the general specification below:
| (5) |
where is the forecasted RV, is the average RV of the last days, is the jump component141414 is the jump at time , where . is the maximum value of sampling frequency, is the return at day and sampling frequency , and (Corsi and Reno, 2009)., of day is the average bipower variation (BPV) of the last days, is the positive/negative intraday return151515 and (Patton and Sheppard, 2015)., is the average realised quarticity161616 (Bollerslev et al., 2016). of the last days, and is a linear regression. Focusing on a long out-of-sample time horizon, Rahimikia and Poon (2020a) found the CHAR model to be the best-performing HAR model, among others. In Equation 5, the variable for the term in the CHAR model are the previous day , the average of last week , and the average of last month (Corsi and Reno, 2009).
In this study, the training period is from 27 July 2007 to 11 September 2015 (2046 days), and the out-of-sample period is from 14 September 2015 to 27 January 2022 (1604 days). A rolling window with a block size of 2046 days is applied as a forecasting procedure. RV is calculated for the NASDAQ market trading hours (from 9:30 AM to 4:00 PM Eastern Time). The LOB data from LOBSTER is used to calculate RV after applying the cleaning steps described in Rahimikia and Poon (2020a). The RV descriptive statistics of 23 NASDAQ stocks are presented in Table 5. These tickers are chosen based on their liquidity and data availability during the sample period.
Ticker Min Max \nth1 quantile Median \nth3 quantile Mean STD Kurtosis Skewness AAPL 0.102 229.420 0.899 1.733 3.680 4.623 12.596 111.012 9.124 MSFT 0.067 216.181 0.829 1.449 2.814 3.237 8.125 194.004 11.275 INTC 0.030 318.697 1.103 1.873 3.577 4.299 11.628 294.963 13.982 CMCSA 0.004 237.387 0.910 1.632 3.320 3.821 9.697 192.169 11.462 QCOM 0.122 373.543 1.024 1.975 4.129 5.073 15.380 200.609 12.100 CSCO 0.047 343.946 0.886 1.561 3.028 4.115 13.160 212.453 12.258 EBAY 0.205 252.608 1.319 2.271 4.356 5.082 12.592 142.684 10.009 GILD 0.064 259.489 1.167 1.892 3.379 4.304 12.930 182.820 12.063 TXN 0.177 287.897 1.047 1.905 3.748 4.014 9.820 311.666 14.242 AMZN 0.065 547.030 1.305 2.336 4.808 6.200 19.359 242.205 12.735 SBUX 0.052 265.094 0.864 1.594 3.423 4.201 11.237 161.435 10.626 NVDA 0.159 1104.351 2.282 4.358 9.084 9.756 30.117 586.612 20.058 MU 0.292 484.388 3.570 6.246 11.912 12.818 25.734 89.141 7.960 AMAT 0.292 531.579 1.783 3.028 5.712 6.005 14.632 532.194 18.338 NTAP 0.119 462.821 1.503 2.587 5.154 6.289 18.008 201.510 11.934 ADBE 0.119 569.720 1.099 2.020 3.908 4.947 15.003 588.095 18.867 XLNX 0.229 265.374 1.296 2.363 4.787 5.005 11.941 194.718 11.764 AMGN 0.032 214.156 0.969 1.593 2.872 3.398 9.612 183.759 11.898 VOD 0.055 219.033 0.687 1.342 3.137 3.933 10.869 122.252 9.601 CTSH 0.189 485.894 0.984 1.764 4.161 5.288 15.757 325.214 14.287 KLAC 0.154 499.808 1.456 2.710 5.416 5.919 16.878 354.626 16.033 PCAR 0.039 389.930 1.157 2.162 4.633 5.125 12.108 313.338 13.010 ADSK 0.268 693.772 1.644 2.765 5.167 6.644 22.377 388.131 16.554
4.2 NLP Model Structure
Figure 2 is an abstract representation of the NLP model. is the vector of tokens from news headlines on day . When is less than 500, the padding process will fill the vector to 500 with ‘NONE’ so that the daily inputs to the neural network have the same length. The reason for using only the news headline and not the news body is that putting all the news bodies together makes the sequence of tokens extremely long, even for just one day. A very long token sequence stresses the computation and could result in over-fitting, especially when our training sample size is relatively small. Also, it is often felt that the news headline is the most important abstract of the news body.
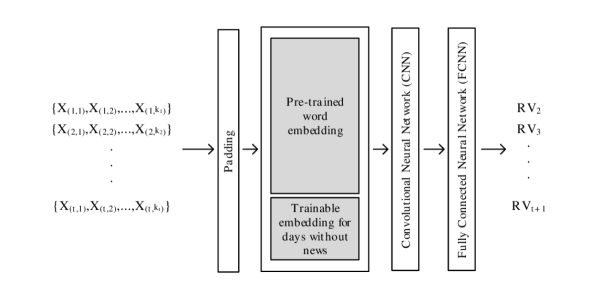
Notes: consists of news headlines of day and is the th token of input . Also, is the RV of day (next day RV). Padding with a maximum length of 500 is adopted to ensure that all inputs of the neural network have the same length. The word embedding block consists of two different word embeddings. To capture days without any news, a trainable word embedding is used.
As shown in Figure 2, the word embedding block is separated into days with news and days without news. For days with news, each token, , has a word embedding vector from one of the six word embeddings in Section 3. These vectors are fixed and made non-trainable to reduce the number of parameters to be trained. This results in a sentence matrix to be fed into a convolutional neural network (CNN) block. On days when there is no news, the vector is initially filled with random numbers that can be trained. After the CNN block, there is a fully connected neural network (FCNN) that turns the signals into a single RV forecast, .171717This is a simple yet flexible and powerful framework because it simply links textual data as input (independent variable) with the RV forecast as output (dependent variable). Depending on the research question, one can easily replace RV with other targeted variables in empirical asset pricing. This NLP model is also free of statistical assumptions and can handle a high degree of nonlinearities. Finally, following Bollerslev et al. (2016), an ‘insanity’ filter is applied: For each rolling window, the minimum, maximum, and average of training RVs are calculated. Any RV forecast that is greater (smaller) than the maximum (minimum) value will be replaced by the rolling window average RV.

Notes: The sentence matrix is a matrix with a maximum length of padding of 500 and word embedding dimensions of 300. In this matrix, each token is defined by a vector of 300 values. This structure contains three filters of different sizes. The filters with the size of 1, 2, and 3 generate feature maps with the size of 500, 499, and 498, respectively. Global max pooling and an FCNN are applied then as the next steps. The output of this network is the RV of the next day ().
Figure 3 illustrates the detailed structure of the model. Starting from the sentence matrix from Figure 2 for the news headline, ‘apple looks to be further beefing up siri.’, three filters of size {1, 2, 3}181818We choose filter size of {1, 2, 3}, which equivalent to {unigram, bigram, trigram}. As described in Subsection 3.1, FinText includes unigram and bigram; therefore, theoretically, this model can cope up to 6-grams. are applied simultaneously with valid padding191919In VALID padding (in contrast to SAME padding), the output feature map has a smaller vector size than the input word embedding vector size. and a stride size202020Stride size defines the amount of filter movement over the word embedding vector. of 1. Also, for each filter size, 25, 50, 75, and 100 sets of filters are tested in this study. The outputs are three 1-dimensional feature maps of size {498, 499, 500}. Following Kim (2014), let be the -dimensional token vector corresponding to the th token in the news headline. From Figure 2, ; news headlines with less than 500 tokens will be padded with ‘NONE’ to make sure all vectors have the same length. Let refer to the concatenation of token vectors as follows:
| (6) |
where is the concatenation operator. A convolution operation involves a filter , which is applied to a window size of tokens to produce a new feature as follow:
| (7) |
where is a bias term, and is a nonlinear function. This filter is applied to each possible window of tokens in the sentence to produce a feature map with ,
| (8) |
As the next step, global max-pooling () is applied. This step is used to ensure that the most important feature is chosen (Collobert et al., 2011). For converting the global max-pooling layer to the RV of the next day (), an FCNN is used as the last layer. The activation function of both the CNN and the FCNN is a rectified linear unit (ReLU)212121Using Relu activation function for FCNN prevents the model from generating negative RVs., the optimisation algorithm is Adam (Kingma and Ba, 2014), and MSE is set as the objective function. To prevent the model from over-fitting, regularisation with a weight decay value set equal to 3 is used for both CNN and FCNN, while the dropout rate is set equal to 0.5 between the CNN and FCNN. The timespan for headlines of the day starts from 9:30 AM Eastern Time of day and ends at 9:30 AM Eastern Time of the day . Daily training of this model is computationally intensive; therefore, the training process is repeated every thirty days to use the re-trained model in the following days. In order to have reproducible results, a random number generator (RNG) with the same seed is used for all trained models.
Dow Jones Newswires Text News Feed provides a tagging system for news stories related to a specific stock. Here, we use the tag ‘about’ to extract stock-related news for the tickers in our sample. Other tags (e.g., ‘significant’) might be more relevant, but they were implemented much later in our sample period. In contrast to stock-related news, to better understand the effect of general news stories on RV, we expand our analysis to the general hot news. News stories without any tags are chosen for this group. A ‘Hot’ tag also means a news story is deemed ‘important’ or ‘timely’ in some way. To reduce the length of daily tokens, general hot news is restricted to US market news only. What is important for us to recognise here is that this procedure assures the news stories for stock-related news and general hot news are distinct. As expected, Figure 4 shows there is a lot more general hot news (see Figure 4(b)) than stock-related news (see Figure 4(a)). Hence, the padding value is increased from 500 to 2000 for general hot news.
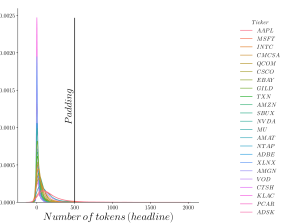
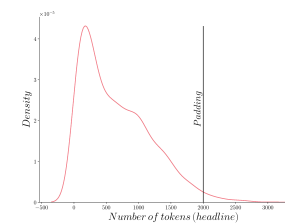
Notes: The number of daily tokens is calculated, and their distributions are plotted after putting daily stock-related news (left plot) and general hot news (right plot) headlines together (train data - 2046 days). The vertical line is the chosen maximum length of the padding.
4.3 Explainable AI (XAI)
This subsection describes shapely additive explanations (SHAP), one of the well-known XAI methods for making ML models more transparent. Lundberg and Lee (2017) proposed the SHAP method based on the coalition game theory. Shapley values , defined below, show the importance of a model input (a set of tokens in daily news headlines) given the model output , the volatility forecast. In this case:
| (9) |
where captures the marginal contribution in volatility forecast of adding token to the set , contains all model inputs, shows the number of different ways the chosen set of tokens may be presented, and is the number of different ways that the remaining tokens could have been added. The Shapley values show the magnitude and sign of the average contribution of token ; it satisfies three properties, viz. local accuracy (additivity)222222It means that the sum of individual token attributions is equal to the forecasted RV., missingness (nonexistence or null effect)232323It means that a missing token has no attributed impact ()., and consistency (symmetry)242424It means that if a change in a specific token has a more considerable impact on the first model compared to the second model, the importance of this token should be higher for the first model than the second model.. As tokens are added to the set, changes in the RV forecast reflect their relevance. The benefits of the SHAP approach include a solid theoretical foundation in game theory and no requirement for differentiable models. However, it is computationally intensive, and, like other permutation-based approaches, it does not consider feature dependencies and may generate misleading results. Here, we use a high-speed approximation algorithm, Deep SHAP based on DeepLIFT (Shrikumar et al., 2017), to calculate SHAP values.
Following Zhao et al. (2020), SHAP is applied to the classification block of the model (FCNN). The inputs, in this case, are outputs of the global max pooling layer, and the output is the forecasted RV in Figure 3. Therefore, the number of inputs is equal to , where is the number of filters, and 3 is the number of filter sizes (unigram, bigram, and trigram). Applying SHAP on the full model causes misleading results because nonexistent words may mistakenly receive high SHAP scores. However, by applying SHAP on the classification block, the permutation is done over extracted features from filters; therefore, the SHAP scores are attributed to the unigrams, bigrams, and trigrams. Moreover, duplication of filters is common in CNN, especially for large values (RoyChowdhury et al., 2017), and this could result in similar n-grams being generated. In order to avoid this, a de-duplication step is applied by deleting repeated n-grams and calculating the new SHAP value by adding up the related SHAP values.252525Zhao et al. (2020) proposed two steps for de-duplication, namely ‘exact de-duplication’ (applied in this study) and ‘merge de-duplication’. In ‘merge de-duplication’, overlapped n-grams are merged, and their SHAP value is calculated by adding up the SHAP values of the constituent n-grams. Due to the generally shorter input text length, our experiments show that incorporating ‘exact de-duplication’ is sufficient to reach more granular results.
For each stock, we obtained the SHAP values for the constituent n-grams of all the textual information used to forecast RV for that stock. In order to identify the volatility movers for the entire sample of 23 stocks, first, we store, for each stock, the top five n-grams with the highest absolute SHAP values for the full out-of-sample forecast period. This results in 23 groups of five n-grams, with some overlapping n-grams. Next, for each n-gram, we count the number of repetitions , with . The n-gram with means this specific n-gram appears among the top five n-grams for all 23 stocks. The content of these n-grams is analysed and classified in Subsection 6.2.
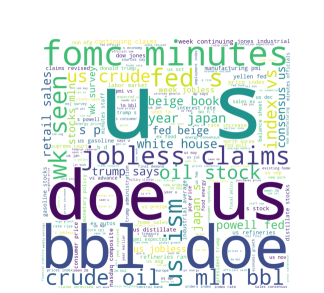
Notes: (a) Word cloud of stock-related headlines for all 23 stocks together over the out-of-sample period. (b) Word cloud of general hot headlines over the out-of-sample period.
5 Results
In this section, we compare the performance of the NLP model against CHAR, the best-performing HAR model in Rahimikia and Poon (2020a), for forecasting RV. The performance difference between the model and CHAR, for each stock and year , is calculated as follow:
| (10) | ||||
| (11) |
In Equation 10 and Equation 11, MSE can be replaced by QLIKE.262626 where and are, respectively, the true and fitted RV at time . Patton (2011) showed that QLIKE, MSE, and their variants are the only class of robust loss functions for ranking volatility forecasting models. For both MSE and QLIKE, a negative value in Equation 10 and Equation 11 means the NLP model outperforms CHAR and vice versa for a positive value. Finally, the reality check (RC) is used for comparing the NLP model against each and every model in the HAR-family (viz. AR1, HAR, HAR-J, CHAR, SHAR, ARQ, HARQ, and HARQ-F) as follows:
| (12) | ||||
where is the loss from the benchmark (one of the eight HAR-family of models) and is the loss from NLP model . Rejection of means that the NLP model outperformed all benchmark HAR models. For this RC test, we follow the stationary bootstrap of Politis and Romano (1994) with 999 re-samplings and an average block length of 5 (Bollerslev et al., 2016).272727Our analysis shows that the results are not sensitive to the choice of this block length.
Rahimikia and Poon (2020a) showed the importance of separating normal volatility days and high volatility days when evaluating out-of-sample forecasting performance. A day is defined as a high volatility day when RV for that day is greater than , where , and and are, respectively, the first and third quantiles of RV. By applying this criterion to the sample of 23 stocks, about 10% (160 days) of the out-of-sample period (1604 days) are classified as high volatility days.
5.1 Stock-Related News
The NLP models tested here differ according to the word embedding282828This includes FinText(CBOW), FinText(skip-gram), and Google(skip-gram) based on Word2Vec algorithm, and WikiNews(FT/skip-gram), FinText(FT/skip-gram), and FinText(FT/CBOW) based on FastText algorithm. FT means FastText algorithm. and the news information set292929This includes stock-related news and general hot news.. This subsection considers the case when the input information is stock-related news. Figure 5(a) in Figure 5 shows the word cloud of stock-related headlines for all 23 stocks over the out-of-sample period. As expected, these stock-related news headlines are populated with news stories about specific companies and their operations. LABEL:NLP_ML_primary_experiment_table_ticker_related reports the out-of-sample RC results of this NLP model for six different word embeddings, each tested with 25, 50, 75, and 100 CNN filters. The larger the number of filters, the more complex the model. In LABEL:NLP_ML_primary_experiment_table_ticker_related, RC is the percentage of tickers where the model outperformed all eight HAR-family of models at the 5% and 10% significance levels with MSE and QLIKE as the loss functions.303030A note of caution is due here since WikiNews word embedding covers data from 2007 to 2017, so there may be data leaking through word embedding, causing spurious better out-of-sample performance of this word embedding for around two years. The top, middle, and bottom rows of LABEL:NLP_ML_primary_experiment_table_ticker_related are, respectively, the full out-of-sample period, the normal volatility days, and the high volatility days. ‘FT’ refers to the FastText algorithm.
It is clear that for normal volatility days, ‘FinText(skip-gram)’ and ‘FinText(FT/skip-gram)’ have close forecasting performance; both outperformed the other four word embeddings. This is also more prominent for the MSE than the QLIKE loss function. On high volatility days, ‘FinText(CBOW)’ generally shows good performance, but its performance for normal volatility days is poor. More importantly, as discussed in Subsection 3.1, although our FinText word embedding used a substantially smaller corpus compared with Google Word2Vec and WikiNews, the RC values in LABEL:NLP_ML_primary_experiment_table_ticker_related show FinText dominates these well-known general word embeddings in RV forecasting. Finally, the results in LABEL:NLP_ML_primary_experiment_table_ticker_related show that the forecasting performance is insensitive to the complexity of the model represented by the number of filters used. Therefore, for ease of exposition, we will use 50 filters in the subsequent analyses.
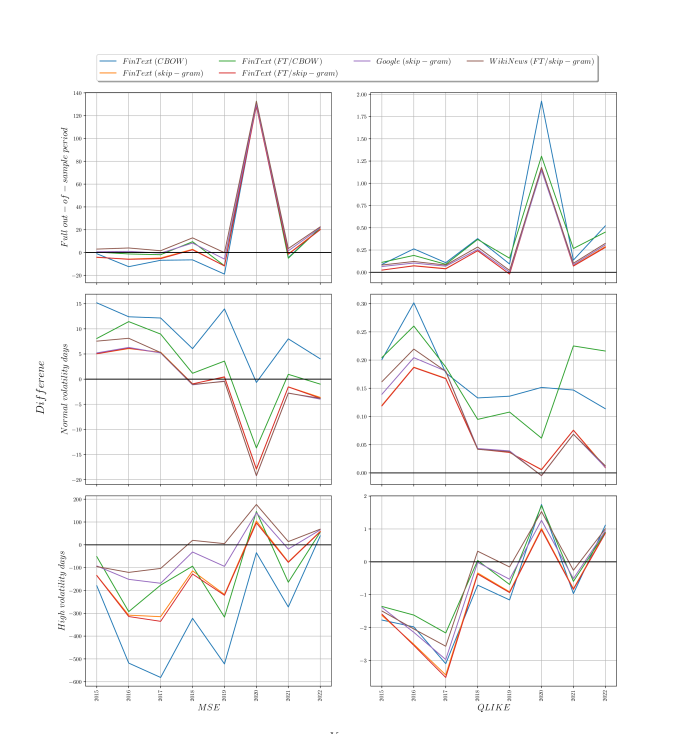
Notes: The line represents the yearly average of the difference between out-of-sample MSEs in the left plots (QLIKEs in the right plots) of the NLP model and CHAR model (the best-performing HAR-family model in Rahimikia and Poon (2020a)) over 23 tickers. A negative value means the NLP model dominates CHAR, and vice versa for a positive value. The top, middle, and bottom plots show, respectively, the results for the full out-of-sample period, normal volatility days, and high volatility days. The horizontal line represents no difference in performance between these models.
To further investigate the performance of models over time, Figure 6 presents the yearly average of the difference between out-of-sample MSEs in the left plots (QLIKEs in the right plots) of the NLP model and CHAR model (the best-performing HAR-family model in Rahimikia and Poon (2020a)) over 23 tickers. A negative value means the NLP model dominates CHAR, and vice versa for a positive value. The top, middle, and bottom plots show, respectively, the results for the full out-of-sample period, normal volatility days, and high volatility days. The horizontal dashed line represents no difference in performance between these models.
Figure 6 is quite revealing in several ways. First, for most out-of-sample years evaluated by MSE or QLIKE, all six NLP models outperformed CHAR in forecasting RV for high volatility days (except for 2020). This finding is statistically significant for the majority of stocks. However, this is not true for normal volatility days. Second, the CBOW model (‘FinText(CBOW)’ and ‘FinText(FT/CBOW)’) generally shows good performance for high volatility days, but their performance for normal volatility days is poor. Third, FinText is a clear winner, and the performance of the skip-gram model, i.e., ‘FinText(skip-gram)’ and ‘FinText(FT/skip-gram)’, is particularly prominent. Finally, Figure 6 shows a gradual deterioration, over time, of forecasting performance on high volatility days, especially in 2020 at the peak of the COVID-19 outbreak. To further explore the possible explanations for this gradual deterioration in performance, we calculate the proportion of OOV n-grams in stock-related news in the out-of-sample period. Since the word embedding, FinText, is compiled using all news from 2000 to 2015, new terms appeared after 2015 that are not recognised by FinText. Figure 7 presents the monthly average, across 23 stocks, percentage of OOV n-grams for FinText (top chart), Google Word2Vec (middle chart) and WikiNews (bottom chart). December 2020 is highlighted as the beginning of the COVID-19 outbreak.
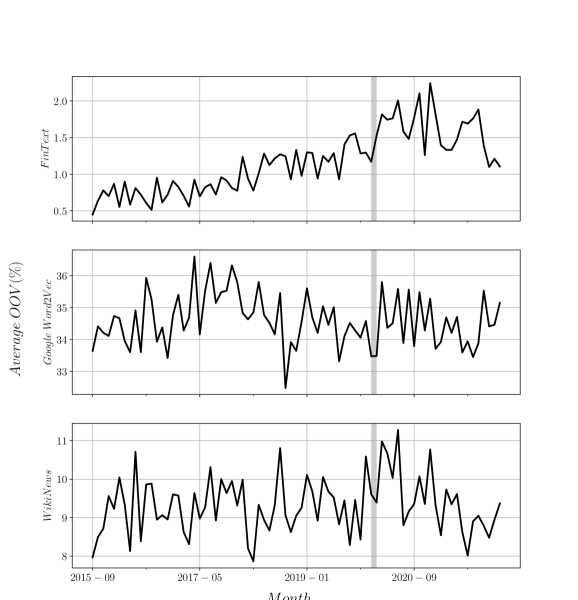
Notes: The monthly average percentage of OOV n-grams in stock-related news over the out-of-sample period is calculated. The OOV(%) is average across 23 stocks for FinText (top chart), Google Word2Vec (middle chart) and WikiNews (bottom chart) word embeddings. December 2020 is highlighted as the beginning of the COVID-19 outbreak.
In Figure 7, Google Word2Vec has the highest average OOV% over time, which is about three times that of WikiNews, and about 18 times that of FinText, despite the fact that Google Word2Vec has a substantially larger corpus with around 100 billion words. Next, it is clear that for FinText, the average OOV% increases over time with a sudden jump during the COVID-19 outbreak. This sudden jump, with less intensity, is also noticeable for Google Word2Vec and WikiNews word embeddings. The sudden increase in the average OOV% during the COVID-19 outbreak could help to explain the sudden decrease in the forecasting performance around the same time as shown in Figure 6. Figure 7 draws our attention to the fact that all word embeddings, large or small, are trained using a specific set of corpus representing a set of language usage over a specific time horizon. The size of the corpus is less important than the relevance of the corpus to the research questions. Hence, a decrease in performance is expected over time as new terms emerge and semantics evolve, making the word embeddings out of date.
5.2 General Hot News
This subsection seeks to address the importance of general hot news for RV forecasting. Figure 5(b) in Figure 5 shows the word cloud of general hot news headlines in the out-of-sample period. In line with our expectations, general hot news covers various topics, including economic, financial, political, and geopolitical news. By definition, general hot news is not stock-specific. Hence, the same set of general hot news is used to forecast the RV of the 23 stocks. Also, as discussed, general hot news is entirely distinct from stock-related news. LABEL:NLP_ML_primary_experiment_table_hot_general presents the out-of-sample RC results when the input information is general hot news.
First, for normal volatility days, the general word embeddings, i.e., ‘Google(skip-gram)’ and ‘WikiNews(FT/skip-gram)’, produce better RV forecasting performance than FinText. Moreover, the general hot news is more informative for forecasting RV on normal volatility days than the stock-related news. Although FinText is still a pioneer in the full out-of-sample period due to slightly higher performance for high volatility days, it is interesting that with a noticeable margin, it shows a lower performance for normal volatility days. Second, as before, the results are not very sensitive to the number of filters used. Hence, we will use 50 filters in the subsequent analyses. Third, for high volatility days and, more specifically, for the MSE loss function, ‘FinText(CBOW)’ relatively outperformed all other word embeddings. The good performance of this model on high volatility days is also evidenced in LABEL:NLP_ML_primary_experiment_table_ticker_related. Along with corpus, this confirms the importance of model and algorithm selection in developing financial word embeddings.
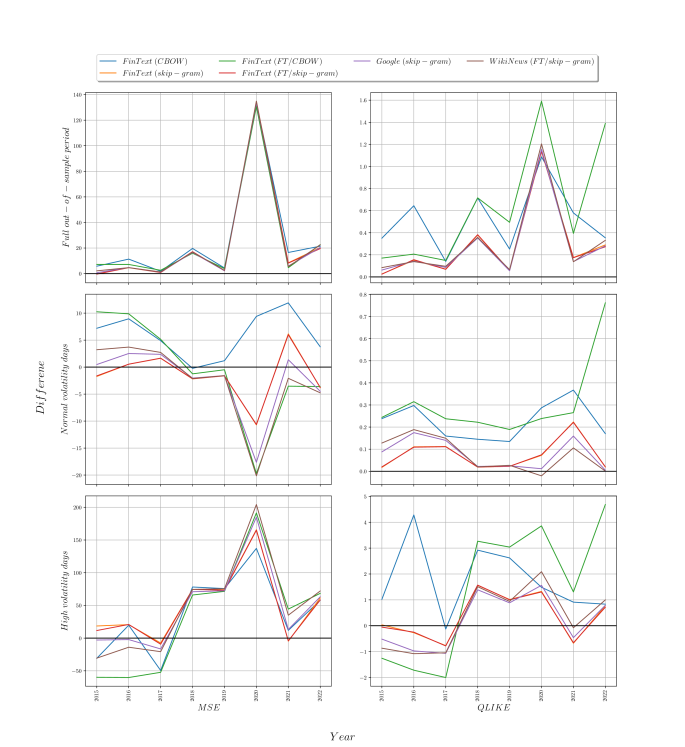
Notes: The line represents the yearly average of the difference between out-of-sample MSEs in the left plots (QLIKEs in the right plots) of the NLP model and CHAR model (the best-performing HAR-family model in Rahimikia and Poon (2020a)) over 23 tickers. A negative value means the NLP model dominates CHAR, and vice versa for a positive value. The top, middle, and bottom plots show, respectively, the results for the full out-of-sample period, normal volatility days, and high volatility days. The horizontal line represents no difference in performance between these models.
Figure 8 presents the yearly average of the difference between out-of-sample MSEs and QLIKEs of the NLP model and CHAR model over 23 tickers for general hot news. Looking at Figure 8, it is apparent that general hot news is less relevant for RV forecasts on high volatility days. Also, the improvement in forecasting performance is primarily noticeable for the MSE loss function, not the QLIKE loss function. The findings in this subsection are largely logical. Since general hot news covers a wide range of topics, it is not surprising that broader word embeddings are more appropriate than FinText. The fact that general hot news is less informative than stock-related news for forecasting RV on high volatility days suggests much of the high volatility episodes are idiosyncratic and stock-specific. The fact that FinText thrives in the high volatility regime further suggests these idiosyncratic high volatility episodes are financial matters closely related to the company’s business operation.
5.3 Ensemble Models
So far, the findings in Subsection 5.1 and Subsection 5.2 show that, mainly, stock-related news has a higher predictive power for forecasting RV on high volatility days with our developed financial word embedding. However, general hot news is more helpful in forecasting RV on normal volatility days with more general word embeddings such as Google Word2Vec and WikiNews. In this subsection, we will test the power of an ensemble model combining the forecasts from different models. Specifically, the ensemble model here is simply the arithmetic mean of the RV forecasts from different models.
Recently, Rahimikia and Poon (2020b) and Christensen et al. (2021) showed the power of ML in RV forecasting. Rahimikia and Poon (2020b) found that LSTM with LOB data produces the best RV forecasting results but only for normal volatility days. Following Rahimikia and Poon (2020b), we add two ML models to our ensemble, including HAR-FCNN and OB-LSTM. FCNN is basically a simple type of neural network architecture in which all the units in one layer are connected to the units in the next layer. Here, we restrict the FCNN model to process only three HAR-related variables. So HAR-FCNN is a HAR model but with nonlinear ML features. In contrast, OB-LSTM is more complex, covering 6 HAR variables (RV, BPV, BPV jump, negative RV, positive RV, and realised quarticity) and 132 LOB variables.313131For clarity, OB-LSTM is abbreviated as OB-ML in Rahimikia and Poon (2020b). Taken together, the NLP model in this study uses only textual data (stock-related or general hot news) from the previous day for RV forecasting, whereas HAR-FCNN and OB-LSTM use only stock’s historical numerical data from HAR and rich LOB collections.
Table 6 displays the RC results for three ensemble models. The base NLP model uses stock-related news and our specialised word embedding, FinText, trained using the skip-gram model and FastText algorithm (i.e., the best-performing combination in Subsection 5.1). For the first ensemble group (stock-related columns in Table 6), the base model is combined with the NLP model using general hot news and WikiNews word embedding with skip-gram model and FastText algorithm (i.e., the best-performing combination in Subsection 5.2). For the second and third groups (HAR-FCNN and OB-LSTM columns in Table 6), the base model is combined with the mentioned HAR-FCNN and OB-LSTM models, respectively. The top row of Table 6 shows the RC results at the 10% significance levels for both MSE and QLIKE loss functions for the full out-of-sample period, followed by normal volatility days and high volatility days, respectively, in the middle and bottom rows with the best RC values highlighted in bold. The number of filters for the NLP model with stock-related and general hot news is shown in this table. Also, the number of units in HAR-FCNN and OB-LSTM are shown for the second and third ensemble groups. Generally, a larger number of filters and units indicate a more complex model.
We noted before in Subsection 5.2 that the NLP model with general hot news as input is best at forecasting RV on normal volatility days. Similarly, Rahimikia and Poon (2020b) concluded that OB-LSTM outperformed all major HAR models on normal volatility days. HAR-FCNN is also a nonlinear form of a simple HAR model added here for comparison. The top and middle rows of Table 6 for the full out-of-sample period and normal volatility days show that, among these three ensemble groups, OB-LSTM produced the best composite forecast (for both MSE and QLIKE) when combined with the NLP model with stock-related news. Also, for normal volatility days, HAR-FCNN outperformed the NLP model with general hot news when combined with the NLP model with stock-related news. However, this improvement is less than the extra forecasting power LOB features bring inside. This finding is expected and shows the power of ML models for modelling a high number of independent variables simultaneously. For high volatility days in the bottom row, the NLP model with stock-related news provided the best ensemble forecast when combined with the NLP model with general hot news. However, the performance is not as good as the NLP model with stock-related news results in the bottom row of LABEL:NLP_ML_primary_experiment_table_ticker_related.
In summary, stock-related news is useful for RV forecasting on high volatility days. When combined with financial numbers in a simple ensemble model, the RV forecasting performance for normal volatility days substantially improved. Collectively, Table 6 highlighted the importance of the information content of both financial numbers and news for forecasting RV. Section 6 below further scrutinises the exact news content that enhanced the RV forecasting power by isolating the explanatory power of specific terms.
Full out-of-sample period
General hot news
HAR-FCNN
OB-LSTM
Subsection 5.2
Rahimikia and
Poon (2020b)
Rahimikia and
Poon (2020b)
25
50
75
100
5
10
15
20
25
5
10
15
20
25
25
100a
34.8b
100
34.8
100
34.8
100
30.4
87.0
26.1
87.0
26.1
95.7
26.1
91.3
26.1
91.3
26.1
95.7
30.4
100
56.5
100
78.3
100
82.6
100
78.3
50
100
34.8
100
34.8
100
34.8
100
34.8
91.3
26.1
91.3
26.1
100
21.7
95.7
26.1
95.7
26.1
100
39.1
100
60.9
100
78.3
100
82.6
100
82.6
75
100
34.8
100
34.8
100
34.8
100
34.8
91.3
26.1
91.3
26.1
100
21.7
95.7
26.1
95.7
26.1
100
34.8
100
60.9
100
78.3
100
82.6
100
82.6
100
100
34.8
100
30.4
100
30.4
100
30.4
91.3
26.1
91.3
26.1
100
21.7
95.7
26.1
95.7
26.1
100
34.8
100
60.9
100
78.3
100
82.6
100
82.6
Normal volatility days
25
87.0
4.3
78.3
4.3
78.3
4.3
78.3
4.3
95.7
52.2
95.7
52.2
95.7
52.2
87.0
47.8
87.0
47.8
100
73.9
100
82.6
100
82.6
100
78.3
100
78.3
50
78.3
4.3
73.9
4.3
73.9
4.3
69.6
4.3
95.7
52.2
95.7
52.2
95.7
47.8
87.0
47.8
87.0
47.8
100
73.9
100
82.6
100
78.3
100
73.9
100
65.2
75
78.3
4.3
73.9
4.3
73.9
4.3
69.6
4.3
95.7
52.2
95.7
52.2
95.7
52.2
87.0
47.8
87.0
47.8
100
73.9
100
82.6
100
78.3
100
73.9
100
60.9
100
78.3
4.3
73.9
4.3
73.9
4.3
69.6
4.3
95.7
52.2
95.7
52.2
95.7
47.8
87.0
47.8
87.0
47.8
100
69.6
100
82.6
100
78.3
100
73.9
100
56.5
High volatility days
25
91.3
60.9
91.3
60.9
91.3
60.9
91.3
60.9
78.3
8.7
78.3
8.7
78.3
8.7
78.3
8.7
78.3
8.7
73.9
21.7
78.3
26.1
78.3
39.1
87.0
56.5
87.0
65.2
50
91.3
60.9
91.3
60.9
91.3
60.9
91.3
60.9
78.3
17.4
78.3
17.4
78.3
13.0
78.3
13.0
78.3
13.0
73.9
21.7
78.3
30.4
78.3
47.8
91.3
56.5
87.0
69.6
75
91.3
60.9
91.3
60.9
91.3
60.9
91.3
60.9
78.3
17.4
78.3
17.4
78.3
13.0
78.3
13.0
78.3
13.0
73.9
21.7
78.3
30.4
78.3
47.8
91.3
56.5
87.0
69.6
100
91.3
60.9
91.3
60.9
91.3
60.9
91.3
60.9
78.3
13.0
78.3
13.0
78.3
13.0
78.3
13.0
78.3
13.0
73.9
21.7
78.3
30.4
78.3
47.8
91.3
65.2
87.0
73.9
•
Notes:
a
Percentage of tickers with outstanding performance at the 10% significance levels of the RC compared to all HAR-family of models for the MSE loss function.
b
Percentage of tickers with outstanding performance at the 10% significance levels of the RC compared to all HAR-family of models for the QLIKE loss function.
6 Explainable AI
Over the last few years, efforts have been made to understand better ML models, which are often described as black-box. Here, we will explore one of the prominent XAI methods, SHAP, to analyse the explanatory power of specific phrases in RV forecasting. Subsection 6.1 gives a brief comparison of the XAI and LM dictionary results, and Subsection 6.2 examines the words and phrases separately in stock-related and general hot news.323232For stock-related news, we use FinText(FT/skip-gram) as the best-performing model in Subsection 5.1. For general hot news, we use WikiNews(FT/skip-gram) as the best-performing model in Subsection 5.2. Both models are implemented using 50 filters, as our earlier finding shows that the results are not sensitive to CNN model complexity specified by the number of filters.
6.1 XAI vs LM dictionary
Loughran and McDonald (2011) compiled eight lists of words from a large sample of 10-K reports to represent ‘positive’, ‘negative’, ‘uncertainty’, ‘litigious’, ‘strong modal’, ‘moderate modal’, ‘weak modal’ and ‘constraining’ sentiments. Collectively known as the LM dictionary, it is now the most widely accepted and influential account of sentiment analysis in accounting and finance.
Figure 9 displays SHAP values for the top three LM negative (group of) words with the highest frequency counts in the LM corpus, i.e., ‘loss’, ‘termination’, and ‘against’, in the top, middle, and bottom rows, respectively. Each chosen word is also grouped with its variations from the LM corpus; therefore, {‘loss’, ‘losses’}, {‘termination’, ‘terminate’, ‘terminates’, ‘terminated’}, and {‘against’} represent ‘loss’, ‘termination’, and ‘against’ words, respectively. The SHAP values of words in each group are separately depicted in the figures. The left (right) column presents the SHAP values for stock-related (general hot) news, where a dot on the vertical zero line denotes the incident when the word has no impact on the RV forecast. The left (right) hand side represents the negative (positive) impact of the specified group of words on RV, where a larger positive (negative) value means a larger increase (decrease) in the RV forecast. The y-axis displays the ticker name; if the ticker does not appear on the y-axis, it means the specified word group had no appearance in the news stories, or the SHAP method did not identify words in that group as a contributor to RV forecasting for this ticker. The total number of negative and positive SHAP values is depicted at the top for each graph.
Notes: Rows represent the most repeated negative words in the LM corpus. The left (right) column represents the SHAP values for stock-related (general hot) news published during the out-of-sample period. The x-axis is the reported explainer value, and the y-axis is the ticker name. The vertical line represents no impact on RV, while the left (right) hand side represents the negative (positive) impact of the specified group of words on RV. The total number of negative and positive SHAP values is depicted at the top for each graph.
Figure 9 reveals some important properties about using textual information to forecast RV based on a fixed LM dictionary approach vs our developed NLP model in this study. First, the LM dictionary would count the appearance of negative words, ‘loss’, ‘termination’, and ‘against’, including their variations; the higher the word counts, the greater the predicted negative impact on stock returns and a predicted positive impact on RV. In contrast, Figure 9 shows a great variety of relationships of these top word groups on stock volatility, e.g., the ‘Loss’ group in stock-related news increases RV in 355 appearances and decreases RV in 263 appearances (see top left subgraph). Similar patterns are observed for the other two top word groups for stock-related news and also for general hot news. Next, there are great variations across stocks. For the same subgraph, ‘loss’ has a negative impact on the RV of the AAPL ticker but a mostly positive impact on the RV of the CTSH ticker. As mentioned above, some of these words did not even appear in the news stories of some stocks, or when they appeared, they did not create any impact on the stock’s RV forecasts. Perhaps the most interesting aspect of this NLP approach to forecasting is that the NLP model can be used to forecast a variety of financial variables, such as return, trading volume, price direction, etc., in a relatively easy unsupervised manner. However, the LM dictionary is fixed for a chosen sentiment.
So far, by providing a few examples, the NLP model, in conjunction with XAI, has shed light on the so-called black-box model and identified several advantages of this new approach. What is not yet clear is the global importance of n-grams among all analysed stocks over the out-of-sample period for both stock-related and general hot news. This not only provides some insight into the volatility movers in the news stories but also gauges how much these models are reliable. The primary RV movers are investigated separately for stock-related and general hot news in Subsection 6.2.
6.2 Volatility Movers
In this subsection, we inspect the primary RV movers for stock-related news in LABEL:RV_movers_stock_related and general hot news in LABEL:RV_movers_general_hot for the entire test samples of 23 stocks in the out-of-sample period. As explained in Subsection 4.3, we have a merged list of the top five n-grams from each stock and the repetition count for each n-gram. The n-gram with means the specific n-gram appears among the top five n-grams for all 23 stocks. For stock-related news, a threshold of repetitions is set to select the n-grams that move the RV for more than half of the 23 stocks. For general hot news, a threshold of repetitions is set as there are more n-grams and fewer repetitions for each n-gram.333333Our further analysis shows that changing does not substantially change the defined groups of volatility movers for both stock-related and general hot news. There is also no difference in importance among the n-grams in each group and among groups in these tables.343434Note that numerical n-grams have a prominent position in both tables. This finding supports the importance of keeping the numerical values in the pre-processing steps in Subsection 3.1. However, for clarity, the numerical n-grams are removed from LABEL:RV_movers_stock_related and LABEL:RV_movers_general_hot and replaced by ‘NUMBERS’.
In LABEL:RV_movers_stock_related, we grouped the stock-related volatility movers into ‘Analyst opinion’, ‘Event’, ‘Verb’, ‘Market’, ‘Abbreviation’, ‘Country/Company’, ‘Announcement’, ‘Numeric’, ‘Calendar’, ‘Insider’, and ‘Mixed’.353535It is important to stress that the classification is based on our judgement, but we believe that moving some of the n-grams between groups does not change the essence of the information content of these groups. The key findings can be summarised as follows: (i) ‘Analyst opinion’ and ‘Event’ contain the majority of volatility mover n-grams. This is expected and clearly shows the importance of analyst opinions about a company’s earning calls and financial reports. Among others, the popular n-grams in this group include ‘registers’, ‘announces’, ‘files’, ‘raises’, and ‘surrenders’. (ii) ‘Market’ includes market-related n-grams such as ‘stocks to buy’, ‘premarket’, and ‘stock market opens’, which is another important group that drives volatility. (iii) ‘China’ is the only country in the volatility movers list in stock-related news that shows the importance of news related to this country. The remaining classes have a fewer number of n-grams and less commonality, but it is clear that these n-grams in stock-related news concern financial knowledge.
LABEL:RV_movers_general_hot presents the volatility movers in general hot news, which are grouped into ‘Person’, ‘Place’, ‘Legal entity’, ‘Level’, ‘Verb’, ‘Index’, ‘Data’, ‘Numeric’, and ‘Mixed’. This table is quite revealing in many ways. ‘Person’ class includes Donald Trump363636Donald Trump is the \nth45 president of the United States., Barak Obama373737Barack Obama is the \nth44 president of the United States., Joe Biden383838Joe Biden is the \nth46 president of the United States., de Blasio393939Bill de Blasio is the \nth109 mayor of New York City., Meadows404040Mark Meadows is the \nth29 White House chief of staff., McConnel414141Mitch McConnell is an American politician and attorney., Pompeo424242Mike Pompeo is the \nth70 United States secretary of state., and Pelosi434343Nancy Pelosi is speaker of the United States House of Representatives., Federal Reserve chair, president and CEOs, including Powell444444Jerome Powell is the \nth16 chair of the Federal Reserve., Yellen454545Janet Yellen is the \nth15 chair of the Federal Reserve., Bullard464646James B. Bullard is the \nth12 president of the Federal Reserve Bank of St. Louis., Mester474747Loretta J. Mester is the president and CEO of the Federal Reserve Bank of Cleveland., Williams484848John C. Williams is the president and CEO of the Federal Reserve Bank of New York., Kashkari494949Neel Kashkari is the \nth12 president and CEO of the Federal Reserve Bank of Atlanta., and Bostic505050Raphael Bostic is the \nth15 president and CEO of the Federal Reserve Bank of Atlanta., and international political faces including Cummings515151Dominic Cummings is a British political strategist who served as Chief Adviser to British Prime Minister. and Kim525252Kim Jong-un is the supreme leader of North Korea. as the primary volatility movers. The appearance of Cramer535353Jim Cramer is the host of Mad Money on CNBC. as a television personality is also interesting but not surprising. However, the appearance of William G. Kaelin (an American Nobel Laureate physician-scientist) and Reinhard Genzel (a German astrophysicist) is not matched with the rest of the n-grams in this class. These two misleading n-grams show that similar to econometric models, ML models or XAI approaches are not error-free, and the results must be interpreted cautiously.
Further analysis of LABEL:RV_movers_general_hot shows the importance of places in our analysis and the importance of a group of countries, including ‘China’, as volatility movers. ‘Legal entity’ covers a variety of major offices, departments, commissions, and companies. The appearance of the Health Organization and CDC (Centers for Disease Control and Prevention) could be attributed to the COVID-19 pandemic.545454As expected, the word COVID-19 does not appear because it was not in the corpus before 2015. Again, although nearly all n-grams in this class are justifiable, the appearance of the Wolfe (ref. Wolfe Research) could be a model error. The next major class with a high number of n-grams is ‘Level’, covering a variety of levels and changes, percentages, currency values and some specific words like ‘below’, ‘above’, ‘fall’, and ‘under’ all referencing some quantitative expectations. Moving to the next groups, similar to the stock-related news, the ‘Verb’ and ‘Numeric’ groups in general hot news demonstrate the importance of these specific groups of verbs and also numbers as volatility movers. The ‘Mixed’ group includes a variety of n-grams like ‘SPAC’555555Special-purpose acquisition company., ‘Payroll-tax cut’, ‘Airstrike’, ‘Shutdown’, ‘Coalitions’, ‘Crisis’, ‘Trade Speech’, ‘Attorney General’, and ‘Hearing’. Finally, the ‘Index’ and ‘Data’ groups reveal the importance of changes in the S&P500 index and financial and economic data like inflation, GDP, and deficit as important n-grams. Detailed analysis of all n-grams is beyond the scope of this study, but we believe most of these n-grams are in accordance with expectations.
The evidence presented provides a framework for an in-depth analysis of ML models for textual analysis in finance. The detailed explanatory power analysis provided by XAI makes the NLP model transparent at the same level as the simple dictionary approach, making this model a potentially flexible and powerful textual analysis tool for asset pricing studies. This approach is free of statistical assumptions, and, more importantly, for any specific asset pricing case, it could generate a specialised list of important n-grams with minimal supervision. It has also been argued that complex methods for modelling textual data in finance potentially add more noise than signal (Loughran and McDonald, 2016). We believe signal-to-noise of ML models is reasonable if they can simultaneously improve performance and also generate readable and acceptable knowledge in finance by XAI or other similar approaches. Otherwise, harnessing these models for solely showing performance improvement is insufficient for the finance domain. This subsection has generated fresh insight into the primary volatility movers in stock-related and general hot news.
7 Robustness Checks
This section assesses the impact of information history length and model parameters on RV forecasting. The bar chart in LABEL:NLP_ML_robustness_checks_mse_qlike shows the percentage of tickers (out of 23) where the specified NLP model outperformed all HAR-family of models with MSE (QLIKE) loss function in the left (right) plots at the 5% significance level of RC. The top, middle, and bottom row show, respectively, the results for the full out-of-sample period, normal volatility days, and high volatility days.
Two benchmark groups in LABEL:NLP_ML_robustness_checks_mse_qlike are ‘FinText(Skip-gram)’ and ‘FinText(FT/Skip-gram)’, two best-performing stock-related news models in Subsection 5.1 with 25, 50, 75, and 100 filters.565656Due to computational limitations, robustness checks are only presented for stock-related news. We test the amount of history input into the model. Using the ‘FT/Skip-gram’ structure as the base model, the ‘3 days’, ‘5 days’ and ‘7 days’ groups use the news headlines from the last three days, five days and seven days. Next, we test the filter size. In Subsection 4.2, the reason for choosing filter sizes {1, 2, 3} is to match our choice with unigram, bigram, and trigram. What is also not clear is whether longer n-grams will improve RV forecasting or not. Therefore, ‘Filter size(1)’ tests filter sizes , and ‘Filter size(2)’ tests filter sizes .
LABEL:NLP_ML_robustness_checks_mse_qlike shows that moving to ‘3 days’, ‘5 days’ and ‘7 days’ input duration causes degradation in forecasting performance, especially on normal volatility days in the middle row when using the MSE loss function. The source of degradation in performance is changed to high volatility days for the QLIKE loss function. In general, this means the market assimilates news content quickly; adding information in the past 3, 5, and 7 days degrades the RV forecasting performance due to the extra noise these older news stories bring inside. LABEL:NLP_ML_robustness_checks_mse_qlike also shows larger filter size does not change the full out-of-sample period performance and produces minor improvement on high volatility days, mainly for the MSE loss function.
The robustness tests presented provide evidence that increasing the complexity of the NLP model by increasing the filter size or feeding more historical news to the model adds slight improvement and even degrades the performance in some cases. Therefore, the findings and conclusions produced using the simpler model specifications in Subsection 4.2 hold.
8 Conclusions
This paper developed FinText, a financial word embedding, using Word2Vec and FastText algorithms and 15 years of business news archives from 2000 to 2015. While FinText performed slightly less well on general-purpose benchmarks when compared with well-known general word embeddings, FinText is substantially better and more sensitive in detecting financial jargon and financial relationships. More precisely, FinText is about 8 (512) times more accurate than Google Word2Vec (WikiNews) word embedding based on a new gold-standard financial benchmark which is introduced here.575757FinText word embeddings, as well as the benchmark tests, are made publicly available under FinText.ai.
The next goal was to test FinText in an asset pricing framework. The literature on volatility forecasting suggests news is a potential driver of stock market volatility; therefore, we proposed a natural language processing (NLP) model incorporating different word embeddings to produce realised volatility (RV) forecasts from textual data. Using data for 23 NASDAQ stocks from 27 July 2007 to 27 January 2022 and stock-related news, we found evidence that FinText improves RV forecasting performance, especially on high volatility days, although FinText is compiled from a substantially smaller textual corpus compared with well-known and large-scale general word embeddings. This finding confirms that the corpus’s field-specific quality, instead of size, is more critical in making the word embedding relevant for research in finance. Since FinText was compiled using news data from 2000 to 2015, we also observed a degradation over time in forecasting performance from 2015 to 2022 as more words appeared as out of vocabulary (OOV).
Moving to general hot news covering economic, financial, political, and geopolitical events, the forecasting superiority switched from high volatility days to normal volatility days, and general word embeddings are more useful than FinText. This improvement can be explained, at least in part, by the substantially more extensive and diverse textual data used to compile these word embeddings, as one would expect general hot news will also have a broader context. Comparing several ensemble models, we found that the information content of both financial numbers and textual news are both useful for volatility forecasting. Therefore, news can potentially improve forecasting performance, but it is not a replacement for numerical financial data.
Finally, we identified top phrases in stock-related news and general hot news that moved volatility based on an Explainable AI technique. For stock-related news, analyst opinions, company events, numbers, and announcements are the volatility movers. For general hot news, person names, places, and legal entities move volatility. It is not possible to conduct a similar investigation for the dictionary-based sentiment measures. Last but not least, the robustness tests showed that increasing the complexity of models or increasing the number of days of historical news as input to the model does not improve forecasting performance.
In conclusion, we demonstrated in this study that FinText, our purpose-built financial word embedding is more suited for NLP applications in finance. Also, by introducing a simple NLP model, we showed how it could be used in empirical asset pricing. Because of the simplicity and transparency of dictionary-based approaches, more complex NLP models in asset pricing, at least until now, have not been considered a contender. Nevertheless, we demonstrated that the in-depth analysis made possible by Explainable AI improved our understanding of more advanced NLP models in this area. We hope this study paves the way for other state-of-the-art NLP research in finance.
References
- Adämmer and Schüssler (2020) Adämmer, P. and R. A. Schüssler (2020). Forecasting the equity premium: mind the news! Review of Finance 24(6), 1313–1355.
- Agirre et al. (2009) Agirre, E., E. Alfonseca, K. Hall, J. Kravalova, M. Pasca, and A. Soroa (2009). A study on similarity and relatedness using distributional and wordnet-based approaches.
- Ban et al. (2018) Ban, G.-Y., N. El Karoui, and A. E. Lim (2018). Machine learning and portfolio optimization. Management Science 64(3), 1136–1154.
- Bianchi et al. (2021) Bianchi, D., M. Büchner, and A. Tamoni (2021). Bond risk premiums with machine learning. The Review of Financial Studies 34(2), 1046–1089.
- Bojanowski et al. (2017) Bojanowski, P., E. Grave, A. Joulin, and T. Mikolov (2017). Enriching word vectors with subword information. Transactions of the Association for Computational Linguistics 5, 135–146.
- Bollerslev et al. (2016) Bollerslev, T., A. J. Patton, and R. Quaedvlieg (2016). Exploiting the errors: A simple approach for improved volatility forecasting. Journal of Econometrics 192(1), 1–18.
- Bubna et al. (2020) Bubna, A., S. R. Das, and N. Prabhala (2020). Venture capital communities. Journal of Financial and Quantitative Analysis 55(2), 621–651.
- Bybee et al. (2020) Bybee, L., B. T. Kelly, A. Manela, and D. Xiu (2020). The structure of economic news. Technical report, National Bureau of Economic Research.
- Chen et al. (2020) Chen, L., M. Pelger, and J. Zhu (2020). Deep learning in asset pricing. Available at SSRN 3350138.
- Christensen et al. (2021) Christensen, K., M. Siggaard, and B. Veliyev (2021). A machine learning approach to volatility forecasting. Available at SSRN.
- Collobert et al. (2011) Collobert, R., J. Weston, L. Bottou, M. Karlen, K. Kavukcuoglu, and P. Kuksa (2011). Natural language processing (almost) from scratch. Journal of machine learning research 12(ARTICLE), 2493–2537.
- Cong et al. (2019) Cong, L. W., T. Liang, and X. Zhang (2019). Textual factors: A scalable, interpretable, and data-driven approach to analyzing unstructured information. Interpretable, and Data-driven Approach to Analyzing Unstructured Information (September 1, 2019).
- Conrad and Engle (2021) Conrad, C. and R. F. Engle (2021). Modelling volatility cycles: the (mf)^ 2 garch model. Available at SSRN.
- Corsi (2009) Corsi, F. (2009). A simple approximate long-memory model of realized volatility. Journal of Financial Econometrics 7(2), 174–196.
- Corsi and Reno (2009) Corsi, F. and R. Reno (2009). Har volatility modelling with heterogeneous leverage and jumps. Available at SSRN 1316953.
- Engle and Martins (2020) Engle, R. F. and S. Martins (2020). Measuring and hedging geopolitical risk.
- Engle and Ng (1993) Engle, R. F. and V. K. Ng (1993). Measuring and testing the impact of news on volatility. The journal of finance 48(5), 1749–1778.
- Gentzkow et al. (2019) Gentzkow, M., B. Kelly, and M. Taddy (2019). Text as data. Journal of Economic Literature 57(3), 535–74.
- Goldberg (2016) Goldberg, Y. (2016). A primer on neural network models for natural language processing. Journal of Artificial Intelligence Research 57, 345–420.
- Gu et al. (2020) Gu, S., B. Kelly, and D. Xiu (2020). Empirical asset pricing via machine learning. The Review of Financial Studies 33(5), 2223–2273.
- Gu et al. (2021) Gu, S., B. Kelly, and D. Xiu (2021). Autoencoder asset pricing models. Journal of Econometrics 222(1), 429–450.
- Hill et al. (2015) Hill, F., R. Reichart, and A. Korhonen (2015). Simlex-999: Evaluating semantic models with (genuine) similarity estimation. Computational Linguistics 41(4), 665–695.
- Jiang et al. (2020) Jiang, J., B. T. Kelly, and D. Xiu (2020). (re-) imag (in) ing price trends. Chicago Booth Research Paper (21-01).
- Joulin et al. (2016) Joulin, A., E. Grave, P. Bojanowski, M. Douze, H. Jégou, and T. Mikolov (2016). Fasttext.zip: Compressing text classification models.
- Ke et al. (2019) Ke, Z. T., B. T. Kelly, and D. Xiu (2019). Predicting returns with text data. Technical report, National Bureau of Economic Research.
- Kim (2014) Kim, Y. (2014). Convolutional neural networks for sentence classification. CoRR abs/1408.5882.
- Kingma and Ba (2014) Kingma, D. P. and J. Ba (2014). Adam: A method for stochastic optimization. arXiv preprint arXiv:1412.6980.
- Li et al. (2020) Li, K., X. Liu, F. Mai, and T. Zhang (2020). The role of corporate culture in bad times: Evidence from the covid-19 pandemic. Journal of Financial and Quantitative Analysis, 1–68.
- Lim et al. (2019) Lim, B., S. Zohren, and S. Roberts (2019). Enhancing time-series momentum strategies using deep neural networks. The Journal of Financial Data Science 1(4), 19–38.
- Loughran and McDonald (2011) Loughran, T. and B. McDonald (2011). When is a liability not a liability? textual analysis, dictionaries, and 10-ks. The Journal of Finance 66(1), 35–65.
- Loughran and McDonald (2016) Loughran, T. and B. McDonald (2016). Textual analysis in accounting and finance: A survey. Journal of Accounting Research 54(4), 1187–1230.
- Lundberg and Lee (2017) Lundberg, S. and S.-I. Lee (2017). A unified approach to interpreting model predictions. arXiv preprint arXiv:1705.07874.
- Mikolov et al. (2013) Mikolov, T., K. Chen, G. Corrado, and J. Dean (2013). Efficient estimation of word representations in vector space. arXiv preprint arXiv:1301.3781.
- Mikolov et al. (2018) Mikolov, T., E. Grave, P. Bojanowski, C. Puhrsch, and A. Joulin (2018). Advances in pre-training distributed word representations. In Proceedings of the International Conference on Language Resources and Evaluation (LREC 2018).
- Mikolov et al. (2013) Mikolov, T., I. Sutskever, K. Chen, G. Corrado, and J. Dean (2013). Distributed representations of words and phrases and their compositionality. arXiv preprint arXiv:1310.4546.
- Morin and Bengio (2005) Morin, F. and Y. Bengio (2005). Hierarchical probabilistic neural network language model. In Aistats, Volume 5, pp. 246–252. Citeseer.
- Obaid and Pukthuanthong (2021) Obaid, K. and K. Pukthuanthong (2021). A picture is worth a thousand words: Measuring investor sentiment by combining machine learning and photos from news. Journal of Financial Economics.
- Patton (2011) Patton, A. J. (2011). Volatility forecast comparison using imperfect volatility proxies. Journal of Econometrics 160(1), 246–256.
- Patton and Sheppard (2015) Patton, A. J. and K. Sheppard (2015). Good volatility, bad volatility: Signed jumps and the persistence of volatility. Review of Economics and Statistics 97(3), 683–697.
- Poh et al. (2021) Poh, D., B. Lim, S. Zohren, and S. Roberts (2021). Building cross-sectional systematic strategies by learning to rank. The Journal of Financial Data Science 3(2), 70–86.
- Politis and Romano (1994) Politis, D. N. and J. P. Romano (1994). The stationary bootstrap. Journal of the American Statistical association 89(428), 1303–1313.
- Rahimikia and Poon (2020a) Rahimikia, E. and S.-H. Poon (2020a). Alternative data for realised volatility forecasting: Limit order book and news stories. Available at SSRN 3684040.
- Rahimikia and Poon (2020b) Rahimikia, E. and S.-H. Poon (2020b). Machine learning for realised volatility forecasting. Available at SSRN 3707796.
- RoyChowdhury et al. (2017) RoyChowdhury, A., P. Sharma, E. Learned-Miller, and A. Roy (2017). Reducing duplicate filters in deep neural networks. In NIPS workshop on Deep Learning: Bridging Theory and Practice, Volume 1, pp. 1.
- Shapiro et al. (2020) Shapiro, A. H., M. Sudhof, and D. J. Wilson (2020). Measuring news sentiment. Journal of Econometrics.
- Shrikumar et al. (2017) Shrikumar, A., P. Greenside, and A. Kundaje (2017). Learning important features through propagating activation differences. In International Conference on Machine Learning, pp. 3145–3153. PMLR.
- Sirignano and Cont (2019) Sirignano, J. and R. Cont (2019). Universal features of price formation in financial markets: perspectives from deep learning. Quantitative Finance 19(9), 1449–1459.
- Wood et al. (2021) Wood, K., S. Roberts, and S. Zohren (2021). Slow momentum with fast reversion: A trading strategy using deep learning and changepoint detection. arXiv preprint arXiv:2105.13727.
- Wu et al. (2020) Wu, W., J. Chen, Z. Yang, and M. L. Tindall (2020). A cross-sectional machine learning approach for hedge fund return prediction and selection. Management Science.
- Zhang and Zohren (2021) Zhang, Z. and S. Zohren (2021). Multi-horizon forecasting for limit order books: Novel deep learning approaches and hardware acceleration using intelligent processing units. arXiv preprint arXiv:2105.10430.
- Zhang et al. (2019) Zhang, Z., S. Zohren, and S. Roberts (2019). Deeplob: Deep convolutional neural networks for limit order books. IEEE Transactions on Signal Processing 67(11), 3001–3012.
- Zhang et al. (2020) Zhang, Z., S. Zohren, and S. Roberts (2020). Deep reinforcement learning for trading. The Journal of Financial Data Science 2(2), 25–40.
- Zhao et al. (2020) Zhao, W., T. Joshi, V. N. Nair, and A. Sudjianto (2020). Shap values for explaining cnn-based text classification models. arXiv preprint arXiv:2008.11825.