Automatic Claim Review for Climate Science via Explanation Generation
Abstract
There is unison is the scientific community about human induced climate change. Despite this, we see the web awash with claims around climate change scepticism, thus driving the need for fact checking them but at the same time providing an explanation and justification for the fact check. Scientists and experts have been trying to address it by providing manually written feedback for these claims. In this paper, we try to aid them by automating generating explanation for a predicted veracity label for a claim by deploying the approach used in open domain question answering of a fusion in decoder augmented with retrieved supporting passages from an external knowledge. We experiment with different knowledge sources, retrievers, retriever depths and demonstrate that even a small number of high quality manually written explanations can help us in generating good explanations.
1 Introduction
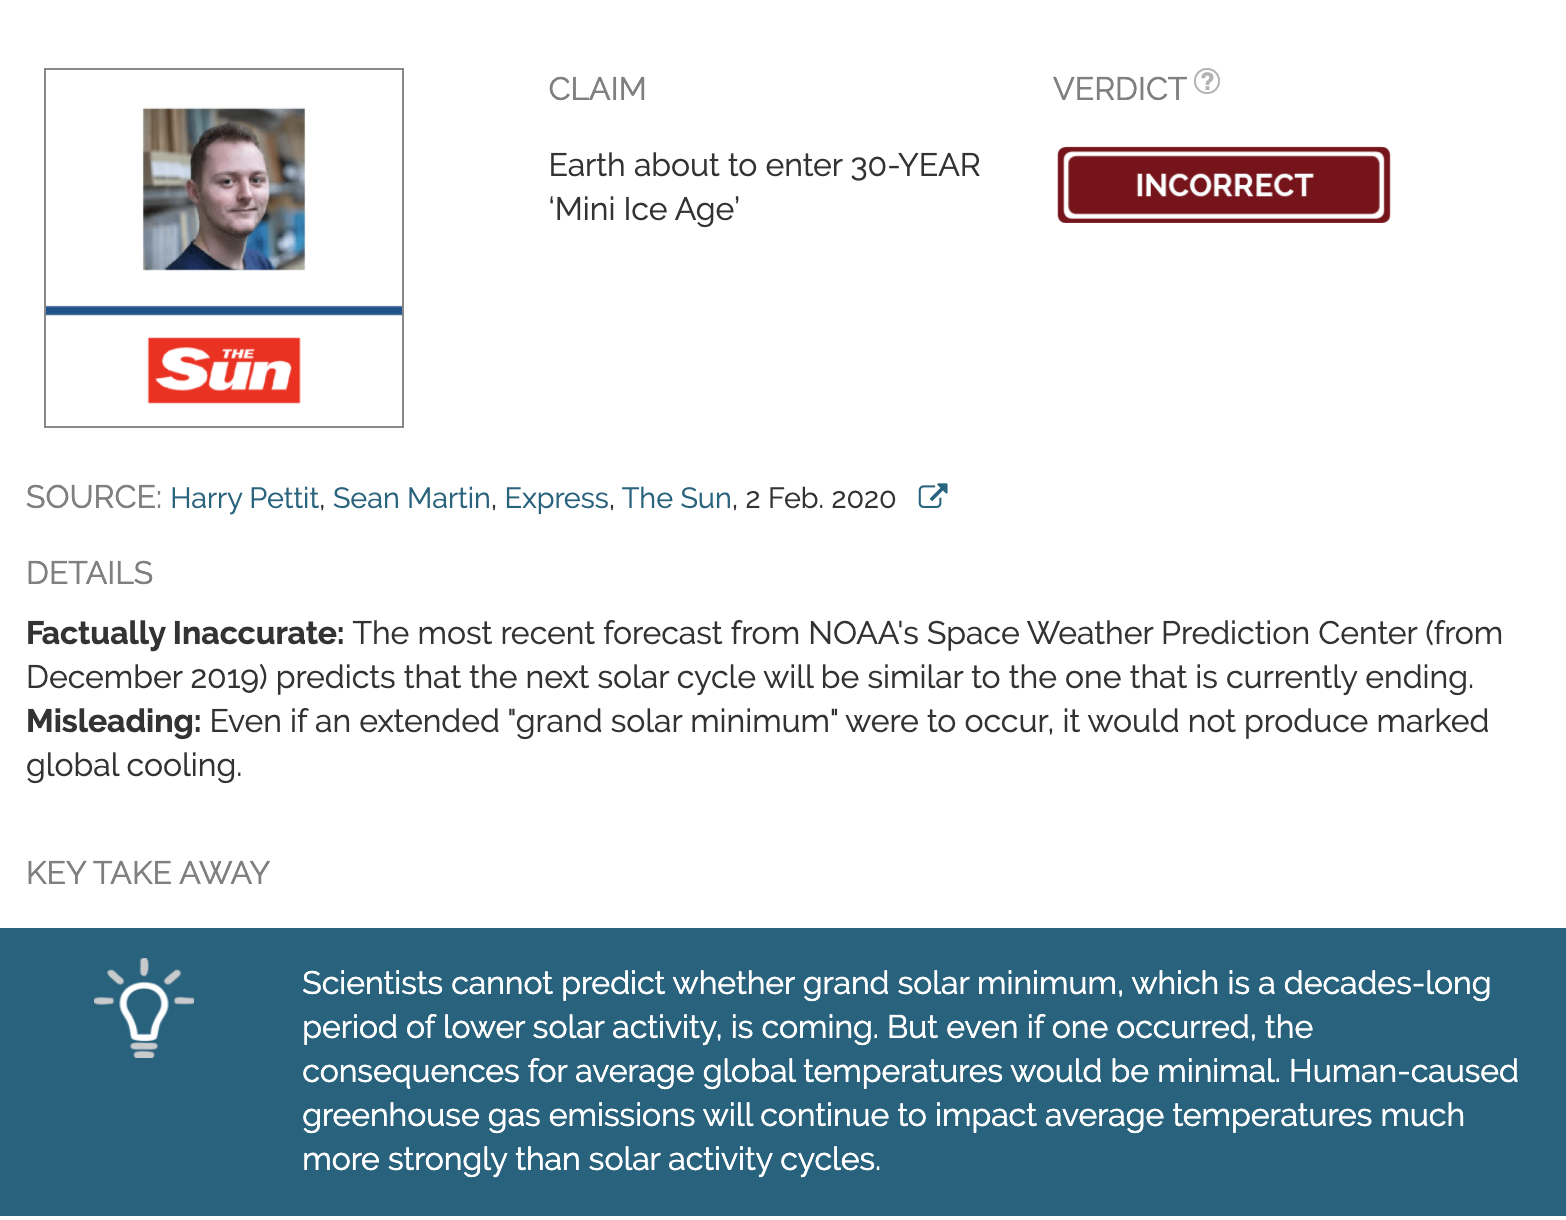
Climate change is one of the biggest challenges threatening the world, the effects of which are already being felt through events such as increasingly frequent extreme weather effects, severe droughts, and devastating fires in countries such as the US and Australia van Oldenborgh et al. (2020). During such events, it is not uncommon to see claims of questionable scientific merit with headlines such as Climate Change has caused more rain, helping fight Australian wildfires.111https://bit.ly/2H9xivN This kind of narrative seeds scepticism Oreskes and Conway (2010), discredits climate science and scientists Anderegg et al. (2010), spreads misinformation Farrell (2019), and neutralises debate on key issues McKie (2018), thereby turning it into a partisan issue Benegal and Scruggs (2018); Van der Linden et al. (2017) and leading to inaction. To check for the veracity (truthfulness) of such claims and at the same time provide public with scientifically sound information, experts have started publishing feedback on websites like climatefeedback.org and skepticalscience.com. Figure 1 gives us one such example where the claim from The Sun is that Earth [is] about to enter 30-year ‘Mini Ice Age’, which has been labelled as Incorrect, with the Key Take Away being that Scientists cannot predict whether solar grand minimum … is coming and even if one occurred, the consequences for average global temperatures would be minimal. It is this process of fact verification with a textual explanation/justification that we aim to automate, as a tool to assist climate science experts to more efficiently respond to such claims.
Our approach draws on recent work on explainable fact checking Atanasova et al. (2020) and retrieval-augmented generation Lewis et al. (2020), in using the claim to: (1) retrieve documents from a knowledge source such as Wikipedia or Intergovernmental Panel on Climate Change (IPCC) reports; and (2) generate an explanation for the claim based on the top- retrieved documents and the T5 decoder Raffel et al. (2019), with a multi-task objective including a veracity prediction for the claim.
Our contributions are as follows: (1) we introduce the task of generating explanations justifying the predicted veracity label for a climate change claim; (2) we deploy open-domain question answering with an external knowledge source to the knowledge-rich and high-impact domain of climate change fact checking; (3) we study the effect of different knowledge sources, retrievers, and retrieval depth across two datasets (both within- and cross-dataset); and (4) we demonstrate that small numbers of manually-written high-quality claim explanations result in high-quality explanations.
2 Related Work
Public perception and reaction to climate change is a function of how the facts and narrative are presented Fløttum (2014); Fløttum et al. (2016), in large part because climate change is not just the science but has strong political, social, and ethical aspects Flottum (2017). A range of corpus linguistic methods have been used to study the topical and stylistic aspects of language around climate change, including structured topic modelling Roberts et al. (2014); Tvinnereim and Fløttum (2015), keyphrase extraction via grammar induction Salway et al. (2014), and analysis of frequently-used metaphors Atanasova and Koteyko (2017).
Fact checking and fake news detection are critical tasks for climate science discussions in the media and social media. Early work on fact checking and misinformation was based on the creation of datasets for fake news detection Vlachos and Riedel (2014) and claim/stance verification Ferreira and Vlachos (2016). While early datasets were limited in size, larger datasets have since been developed, such as LIAR Wang (2017) — collected from PolitiFact and labelled with 6 levels of veracity — and FEVER Thorne et al. (2018), a dataset generated from Wikipedia with supported, refuted and not enough info labels. More recently, extending the methodology of FEVER, Diggelmann et al. (2020) released CLIMATE-FEVER, a dataset specific to the domain of climate change.
Several studies have analysed the discourse around climate change. Luo et al. (2020) proposed an opinion framing task to detect stance in the media. To understand narrative and fames around lack of action on climate change, Bhatia et al. (2021) studied automatic classification of neutralization techniques. Diggelmann et al. (2020) formalised the task by introducing the task of CLIMATE-FEVER as a veracity prediction task in a fact checking setting. Our work differs from these in that we are focussed on jointly generating the correct explanation to counter or support the claim, in addition to the veracity label.
The closest work to our own is that on explainable fact checking by Atanasova et al. (2020), which uses DistilBERT Sanh et al. (2019) in a multitask setting and performs the joint task of summarisation and classification of the veracity of the claim. Stammbach and Ash (2020) experimented with GPT3’s Brown et al. (2020) few shot learning capabilities to generate fact-checking explanations.
There has recent work on the ability of pretrained models like BERT Devlin et al. (2019), GPT2 Radford et al. (2019), and T5 Raffel et al. (2019) to capture factual information Petroni et al. (2019). However, “knowledge” in these pretrained models is stored in the parameters and not directly accessible, making it hard to interpret, extend, or even query these models Roberts et al. (2020). One way of augmenting pretrained models is to combine them with external knowledge sources by retrieving passages that are similar to a given query (a claim, in our case). The text retrieval module can be either traditional methods such as BM25 Robertson et al. (1995), or neural retrievers such as dense passage retriever (DPR) Karpukhin et al. (2020) or memory efficient binary passage retriever Yamada et al. (2021).
Retrieval-based methods have been successfully applied to open domain question answering (QA) by combining the retriever with a “reader”, to extract the relevant answer from those passages. Chen et al. (2017) introduced DRQA, a span-based extractive framework trained with gold spans in a SQuAD setting Rajpurkar et al. (2016), TF-IDF-weighted sparse representations are used to retrieve relevant passages from Wikipedia, and answers are extracted from them. Lee and Hsiang (2019) argued against using separate information retrieval systems to retrieve context passages, and proposed “open retrieval question answering”, which jointly learns the reader and retriever using only QA pairs (without explicit supervision over context passages). The retriever is pretrained in an unsupervised setting using inverse cloze task, i.e. by predicting the document context given a passage from that document. Similarly Guu et al. (2020) jointly trained a reader and retriever by pretraining the retriever using “salient span masking”, a specialisation of masked language modelling.
Lewis et al. (2020) proposed retrieval-augmented generation, which combines a pretrained language model with an external knowledge source accessed via a neural retriever such as DPR Karpukhin et al. (2020), and jointly fine-tuned in a seq2seq manner (over questions and answers). Building on a similar idea, Izacard and Grave (2020b, a) proposed the simple but highly effective “fusion-in decoder” model, which combines evidence from multiple passages independently in separate encoders, and attending to the combined representations in the decoder to generate the answer. Samarinas et al. (2021) extended the idea of passage retrieval to automatic fact checking, and demonstrated that neural retrieval models can improve evidence recall. In our work, we combine these ideas to jointly perform claim veracity classification and generate explanations to justify the prediction.
3 Datasets
The two key data components of our method are: (1) an external knowledge source (“KS”); and (2) paired claim–explanation data with veracity labels (where the explanation justifies the binary veracity class).
3.1 Knowledge Sources
We experiment with two knowledge sources:
Wikipedia (“Wiki”)
Following Chen et al. (2017); Karpukhin et al. (2020), we use the processed Wikipedia dump from Dec 2018 as the knowledge source.222Available via the DPR repository: https://github.com/facebookresearch/DPR
Peer-reviewed PubMed abstracts and IPCC reports (“Pubs”)
A combination of climate change-related abstracts from PubMed,333https://pubmed.ncbi.nlm.nih.gov/ and reports from the Intergovernmental Panel on Climate Change (IPCC).444https://www.ipcc.ch/ PubMed is a database of peer-reviewed publications primarily in the biomedical domain, but also including other high-profile scientific journals. We use MeSH categories to sample publications relating to climate science, and extract the title and abstract of each publication. IPCC reports are written by a mix of scientists, experts, and policy makers. They are based off peer-reviewed publications, and intended to provide a comprehensive summary of a given topic relating to topics such as the physical science of climate change, climate change impacts, or the mitigation of climate change.
While smaller in size than Wiki, this knowledge source is specific to climate change and thus more domain relevant.
3.2 Paired Data
CLIMATE-FEVER (“C-fever”)
Diggelmann et al. (2020) released this dataset for climate change claim verification, consisting of 1535 claims with 5 corresponding evidence sentences555“Evidence” is used instead of “explanation” in this section for consistency with CLIMATE-FEVER, but both mean the same thing. each (yielding a total of 7675 claim–evidence pairs). Following FEVER Thorne et al. (2018), it uses Wikipedia as the knowledge source for the evidence sentences, and labels the veracity of each evidence sentence according to 3 classes: supports, refutes, and not enough info. An overall label is assigned to a claim based on a majority vote over the evidence labels for the 5 evidence sentences.
Inspired by Thorne and Vlachos (2020); Lewis et al. (2020), we explore 2 configurations of C-fever in our experiments: (1) 3-way classification (“FEV3”); and (2) 2-way classification (“FEV2”), where we consider only supports vs. refutes and discard any claims which are not majority-labelled according to one of these two labels. For a given claim, we filter out evidence sentences which differ in label to the overall claim label. We split the two variants of C-fever into training, validation, and test sets using stratified partitioning. This resulted in: 963 training, 83 validation and 332 test instances for FEV3; and 680 training, 50 validation, and 177 test instances for FEV2. As each claim has multiple evidence sentences, this translates into a total of 3196 claim–evidence pairs for FEV3, and 1671 claim–evidence pairs for FEV2. When evaluating the quality of the generated explanation for a claim, we consider the multiple evidence sentences as ground-truth references.
Climate Feedback (“Feedback”)
climatefeedback.org is a website which invites scientists and experts to provide reviews and highlight factual inaccuracies of claims in news articles or made by prominent public figures. An example of a claim review is given in Figure 1, where the “key-take away” acts as our explanation. Following C-fever, we construct a dataset of claim–explanation pairs. One important difference to C-fever is that the explanations here are not passages from a document collection, but rather are written by experts and so are more descriptive, specific to the claim, and overall higher in quality. We crawl 130 paired claim–explanation instances from the website. As the website is almost exclusively used to refute incorrect claims, the vast majority of claims have veracity label incorrect or partially incorrect. Given the resultant extreme label imbalance, we do not use this resource for veracity prediction, but only for explanation generation. Unlike C-fever, there is always a unique explanation for each claim, because of the structure of the website. In our experiments, we use five random training/validation/test splits of the data (90/15/25), and average the results.
4 Method
We now describe the joint model for explanation generation and veracity prediction. Our model is based on the Fusion in Decoder (“FiD”; Izacard and Grave (2020b)) — a sequence-to-sequence model that takes as input a question and support passages (from a retriever), and generates an answer — adapted to process claim and support passages, to predict veracity labels and generate explanation texts.
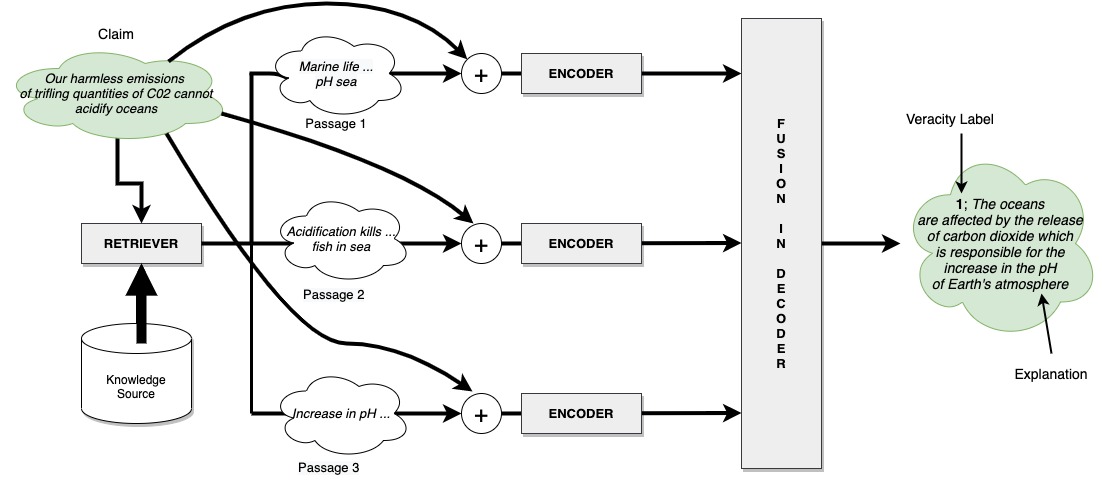
There are two components in our model: (1) a retriever (Section 4.1); and (2) a generator (Section 4.2). Given a claim , the role of the retriever is to search for the most relevant (top-) support passages from a knowledge source (e.g. Wiki). For the generator, it is fashioned as an encoder–decoder: given a claim with support passages, each support passage is concatenated with the claim to produce claim–passage contexts , where , where each is encoded independently but the encodings are fed together to the decoder to generate the veracity label and explanation. This joint processing of multiple claim–passage contexts in the decoder allows the model to summarise the evidence from multiple passages; an illustration of the overall architecture is presented in Figure 2.
Method B-SCORE ACC FEV2 FEV3 FEV2 FEV3 T5-only 0.26 0.24 0.75 0.49 Top1 (Wiki) 0.03 0.02 NA NA Top1 (Pubs) 0.02 0.03 NA NA Bert-veracity NA NA 0.79 0.55
Knowledge Source Retriever B-SCORE ROUGE-1 ROUGE-L ACC FEV2 FEV3 FEV2 FEV3 FEV2 FEV3 FEV2 FEV3 Baseline: T5-only 0.26 0.24 0.25 0.25 0.22 0.21 0.75 0.49 Baseline: Bert-veracity — — — — — — 0.79 0.55 Wiki BPR 0.28 0.27 0.25 0.27 0.22 0.24 0.80 0.59 BM25 0.26 0.26 0.26 0.26 0.23 0.22 0.78 0.57 Pubs BPR 0.28 0.26 0.26 0.25 0.23 0.22 0.77 0.55 BM25 0.29 0.26 0.25 0.25 0.23 0.21 0.77 0.53
4.1 Retriever: BM25 and BPR
We experiment with two retrievers: (1) BM25 Robertson et al. (1995); and (2) BPR (binary passage retrieval; Yamada et al. (2021)). For BM25, the knowledge source is stored in the form of an inverted index. Claim texts are tokenised and entities are linked to produce a sparse bag of words/concepts representation. We use Pylucene666https://lucene.apache.org/pylucene/ with default parameters as the retrieval engine, and DBepdia spotlight777https://www.dbpedia-spotlight.org/api for entity recognition and linking.
DPR Karpukhin et al. (2020) is a dual encoder that consists of two separate BERT models to encode the query and passage, and computes the relevance score based on the inner product of their BERT encodings. BPR extends this by integrating a hashing layer (which converts the BERT encodings to binary codes) to making the encodings more memory efficient without substantial loss in accuracy. BPR is trained with a multi-task objective over 2 tasks: (1) candidate generation using the binary codes; and (2) candidate re-ranking based on the inner product of the continuous vectors. We use the official implementation of BPR, which was pretrained on the Natural Questions dataset Kwiatkowski et al. (2019) with Wikipedia as the knowledge source.888https://github.com/studio-ousia/bpr Note that we use the pretrained BPR without fine-tuning.
4.2 Generator: T5
Raffel et al. (2019) introduced T5, a pretrained encoder–decoder model, where different NLP tasks can be reframed as text-to-text problems to allow the training of a single model to perform multiple tasks. T5 allows us to define a new task by prepending a task-specific prefix token during fine-tuning. In our case, an input is prefixed with lab-exp: (to denote our task) and uses special tokens claim: and context: to denote the start of a claim text and support passage, respectively (e.g. input lab-exp: claim: Our harmless emissions of … context: Marine life …). The output takes the form of the veracity label followed by an explanation (delimited by a semicolon, see Figure 2), such that that the decoder is predicting the veracity label and generate explanation together.999We also experimented with defining separate objectives for label generation and explanation generation and found similar results.
4.3 Experimental setup
For FEV2 when training on C-fever, we pretrain T5 base as a generator as follows: batch size = 1 with gradient accumulation = 4, text maxlength (claim +passage length) = 200, and generated answer maxlength = 150. We use the Adam optimiser, learning rate = 1e-5 with a linear scheduler, weight decay = 0.01, and total steps = 10k with warmup steps = 800. We evaluate the performance of our model on the validation set every 2500 steps.
In the case of FEV3, due to the larger size of the dataset, we change the total steps to 18k and warmup steps to 1000, but keep other hyper-parameters the same. In the case of training on Feedback, we decrease our total steps to 7500. Details of BPR and BM25 are given in Section 4.1. We experiment with as the number of retrieved documents for both retrievers.
5 Experiments
In this section we present and compare the results of our experiments under different conditions. We evaluate the performance of explanation generation using rescaled BERT-score (B-SCORE; Zhang et al. (2019)), ROUGE-1 and ROUGE-L. The original BERT-score uses contextual embeddings to compute similarity between a generated explanation and reference, but since the computed similarity values often end up in a small range at the higher end of the numeric range (close to 1), B-SCORE is proposed where rescaling is performed to produce similarity scores of wider range. To assess label veracity prediction, we use classification accuracy (ACC).
We use several baselines: (1) T5-only, where we remove the retriever and treat the task as a sequence-to-sequence problem (i.e. T5-only is trained using only the claim-explanation pairs without any knowledge sources); (2) Top1, where we remove the generator and use the top-1 retrieved passage (using BPR) as the explanation (this baseline therefore does not predict the veracity labels); and (3) Bert-veracity, where we fine-tune BERT using the claimexplanation as input to predict the veracity label (this baseline therefore does not have a retriever or generate any explanation).
KS B-SCORE ROUGE-1 ROUGE-L Wiki 0.17 0.16 0.14 Pubs 0.17 0.16 0.14
KS B-SCORE ROUGE-1 ROUGE-L Wiki 0.21 0.22 0.18 Pubs 0.22 0.21 0.18
5.1 RQ1: Which knowledge sources performs best?
We first present the baseline system results in Table 1. Note that all results are presented in the two configurations of C-fever, where the veracity has either 2 classes (FEV2) or 3 classes (FEV3); see Section 3.2 for details. In terms of explanation generation, we can see that T5-only substantially outperforms Top1 (using either Wiki or Pubs). This suggests that it is important to have a generator summarise over multiple evidence passages to generate a good explanation. In terms of veracity prediction, we see a pure veracity prediction model (Bert-veracity) performs best, although it is important to note that this model uses explanation text as part of its input (where T5-only has to generate the explanation).
Table 2 presents the full results for veracity prediction and explanation generation over C-fever (for training and testing), using either Wiki or Pubs (Section 3.1) as the knowledge source. In terms of veracity prediction (ACC), our model (using either Wiki or Pubs) outperforms T5-only; more encouragingly, our best model (using Wiki and BPR) outperforms Bert-veracity which has access to the ground-truth explanation as input, suggesting the explanation generator component helps veracity prediction.
In terms of explanation generation quality, our model consistently outperforms T5-only (using either Wiki or Pubs) over all metrics (B-SCORE, ROUGE-1, and ROUGE-L), implying that the incorporation of an external knowledge source aids explanation generation. Comparing the results between Wiki and Pubs, we see that Wiki generally performs slightly better. We theorise this may be due to 2 reasons: (1) CLIMATE-FEVER is based on Wikipedia (as the source of evidence sentences), and so there is an element of data bias when we using the Wiki as our knowledge source;101010It is theoretically possible for the retriever to retrieve the same supporting passage as the explanation text (output), given that the explanation is extracted from Wikipedia in C-fever. In practice this is rare since the retriever uses the claim text as the query. and (2) Pubs is orders of magnitude smaller in terms of the number of passages, and its domain alignment advantage appears to be outweighed by the resulting data sparseness.
5.2 RQ2: Which retriever performs best?
Looking at Table 2, in terms of both veracity prediction and explanation quality, BPR generally outperforms BM25, although the performance gap is smaller when we use Pubs as the knowledge source. As such, we base the remainder of our experiments exclusively on BPR.
5.3 RQ3: How well does the method work in the cross-dataset setting?
Table 2 was based on the C-feverC-fever dataset setting. Here, we explore cross-dataset performance to test the robustness of the proposed model, based on the two settings of: (1) train onC-fever and test on Feedback (C-feverFeedback); and (2) train on Feedback and test on C-fever (FeedbackC-fever).
We first present Table 3, evaluating only the generation quality, recalling our comments about label imbalance in Feedback from Section 3.2. We see a considerable drop in values in comparison to the in-dataset setting of Table 2. This drop can be attributed to the fact that Feedback explanations are manually written, and generally longer and follow a different style to C-fever.
Next we look at Table 4 for FeedbackC-fever and see that the raw results are higher than Table 3, though still below the in-dataset setting.
| Text |
| Claim:About 60% of the warming observed from 1970 to 2000 was very likely caused by the above natural 60-year climatic |
| cycle during its warming phase. |
| Wiki The observed warming over the past 60 years was “very likely” (greater than 90% probability, based on expert |
| judgement) due to human-induced emissions of greenhouse gases. |
| Ref: It is extremely likely (95-100% probability) that human influence was the dominant cause of global warming between |
| 1951-2010. |
| \hdashlineClaim: Our harmless emissions of trifling quantities of carbon dioxide cannot possibly acidify the oceans |
| Pubs: The oceans are affected by the release of carbon dioxide, is responsible for the increase in the pH of the |
| Earth’s oceans |
| Ref: Carbon dioxide also causes ocean acidification because it dissolves in water to form carbonic acid |
| Claim Believers think the warming is man-made, while the skeptics believe the warming is natural and contributions |
| from man are minimal and certainly not potentially catastrophic |
| Wiki: The scientific consensus on climate change is that the trend is very likely caused mainly by human-induced emissions |
| of greenhouse gases |
| Pubs: Scientists have concluded that the warming observed over the past 50 years is primarily human-induced, and that |
| the effects are “very likely” to be catastrophic (although some argue that the effects are likely to be more severe than others) |
| Ref: Attribution sceptics or deniers (who accept the global warming trend but see natural causes for this), |
| and doubt that human activities are responsible for the observed trends. |
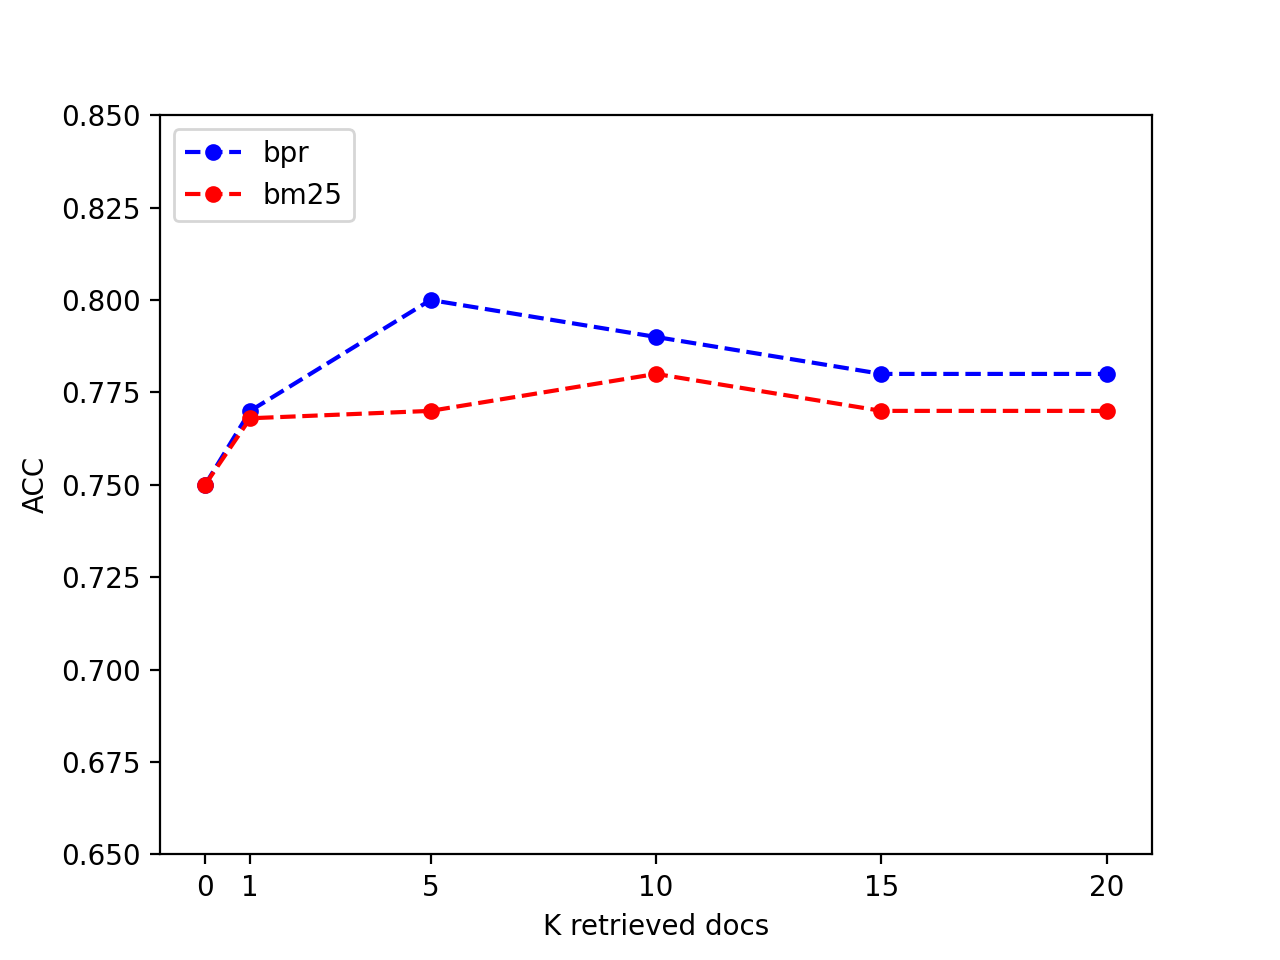
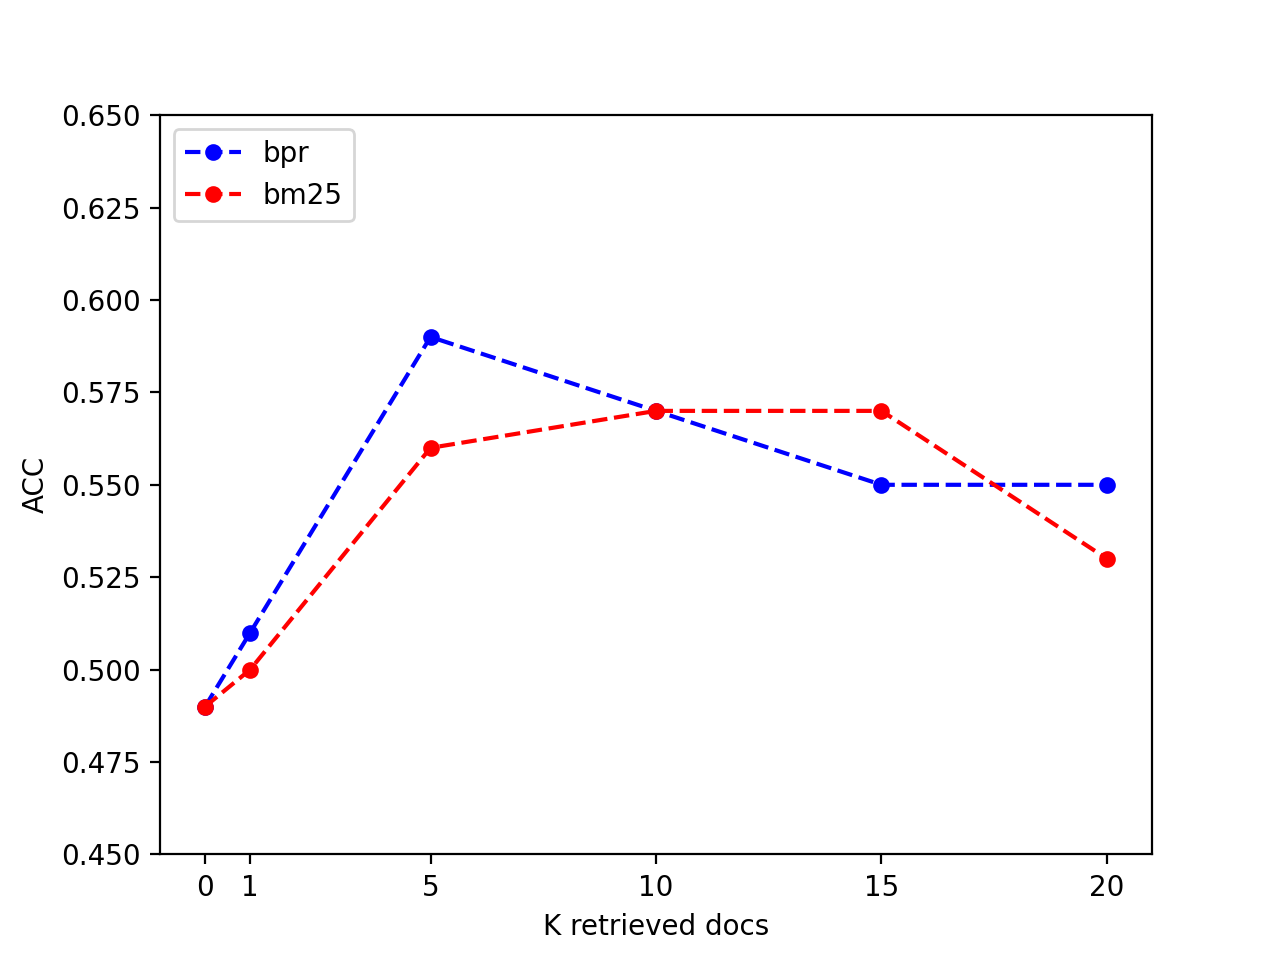
5.4 RQ4: What is the optimal number of retrieved documents?
To check the effect of the number of retrieved documents for both BM25 and BPR, we present ACC at different retrieval depths (between 1 and 20) in Figure 3. We see that for both FEV2 and FEV3, in the case of BPR we achieve the best performance with 5 documents, before dropping slightly and flattening out. In the case of BM25, it takes more retrieved documents (10) to reach the best performance, before either flattening out or dropping back in performance, suggesting that the retrieval quality of BPR is higher than BM25 for small values of .
| Text |
| Claim: Sea level rise is decelerating. |
| KS Wiki: Sea levels are rising due to anthropogenic global warming, which is the cause of many global sea level rises. |
| The current rate of sea level rise is accelerating, and the acceleration of ice loss is due to land-based ice melting. |
| Ref: This acceleration is due mostly to human-caused global warming, which is driving thermal expansion of seawater |
| and the melting of land-based ice sheets and glaciers. |
| \hdashlineClaim: The Great Barrier Reef is in fine fettle |
| KS Pubs: Increased sea surface temperatures boosted by heatwaves have triggered three global mass bleaching |
| events in the Great Barrier Reef since 1998. |
| Ref: The percentage of baby corals being born on the Great Barrier Reef dropped drastically in 2018 and scientists are |
| describing it as the early stage of a “huge natural selection event unfolding” |
| Text |
| Claim: Marine life has nothing whatsoever to fear from ocean acidification. Label: Refutes |
| Trained on C-fever: Acidification of the oceans has a negative impact on marine ecosystems B-SCORE 0.46 |
| Trained on Feedback: Decreasing ocean pH is documented to pose significant risks to marine ecosystems, though the |
| magnitude of the impacts depends on specific species. B-SCORE 0.33 |
| Ref1: Human activities affect marine life and marine habitats through overfishing, pollution, acidification and the |
| introduction of invasive species. |
| Ref2: Rising levels of acids in seas may endanger marine life, says study |
| Claim: Tuvalu sea level isn’t rising. Label: Refutes |
| Trained on C-fever: Tuvalu is affected by the effects of the Perigean spring tide events, which raise the |
| sea level B-SCORE 0.75 |
| Trained on Feedback : Global average sea level is rising due to greenhouse gas emissions, with the highest rates in the |
| tropical Pacific, which are vulnerable to coastal erosion B-SCORE 0.22 |
| Ref: Tuvalu is also affected by perigean spring tide events which raise the sea level higher than a normal high tide. |
5.5 Generation analysis
Noting that the generation evaluation metrics (B-SCORE, ROUGE-1, and ROUGE-L) may not tell the whole story, we present some example generations in Table 5 and Table 6. Looking at the first part of Table 5, we see that the generated explanations are similar to the reference, whereas in second part of the table, the generated outputs from both KS(for the same claim) are different to the reference generation, showing the impact of the two knowledge sources.
Next we look at the examples in Table 6. We see that even though the model was trained on Feedback with only 90 training instances, as a result of the knowledge sources and retrievers, the model can still generate both coherent and semantically relevant explanations for the claim, pointing to the fact that high-quality paired data can pay rich dividends even in small quantities.
6 Discussion
We present two examples of explanation generation Table 7 for C-feverC-fever and FeedbackC-fever setting, with their B-SCORE. Looking at the first example, we see that the B-SCORE when training on C-fever is higher than when training on Feedback. The explanation for C-fever is broadly correct but contains little detail. On the other hand, the explanation trained on Feedback has more substance, as it talks about pH and species, but ends up with a lower B-SCORE. In the second example, similarly we see a high B-SCORE for the explanation trained on C-fever as it is able to extract almost the same evidence as the reference. This is mainly due to the training and testing set being from same dataset,111111In this case, the KSis also Wiki, which was used to construct CLIMATE-FEVER. allowing the model to potentially extract exact chunks from context passages. Looking to the explanation from Feedback, however, we can see it has at least the same level of correctness and diversity, but ends up with a lower score.
Given concerns about B-SCORE being able to account for topical nuances in the domain of climate change, we additionally performed manual annotation of the quality of the explanations. Taking inspiration from Atanasova et al. (2020), we conduct this evaluation in two forms: (1) given a claim, a generated explanation, and the true veracity label, annotate whether the explanation is in agreement with the true label, as a binary classification task (Anno-T1); and (2) rank the two explanations (for the same claim) according to their overall quality (Anno-T2).
Dataset MAR V-AGREE C-fever 1.64 0.72 Feedback 1.36 0.80
We conduct this manual evaluation on a small sample of 25 examples from test set, and collect the explanations from the 2 data sources (resulting if a total of 50 instances across the 2 data sources for the same claim), shuffling the explanations randomly. We use 3 annotators and calculate Krippendorff’s inter-annotator agreement,121212We use nominal metric for Anno-T1 and ordinal metric for Anno-T2 Hayes and Krippendorff (2007) resulting in for Anno-T1, and for Anno-T2. For our evaluation, we then take the majority vote across annotators. For Anno-T1, we calculate raw agreement with the true label (V-AGREE; higher is better), and for Anno-T2 we calculate mean average rank (MAR) across all the 25 examples for each dataset (lower is better).
Looking at the results in Table 8, we can see that Feedback performs better than C-fever over both metrics, in contradiction to what we found using B-SCORE, ROUGE-1, and ROUGE-L in Section 5.3. This suggests: (1) that while automatic metrics provide a general sense of the quality of the generated explanations, they are not able to capture the subtle nuances of the data; and (2) training the model using high-quality manually-written explanations, even in small quantities, is beneficial.
7 Conclusion
We explore the task of joint veracity prediction and explanation generation for climate change claims and prepared a data pipeline consisting of knowledge source and paired data. We transposed the idea of using an external knowledge source with with a retriever and a reader from the domain of open domain question answering to for our task and experimented with 2 different knowledge sources, retrievers and number of retrieved documents. We analysed shortcomings in automatic evaluation like B-SCORE with the help of manual evaluation and suggested that training model on small high quality manually written explanations augmented with a knowledge source can be quite useful.
References
- Anderegg et al. (2010) William RL Anderegg, James W Prall, Jacob Harold, and Stephen H Schneider. 2010. Expert credibility in climate change. Proceedings of the National Academy of Sciences, 107(27):12107–12109.
- Atanasova and Koteyko (2017) Dimitrinka Atanasova and Nelya Koteyko. 2017. Metaphors in guardian online and mail online opinion-page content on climate change: War, religion, and politics. Environmental Communication, 11(4):452–469.
- Atanasova et al. (2020) Pepa Atanasova, Jakob Grue Simonsen, Christina Lioma, and Isabelle Augenstein. 2020. Generating fact checking explanations. arXiv preprint arXiv:2004.05773.
- Benegal and Scruggs (2018) Salil D Benegal and Lyle A Scruggs. 2018. Correcting misinformation about climate change: The impact of partisanship in an experimental setting. Climatic change, 148(1):61–80.
- Bhatia et al. (2021) Shraey Bhatia, Jey Han Lau, and Timothy Baldwin. 2021. Automatic classification of neutralization techniques in the narrative of climate change scepticism. In Proceedings of the 2021 Conference of the North American Chapter of the Association for Computational Linguistics: Human Language Technologies, pages 2167–2175.
- Brown et al. (2020) Tom B Brown, Benjamin Mann, Nick Ryder, Melanie Subbiah, Jared Kaplan, Prafulla Dhariwal, Arvind Neelakantan, Pranav Shyam, Girish Sastry, Amanda Askell, et al. 2020. Language models are few-shot learners. arXiv preprint arXiv:2005.14165.
- Chen et al. (2017) Danqi Chen, Adam Fisch, Jason Weston, and Antoine Bordes. 2017. Reading wikipedia to answer open-domain questions. In Proceedings of the 55th Annual Meeting of the Association for Computational Linguistics (Volume 1: Long Papers), pages 1870–1879.
- Devlin et al. (2019) Jacob Devlin, Ming-Wei Chang, Kenton Lee, and Kristina Toutanova. 2019. BERT: Pre-training of deep bidirectional transformers for language understanding. In Proceedings of the 2019 Conference of the North American Chapter of the Association for Computational Linguistics: Human Language Technologies, Volume 1 (Long and Short Papers), pages 4171–4186.
- Diggelmann et al. (2020) Thomas Diggelmann, Jordan Boyd-Graber, Jannis Bulian, Massimiliano Ciaramita, and Markus Leippold. 2020. Climate-fever: A dataset for verification of real-world climate claims. arXiv preprint arXiv:2012.00614.
- Farrell (2019) Justin Farrell. 2019. The growth of climate change misinformation in us philanthropy: evidence from natural language processing. Environmental Research Letters, 14(3):034013.
- Ferreira and Vlachos (2016) William Ferreira and Andreas Vlachos. 2016. Emergent: a novel data-set for stance classification. In Proceedings of the 2016 conference of the North American chapter of the association for computational linguistics: Human language technologies, pages 1163–1168.
- Fløttum (2014) Kjersti Fløttum. 2014. Linguistic mediation of climate change discourse. ASp. la revue du GERAS, (65):7–20.
- Flottum (2017) Kjersti Flottum. 2017. The role of language in the climate change debate. Taylor & Francis.
- Fløttum et al. (2016) Kjersti Fløttum, Trine Dahl, and Vegard Rivenes. 2016. Young Norwegians and their views on climate change and the future: findings from a climate concerned and oil-rich nation. Journal of Youth Studies, 19(8):1128–1143.
- Guu et al. (2020) Kelvin Guu, Kenton Lee, Zora Tung, Panupong Pasupat, and Ming-Wei Chang. 2020. Realm: Retrieval-augmented language model pre-training. arXiv preprint arXiv:2002.08909.
- Hayes and Krippendorff (2007) Andrew F Hayes and Klaus Krippendorff. 2007. Answering the call for a standard reliability measure for coding data. Communication methods and measures, 1(1):77–89.
- Izacard and Grave (2020a) Gautier Izacard and Edouard Grave. 2020a. Distilling knowledge from reader to retriever for question answering. arXiv preprint arXiv:2012.04584.
- Izacard and Grave (2020b) Gautier Izacard and Edouard Grave. 2020b. Leveraging passage retrieval with generative models for open domain question answering. arXiv preprint arXiv:2007.01282.
- Karpukhin et al. (2020) Vladimir Karpukhin, Barlas Oguz, Sewon Min, Patrick Lewis, Ledell Wu, Sergey Edunov, Danqi Chen, and Wen-tau Yih. 2020. Dense passage retrieval for open-domain question answering. In Proceedings of the 2020 Conference on Empirical Methods in Natural Language Processing (EMNLP), pages 6769–6781.
- Kwiatkowski et al. (2019) Tom Kwiatkowski, Jennimaria Palomaki, Olivia Redfield, Michael Collins, Ankur Parikh, Chris Alberti, Danielle Epstein, Illia Polosukhin, Jacob Devlin, Kenton Lee, et al. 2019. Natural questions: a benchmark for question answering research. Transactions of the Association for Computational Linguistics, 7:453–466.
- Lee and Hsiang (2019) Jieh-Sheng Lee and Jieh Hsiang. 2019. Patent claim generation by fine-tuning openai gpt-2. arXiv preprint arXiv:1907.02052.
- Lewis et al. (2020) Patrick Lewis, Ethan Perez, Aleksandara Piktus, Fabio Petroni, Vladimir Karpukhin, Naman Goyal, Heinrich Küttler, Mike Lewis, Wen-tau Yih, Tim Rocktäschel, et al. 2020. Retrieval-augmented generation for knowledge-intensive nlp tasks. arXiv preprint arXiv:2005.11401.
- Van der Linden et al. (2017) Sander Van der Linden, Anthony Leiserowitz, Seth Rosenthal, and Edward Maibach. 2017. Inoculating the public against misinformation about climate change. Global Challenges, 1(2):1600008.
- Luo et al. (2020) Yiwei Luo, Dallas Card, and Dan Jurafsky. 2020. DeSMOG: Detecting stance in media on global warming. In Findings of EMNLP 2020.
- McKie (2018) Ruth McKie. 2018. Rebranding the Climate Change Counter Movement through a Criminological and Political Economic Lens. Ph.D. thesis, Northumbria University.
- van Oldenborgh et al. (2020) G. J. van Oldenborgh, F. Krikken, S. Lewis, N. J. Leach, F. Lehner, K. R. Saunders, M. van Weele, K. Haustein, S. Li, D. Wallom, S. Sparrow, J. Arrighi, R. P. Singh, M. K. van Aalst, S. Y. Philip, R. Vautard, and F. E. L. Otto. 2020. Attribution of the australian bushfire risk to anthropogenic climate change. Natural Hazards and Earth System Sciences Discussions, 2020:1–46.
- Oreskes and Conway (2010) Naomi Oreskes and Erik M Conway. 2010. Defeating the merchants of doubt. Nature, 465(7299):686–687.
- Petroni et al. (2019) Fabio Petroni, Tim Rocktäschel, Patrick Lewis, Anton Bakhtin, Yuxiang Wu, Alexander H Miller, and Sebastian Riedel. 2019. Language models as knowledge bases? arXiv preprint arXiv:1909.01066.
- Radford et al. (2019) Alec Radford, Jeffrey Wu, Rewon Child, David Luan, Dario Amodei, and Ilya Sutskever. 2019. Language models are unsupervised multitask learners. OpenAI Blog, 1(8):9.
- Raffel et al. (2019) Colin Raffel, Noam Shazeer, Adam Roberts, Katherine Lee, Sharan Narang, Michael Matena, Yanqi Zhou, Wei Li, and Peter J Liu. 2019. Exploring the limits of transfer learning with a unified text-to-text transformer. arXiv preprint arXiv:1910.10683.
- Rajpurkar et al. (2016) Pranav Rajpurkar, Jian Zhang, Konstantin Lopyrev, and Percy Liang. 2016. Squad: 100,000+ questions for machine comprehension of text. arXiv preprint arXiv:1606.05250.
- Roberts et al. (2020) Adam Roberts, Colin Raffel, and Noam Shazeer. 2020. How much knowledge can you pack into the parameters of a language model? arXiv preprint arXiv:2002.08910.
- Roberts et al. (2014) Margaret E Roberts, Brandon M Stewart, Dustin Tingley, Christopher Lucas, Jetson Leder-Luis, Shana Kushner Gadarian, Bethany Albertson, and David G Rand. 2014. Structural topic models for open-ended survey responses. American Journal of Political Science, 58(4):1064–1082.
- Robertson et al. (1995) Stephen E Robertson, Steve Walker, Susan Jones, Micheline M Hancock-Beaulieu, Mike Gatford, et al. 1995. Okapi at trec-3. Nist Special Publication Sp, 109:109.
- Salway et al. (2014) Andrew Salway, Samia Touileb, and Endre Tvinnereim. 2014. Inducing information structures for data-driven text analysis. In Proceedings of the ACL 2014 Workshop on Language Technologies and Computational Social Science, pages 28–32.
- Samarinas et al. (2021) Chris Samarinas, Wynne Hsu, and Mong Li Lee. 2021. Improving evidence retrieval for automated explainable fact-checking. In Proceedings of the 2021 Conference of the North American Chapter of the Association for Computational Linguistics: Human Language Technologies: Demonstrations, pages 84–91.
- Sanh et al. (2019) Victor Sanh, Lysandre Debut, Julien Chaumond, and Thomas Wolf. 2019. Distilbert, a distilled version of bert: smaller, faster, cheaper and lighter. arXiv preprint arXiv:1910.01108.
- Stammbach and Ash (2020) Dominik Stammbach and Elliott Ash. 2020. e-fever: Explanations and summaries for automated fact checking. In Proceedings of the 2020 Truth and Trust Online Conference (TTO 2020), page 32. Hacks Hackers.
- Thorne and Vlachos (2020) James Thorne and Andreas Vlachos. 2020. Avoiding catastrophic forgetting in mitigating model biases in sentence-pair classification with elastic weight consolidation. arXiv e-prints, pages arXiv–2004.
- Thorne et al. (2018) James Thorne, Andreas Vlachos, Christos Christodoulopoulos, and Arpit Mittal. 2018. Fever: A large-scale dataset for fact extraction and verification. In Proceedings of the 2018 Conference of the North American Chapter of the Association for Computational Linguistics: Human Language Technologies, Volume 1 (Long Papers), pages 809–819.
- Tvinnereim and Fløttum (2015) Endre Tvinnereim and Kjersti Fløttum. 2015. Explaining topic prevalence in answers to open-ended survey questions about climate change. Nature Climate Change, 5(8):744–747.
- Vlachos and Riedel (2014) Andreas Vlachos and Sebastian Riedel. 2014. Fact checking: Task definition and dataset construction. In Proceedings of the ACL 2014 Workshop on Language Technologies and Computational Social Science, pages 18–22.
- Wang (2017) William Yang Wang. 2017. “liar, liar pants on fire”: A new benchmark dataset for fake news detection. In Proceedings of the 55th Annual Meeting of the Association for Computational Linguistics (Volume 2: Short Papers), pages 422–426.
- Yamada et al. (2021) Ikuya Yamada, Akari Asai, and Hannaneh Hajishirzi. 2021. Efficient passage retrieval with hashing for open-domain question answering. arXiv preprint arXiv:2106.00882.
- Zhang et al. (2019) Tianyi Zhang, Varsha Kishore, Felix Wu, Kilian Q Weinberger, and Yoav Artzi. 2019. Bertscore: Evaluating text generation with bert. arXiv preprint arXiv:1904.09675.