Phonon anomalies associated with spin reorientation in the
Kagome ferromagnet Fe3Sn2
Abstract
Polarization- and temperature-dependent Raman data along with theoretical simulations are presented for the Kagome ferromagnet Fe3Sn2. Eight out of nine expected phonon modes were identified. The experimental energies compare well with those from the simulations. The analysis of the line widths indicates relatively strong phonon-phonon coupling in the range 0.1 to 1. The temperature-dependent frequencies of three A1g modes show weak anomalies at approximately 100 K. In contrast, the linewidths of all phonon modes follow the conventional exponential broadening up to room temperature except for the softest A1g mode, whose width exhibits a kink close to 100 K and becomes nearly constant for K. These features are indicative of a spin reorientation taking place in the temperature range above 100 K which might arise from spin-phonon coupling. The low-energy part of the electronic continuum in symmetry depends strongly on temperature. The possible reasons include particle-hole excitation tracking the resistivity, a spin-dependent gap or spin fluctuations.
keywords:
Phonons, light scattering, magnetismGe He
Leander Peis
Ramona Stumberger
Lilian Prodan
Vladimir Tsurkan
Nico Unglert
Liviu Chioncel
István Kézsmárki
Rudi Hackl
Dr. Ge He, Leander Peis
Walther Meissner Institut, Bayerische Akademie der Wissenschaften, 85748 Garching, Germany
Nico Unglert, Prof. Dr. Liviu Chioncel
Theoretische Physik III, Institut für Physik, Universität Augsburg, Universitätsstrasse 1 (Physik Süd), 86159 Augsburg, Germany
Dr. Lilian Prodan, Dr. Vladimir Tsurkan, Prof. Dr. István Kézsmárki
Experimentalphysik V, Institut für Physik, Universität Augsburg, Universitätsstrasse 1 (Physik Süd), 86159 Augsburg, Germany
Ramona Stumberger, Prof. Dr. Rudi Hackl
Technische Universität München, Fakultät für Physik, 85748 Garching, Germany
Walther Meissner Institut, Bayerische Akademie der Wissenschaften, 85748 Garching, Germany
Email Address: hackl@tum.de
1 Introduction
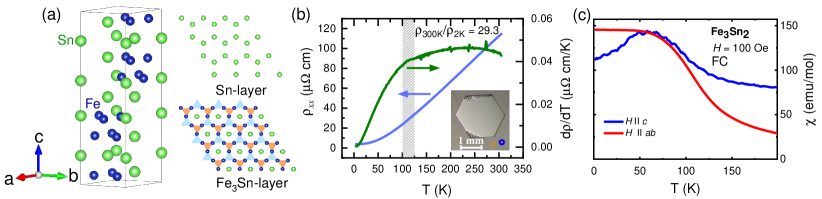
Materials with novel properties and functionalities have intriguing scientific and applied perspectives. In particular magnets with exotic ground states continue to attract attention since the properties may be tailored via the lattice and/or the electronic band structure. Fe3Sn2 is a layered Kagome ferromagnet with a very high Curie temperature K. The Fe-Sn bi-layers are separated by Sn mono-layers [1, 2, 3, 4] as shown in Fig. 1(a). Due to its out-of-plane anisotropy [2, 3] with the magnetic easy axis perpendicular to the Kagome layers, magnetic stripes and a variety of magnetic bubbles have been observed in thin lamellae using Lorentz transmission electron microscopy [5, 6, 7, 8]. Since the material possesses inversion symmetry, these mesoscale magnetic textures do not form due to the antisymmetric part of the exchange coupling tensor, i.e. the Dzyaloshinskii-Moriya interaction, but due to a competition between the out-of-plane anisotropy and the magnetic dipole-dipole interaction. The magnetic anisotropy of the system is also linked to the reconstruction of its band structure in a magnetic field: A strong shift of bands close to the Fermi energy was found to be dependent not only on the magnitude but also on the orientation of the magnetic field [9]. Moreover, indications of a temperature-driven spin reorientation, from out-of-plane at high temperatures towards in-plane at low temperatures, have been found earlier in Mössbauer [2, 3], x-ray [4] and transport studies [10]. Optical absorption experiments [11] reveal an additional feature in the 10 meV range below 150 K and associate it with this spin reorientation. Similarly, transport and magnetisation experiments [performed on our own samples and plotted in Fig. 1(b) and (c)] show a cross-over temperature close to 100 K and will be discussed in detail in section 2.1.
There are various other effects in a planar hexagonal lattice such as massless Dirac fermions. As opposed to graphene the tips of the cones typically intersect below the Fermi energy and may become massive in the presence of spin-orbit coupling (SOC) [9, 12]. Recently, the existence of flat bands at approximately 200 meV below in confined regions of the Brillouin zone was associated with magnetic ordering in Fe3Sn2 [13]. These observations and suggestions are among the main motivations for the present work, focusing on spin reorientation and band reconstruction phenomena in Fe3Sn2 and its consequences for the lattice dynamics and charge response, both probed by Raman spectroscopy.
Spin textures usually entail a huge anomalous Hall effect (AHE) being associated with the Berry phase the electrons pick up upon moving across a magnetic background [14]. Thus Fe3Sn2 has similarities with, e.g., MnSi [15] and various other compounds. The origin, however, of the rather complex itinerant ferromagnetism with a high and a spin reorientation at some 100 K is elusive. The most popular approaches are based on the Hubbard model and either favor flat-band ferromagnetism [16, 17, 18] or a trade-off between potential and kinetic energy [13, 19, 20]. The latter case is reminiscent of the magnetism in Fe(Se,Te) where itinerant and nearly localized spins seem to cooperate as well [21, 22, 23].
It is unlikely that the magnetism in Fe3Sn2 can be observed directly in a similar fashion as in FeSe since the two-magnon excitations typical for antiferromagnets [24] do not exist here. However, indirect signatures of spin order, the spin reorientation or the interaction between spin, lattice and electrons may be expected, in particular gaps between flatbands such as in the optical experiments [11] or phonon renormalization effects as in MnSi [25]. In this, to our knowledge first, Raman study of the topological material Fe3Sn2 we start with analyzing the phonons.
2 Experimental Methods
2.1 Samples
Fe3Sn2 single crystals have been grown by the chemical transport reaction method. As starting material we used pre-synthesized poly-crystalline powder prepared by solid state reaction from the high-purity elements Fe (99.99 %) and Sn (99.995 %). Iodine was used as the transport agent. The growth was performed in SiO2 ampoules in two-zone furnaces at temperatures between 730 and 680 K. After 4-6 weeks of transport, the single-crystals, having a plate-like form with a thickness in the range 20-40 m along the -axis and 3-5 mm in the -plane [see inset of Fig.1(b)], were found in the hot part of ampoule.
The sample used for the experiments has a Residual Resistance Ratio of [Fig.1(b)] indicating high crystalline quality. The derivative of the resistivity, (green graph), indicates a qualitative change of the slope at approximately 100 K where all spins are expected to be finally parallel to the -plane. Fig. 1(c) shows the temperature dependences of the in-plane and out-of-plane magnetic susceptibilities, and , respectively. For the analysis of the out-of-plane susceptibility, demagnetization effects had to be taken into account because of the thin-slab geometry of the sample. At high temperatures, is more than three times larger than . Toward 100 K this difference diminishes. Below 100 K starts to decrease while saturates. Consequently, at low temperatures the -axis becomes harder than the in-plane direction with at 2 K. In the same temperature range, where and cross each other, the resistivity shows a kink, as best seen in its temperature derivative in Fig. 1(b). After witnessing the spin reorientation in magnetic and transport properties, we turn to the Raman spectroscopic study of Fe3Sn2, the main subject of this work.
2.2 Light scattering
We performed polarized inelastic light scattering experiments at an excitation wavelength of 575 nm (Coherent GENESIS MX-SLM577-500). The samples were attached to the cold finger of a 4He flow cryostat. Polarized photons hit the sample at an angle of incidence of yielding a spot size of approximately . The polarized scattered photons were collected along the surface normal of the sample and focused on the entrance slit of a double monochromator. The resolution of the spectrometer is set at 2.8 cm-1. Polarized photons having the selected energy were recorded with a CCD detector. The number of photons per second is proportional to the Van-Hove function where is the Bose factor and is the imaginary part of Raman response function.
For the measurements shown here we used only two polarization configurations, and , where and for the incoming light (first symbol) inside the sample. An absorbed laser power of mW independent of the polarization is used. induced a heating in the spot region of approximately 1-2 K/mW. Here only the holder temperature is indicated. Since we use (near) backscattering configurations both signs change for the scattered light (second symbol). The details of the Raman selection rules will be discussed below. Due to the symmetric shape of the observed phonon modes and the narrow line width (FWHM), , where is the resonance energy of the respective mode, their line shapes may be described by temperature-dependent Lorentz functions.
2.3 Selection rules and simulations
The Raman-active phonon energies and eigenvectors at the point of the Brillouin zone were derived on the basis of the crystal structure using density functional theory (DFT). The symmetry selection rules may be determined from the point group and the atomic positions in the crystal. The space group of Fe3Sn2 is Rm (No. ) and belongs to D3d point group. The corresponding Raman tensors read
| (1) |
| (2) |
| (3) |
According to the Wyckoff positions of the Fe () and Sn atoms () in Fe3Sn2, there are 4 and 5 Raman-active phonons. On the basis of the Raman tensors [Eqs. (1), (2), and (3)] the and phonons, may be projected separately in the and channel, respectively.
Electronic structure calculations were carried out using DFT and the projector augmented wave (PAW) method as implemented in VASP [26, 27, 28, 29]. The generalized gradient approximation as parameterized in the Perdew-Burke-Ernzerhof (PBE) functional [30] was used to treat exchange and correlation effects. The cutoff for the plane-wave basis was chosen as eV, and the Brillouin-zone was sampled with a -centered Monkhorst-Pack grid. The crystal structure reported in [4] was fully relaxed until the forces on all atoms were below . -point phonon calculations were performed using Density Functional Perturbation theory as implemented in VASP. For the symmetry analysis of all phonon modes the phonopy package [31] was employed, allowing for an unambiguous assignment to the experimental frequencies, as compiled in Table 1. The eigenvectors characterizing the atomic displacement coordinates are listed in Supplementary Materials A.
| Phonon | (1) | (2) | (3) | (4) | (1) | (2) | (3) | (4) | (5) | |
|---|---|---|---|---|---|---|---|---|---|---|
| Energy (cm-1) | Simulation | 83.9 | 140.1 | 232.1 | 241.8 | 92.7 | 138.2 | 147.1 | 196.7 | 278.3 |
| Experiment | 86.6 | 146.8 | 237.7 | 251.6 | 94.3 | 133.8 | 147.0 | 199.8 | - | |
| FWHM (cm-1) | 4.5 | 4.1 | 4.7 | 4.9 | 3.6 | 3.1 | 3.8 | 4.1 | - | |
| 0.20; 0.05 | 0.14 | 0.68 | 0.74 | 0.11 | 1.11 | 0.29 | 0.42 | - | ||
3 Results and Discussions
The main focus of the paper is placed on the analysis of the phonon modes in the temperature range of the re-orientation of the Fe spins. Briefly, we will also discuss the electronic continuum.
3.1 Phonons
Figures 2(a) and (b) show, respectively, the and Raman spectra at temperatures ranging from 4.2 K to 320 K. We can identify four phonons and four out of the expected five phonons. These phonons harden continuously with decreasing temperature. The absent fifth phonon might be too weak in intensity to be detected.
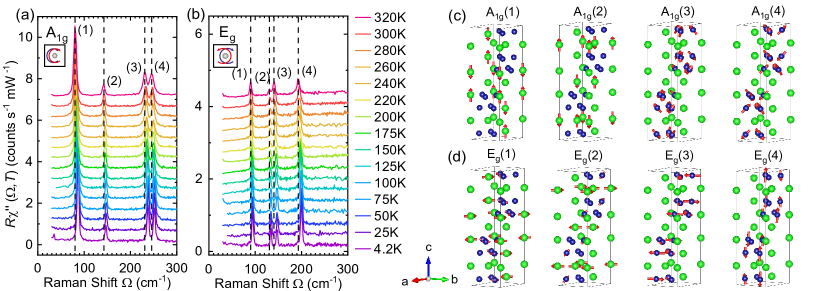
For a quantitative analysis the phonon peaks were fitted using a Voigt function, which is a convolution of the Lorentzian shape of the phonons and a Gaussian for the spectral resolution of the setup. In the narrow spectral range displayed in Fig. 2 and the laser line used, the resolution is constant and was set at 2.8 . Thus the widths indicated, directly correspond to those of the phonons. The reasonable quality of the fits (see Fig. S1) indicates that the Lorentzian widths result from the finite life time of the phonons, determined by phonon-phonon decay into two modes having the same energy and opposite wave vectors k and [32].
The peak energies and linewidths (FWHM) derived in this way are depicted in Fig. 3 and 4, and labeled consecutively from low to high. Their respective values at K are listed in Table 1 and found to be in good agreement with the simulation. All phonon modes become harder and narrower upon cooling. The usual changes in width and energy are related to the unharmonic decay [32] and the lattice contraction [33]. However, as opposed to the modes some of the modes show weak but significant deviations from the expected behavior in the temperature range around 100 K. In particular, kinks are observed in the energies of modes 1, 3, and 4 [see hatched range in Fig. 3(a) and (c)]. After remeasuring the spectra [open symbols in Fig. 3(a)–(d)] the kinks can still be observed but are shifted slightly. The origin of this shift is not entirely clear but may be related to the first-order nature of the reorientation transition and the then expected hysteresis [34]. In fact, the open points were obtained upon heating from low to high temperature in an uninterrupted series whereas the black points were measured upon cooling as indicated in the figure caption. More experiments are required to finally clarify this issue.
The conventional reduction of the phonon widths with decreasing temperature can be understood in terms of the anharmonic decay described above [32] and may be represented by
| (4) |
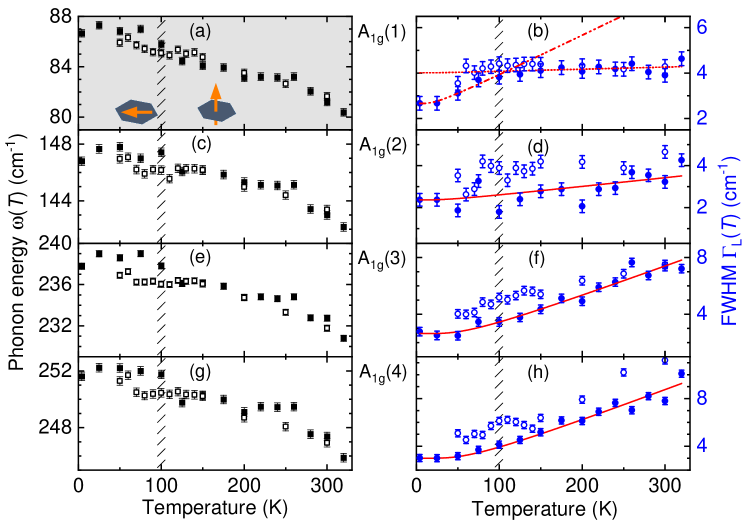
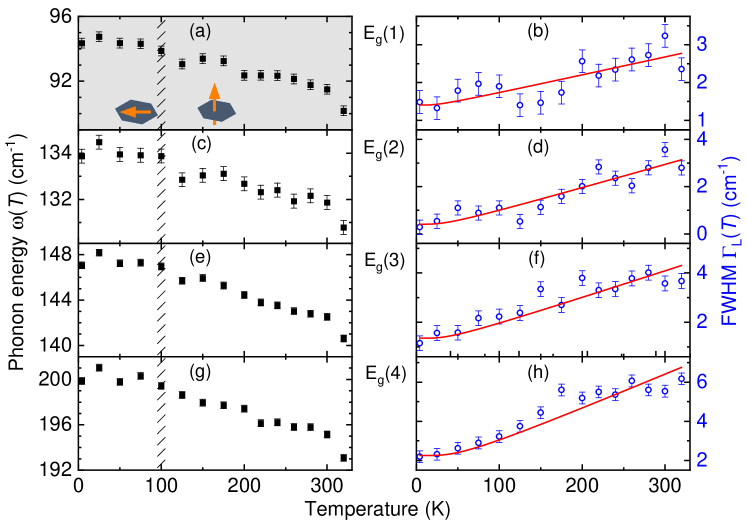
and in Eq. (4) can be extrapolated to zero from the experimental points below K, leaving only the phonon-phonon coupling as a free parameter. The corresponding curves are indicated in red in Fig. 3 and 4, and the resulting values for are compiled in Table 1. As opposed to the linewidth the phonon energy depends on the occupation and the thermal expansion where the latter one is approximately larger by two orders of magnitude and depends crucially on the variation of the interatomic potential with distance [33]. The temperature dependences of the phonon width and energy are related by the usual Kramers-Kronig transformation and were determined for constant volume by Balkanski and coworkers [35]. However, in an experiment the pressure rather than the volume are constant, and this approach is not applicable (see, e.g., Ref. [25]).Thus, the analysis of the phonon energy requires the knowledge of the thermal expansion and the Grüneisen parameters which are currently not available.
All phonons except for one show essentially conventional behavior and become exponentially narrower upon cooling. Only the (1) phonon at 86 shows unexpected behavior directly in the data, and the description of the temperature dependence according to Eq. (4) is similar to the other modes only for T K [dashed-dotted in Fig. 3(a)] and yields . For T K (dotted) the width is almost temperature independent corresponding to an unusually small coupling of . So we conclude that the symmetric phonon-phonon decay channel is essentially blocked when the spins point along the -axis and becomes accessible only when the spins are rotated into the -plane. This hand-waving argument certainly needs further theoretical analysis but a realistic model of the spin-phonon coupling is beyond the scope of this paper and requires complex, presumably numerical work.
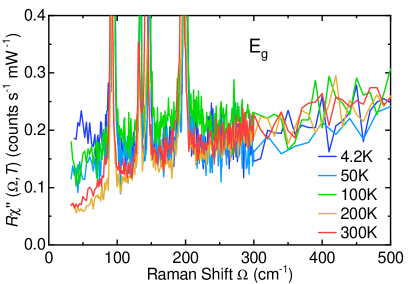
3.2 continuum at low energy
Since Fe3Sn2 is purely metallic and orders at K, gaps or isolated electronic or magnetic modes are not immediately expected in the temperature range studied. Due to the magnetic anisotropy one may expect to see a single magnon at finite energy given by the anisotropy field. However, our microwave experiments show that the energy is presumably too small for the Raman experiment. In addition, fluctuations as a consequence of geometric frustration may smear out the energies.
The small variations with temperature of the spectra below 100 cm-1, as shown in Fig. 5, look unspectacular at first glance. However, the increase at low temperature must be considered real since a peak at approximately 47 can be resolved at 4.2 K rather than a divergence towards zero energy as in the case of diffuse scattering of the laser light. The intensity increase may either originate from particle-hole excitations reflecting the temperature dependence of the resistivity [see Fig. 1(b)] or from interband transitions as suggested by the optical conductivity [11] or from fluctuations similar to FeSe [24]. For clarification larger crystals with flat surfaces are necessary.
Compared with the spectra, the continuum is essentially temperature-independent (see Supplementary Materials C). As in the case of the spectra, the data are reliable above 30 . Obviously, different excitations or regions of the Brillouin zone are projected in the two symmetries. Given the correspondence between transport and low-energy spectra, the most likely explanation is that the carrier relaxation observed in the spectra is almost temperature independent. This interesting anisotropy calls for more studies in optimized samples.
4 Conclusions
We have studied the Kagome ferromagnet Fe3Sn2 using polarized Raman scattering. We identified all but one phonon lines and compared them to simulations of the lattice dynamics on the basis of density functional theory. The agreement between predicted and experimental phonon energies is better than 5 % for all lines. All phonons broaden upon heating. By assuming symmetric decay of the lines at and into two lines at and the dimensionless phonon-phonon coupling was extracted and found to be in the range 0.1 to 1.1 for all lines and temperatures with one exception: The phonon with the lowest energy exhibits below 100 K and above 100 K thus it has only very small phonon-phonon coupling at temperatures with the spins aligned along the -axis parallel to the motion of the Sn atoms for the (1) mode. For this specific eigenvector the coupling to the Fe spins parallel to the -axis is certainly small, and one may speculate that the relatively large values of the other phonons result from coupling via the spins. As soon as the spins rotate into the plane also the (1) mode couples to the spins and thus participates in the anharmonic decay.
Because of the relatively high Curie temperature of K in Fe3Sn2 one does not expect strong changes in the electronic properties below room temperature. Yet, the continuum exhibits a substantial variation with temperature at low energies which are reminiscent of the strong temperature dependence of the resistivity . However, the low-energy peak in the spectra may also originate from a band gap induced by the spin reorientation as suggested by optical measurements [11], although the rather different energies in the two experiments argues against this possibility, or from magnetic fluctuations in a geometrically frustrated system. There are no indications of a flat band in the 200 meV range. Yet, with the available equipment we cannot obtain a sufficiently high data quality for a quantitative analysis.
Acknowledgements
We thank Y.-F. Xu for fruitful discussions. This work is supported by the Deutsche Forschungsgemeinschaft (DFG) through the coordinated programme TRR80 (Project-ID 107745057) and project HA 2071/12-1. G. He would like to thank the Alexander von Humboldt Foundation for support through a fellowship.
Author contributions
G. He and L. Peis contributed equally to the Raman study.
References
- [1] G. Trumpy, E. Both, C. Djéga-Mariadassou, P. Lecocq, Phys. Rev. B 1970, 2 3477.
- [2] G. Le Caër, B. Malaman, B. Roques, J. Phys. F: Met. Phys. 1978, 8 323.
- [3] B. Malaman, C. Fruchart, G. Le Caër, J. Phys. F: Met. Phys. 1978, 8 2389.
- [4] L. A. Fenner, A. A. Dee, A. S. Wills, J. Phys. Condens. Matter 2009, 21 452202.
- [5] Z. Hou, W. Ren, B. Ding, G. Xu, Y. Wang, B. Yang, Q. Zhang, Y. Zhang, E. Liu, F. Xu, W. Wang, G. Wu, X. Zhang, B. Shen, Z. Zhang, Adv. Mater. 2017, 29 1701144.
- [6] Z. Hou, Q. Zhang, G. Xu, C. Gong, B. Ding, Y. Wang, H. Li, E. Liu, F. Xu, H. Zhang, Y. Yao, G. Wu, X.-x. Zhang, W. Wang, Nano Lett. 2018, 18 1274.
- [7] J. Tang, Y. Wu, L. Kong, W. Wang, Y. Chen, Y. Wang, Y. Soh, Y. Xiong, M. Tian, H. Du, Natl. Sci. Rev. 2020, 8 nwaa200.
- [8] J. Tang, L. Kong, Y. Wu, W. Wang, Y. Chen, Y. Wang, J. Li, Y. Soh, Y. Xiong, M. Tian, H. Du, ACS Nano 2020, 14 10986.
- [9] J.-X. Yin, S. S. Zhang, H. Li, K. Jiang, G. Chang, B. Zhang, B. Lian, C. Xiang, I. Belopolski, H. Zheng, T. A. Cochran, S.-Y. Xu, G. Bian, K. Liu, T.-R. Chang, H. Lin, Z.-Y. Lu, Z. Wang, S. Jia, W. Wang, M. Z. Hasan, Nature 2018, 562 91.
- [10] Q. Wang, S. Sun, X. Zhang, F. Pang, H. Lei, Phys. Rev. B 2016, 94 075135.
- [11] A. Biswas, O. Iakutkina, Q. Wang, H. C. Lei, M. Dressel, E. Uykur, Phys. Rev. Lett. 2020, 125 076403.
- [12] Z.-Z. Lin, X. Chen, phys. stat. solidi (RRL) Rapid Research Letters 2020, 14 1900705.
- [13] Z. Lin, J.-H. Choi, Q. Zhang, W. Qin, S. Yi, P. Wang, L. Li, Y. Wang, H. Zhang, Z. Sun, L. Wei, S. Zhang, T. Guo, Q. Lu, J.-H. Cho, C. Zeng, Z. Zhang, Phys. Rev. Lett. 2018, 121 096401.
- [14] N. Nagaosa, J. Sinova, S. Onoda, A. H. MacDonald, N. P. Ong, Rev. Mod. Phys. 2010, 82 1539.
- [15] C. Franz, F. Freimuth, A. Bauer, R. Ritz, C. Schnarr, C. Duvinage, T. Adams, S. Blügel, A. Rosch, Y. Mokrousov, C. Pfleiderer, Phys. Rev. Lett. 2014, 112 186601.
- [16] A. Mielke, J. Phys. A 1991, 24 3311.
- [17] A. Mielke, J. Phys. A 1991, 24 L73.
- [18] A. Mielke, J. Phys. A 1992, 25 4335.
- [19] Y. Nagaoka, Phys. Rev. 1966, 147 392.
- [20] F. Pollmann, P. Fulde, K. Shtengel, Phys. Rev. Lett. 2008, 100 136404.
- [21] Z. P. Yin, K. Haule, G. Kotliar, Nature Mater. 2011, 10 932.
- [22] I. Leonov, S. L. Skornyakov, V. I. Anisimov, D. Vollhardt, Phys. Rev. Lett. 2015, 115 106402.
- [23] K. M. Stadler, Z. P. Yin, J. von Delft, G. Kotliar, A. Weichselbaum, Phys. Rev. Lett. 2015, 115 136401.
- [24] A. Baum, H. N. Ruiz, N. Lazarević, Y. Wang, T. Böhm, R. Hosseinian Ahangharnejhad, P. Adelmann, T. Wolf, Z. V. Popović, B. Moritz, T. P. Devereaux, R. Hackl, Commun. Phys. 2019, 2 14.
- [25] H.-M. Eiter, P. Jaschke, R. Hackl, A. Bauer, M. Gangl, C. Pfleiderer, Phys. Rev. B 2014, 90 024411.
- [26] G. Kresse, J. Hafner, Phys. Rev. B 1994, 49 14251.
- [27] G. Kresse, J. Furthmueller, Comput. Mater. Sci. 1996, 6 15.
- [28] G. Kresse, J. Furthmueller, Phys. Rev. B 1996, 54 11169.
- [29] G. Kresse, D. Joubert, Phys. Rev. B 1999, 59 1758.
- [30] J. P. Perdew, K. Burke, M. Ernzerhof, Phys. Rev. Lett. 1996, 77 3865.
- [31] A. Togo, I. Tanaka, Scr. Mater. 2015, 108 1.
- [32] P. G. Klemens, Phys. Rev. 1966, 148 845.
- [33] C. Postmus, J. R. Ferraro, S. S. Mitra, Phys. Rev. 1968, 174 983.
- [34] N. Kumar, Y. Soh, Y. Wang, Y. Xiong, Phys. Rev. B 2019, 100 214420.
- [35] M. Balkanski, R. F. Wallis, E. Haro, Phys. Rev. B 1983, 28 1928.