Unresolved sources naturally contribute to PeV -ray diffuse emission observed by Tibet AS
Abstract
The Tibet AS experiment provided the first measurement of the total diffuse gamma-ray emission from the Galactic disk in the sub-PeV energy range. Based on the analysis of TeV sources included in the HGPS catalog, we predict the expected contribution of unresolved pulsar-powered sources in the two angular windows of the Galactic plane observed by Tibet AS. We show that the sum of this additional diffuse component due to unresolved sources and the truly diffuse emission, due to cosmic ray interaction with the interstellar medium, well saturates the Tibet data, without the need to introduce a progressive hardening of the cosmic-ray spectrum toward the Galactic center.
1 Introduction
The Tibet AS collaboration has recently obtained a measurement of the Galactic diffuse -ray emission, providing the first evidence that this component extends to sub-PeV energies (Amenomori et al., 2021). The origin of this high-energy diffuse emission is extensively debated in the very recent literature, see e.g. Liu & Wang (2021); Koldobskiy et al. (2021); Fang & Murase (2021); Neronov et al. (2021).
An essential step for the interpretation of Tibet AS data is the evaluation of the cumulative flux produced by sources that are too faint to be individually resolved. These give rise to a large-scale diffuse emission, superimposed to that produced by cosmic ray (CR) interactions with the interstellar medium, that can affect the space and energy distribution of the observed signal. Population studies of TeV Galactic sources have shown that unresolved contribution is not negligible in the TeV domain, see e.g. Cataldo et al. (2020); Steppa & Egberts (2020). Recently Tibet AS (Amenomori et al., 2019) and HAWC (Abeysekara et al., 2020) have shown that several Galactic sources produce rays above TeV. Moreover, LHAASO-KM2A reports the detection of more than photons at energies above and up to from 12 ultra-high-energy -ray sources (Cao et al., 2021). It is thus natural to expect that unresolved source contribution may be relevant also in the sub-PeV energy range.
In this paper, we took advantage of the observations provided by H.E.S.S. Galactic Plane Survey (HGPS) in the TeV energy domain to discuss the implications of unresolved pulsar-powered sources for the interpretation of Tibet AS results. Our approach is based on standard assumptions for the spatial and intrinsic luminosity source distributions (also employed e.g. Steppa & Egberts (2020); Strong (2007); Pothast et al. (2018)). These prescriptions are physically well-motivated for a population of sources powered by pulsar activity, like Pulsar Wind Nebulae (PWNe) or TeV halos which could represent the dominant component of the TeV sky, as recently suggested by Sudoh et al. (2019); Abdalla et al. (2018a). We show that the inclusion of unresolved contribution from these sources, adding up to standard predictions for CR diffuse flux (Lipari & Vernetto, 2018), naturally explains the Tibet AS data, without the need to introduce a progressive hardening of the CR spectrum toward the Galactic center.
2 Source population
It is naturally expected that sources provide a relevant contribution to high energy -ray Galactic emission, see e.g. Ahlers & Murase (2014) for an estimate of the total emission expected from different classes of Galactic sources. However, the key point is to quantify the fraction of sources that are not resolved by experiments, since these generate a cumulative diffuse emission that adds up to the one produced by CR interactions. The goal of this paper is to predict the unresolved pulsar-powered sources contribution to galactic -ray emission in TeV and sub-PeV energy domain. In order to estimate this quantity, we consider the information provided by HGPS in the energy range .
We assume that average source emission spectrum can be described by a power-law with exponential cutoff, i.e. . The index is given by the average spectral index of sources included in the HGPS catalog, i.e. . The cutoff energy is chosen as . This value is not yet constrained and it corresponds to assuming that TeV source spectrum observed by H.E.S.S. can be extrapolated with a moderate suppression in the sub-PeV region. In this respect, it is interesting to note that the Tibet AS experiment has recently shown that Crab Nebula emits rays in the sub-PeV region with statistical significance (Amenomori et al., 2019). Moreover, HAWC experiment has reported evidence of several Galactic sources emitting above (Abeysekara et al., 2020) whose -ray flux can be described as leptonic emission from electrons/positrons injected with power-law spectrum and exponential cutoff around 1 PeV (Sudoh et al., 2021). We remark that the adopted value of moderately affects flux predictions for the low energy data points given by Tibet AS that are relatively close to the range probed by H.E.S.S.. At larger energies (), the source emission spectrum is limited by photons absorption in the interstellar radiation field (mainly due to Cosmic Microwave Background radiation) that suppresses the flux produced by distant sources. We take this into account, as it is described in Vernetto & Lipari (2016). The sources space and luminosity distribution is described by:
| (1) |
where indicates the distance from the Galactic Center. The function is assumed to be proportional to the pulsar distribution parameterized by Lorimer et al. (2006) and to scale as with , along the direction perpendicular to the Galactic plane. It is conventionally normalized to one when integrated in the entire Galaxy.
The function gives the source intrinsic luminosity distribution in the TeV energy domain111We indicate with and the integrated source luminosity and flux and in the energy range probed by H.E.S.S.. It is parameterized as a power-law:
| (2) |
in the luminosity range . This distribution is naturally obtained for a population of fading sources, such as PWNe or TeV Halos, created at a constant rate and having intrinsic luminosity that decreases over a time scale according to:
| (3) |
where indicates the time passed since source formation. In this assumption, the exponent of the luminosity distribution is given by .
The birth rate of PWNe or TeV Halos is similar to that of SN explosions in our Galaxy, i.e. (Diehl et al., 2006). Since ray emission is powered by pulsar activity, the TeV-luminosity is a fraction of the spin-down power , i.e. we assume where . If pulsar energy loss is dominated by magnetic dipole radiation (braking index ) and the efficiency of TeV emission does not depend on time (), the exponent in Eq. (3) is , that corresponds to a source luminosity function . The possibility of being correlated to the spin-down power, i.e. , was suggested by Abdalla et al. (2018a) that found with by studying a sample of PWNe in the HPGS catalog222 Our predictions are not sensitive to the absolute value for being it absorbed inside the parameter that we obtain as a best-fit from the HGPS data.. In this case, one obtains in Eq. (3) that corresponds to a source luminosity function .
3 The unresolved source contribution
In a recent paper (Cataldo et al., 2020), we have shown that H.E.S.S. observations can be used to efficiently constrain the TeV sources population. In particular, we considered HGPS sources producing a photon flux above 1 TeV larger than of the CRAB flux. Above this threshold, the HGPS catalog can be considered complete (Abdalla et al., 2018b) and it includes sources. We removed from the analysis sources firmly associated with SNRs (i.e. Vela Junior, RCW 86, RX J1713.7-3946) and we treated the residual sources as pulsar-powered. This assumption is justified being this subset composed by firmly identified PWNe, composite objects, showing evidence of both shell and nebular emission, and unidentified sources. In the unidentified sub-sample, sources have been considered as candidate PWNe in further studies on the basis of new data and/or phenomenological considerations (Sudoh et al. (2021), Wakely & Horan (2008), Abdalla et al. (2018a), Giacinti et al. (2020)). The average spectral index of the considered sample of 29 HGPS sources is supporting our assumption .
Namely, by fitting the flux, latitude and longitude distribution of bright sources in the HGPS catalog, we have obtained and for ( and for ). These results are also valid for extended TeV sources, provided that they have dimensions that do not exceed pc. Moreover, our results are consistent with those obtained by a completely independent analysis of HGPS catalog performed by Steppa & Egberts (2020). In this paper, we take advantage of the results of Cataldo et al. (2020) to estimate the unresolved flux produced by the considered population in the TeV and sub-PeV energy domain. For definiteness, we take as a reference the case . Slightly larger fluxes are obtained for .
In order to evaluate the cumulative contribution to diffuse ray signal of sources which are too faint to be individually detected, we introduce a flux detection threshold whose value is estimated by considering the performances of H.E.S.S. detector. H.E.S.S. is able to resolve point-like sources if they produce an integrated flux in the energy domain that is larger than , where is the flux produced by CRAB in the same energy range. Extended sources can however escape detection even if their flux exceeds this value, as it is e.g. understood by looking the sensitivity curve presented in Fig. 13 of Abdalla et al. (2018b). The HGPS catalog can be considered complete for objects producing fluxes larger than (with the exception of sources having an angular extension larger than which cannot be observed by H.E.S.S). Taking this into account, we calculate the cumulative emission of unresolved sources as:
| (4) | |||||
where is the average source emission spectrum333 The constant is determined by the condition that is normalized to one when integrated in the energy domain, i.e. .:
| (5) |
the quantity is the source flux distribution in a given region of the sky (see Eq. A.6 of Cataldo et al. (2020)). The function is the average survival probability of photons with energy emitted by unresolved sources. It includes the gamma absorption due to gamma-gamma interactions on CMB photons following the numerical approach described in Lipari & Vernetto (2018). We vary the flux detection threshold in the range .
Note that the diffuse Galactic -ray flux at sub-PeV energies measured by Tibet AS is obtained by subtracting/masking the contribution of sources which are included in the TeVCAT catalog (Wakely & Horan, 2008). This implies that sources should be faint not only at sub-PeV energies (but also at TeV energies) to escape detection. As a consequence, the above approach which is based on the detection capabilities of experiments operating in the TeV domain is also adequate to investigate unresolved source contribution in the sub-PeV energy range.
4 Results
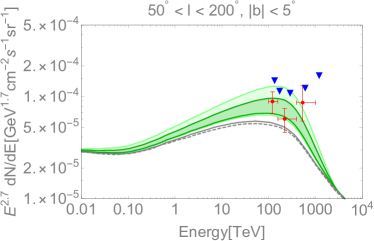
The flux produced by faint sources which are not individually detected adds up the CR diffuse emission, shaping the radial and spectral behaviour of the total diffuse -ray flux observed by different experiments. In Fig. 1, we shows the theoretical predictions for the total diffuse ray flux (green band) as a function of energy in the regions of the Sky probed by Tibet AS experiment (Amenomori et al., 2021). The upper panel (a) refers to the region , while the lower panel (b) shows the region ; both of them correspond to the latitude range . The unresolved sources contribution is obtained as described in the previous section and the thickness of the darker green band corresponds to the uncertainty in flux detection threshold . Namely, the upper and lower green lines are obtained by assuming and , respectively. The light green band also includes the uncertainty on this prediction due to the correlated variations of the source population parameters and within their uncertainty. The truly diffuse emission, produced by CR interactions with the interstellar gas, is shown by grey solid lines in Fig.1 and corresponds to the “space-independent” model of Lipari & Vernetto (2018). Red data points show the diffuse flux measured by Tibet AS. These are obtained after subtracting events within 0.5∘ from known TeV sources included in the TeVCAT catalog (Wakely & Horan, 2008). The error bars show 1 statistical errors. Finally, we also display the CR diffuse flux corresponding to the “space-dependent” model of Lipari & Vernetto (2018) (gray dashed lines) to permit comparison with our predictions. This is obtained by assuming that the CR spectrum in the inner Galaxy is harder than at the Sun position, as it seems to be suggested by Fermi-LAT data (Acero et al., 2016; Yang et al., 2016; Pothast et al., 2018) (see Vecchiotti et al. (2022), Peron et al. (2021) for alternative explanations)444The implications of CR spectral hardening in the inner Galaxy have been also discussed in Pagliaroli et al. (2016); Pagliaroli & Villante (2018); Cataldo et al. (2019) by using a phenomenological approach proposed in Pagliaroli et al. (2016) similar to that adopted by Lipari & Vernetto (2018)..
Several important conclusions can be obtained from Fig. 1. First, we see that unresolved source contribution is not negligible for TeV and becomes progressively more relevant as energy increases as it was also pointed out in Linden & Buckman (2018). This is a natural consequence of the fact that sources are expected to have, on average, harder spectrum (a part from cutoff effects) than CR diffuse emission. At the energy , corresponding to the first data point of Tibet AS, the cumulative flux produced by faint sources is estimated to be () of the truly diffuse signal in the region ().
It is useful to investigate the stability of our results concerning the possibility that some of the 29 sources considered in our analysis turn out to be not pulsar-powered. For this purpose, we repeat the fit of the flux, latitude and longitude distribution of HGPS sources taking into account only the 22 sources with a clear or potential association to PWNe. The new best-fit values with this reduced sample are and . The unresolved flux due to the PWNe population obviously decreases, however, the prediction still falls inside the statistical uncertainty band reported in light green in Fig. 1.
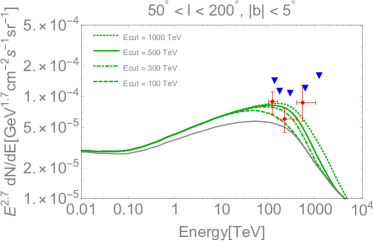
We remark that our prediction is only marginally dependent on the high-energy extrapolation of the source spectra (e.g. the adopted value of the cutoff energy) since the lowest energy data point of Tibet AS experiment nearly overlaps with the energy range probed by H.E.S.S.. This is evident in Fig.2 where green lines represent the total diffuse -ray emission for intermediate sensitivity threshold , obtained by assuming different values for the spectral energy cut-off from PeV to TeV. In particular, if we assume a lower energy cutoff TeV ( TeV), the unresolved source flux at TeV decreases by () with respect to the reference case TeV. We can also consider the effects of source spectral index variations (not shown in Fig. 2 to avoid overcrowding it). If we take ( TeV), the unresolved source flux at TeV decreases by () with respect to the reference assumption . In all these cases, our predictions for the total diffuse -ray emission are still consistent with the first two Tibet data points.

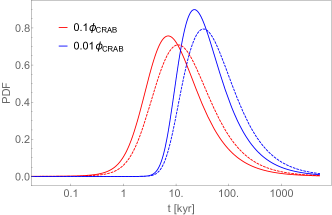
It is interesting to investigate the typical age of sources that give relevant contribution to unresolved signal. In Fig.3 we show the relative contribution to unresolved emission as a function of where is the age of the source, i.e. the time passed since pulsar formation. Thick lines refer to the sky region and while dashed ones refer to the most lateral region between . With blue lines we show the case of detection threshold , corresponding to the lower bound of the green band for the total diffuse flux reported in Fig.3. In this case the dominant contribution is provided by PWNe with an age ranging between kyr, depending on the sky region considered. Red lines correspond to the upper bound of the green band for the total diffuse flux reported in Fig.1 with . In this case a younger population provides a dominant contribution peaking between kyr, depending on the sky region considered. The unresolved flux contribution due to sources older than kyr (likely TeV Halos) is expected to be at most the .
It is important to remark that our calculations naturally reproduce the Tibet AS results both in the low and high longitude observation window, corroborating the conclusion that unresolved PWNe provide a relevant contribution in this energy range. A test of our calculations could be provided by additional observations in the TeV and PeV energy domain. Future experiments with improved sensitivity will be e.g. able to resolve more sources in the regions of interest. As an example, CTA, with a sensitivity according to Sudoh et al. (2019), should be able to resolve about () pulsar-powered sources in the whole Galaxy, if the typical source size is pc ( pc).
We also note that LHAASO-KM2A experiment recently presented preliminary determinations of the diffuse ray signal in the sub-PeV energy domain (Zhao et al., 2021). The LHAASO-KM2A diffuse flux measurement is obtained by masking sources included in TeVCAT catalog (Wakely & Horan, 2008) with a relatively large mask radius555The adopted mask radius is , where represents the extension of the source while is LHAASO-KM2A point-spread-function, and it is typically comparable to or larger than (Zhao et al., 2021).. LHAASO-KM2A preliminary data for the longitude window are lower than Tibet AS results and are close to predictions for the “space-dependent” CR-diffuse emission of Lipari & Vernetto (2018). They cannot be however directly compared with theoretical determinations of the diffuse signal because the masking procedure cuts out a large part of the galactic plane, as it is seen by Fig. 2 of Zhao et al. (2021), where most of the CR-diffuse signal and unresolved emission is produced. They thus naturally represent a lower limit to the total diffuse emission.
Finally, by comparing our predictions in panel a) with the truly-diffuse flux given by the “space-dependent model” of Lipari & Vernetto (2018) (grey dashed lines), we see that the unresolved sources can mimic, at relatively low galactic longitudes, the effects produced by CR-spectral hardening in the inner Galaxy (and vice-versa). This is in agreement with what we have found in Vecchiotti et al. (2022). By looking at panel b), we note, however, that the previous statement is not valid in the longitude range where unresolved sources, differently from CR-spectral hardening, produce an enhancement of the diffuse emission and provide a good description of the Tibet AS data.
The different behaviour has a direct explanation. The diffuse emission at is mainly produced, for geometrical reasons, at galactocentric distances comparable to or larger than the distance of the Sun from the Galactic center. As a consequence, it is not sensitive to variations of the CR distribution in the inner Galaxy. On the contrary, it can be increased by unresolved sources, which are distributed in the whole Galaxy, and thus produce a non vanishing contribution even at large latitudes. We remark that that this point is important because it provides the possibility to distinguish between the two effects in present and future experiments. At the moment, the inclusion of unresolved PWNe contribution produces a better description of the Tibet AS data than CR spectral hardening.
5 Acknowledgements
We thank Silvia Vernetto and Paolo Lipari for useful discussion. The work of GP and FLV is partially supported by the research grant number 2017W4HA7S ”NAT-NET: Neutrino and Astroparticle Theory Network” under the program PRIN 2017 funded by the Italian Ministero dell’Istruzione, dell’Universita’ e della Ricerca (MIUR).
References
- Abdalla et al. (2018a) Abdalla, H., Abramowski, A., Aharonian, F., et al. 2018a, Astron. Astrophys., 612, A2, doi: 10.1051/0004-6361/201629377
- Abdalla et al. (2018b) —. 2018b, Astron. Astrophys., 612, A1, doi: 10.1051/0004-6361/201732098
- Abeysekara et al. (2020) Abeysekara, A., Albert, A., Alfaro, R., et al. 2020, Physical Review Letters, 124, doi: 10.1103/physrevlett.124.021102
- Acero et al. (2016) Acero, F., Ackermann, M., Ajello, M., et al. 2016, Astrophys. J. Suppl., 223, 26, doi: 10.3847/0067-0049/223/2/26
- Ahlers & Murase (2014) Ahlers, M., & Murase, K. 2014, Phys. Rev. D, 90, 023010, doi: 10.1103/PhysRevD.90.023010
- Amenomori et al. (2019) Amenomori, M., Bao, Y. W., Bi, X. J., et al. 2019, Phys. Rev. Lett., 123, 051101, doi: 10.1103/PhysRevLett.123.051101
- Amenomori et al. (2021) Amenomori, M., et al. 2021, Phys. Rev. Lett., 126, 141101, doi: 10.1103/PhysRevLett.126.141101
- Bartoli et al. (2015) Bartoli, B., et al. 2015, Astrophys. J., 806, 20, doi: 10.1088/0004-637X/806/1/20
- Cao et al. (2021) Cao, Z., Aharonian, F. A., An, Q., et al. 2021, Nature, 594, 33, doi: 10.1038/s41586-021-03498-z
- Cataldo et al. (2019) Cataldo, M., Pagliaroli, G., Vecchiotti, V., & Villante, F. L. 2019, JCAP, 12, 050, doi: 10.1088/1475-7516/2019/12/050
- Cataldo et al. (2020) —. 2020, Astrophys. J., 904, 85, doi: 10.3847/1538-4357/abc0ee
- Chantell et al. (1997) Chantell, M. C., et al. 1997, Phys. Rev. Lett., 79, 1805, doi: 10.1103/PhysRevLett.79.1805
- Diehl et al. (2006) Diehl, R., Halloin, H., Kretschmer, K., et al. 2006, Nature, 439, 45, doi: 10.1038/nature04364
- Fang & Murase (2021) Fang, K., & Murase, K. 2021. https://arxiv.org/abs/2104.09491
- Giacinti et al. (2020) Giacinti, G., Mitchell, A. M. W., López-Coto, R., et al. 2020, Astron. Astrophys., 636, A113, doi: 10.1051/0004-6361/201936505
- Koldobskiy et al. (2021) Koldobskiy, S., Neronov, A., & Semikoz, D. 2021, Phys. Rev. D, 104, 043010, doi: 10.1103/PhysRevD.104.043010
- Linden & Buckman (2018) Linden, T., & Buckman, B. J. 2018, Phys. Rev. Lett., 120, 121101, doi: 10.1103/PhysRevLett.120.121101
- Lipari & Vernetto (2018) Lipari, P., & Vernetto, S. 2018, Phys. Rev. D, 98, 043003, doi: 10.1103/PhysRevD.98.043003
- Liu & Wang (2021) Liu, R.-Y., & Wang, X.-Y. 2021, Astrophys. J. Lett., 914, L7, doi: 10.3847/2041-8213/ac02c5
- Lorimer et al. (2006) Lorimer, D. R., Faulkner, A. J., Lyne, A. G., et al. 2006, Mon. Not. Roy. Astron. Soc., 372, 777, doi: 10.1111/j.1365-2966.2006.10887.x
- Neronov et al. (2021) Neronov, A., Semikoz, D., & Vovk, I. 2021. https://arxiv.org/abs/2107.06541
- Pagliaroli et al. (2016) Pagliaroli, G., Evoli, C., & Villante, F. L. 2016, JCAP, 11, 004, doi: 10.1088/1475-7516/2016/11/004
- Pagliaroli & Villante (2018) Pagliaroli, G., & Villante, F. L. 2018, JCAP, 08, 035, doi: 10.1088/1475-7516/2018/08/035
- Peron et al. (2021) Peron, G., Aharonian, F., Casanova, S., Yang, R., & Zanin, R. 2021, Astrophys. J. Lett., 907, L11, doi: 10.3847/2041-8213/abcaa9
- Pothast et al. (2018) Pothast, M., Gaggero, D., Storm, E., & Weniger, C. 2018, JCAP, 10, 045, doi: 10.1088/1475-7516/2018/10/045
- Steppa & Egberts (2020) Steppa, C., & Egberts, K. 2020, Astron. Astrophys., 643, A137, doi: 10.1051/0004-6361/202038172
- Strong (2007) Strong, A. W. 2007, Astrophys. Space Sci., 309, 35, doi: 10.1007/s10509-007-9480-1
- Sudoh et al. (2019) Sudoh, T., Linden, T., & Beacom, J. F. 2019, Phys. Rev. D, 100, 043016, doi: 10.1103/PhysRevD.100.043016
- Sudoh et al. (2021) Sudoh, T., Linden, T., & Hooper, D. 2021. https://arxiv.org/abs/2101.11026
- Vecchiotti et al. (2022) Vecchiotti, V., Pagliaroli, G., & Villante, F. L. 2022, Communication Physics. https://arxiv.org/abs/2107.03236
- Vernetto & Lipari (2016) Vernetto, S., & Lipari, P. 2016, Phys. Rev. D, 94, 063009, doi: 10.1103/PhysRevD.94.063009
- Wakely & Horan (2008) Wakely, S. P., & Horan, D. 2008, International Cosmic Ray Conference, 3, 1341
- Yang et al. (2016) Yang, R., Aharonian, F., & Evoli, C. 2016, Phys. Rev. D, 93, 123007, doi: 10.1103/PhysRevD.93.123007
- Zhao et al. (2021) Zhao, S., Zhang, R., Zhang, Y., & Yuan, Q. 2021, PoS, ICRC2021, 859, doi: 10.22323/1.395.0859