Simulating the chromatin mediated phase separation of model proteins with multiple domains
Abstract
We perform simulations of a system containing simple model proteins and a polymer representing chromatin. We study the interplay between protein-protein and protein-chromatin interactions, and the resulting condensates which arise due to liquid-liquid phase separation, or a via a ‘bridging-induced attraction’ mechanism. For proteins which interact multivalently, we obtain a phase diagram which includes liquid-like droplets, droplets with absorbed polymer, and coated polymer regimes. Of particular interest is a regime where protein droplets only form due to interaction with the polymer; here, unlike a standard phase separating system, droplet density rather than size varies with the overall protein concentration. We also observe that protein dynamics within droplets slow down as chromatin is absorbed. If the protein-protein interactions have a strictly limited valence, fractal or gel-like condensates are instead observed. Together this provides biologically relevant insights into the nature of protein-chromatin condensates in living cells.
The cell nucleus is a highly structured organelle which contains much of an organism’s genetic material (1). This material exists as chromatin, a composite of DNA and histone proteins which makes up the chromosomes. While the nucleus itself is surrounded by a membrane, most of the structures within it [known as ‘nuclear bodies’ (2)] are membraneless assemblies of proteins, DNA and/or RNA. Some of these, including nucleoli, Cajal bodies, and splicing speckles, are found in the interchromatin regions. Others co-localise with chromatin, and examples include: clusters of transcription factors, RNA polymerase II, and other proteins associated with transcription (3, 4); polycomb bodies, involved in cell-type specific gene repression (5, 6); and foci of heterochromatin, a tightly packaged form of chromatin which tends to be transcriptionally repressed (7, 8).
There has been much recent interest in how protein foci form in the nucleus, and whether a liquid-liquid phase separation (LLPS) mechanism plays a role. A common notion is that flexible, low complexity and intrinsically disordered protein (IDP) domains facilitate LLPS (9). IDPs often contain exposed charges or hydrophobic residues, leading to weak multivalent attractive interactions; having multiple interaction points and a ‘coil’ configuration is thought to lead to interactions which are effectively longer ranged than those between globular proteins (10). Many IDPs, and several proteins which possess both disordered and globular domains, have indeed been found to readily phase separate in vitro.
Another mechanism which can (in the presence of chromatin) lead to protein phase separation, is the “bridging-induced attraction” (BIA). This was first uncovered in simulations studying how protein-chromatin interactions can drive chromosome organisation (11, 12), and was more recently demonstrated in vitro (13). It arises when proteins or protein complexes with multiple DNA/chromatin binding domains form molecular bridges between different chromatin regions. The first protein to form a bridge produces a local increase in chromatin density, which leads to further protein binding and bridging at that location; this positive feedback ultimately gives rise to protein clustering. For the case of proteins which bind non-specifically to any chromatin site, the clusters will grow and coarsen until a single protein-rich phase remains (14); when there is an excess of proteins this also leads to chromatin compaction (15). Importantly, the BIA can give rise to phase separated foci in the absence of protein-protein interactions; we call this bridging-induced phase separation (BIPS). In Ref. (16) it was shown that for model proteins with a finite number of chromatin binding domains, the shape of the protein can determine its ability to form bridges: for proteins which readily form bridges (“good bridgers”), the BIA is in effect and there is strong clustering and compaction. For poor bridgers, the BIA is not (or is only weakly) in effect, and protein clustering is not observed.
The idea that LLPS is involved in genome regulation gained popularity after it was shown that heterochromatin protein 1 (HP1), one of the chief constituents of heterochromatin, was found to undergo phase separation in vitro (17, 18). HP1 is highly conserved in eukaryotes, and is known to co-localise with heterochromatin foci (19). Its exact function in heterochromatin formation and gene silencing, however, remains elusive; possibilities are that it directly drives chromatin compaction, that it sterically occludes binding of activating proteins, or that it recruits further gene silencing machinery (20, 21). In mammals there are three paralogs: HP1 and HP1 are thought to have distinct roles in heterochromatin function, while HP1 also has a function in active chromatin (22). All have a similar structure, with two globular domains and three flexible/disordered regions. In the nucleus, HP1 is mainly found in dimers (22, 21) which have two chromatin binding domains, and so these can in principal form bridges.
In this paper we study the interplay between LLPS and BIPS, considering how they could drive protein-chromatin foci localisation and compaction in vivo. Inspired by work on patchy particles (23, 24, 25, 26, 27), we have developed a simple coarse-grained model protein which resembles HP1, and we simulate these in solution with a chromatin fibre. More specifically, we consider two separate models which mimic two microscopic possibilities: (i) that the low-complexity domains give rise to weak and longer-ranged multivalent protein-protein attractions; and (ii) that the interactions between flexible domains are short ranged and have a limited valence such that exactly two domains can interact at a time. The first case involves a scenario where the flexible domains adopt an extended coil configuration, meaning multiple coils can overlap and there will be multiple weakly interacting contact points. The second case could arise, for example, when a disordered protein domain forms a globular secondary structure when interacting with the correct binding partner (28). We explore the parameter space of the two systems in order to understand under what conditions aggregates containing both proteins and chromatin form, and measure the structural and dynamical properties. Importantly, our scheme is simple enough to allow us to perform simulations at many different points in parameter space, but retains details of the domain structure of the protein (explicitly incorporating protein-protein and protein-DNA interaction domains). Although the model is inspired by HP1, due to its simplicity we expect our results to be applicable more widely.
Results
Simulation scheme
In this work we use coarse-grained Langevin dynamics simulations to study the behaviour of a system of simple HP1-inspired model proteins interacting with a model chromatin fibre.
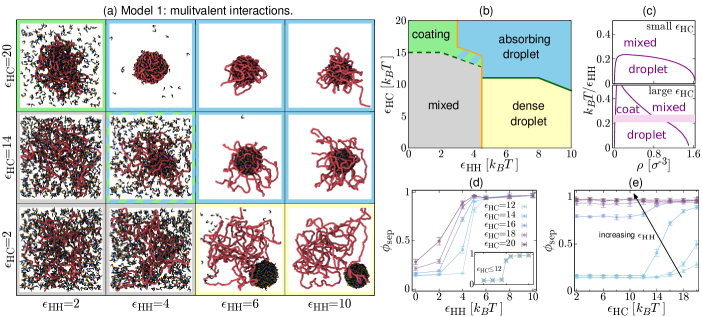
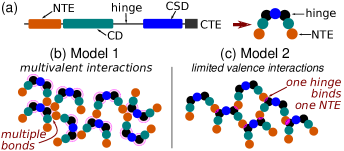
Figure 1(a) shows a schematic representation of the domains of HP1 [as detailed in, e.g., Refs. (17, 21)]. These are known as the C-terminal end (CTE), the chromoshadow domain (CSD), a “hinge” region, the chromodomain (CD), and the N-terminal end (NTE). The CSD and CD are globular domains, while the others are flexible. Two HP1s form a dimer across the CSD, and the CD interacts with chromatin by binding tri-methylated lysines in the H3 histone (H3K9me3, a histone post-translational modification which is a hallmark of heterochromatin). In Ref. (17) it was shown that in human HP1, interaction between the hinge and the (phosphorylated) NTE allows further oligomerisation and, eventually, phase separation. Figure 1(a) also shows a schematic of how HP1 dimers (which we hereon refer to as HP1s) are represented in our simulations. They are modelled as rigid bodies made up from seven spheres, each representing a different domain (see Methods and Supplementary Fig. S1). Our coarse-grained approach does not attempt to model the full details and exact dimensions of the dimer; nevertheless, we aim to capture the main features of the physics at the mesoscale. For chromatin we use a common coarse-grained polymer model where the fibre is represented as a chain of beads of diameter nm connected by springs. The large-scale physical properties of the fibre are represented (i.e., its flexibility), but not the internal nucleosome structure. HP1 component spheres have a diameter 0.5; those representing CDs interact with polymer beads attractively, while all others interact with the polymer sterically only (see Methods). The dynamics of the polymer beads and HP1s (rigid body translation and rotation) are governed by a Langevin equation; we perform extensive simulations using the LAMMPS molecular dynamics software (29). Details are given in Methods and Supplementary Information.
As noted above, we study two versions of the model which differ in their protein-protein interactions. First, we consider multivalent interactions [Fig. 1(b)], using a longer range interaction potential between the spheres representing the hinge and NTE, such that several NTEs can simultaneously interact with a hinge and vice versa (determined by the geometry and steric hindrance). Second, we consider limited valence interactions [Fig. 1(c)], using a shorter ranged potential such that at most one hinge and one NTE can interact at a time. Since an HP1 dimer has two hinges and two NTEs, in the limited valence model a given dimer can bind to at most four others at once. The strength of attractive interactions between HP1s, and between HP1s and chromatin are given by the energies HH and HC respectively. Since the interaction potentials differ, these two values should not be compared directly (nor should HH values for the two different models). We note also that due to the complex geometry the quoted energy values do not necessarily represent the true minima of the interaction potential—see Supplementary Information, section 4.
Below we present simulations of a system containing model HP1s and an bead polymer. For simplicity, we consider a homogeneous polymer where all beads can bind HP1, i.e., it represents a section of H3K9me3 modified chromatin. For the multivalent HP1 model we ran long simulations to obtain equilibrium configurations, as detailed in Supplementary Information; in several cases we ran additional test simulations to check that the configurations are indeed representative of equilibrium, Supplementary Information, section 5. For the limited valence HP1s the system displayed long-lived non-equilibrium metastable states (see below). We confine all components of the system in a cubic box of size (approximately equal to the radius of gyration of the polymer as predicted by the worm-like chain model) by including a “wall potential”. While the confinement reduces the entropy of the system by forbidding some extended polymer configurations, it also prevents the polymer from interacting with its periodic image.
Model 1: Multivalent protein-protein interactions
With this version of the model, when the HP1-chromatin interaction energy HC is small the proteins behave like a standard phase separating system [Model B (30, 31)]. When HC is larger there is more interesting behaviour. We summarise the emerging regimes in the simulation snapshots and phase diagram in Figs. 2(a-c).
When , a phase transition between a uniform mixed phase and a separated phase takes place as HH increases. Above a critical HH value a roughly spherical cluster, or “droplet”, of HP1 forms. We call this the dense droplet regime. By measuring the density of HP1s inside and outside of the droplet, we can also map out the phase diagram on the -HH plane [Fig. 2(c) top, see Supplementary Information, section 6 for details].
For small HP1-HP1 interaction energies, , there is no droplet. Increasing the HP1-chromatin attraction leads to HP1s becoming bound to the polymer, and there is a smooth increase of the fraction bound as HC increases. For large HC there are sufficient HP1s bound such that the region occupied by the chromatin has a higher than average protein density, and the surroundings have a lower than average protein density [green region in Figs. 2(a-b)]. In this sense there is a phase separation, however this regime is profoundly different from the dense droplet phase: a significant fraction of the proteins remain unbound, while the rest tend to “coat” the polymer. Hence, we refer to it as the coating regime.
When both HH and HC are large [blue region in Figs. 2(a-b)] a protein droplet forms, but now the polymer is also absorbed into it. Or in other words, the droplet compacts the polymer. We call this the absorbing droplet regime. Interestingly, the polymer is absorbed to a different degree depending on the precise values of the interaction energies [compare snapshots at and different HH in Fig. 2(a), where different amounts of chromatin extend out from the droplet]. As before, measurements of HP1 density inside and outside of the droplet allows us to construct the -HH phase diagram for large HC, on which we can also identify the coating regime [Fig. 2(c) bottom, and see Supplementary Information, section 6]. There is a further new region on this phase diagram (the shaded stripe) where a droplet forms only due to HP1-chromatin interactions (i.e., HH is not large enough for a protein droplet to form on its own). We discuss this in more detail below.
To characterise these regimes more quantitatively [and to determine the the positions of the lines in Fig. 2(b)], we measure the local protein density by splitting the simulation box into sub-boxes of volume . If there are HP1s in the th sub-box, the local density is . To quantify the level of phase separation we then consider a ‘separation depth’ parameter (32) defined as
| (1) |
where is the overall number density of HP1s, and ∗ is a reference density which takes the value + when and otherwise. We use and , chosen so as to be optimal for distinguishing the different regimes, and leading to on droplet formation. Figure 2(d) shows how sep varies with HH, for different values of HC. For the points sit on top of each other [Fig. 2(d) inset], and we observe a sharp crossover (at ) from in the mixed phase to in the dense droplet phase. As noted above, for these values of the energy the model behaves qualitatively the same as, e.g., interacting Brownian colloids (25), and we expect a first-order phase transition in the thermodynamic limit (Model B). We use a value of to set the position of the orange line in Fig. 2(b). As HC increases, this line shifts to the left—we discuss this interesting regime further below. Figure 2(e) shows that for small HH the separation depth is independent of HC throughout the uniform phase (), before increasing at larger HC in the coating or absorbing droplet regimes; we take the value of HC at which sep starts to increase as the point where the system enters the coating regime [green dashed line in Fig. 2(b)]. For the separation depth , independently of HC; i.e., this parameter cannot differentiate between droplets and absorbing droplets.
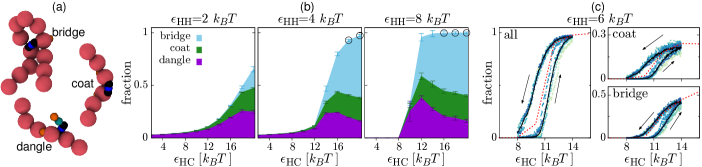
We now consider the nature of the interactions between the HP1 dimers and the chromatin. Since each model HP1 dimer can interact with the polymer via two distinct domains (the CDs), they can bind in three different modes [Fig. 3(a)]. First, an HP1 could bind through only one of the CDs; we call this “dangling”, since it leaves one free CD. Second, the CDs could both bind to the chromatin at adjacent () polymer beads; we call this “coating”. Finally, if the CDs interact with polymer beads which are separated along the chain (), then the protein is “bridging”. As detailed in Ref. (16), the shape of the protein determines its likelihood to bind in each mode: bridging incurs an entropic penalty (due to polymer looping), so unless the shape of the protein specifically disfavours coating, the coating mode is favourable. This is the case here: in the absence of protein-protein interactions we mainly observe coating. The ability of real HP1 dimers to form bridges between distant chromatin regions remains unclear; however, cryo-electron microscopy (33) and detailed molecular simulations (34) have indicated that HP1 can readily sit between adjacent nucleosomes, suggesting that (at least under dilute conditions) coating may well dominate.
In Fig. 3(b) we plot the fraction of bridging, coating and dangling proteins as a function of HC. If we consider the total fraction of proteins bound to the polymer , at small , increases smoothly with HC. Coating and dangling are the dominant binding modes; the BIA is therefore not in effect, and we do not observe BIPS or chromatin compaction. At large HH, where there is a droplet, increases very sharply as HC is increased and the polymer becomes absorbed into the droplet [the curve becomes steeper from left to right in the panels of Fig. 3(b)]. This could indicate the presence of a first-order phase transition in the thermodynamic limit. Within the absorbing droplet regime we also observe that the fraction of bridging proteins increases with HC, and it becomes the dominant mode of binding when both interactions are strong. The main driver of this is that as HC increases, more of the polymer becomes absorbed, and so the likelihood of two distant regions being close enough together for bridges to form increases. We also performed some simulations where the HP1-chromatin interaction was increased slowly (after starting in an equilibrium configuration), before being decreased again [Fig. 3(c)]. As detailed further in Supplementary Information, the system displays hysteresis as the polymer becomes absorbed and then re-emerges from the droplet. These observations suggest that in the limit of a large droplet the system would show a first-order transition as HC increases, to a phase where the polymer is fully absorbed; in our small system we instead observe an extended co-existence regime where the polymer is only partially absorbed. We use the point where to set the position of the solid green line in Fig. 2(b).
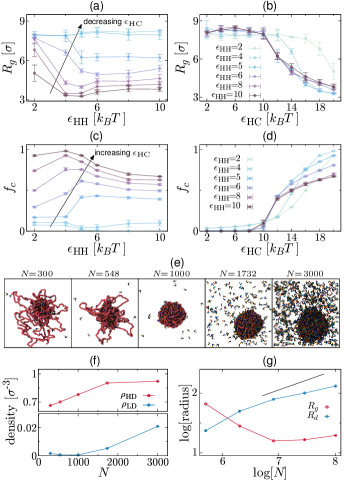
One proposed function of HP1 in vivo is to compact heterochromatin. The ability of our model proteins to compact the chromatin can be probed by measuring its radius of gyration, defined as
| (2) |
where is the position of the th chromatin bead, and . Figures 4(a-b) show how depends on the interaction energies. Interestingly, can vary non-monotonically as HH increases; similar behaviour is observed in the fraction of polymer beads bound by proteins, [Fig. 4(c,d)]. The reason for this non-monotonicity is strikingly apparent in the top row of snapshots in Fig. 2(a): in the leftmost snapshot the polymer is swollen, in the second from the left it is fully absorbed into a protein droplet (small and large ), but in the two right-hand snapshots the polymer is only partially absorbed into the droplet ( increases again, while decreases). That the amount of absorbed polymer varies so widely within the absorbing droplet regime is likely due to competition between different contributions to the free energy. While HP1-chromatin binding represents a reduction in free energy, this is offset by the reduction in entropy due to the compaction/confinement of the polymer within the droplet. Increasing HC increases the amount of chromatin absorbed as the entropic loss is overcome. On the other hand, the presence of the polymer within a droplet will reduce the number of HP1-HP1 interactions due to steric effects; so increasing HH decreases the amount of chromatin absorbed (effectively the polymer is ‘squeezed out’ of the droplet).
Finally in this section, we consider intermediate values of the HP1-HP1 interaction strength, , where we observe the most interesting behaviour. Here, in the absence of chromatin interactions there is no droplet formation and sep is small. However, we note that as HC increases, the orange line in Fig. 2(b) moves to the left, so droplets can form at if the protein-chromatin interaction energy is large enough. In other words, HP1-chromatin attraction promotes protein aggregation. This can be understood as follows: when HC is large enough, a significant number of HP1s become localised to the polymer and these tend to bind in the coating mode. Then, intermediate HP1-HP1 interactions are sufficient to allow extended chromatin-HP1-HP1-chromatin bridges to form. The BIA is therefore in effect, leading to chromatin compaction and protein clustering; we note that this is the only region of the phase diagram where the BIA is really in effect and a true BIPS is observed. When both HH and HC have intermediate values we observe an absorbing (BIPS) protein droplet and coating of the chromatin which emerges from the droplet [cross-hatch shaded region in Fig. 2(b)].
Varying protein density
We now consider the effect of the overall protein density for the multivalent HP1s. As expected, for large HH, we observed the same behaviour as a standard (Model-B) phase separation: increasing overall protein density leads to an increase in the size of the droplet, while the density of proteins within it remains constant. If HC is also large, the amount of absorbed chromatin grows with the size of the droplet (Supplementary Fig. S8 and see Supplementary Information, section 9). Interestingly, once the droplet is large enough to fully absorb the polymer, further increasing (and further increase of the droplet size) does not lead to a swelling of the polymer: the ratio continues to decrease with [Supplementary Fig. S8(e)].
A strikingly different behaviour is observed for intermediate HH (the region where where the BIA is in effect, i.e, where a droplet only forms due to the presence of the polymer). Figure 4(e) shows snapshots for and with different numbers of proteins. It is immediately clear that the density of proteins within the two phases varies with [also Fig. 4(f)]. This can be rationalised as follows. For small a protein droplet forms on the polymer via the BIA. This droplet is rather ‘loose’, and as increases, more space within the droplet becomes filled with proteins and the density (HD) increases. At the same time more polymer becomes absorbed and the droplet grows [ decreases, and the droplet diameter increases, Fig. 4(g) and Supplementary Fig. S9]. When all of the polymer is absorbed, and reaches a minimum; as and increase further the polymer can swell slightly. At some point the droplet density plateaus, and adding further proteins instead leads to an increase in the density of proteins outside the droplet (LD). The droplet still grows with , but more slowly than in a standard phase separation (where ); the fraction of proteins binding the polymer in the bridging mode decreases at the expense of the other two modes (Supplementary Fig. S9 and see Supplementary Information, section 9).
In summary, for the narrow range of parameters where phase separation only occurs in the presence of the polymer, we find the surprising result that the density of the phases (HD and LD) depends on the overall protein density [shaded band in Fig. 2(d)]. This has important implications for protein-chromatin interaction in vivo (see Discussion).
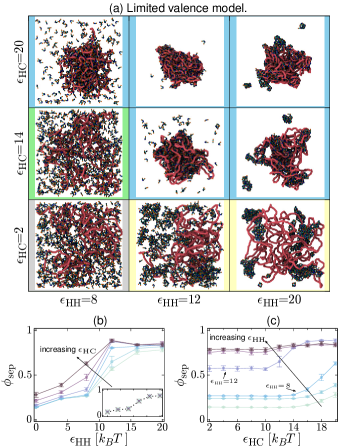
Model 2: Limited valence protein-protein interactions
In this model the HP1 dimer-dimer interactions have a limited valence, i.e., exactly one hinge domain can interact with exactly one NTE domain at a time. These HP1s behave like classic patchy particles, which have been studied extensively using both simulations (23, 24) and experiments (26, 27). Patchy particles have a rich phase diagram which includes a low-density equilibrium gel phase, and “closed loop” structures (where a set of particles form a structure where all patches are bound). Technically these different but co-existing equilibrium states are only present at zero temperature, but the structures can also exist as very long lived non-equilibrium metastable states for non-zero temperatures (25). In our simulations a gel phase is precluded since the system is confined. In the previous section we specifically considered equilibrium configurations; here we study the metastable states obtained when the system is quenched by instantaneously switching on both protein-protein and protein-chromatin interactions. Specifically, we start from an equilibrium configuration for , switch on interactions and run for (where is the simulation time unit); after this time the measured quantities (, sep, etc.) have stopped systematically varying. Steady state values of these quantities are then obtained by averaging over a further simulation.
Typical snapshots are shown in Fig. 5(a). Similar behaviour is observed as for the multivalent interaction model. At low HH we have the same mixed and coating regimes. For low HC, as HH increases, we go from the mixed phase to an aggregate phase. Unlike the multivalent model, here the aggregates are not spherical; instead multiple irregularly shaped clusters form. We also see small closed clusters of HP1s where all hinge and NTE domains are bonded When both HC and HH are large, many of the aggregates become associated with the polymer, which becomes compacted. Some smaller clusters remain detached from the polymer. Measurements of clusters and sub-clusters (see Supplementary Information) show that these have a fractal dimension less than 3, as would be expected in a gel. It is important to reiterate that these are long-lived metastable, dynamically arrested structures, and do not represent a true equilibrium of the system. Using a different quenching or annealing procedure with the same parameters leads to different relative abundances of the different types of aggregate (see Supplementary Information, section 11).
As before we measure the separation depth sep as a function of the two interaction energies. Figure 5(b) shows that the behaviour is again similar to the multivalent model in that sep increases with HH. However, the largest sep values are smaller than in the multivalent case, consistent with several protein aggregates of different size forming, rather than a single phase separated droplet. There is also a regime where proteins aggregate only when the interaction with the chromatin is strong enough, though it is less clear than for the multivalent model. Specifically, for there is a cluster only when HC is large, but sep only reaches intermediate values [Figs. 5(a) and (c)]. For , sep has an intermediate value just less than 0.6 for a broad range of HC values [Figs. 5(c)], behaviour which is not observed in the multivalent model. This arises because while clusters do form, there are many of them; they are also highly dynamic, continually forming, dissolving, merging and breaking apart (25).
We again measure the fraction of proteins bound in different modes [Supplementary Fig. S13], the fraction of polymer beads bound by proteins [Supplementary Fig. S14(a-b)], and the radius of gyration of the polymer [Supplementary Fig. S14(c-d)] as a function of the two interaction energies. The behaviour is broadly similar to the multivalent model, but the limited valence proteins are less able to compact the polymer, and the chromatin “looping out” (which was observed in the multivalent case when both energies were large) does not tend to occur here. Instead, most of the polymer is associated with the irregularly shaped cluster.
Protein dynamics
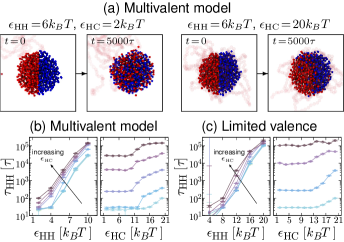
So far we have considered structural properties of the protein clusters for each of the two models. Here we consider protein dynamics. This is often studied in vivo using fluorescence recovery after photo-bleaching (FRAP) experiments: the time scale of fluorescence recovery of a protein droplet gives a measure of how quickly proteins are exchanged between the droplet and the soluble (unbleached) pool. The internal dynamics of a droplet can also be probed by photo-bleaching half of the droplet: tracking fluorescence in the bleached and un-bleached halves gives information on the relative time scales of mixing within the droplet and exchange with the soluble pool (35). A similar effect can be observed visually in simulations by colouring proteins according to which half of a droplet they are in, and then watching how the colours mix in time. Two examples for the multivalent proteins (Model 1) with different HC values are shown in Fig. 6(a). We observe that for small (where the droplet is not associated with chromatin) there is a high degree of mixing over the duration of the simulation. Interestingly, for larger (but the same value of ) where the chromatin is absorbed into the droplet, we find that the colours mix to a much lesser extent.
More quantitatively, we can measure how the proteins change their binding partners during a given time interval by defining a bond-bond correlation function
| (3) |
where has a value of if proteins and are interacting at time , and otherwise (proteins are said to interact if a hinge or NTE domain on protein is within the interaction range from a NTE or hinge on protein ). Angle brackets denote an average over time , repeat simulations, and all possible pairs of proteins. As detailed in Supplementary Information, the shapes of the curves suggest that there are multiple time scales involved in the decorrelation; it is nevertheless possible to extract a single overall decorrelation time, HH (the typical time for all proteins to change their binding partners, see Supplementary Information, section 12 and Supplementary Fig. S15 for details). In Figs. 6(b-c) we plot HH as a function of the different interaction energies, for the multivalent and limited valence models respectively. For the multivalent model [Fig. 6(b)], HH grows with the HP1-HP1 interaction energy roughly exponentially (roughly linear on the log-linear plot). The exception is where both HH and HC are small, where there is no droplet (proteins only interact transiently) and HH drops to zero almost instantaneously. More interestingly, as HC is increased there is a clear step change in HH where the system goes from the droplet to the absorbing droplet regime. In other words, consistent with the snapshots in Fig. 6(a), the presence of the chromatin within the droplet leads to a dramatic slow-down of protein dynamics (HH increases by almost an order of magnitude). As HC is further increased there again a roughly exponential dependence of HH on HC [linear increases for on the log-linear scale in the left panel of 6(b)]. While mapping between simulation and physical time units is not straightforward (see Supplementary Information, section 3), the time interval between the images in Fig. 6(a) is of the order 3-4 minutes [compare to the 30-50s time scale measured experimentally for HP1 recovery after photobleaching in Ref. (36), measuring exchange with the soluble pool].
The limited valence proteins [Fig. 6(c)] show similar behaviour. The decorrelation time HH again grows roughly exponentially with HH (though there is some deviation from this for large HC). The right-hand panel in Fig. 6(c) shows that again HH starts to increase with HC when the proteins start to interact with the polymer, at least for intermediate values of HH. There is not such a pronounced step-change as in the multivalent case, likely due to the presence of protein clusters which do not interact with the polymer. For larger HH, interaction with the polymer has a much smaller effect.
Discussion
In this paper we have studied the behaviour of simple model proteins interacting with a bead-and-spring polymer model for chromatin. We considered rigid bodies composed of spheres that represent different protein domains which interact attractively with each other or with chromatin. The domain structure was based on that of HP1, but our goal was to obtain insight on the interplay between protein-protein and protein-chromatin interactions in general.
HP1 has been shown to undergo liquid-liquid phase separation (LLPS) in vitro (17, 18). That result lead to the suggestion that LLPS could play a major role in formation of chromatin associated protein foci in vivo. Here, we also considered that many protein complexes bind chromatin multivalently, and so the bridging-induced attraction (BIA) can also play a role. Using a model with multivalent protein-protein interactions, we found that in the absence of protein-chromatin interactions, increasing the protein-protein interaction strength HH led to liquid droplet formation (Model B). Increasing protein-chromatin attractive interactions lead to a sharp crossover to a regime where the chromatin is absorbed into the droplet (with indications that there is a first-order phase transition in the thermodynamic limit). Importantly, the level of chromatin absorption depended on both interaction energies, and the number of proteins/size of the droplet. For most of the parameters studied, a significant fraction of the chromatin “looped out” from the droplet [the looping statistics of a similar situation have been studied in Ref. (37)]. This suggests that precise parameter tuning would be required for protein-protein attraction (LLPS) alone to mediate chromatin associated protein droplet formation and chromatin compaction/isolation in vivo. We would expect that chromatin regions with the correct histone modifications for protein binding act as droplet nucleation points. It would be interesting in the future to study the case where there were multiple such nucleation points (which are, e.g, kept spatially separated due to nuclear structure), or where these change in time (e.g., if histone modifications change dynamically as genes are activated).
An interesting regime in our multivalent protein simulations is for intermediate values of HH, where a droplet only forms if HC is large enough. In other words, phase separation is promoted by interaction with chromatin; this can be viewed as chromatin-HP1-HP1-chromatin bridges enabling the BIA to drive protein clustering. In this regime we also see a dependence on the overall protein density which is fundamentally different to standard Model B phase separation. The density of proteins within and outside the droplet depends on , and the droplet volume grows sub-linearly as increases. This behaviour originates from the formation of a “loose” protein cluster on the chromatin for small , which can “fill up” as proteins are added to the system; at larger , sites on the chromatin become saturated, so as more proteins are added these instead remain unbound (increasing the density in the protein poor region). This is reminiscent of recent work showing that varying the overall concentration of the nucleophosmin protein (a key component of nucleoli, which form via LLPS) leads to variation in its density both inside and outside the nucleolus; in that system there are multiple phase-separating components which leads to a complicated high-dimensional phase diagram (38).
Whether HP1 undergoes LLPS in vivo is still a topic of debate, and there are conflicting observations (35, 39). One recent study showed that over-expression of HP1 in mouse does not lead to an increase in the size of foci, but instead the protein density within the foci increases (35). While inconsistent with a classic phase separation mechanism, this observation is compatible with the intermediate HH (BIA) regime discussed above. The same work used FRAP experiments to show that mixing within HP1 droplets is slower than exchange with the soluble pool (35). Our simulations showed nearly an order of magnitude slow-down in protein dynamics when the chromatin is absorbed into the droplet. Due to the small system size, the rate of exchange between the droplet and pool is difficult to measure in our simulations; however, the time scales for exchange with the pool and internal mixing are likely similar. The concurrent slow internal mixing and fast exchange with the pool [of the order 10 s (36)] is therefore not reproduced in the simulations (though see below). Nevertheless, our results suggest that care should be taken when interpreting FRAP measurements of internal mixing: slow mixing may be due to the presence of chromatin, and does not necessarily preclude LLPS. Ref. (35) also showed that removal of the H3K9me3 histone modification leads to loss of HP1 co-localisation, but the heterochromatin foci remain intact (inconsistent with HP1 begin a driver of heterochromatin body formation). Other work (40) has suggested that while HP1 may not be necessary to compact large satellite repeat heterochromatin regions, it is required to compact and silence smaller H3K9me3 marked segments within otherwise active regions. The function of HP1 clearly still not well understood. Nevertheless, the simplicity of our model proteins means that our results are also likely to be relevant for other proteins or complexes. An example is the H1 linker histone, associated with chromatin compaction and gene repression, which has been shown to phase separate in the presence of DNA (41), and has multiple DNA binding sites as well as interacting with the core histones (42).
The limited valence model showed similar regimes to the multivalent case, but instead of a spherical droplet the proteins formed fractal clusters [similar to the structures formed by patchy particles (23, 24)]. The limited valence HP1s could also form a gel in simulations with a higher density and periodic boundaries (Supplementary Fig. S11). NMR spectroscopy experiments have shown that phosphorylated HP1 forms a gel in vitro if condensates are left for around seven days (43). A possible explanation for this is that first, weak multivalent interactions between the disordered domains drive LLPS (10), with gelation occurring on longer time scales as these rearrange or fold (44). This is consistent with our result that small changes to the nature of the protein-protein interactions can lead to large morphological differences in the resulting condensates (droplets vs. fractal clusters), and could be related to the observation that HP1 foci can have quite different properties in different cell types (45). There are also broader implications: LLPS and gelation have been associated with amyloid formation in neurodegenarative disease (46), and it is possible that formation of gels or fractal clusters of chromatin associated proteins may also be pathological. For example, small disease associated mutations in the protein MeCP2 (also associated with heterochromatin) were recently shown to prevent it from undergoing LLPS (47).
Finally, we note that our model proteins are “poor bridgers”, which tend to “coat” the chromatin (16). It would be interesting in the future to study the phase diagram of “good bridgers” (e.g. simple spheres). We have also shown previously that cluster formation via the BIA can be dramatically altered by non-equilibrium chemical reactions which stochastically switch the proteins back and forward between a binding and non-binding state [modelling post-translational modifications (14)]. Without switching, BIA clusters coarsen and merge until there is a single cluster. Switching arrests coarsening, leading to multiple small clusters where the constituent proteins exchange with the soluble pool at a rate determined by the switching rate. Active reactions have similarly been shown to arrest coarsening in LLPS (48). Such non-equilibrium processes could provide the cell with a means to control droplet formation and size which does not require precise parameter tuning, allowing fast exchange with a soluble pool but slow internal mixing. It would therefore be of interest in the future to study the interplay between the BIPS and LLPS in a non-equilibrium context.
Methods
In our simulations we model chromatin as a chain of beads, each of diameter nm, representing roughly 1kbp of DNA or 4-5 nucleosomes. The beads interact sterically with each other via a Weeks-Chandler-Anderson (WCA) potential, and they are connected via finitely-extensible non-linear elastic (FENE) springs; a Kratky-Porod potential provides bending rigidity. HP1 dimers are represented as a rigid body made up from 7 spheres of diameter . Steric interactions between HP1 spheres and between HP1 and chromatin beads are provided by a WCA potential. Attractive interactions between particular protein domains, and between protein and chromatin beads are provided by a potential with a functional form similar to the Morse potential. All components are confined in a cube of size 35. Full details of the HP1 geometry and all interaction potentials are given in Supplementary Information. We perform Langevin dynamics simulations using the LAMMPS molecular dynamics software (29). The dynamics are integrated using a velocity-Verlet algorithm with a time step of , where is a simulation time unit. All results are obtained by averaging of at least 4 simulations of at least . Further details are given in Supplementary Information.
We acknowledge support from European Research Council (CoG 648050, THREEDCELLPHYSICS).
References
- (1) B. Alberts, et al. Molecular Biology of the Cell, (Taylor & Francis2014).
- (2) Y. S. Mao, B. Zhang, and D. L. Spector. Biogenesis and function of nuclear bodies. Trends in Genetics 27, 295 (2011).
- (3) B. R. Sabari, et al. Coactivator condensation at super-enhancers links phase separation and gene control. Science 361 (2018).
- (4) S. Chong, et al. Imaging dynamic and selective low-complexity domain interactions that control gene transcription. Science 361 (2018).
- (5) F. Bantignies and G. Cavalli. Polycomb group proteins: repression in 3D. Trends in Genetics 27, 454 (2011).
- (6) J. M. Eeftens, M. Kapoor, and C. P. Brangwynne. Epigenetic memory as a time integral over prior history of Polycomb phase separation. bioRxiv p. 2020.08.19.254706 (2020).
- (7) A. Brero, et al. Methyl CpG-binding proteins induce large-scale chromatin reorganization during terminal differentiation. J Cell Biol. 169, 733 (2005).
- (8) A. V. Probst and G. Almouzni. Pericentric heterochromatin: dynamic organization during early development in mammals. Differentiation 76, 15 (2008).
- (9) C. Brangwynne, P. Tompa, and R. Pappu. Polymer physics of intracellular phase transitions. Nature Physics 11, 899 (2015).
- (10) E. W. Martin and A. S. Holehouse. Intrinsically disordered protein regions and phase separation: sequence determinants of assembly or lack thereof. Emerging Topics in Life Sciences 4, 307 (2020).
- (11) C. A. Brackley, et al. Nonspecific bridging-induced attraction drives clustering of DNA-binding proteins and genome organization. Proc. Natl. Acad. Sci. USA 110, E3605 (2013).
- (12) C. A. Brackley, et al. Simulated binding of transcription factors to active and inactive regions folds human chromosomes into loops, rosettes and topological domains. Nucleic Acids Res. 44, 3503 (2016).
- (13) J.-K. Ryu, et al. Bridging-induced phase separation induced by cohesin SMC protein complexes. Science Advances 7 (2021).
- (14) C. A. Brackley, et al. Ephemeral protein binding to DNA shapes stable nuclear bodies and chromatin domains. Biophys. J. 112, 1085 (2017).
- (15) M. Barbieri, et al. Complexity of chromatin folding is captured by the strings and binders switch model. Proceedings of the National Academy of Sciences 109, 16173 (2012).
- (16) C. A. Brackley. Polymer compaction and bridging-induced clustering of protein-inspired patchy particles. J. Phys. Condens. Matter 32, 314002 (2020).
- (17) A. G. Larson, et al. Liquid droplet formation by HP1 suggests a role for phase separation in heterochromatin. Nature 547, 236 (2017).
- (18) A. R. Strom, et al. Phase separation drives heterochromatin domain formation. Nature 547, 241 (2017).
- (19) J. C. Eissenberg and S. C. Elgin. The HP1 protein family: getting a grip on chromatin. Current Opinion in Genetics & Development 10, 204 (2000).
- (20) R. C. Allshire and H. D. Madhani. Ten principles of heterochromatin formation and function. Nature Reviews Molecular Cell Biology 19, 229 (2018).
- (21) S. Sanulli, J. D. Gross, and G. J. Narlikar. Biophysical Properties of HP1-Mediated Heterochromatin. Cold Spring Harbor Symposia on Quantitative Biology 84, 217 (2019).
- (22) D. Canzio, A. Larson, and G. J. Narlikar. Mechanisms of functional promiscuity by HP1 proteins. Trends in Cell Biology 24, 377 (2014).
- (23) P. Teixeira and J. Tavares. Phase behaviour of pure and mixed patchy colloids – Theory and simulation. Current Opinion in Colloid & Interface Science 30, 16 (2017).
- (24) E. Bianchi, et al. Theoretical and numerical study of the phase diagram of patchy colloids: Ordered and disordered patch arrangements. Journal of Chemical Physics 128, 144504 (2008).
- (25) E. Zaccarelli. Colloidal gels: equilibrium and non-equilibrium routes. Journal of Physics: Condensed Matter 19, 323101 (2007).
- (26) D. Fusco and P. Charbonneau. Crystallization of asymmetric patchy models for globular proteins in solution. Phys. Rev. E 88, 012721 (2013).
- (27) Z. Zhang and S. C. Glotzer. Self-Assembly of Patchy Particles. Nano Letters 4, 1407 (2004).
- (28) K. Sugase, H. J. Dyson, and P. E. Wright. Mechanism of coupled folding and binding of an intrinsically disordered protein. Nature 447, 1021 (2007).
- (29) S. Plimpton. Fast Parallel Algorithms for Short-Range Molecular Dynamics. J. Comp. Phys. 117, 1 (1995).
- (30) P. M. Chaikin and T. C. Lubensky. Principles of Condensed Matter Physics, (Cambridge University Press1995).
- (31) M. E. Cates and E. Tjhung. Theories of binary fluid mixtures: from phase-separation kinetics to active emulsions. Journal of Fluid Mechanics 836 (2018).
- (32) N. Vladimirova, A. Malagoli, and R. Mauri. Diffusion-driven phase separation of deeply quenched mixtures. Physical Review E 58, 7691 (1998).
- (33) S. Machida, et al. Structural Basis of Heterochromatin Formation by Human HP1. Molecular Cell 69, 385 (2018).
- (34) S. Watanabe, et al. Interactions of HP1 Bound to H3K9me3 Dinucleosome by Molecular Simulations and Biochemical Assays. Biophysical Journal 114, 2336 (2018).
- (35) F. Erdel, et al. Mouse Heterochromatin Adopts Digital Compaction States without Showing Hallmarks of HP1-Driven Liquid-Liquid Phase Separation. Molecular cell 78, 236 (2020).
- (36) K. P. Müller, et al. Multiscale analysis of dynamics and interactions of heterochromatin protein 1 by fluorescence fluctuation microscopy. Biophysical Journal 97, 2876 (2009).
- (37) C. P. Broedersz, et al. Condensation and localization of the partitioning protein ParB on the bacterial chromosome. Proceedings of the National Academy of Sciences 111, 8809 (2014).
- (38) J. A. Riback, et al. Composition-dependent thermodynamics of intracellular phase separation. Nature 581, 209 (2020).
- (39) M. M. Keenen, et al. HP1 proteins compact DNA into mechanically and positionally stable phase separated domains. eLife 10, e64563 (2021).
- (40) Y. Feng, et al. Simultaneous epigenetic perturbation and genome imaging reveal distinct roles of H3K9me3 in chromatin architecture and transcription. Genome Biology 21, 296 (2020).
- (41) A. Shakya, et al. Liquid-Liquid Phase Separation of Histone Proteins in Cells: Role in Chromatin Organization. Biophysical Journal 118, 753 (2020).
- (42) A. E. White, A. R. Hieb, and K. Luger. A quantitative investigation of linker histone interactions with nucleosomes and chromatin. Scientific Reports 6, 19122 (2016).
- (43) B. E. Ackermann and G. T. Debelouchina. Heterochromatin Protein HP1 Gelation Dynamics Revealed by Solid-State NMR Spectroscopy. Angewandte Chemie International Edition 58, 6300 (2019).
- (44) Y.-H. Lin, J. D. Forman-Kay, and H. S. Chan. Theories for Sequence-Dependent Phase Behaviors of Biomolecular Condensates. Biochemistry 57, 2499 (2018).
- (45) G. K. Dialynas, et al. Plasticity of HP1 proteins in mammalian cells. Journal of Cell Science 120, 3415 (2007).
- (46) L. Pytowski, et al. Liquid–liquid phase separation of type II diabetes-associated IAPP initiates hydrogelation and aggregation. Proceedings of the National Academy of Sciences 117, 12050 (2020).
- (47) C. H. Li, et al. MeCP2 links heterochromatin condensates and neurodevelopmental disease. Nature 586, 440 (2020).
- (48) D. Zwicker, A. A. Hyman, and F. Jülicher. Suppression of Ostwald ripening in active emulsions. Phys. Rev. E 92, 012317 (2015).