[d]Z. Bardačová {NoHyper} 11footnotetext: Deceased.
Methods for the suppression of background cascades produced along atmospheric muon tracks in the Baikal-GVD
Abstract
The Baikal-GVD (Gigaton Volume Detector) is a - scale neutrino telescope located in Lake Baikal. Currently (year 2021) the Baikal-GVD is composed of 2304 optical modules divided to 8 independent detection units, called clusters. Specific neutrino interactions can cause Cherenkov light topology, referred to as a cascade. However, cascade-like events originate from discrete stochastic energy losses along muon tracks. These cascades produce the most abundant background in searching for high-energy neutrino cascade events. Several methods have been developed, optimized, and tested to suppress background cascades.
1 Introduction
One of the main goals of the Baikal-GVD (Gigaton Volume Detector) is to investigate sources of astrophysical neutrinos in energy range from 1 TeV up to 100 PeV. The Baikal-GVD is currently under construction, located in the southern part of Lake Baikal 3-4 km from the shore [1].
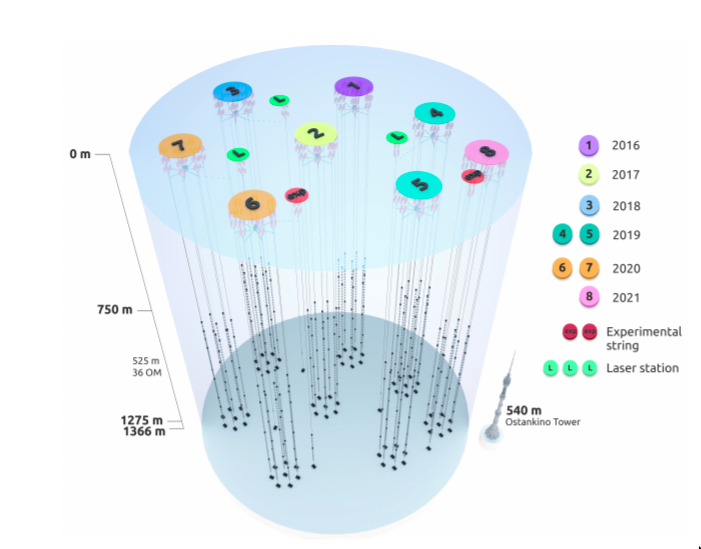
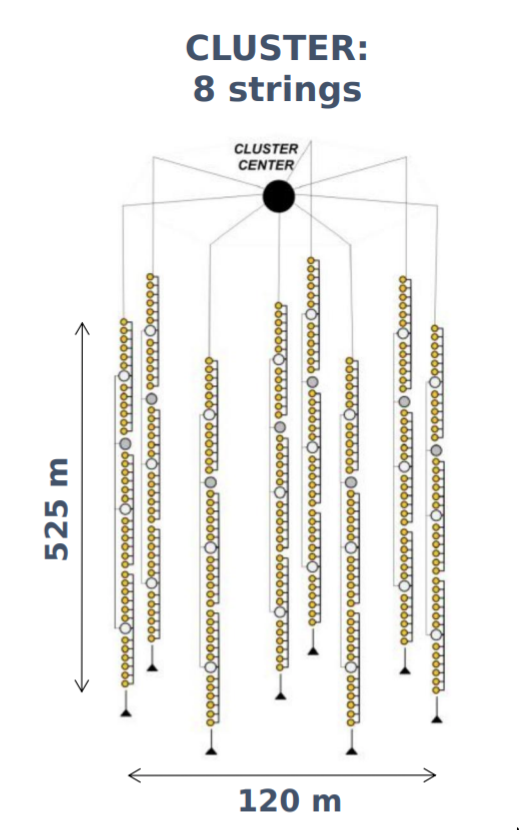
The detector is a three dimensional array of Optical Modules (OMs), which are able to detect Cherenkov light of secondary charged particles produced in neutrino interactions. The OMs are attached to the vertical strings at depths from 750 m to 1275 m. The whole detector is sub-arranged into functionally independent units, referred to as clusters (see Fig. 1). Each cluster comprises 288 OMs attached to 8 strings. The effective volume of one cluster for neutrino cascade events with energy above 100 TeV is [2]. At the current stage (year 2021), the Baikal-GVD is composed of 8 clusters, comprising 2304 OMs with a total effective volume 0.4 .
According to the Cherenkov light topology of the secondary charged particles, there are different types of neutrino events. Muons created by muon neutrino charged current interactions passing through the water leave behind a track. These muons can be both astrophysical or atmospheric origin. Moreover, atmospheric muons may also reach the Earth’s surface in a bundle. Charged-current interactions of electron neutrino and low-energy tau neutrino, neutral-current interactions of all three neutrino flavours create a light signature of a single cascade. The most energetic cosmic neutrino events were detected as cascades (in IceCube experiment [3]). However, the most abundant background present in the cascade channel originate from discrete stochastic energy losses produced along muon tracks (bremsstrahlung, photonuclear processes, direct electron-positron pair production).
In this paper, the optimised methods for the suppression of the background cascades that are produced along muon tracks are presented. Majority of these suppression methods are based on search of hits from the muon track in an event. Optimization of the suppression methods is performed with Monte Carlo (MC) simulations for season 2019. Subsequently, experimental data from season 2019, which corresponds to dataset used in this work in period between April 2019 and March 2020 were processed with cascade reconstruction software in parallel [4] and then analyzed. The presented analysis is performed only with single-cluster data.


2 Suppression Methods - Monte Carlo Samples
To distinguish between cascades induced in neutrino interactions and background cascades produced along muon tracks, different kinds of suppression methods have been developed, tested, and optimized. The performance of the methods to separate signal from background cascades using various MC datasets is described. Especially, their effect has been studied for atmospheric muon bundles sample (), upgoing atmospheric muon neutrinos () and atmospheric electron neutrinos (). Firstly, only well-reconstructed contained cascades have been used for the following analysis. A lower likelihood value of the event means to be a well-reconstructed cascade. A contained event has its position reconstructed within the instrumented detector volume.
In particular, the focus is put mainly on the suppression of background cascades from atmospheric muons, which constitute a major part of reconstructed cascades from experimental data, see Tab.1. The effective livetime of the experimental dataset for season 2019 is 1557 days (for all 5 clusters combined). The last row of the Tab.1 shows the ratio of the number of experimental well-reconstructed contained events to the number of events expected from MC simulation (using the same exposition time and reconstruction analysis). Their reconstructed zenith angle and energy distributions for season 2019 are shown in Fig. 2. Most of the downgoing events from the experimental data is compatible with the MC expectation. Below, the description of the suppression methods is presented.

| Season 2019 | Cluster1 | Cluster2 | Cluster3 | Cluster4 | Cluster5 |
| Exposition time [days] | 299.131 | 330.043 | 320.948 | 299.623 | 307.322 |
| No. Reconstructed Cascades [#] | 10574 | 11525 | 16420 | 17062 | 16211 |
| No. Contained+Well-Reco Cascades [#] | 3548 | 3843 | 5666 | 5510 | 5367 |
| MC Expectation [#] | 3403 | 3457 | 4641 | 4520 | 4004 |
| Normalization Factor | 1.043 | 1.111 | 1.221 | 1.219 | 1.341 |
nTrackHits Filter
The goal of the nTrackHits method is to count the number of hits originating from the muon (referred to as nTrackHits) and also to sum their charges (trackCharge). The track hit detection time on a given OM has to fulfill the condition:
| (1) |
where is an extra time window and is expected hit time of detection on the OM from the muon track, calculated according to equation:
| (2) |
where is the reconstructed cascade time, is the speed of light in vaccum (i.e. approximately equal to muon velocity), is the speed of light in water. See Fig. 3 (left) for the meaning of the other variables in Eq. 2. The nTrackHits is calculated in each muon direction given by iterative seaching over zenith and azimuth angle in the whole geometry. Position and time of the reconstructed cascade fix the track in a single point. The direction in which the most nTrackHits were found is selected for further analysis. Reconstructed cascade direction cannot be used for the track, because it can be biased by track hits incidentally used in the reconstruction. Fig. 3 (right) shows the distribution of nTrackHits for above-mentioned datasets. As we would expect, for the the highest numbers of nTrackHits were identified. For signal cascades from sample, with no muon track present in it, a few non-zero nTrackHits were falsely identified due to noise hits contamination. However, a cut on nTrackHits can provide separation between signal and background cascades.

BranchRatio Filter
The next applied selection criterion, called BranchRatio filter, is used to reduce primarily downgoing events. The BranchRatio is defined as the ratio of number of hit OMs that lie in the upper half-plane to the ones in the lower half-plane: . The plane intersection is determined by the coordinate of the reconstructed cascade and is perpendicular to vertical cluster strings. For better visualization of the calculation, the dependence of hit detection time on the coordinate of the OM, which detected the hit for the MC downgoing event is given in Fig. 4 (left). Various colors of points are associated with different hits origins. Fig. 4 (left) shows that most of the hits are located in the lower half-plane, therefore, for downgoing event is assumed to take values lower than 1. The distributions are displayed in Fig. 4 (right). For signal cascades, the higher values of BR are obtained. The reason is that upgoing events are also present in the sample in contrast to events.

CloseHits and QEarly Filter
The CloseHits filter controls how many of the 15 closest OMs w.r.t to the final reconstructed cascade position are hit. For cascade-like events, which follow almost spherical light pattern, 15 nCloseHits are expected to achieve, see Fig. 5 (right). However, as the intensity of light decreases with the distance from the reconstructed cascade position and also some of the OMs do not have to be in operation, then the cascade does not enlighten all the 15 pinpointed OMs.
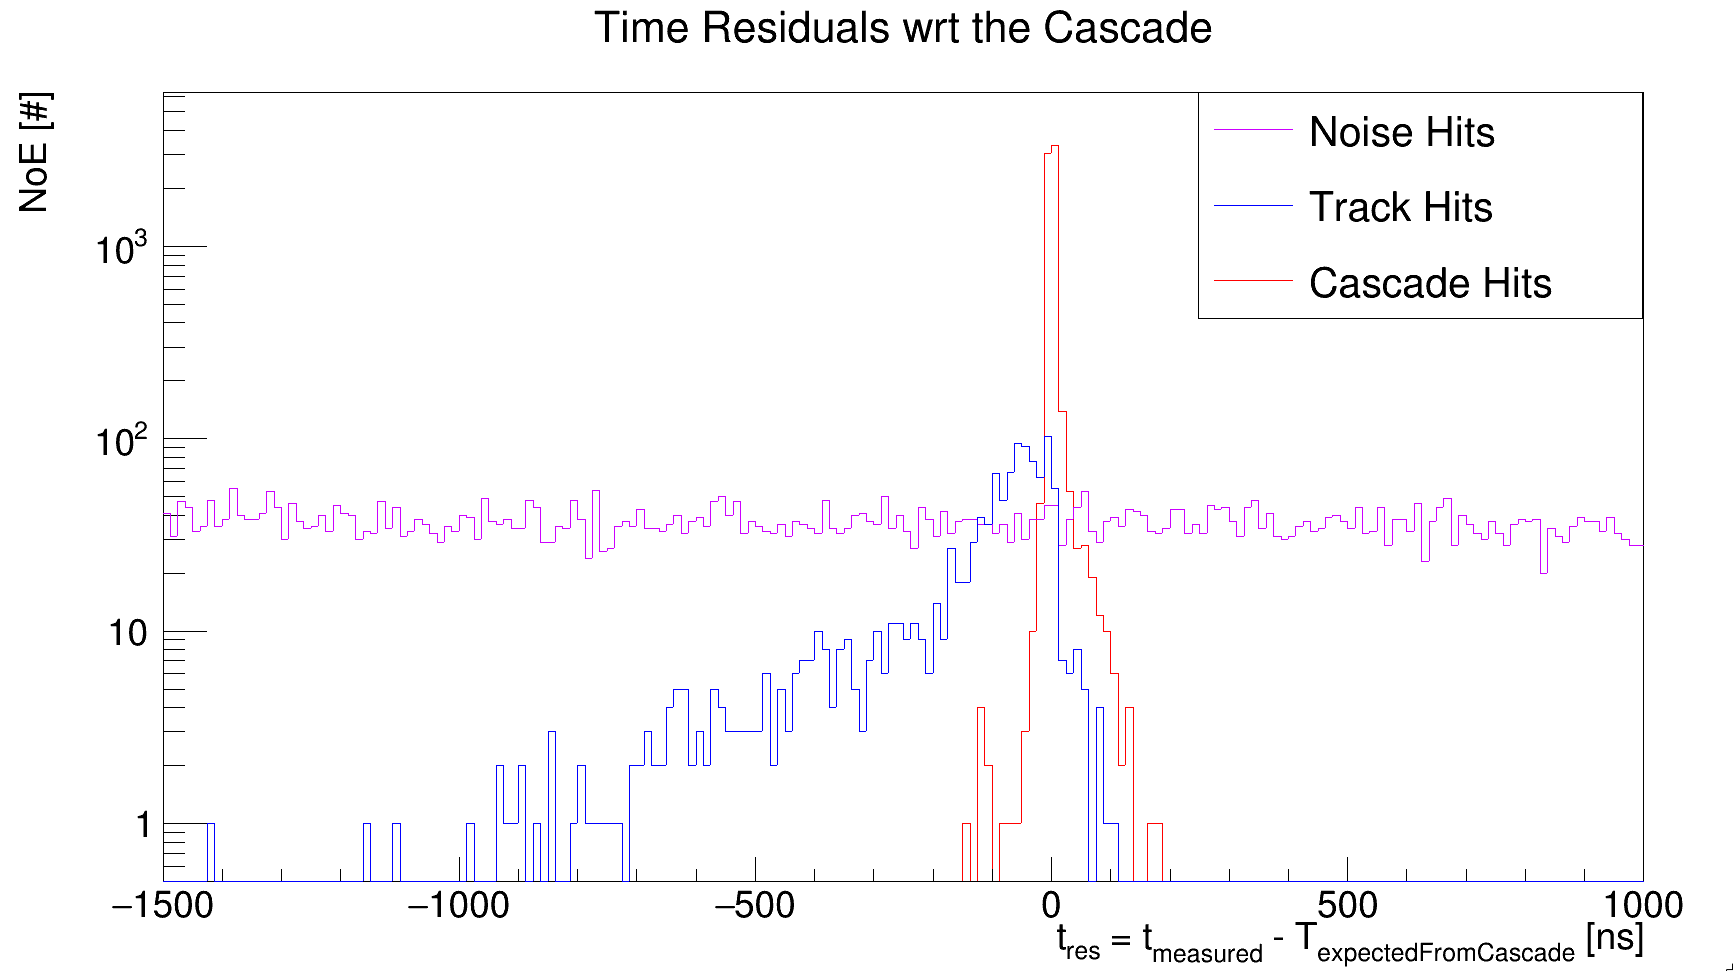
The final filter, called QEarly, is inspired by ANTARES [5]. When background cascade is produced along the muon track, hits coming from the muon are mostly detected earlier at a given OM than it is expected for cascade hits. Fig. 4 shows some track hits (blue points) are located before the expected time region for cascade hits (green band). For that reason, QEarly variable is calculated according to the following expression: , where qEarly is the charge summed over all hits with a time residual w.r.t. the reconstructed cascade: and qRecoHits corresponds to the charge summed over expected time for cascade hits (green band): i.e. , see Fig. 6. As shown in Fig. 5 (left), muon-like events are slightly shifted to higher values of the charge qEarly produced by track hits present in events.


3 Boosted Decision Tree and Results
Any of the developed variables does not give a clear distinction between signal and background cascades. Therefore, to take the most of the discriminating power of many variables, Boosted Decision Trees (BDTs) (from TMVA ROOT package) were used in the analysis. The BDTs were trained using the 7 variables as input: nTrackHits, trackCharge, nCloseHits, BranchRatio, QEarly, Z reconstructed cascade coordinate and after final position reconstruction. For BDT training and testing of contained well-reconstructed cascades, we used 3000 and 1000 MC signal cascades, respectively. In case of sample, almost 6500 and 1900 background cascades were used. After training and testing, a ranking of input variables is computed. The most important input to the BDTs is a coordinate of the event. The second most important variable for training is QEarly and then BranchRatio. After the BDTs are trained and tested , a BDT response for the classification of signal and background event is produced. Fig. 7 (left) shows the distribution of the BDT output value for MC signal and background cascades. Good agreement of the BDT response for MC events and experimental data from season 2019 is seen in Fig. 7 (right). We also applied the same procedure for uncontained events (horizontal distance of the reconstructed vertex is in interval from the cluster center).

Subsequently, to suppress background cascades, a cut on the BDT value is applied. For signal to background ratio: 1:1000, the maximum significance is obtained when cutting the BDT value at 0.29. A different BDT cut was determined for uncontained events. Once the BDT cut is applied, 25 contained and uncontained events remained. However, most of the reconstructed events have low energies () except two events. Both of them are reconstructed as upgoing with energies TeV for contained event and TeV for uncontained, see Tab. 2. The likelihood-direction scan for these two events is displayed in Fig. 8.

| Cl | [TeV] | [] | [] | [m] | L | Q [p.e.] | nHits | nRecoHits | nTrackHits |
|---|---|---|---|---|---|---|---|---|---|
| 0 | 79.7 | 71.30 | 4.96 | 47.65 | 1.05 | 1665.01 | 106 | 49 | 0 |
| 4 | 46.6 | 43.11 | 247.31 | 61.55 | 1.25 | 3804.82 | 69 | 23 | 0 |
4 Conclusion
We have developed and optimized several suppression methods for background cascades produced along the muon tracks. Most of the methods try to find hits from the muon track in the event. These suppression methods are optimized with Monte Carlo (MC) simulations for season 2019. Subsequently, experimental data from season 2019 were processed and analyzed. A total of 25 contained and uncontained events fulfill the BDT cut condition to be the potential candidates for neutrino cascade events. Among these events, two were reconstructed with high energies, 79.7 TeV for one contained event and 46.6 TeV for the uncontained.
5 Acknowledgements
The work was partially supported by RFBR grant 20-02-00400. The CTU group acknowledges the support by European Regional Development Fund-Project No. CZ.02.1.01/0.0/0.0/16_019/0000766. The CU group acknowledges the support by the VEGA Grant Agency of the Slovak Republic under Contract No. 1/0607/20 and support by the Grants of Comenius University in Bratislava, Slovakia UK/231/2021. We also acknowledge the technical support of JINR staff for the computing facilities (JINR cloud).
References
- [1] https://baikalgvd.jinr.ru/
- [2] Baikal-GVD Collaboration: A.D. Avrorin et al., Search for cascade events with BaikalGVD, PoS-ICRC2019-0873, arXiv:1908.05430, doi:10.22323/1.358.0873
- [3] IceCube Collaboration: M. G. Aartsen et al., Atmospheric and astrophysical neutrinos above 1 TeV interacting in IceCube. Physical Review D 91, 022001 (2015), doi: 10.1103/PhysRevD.91.022001
- [4] O. Tange, GNU Parallel - The Command-Line Power Tool, The USENIX Magazine (2011), doi: 10.5281/zenodo.16303
- [5] ANTARES Collaboration: A. Albert et al., An algorithm for the reconstruction of neutrino-induced showers in the ANTARES neutrino telescope, arXiv:1708.03649 [astro-ph.IM], doi:10.3847/1538-3881/aa9709