SOFIA-upGREAT imaging spectroscopy of the [C ii] 158 m fine structure
line
of the Sgr B region in the Galactic center
Abstract
We report SOFIA-upGREAT spectroscopic imaging of the [C ii] 158 m spectral line, as well as a number of [O i] 63 m spectra, across a pc field toward the Sgr B region in our Galactic center. The fully-sampled and velocity-resolved [C ii] images have 0.55 pc spatial and 1 km s-1 velocity resolutions.
We find that Sgr B extends as a coherent structure spanning some 34 pc along the Galactic plane. Bright [C ii] emission encompasses Sgr B1 (G0.5–0.0), the G 0.6–0.0 H ii region, and passes behind and beyond the luminous star forming cores toward Sgr B2 (G0.7–0.0). Sgr B is a major contributor to the entire Galactic center’s [C ii] luminosity, with surface brightness comparable to [C ii] from the Arches region.
[C ii], 70 m, and 20 cm emission share nearly identical spatial distributions. Combined with the lack of [C ii] self-absorption, this indicates that these probes trace UV on the near surfaces of more extended clouds visible in CO isotopologues and 160 m continuum. Stars from regions of local star formation likely dominate the UV field. Photodissociation regions and H ii regions contribute similar amounts of [C ii] flux.
The extreme star formation cores of Sgr B2 contribute negligible amounts to the total [C ii] intensity from the Sgr B region. Velocity fields and association with a narrow dust lane indicate that they may have been produced in a local cloud-cloud collision. The cores are likely local analogs of the intense star formation regions where ideas to explain the “C+ deficit” in ultra-luminous galaxies can be tested.
1 Introduction
We present spectrally resolved imaging of the [C ii] 158 m spectral line from the luminous Sgr B region in our Galactic center. Understanding the distribution of [C ii] intensity and its relationship with star formation in galactic nuclei is important for understanding our galaxy, as well as for interpreting observations of galaxies throughout the universe. Velocity-resolved spectroscopy allows separation of different physical components and investigation of dynamical and physical states of the interstellar medium, and structural localization at the sub-beam level.
The [C ii] fine structure line from singly-ionized carbon is a powerful probe of the interstellar medium. A major cooling line, it is often the brightest spectral indicator of star formation within our Galaxy and in others (e.g., Crawford et al., 1985; Stacey et al., 1991; Boselli et al., 2002; De Looze et al., 2014; Pineda et al., 2014; Herrera-Camus et al., 2015, and references therein). Even at energies below the hydrogen ionization edge, soft ultraviolet radiation ionizes atomic carbon in a range of environments: neutral diffuse material, the warm ionized interstellar medium, and warm and dense molecular gas. Collisions with electrons, atomic hydrogen, and molecular hydrogen populate the transition’s upper level. Photochemistry models (e.g., Tielens & Hollenbach 1985; van Dishoeck & Black 1988; Wolfire et al. 1990; Sternberg & Dalgarno 1995; Kaufman et al. 1999) support interpretation of line intensities as functions of physical conditions. Extreme conditions in ultra-luminous galactic nuclei (ULIRGs) suppress [C ii] emission, however (Fischer et al. 1999 and references therein).
Sgr B is one of the most luminous regions within the Galaxy’s Central Molecular Zone (CMZ), a region of particularly dense, warm, and turbulent molecular clouds in the inner few hundred parsecs of the Galaxy (reviews by Güsten 1989 and Morris & Serabyn 1996 contain overviews of the CMZ and its basic properties; Mills 2017 provides recent updates). Sgr B contains extended emission regions and high-density stellar clusters embedded in dense envelopes, making it an excellent model for close examination of star formation within galactic nuclei. Its proximity (we use 8 kpc; Reid et al. 2014 find the distance to Sgr B2 is 7.9 kpc, and Sgr B2 appears to be in front of the main Sgr B cloud) allows detailed studies at many wavelengths. The Sgr B region and some of its components were first studied in single-dish radio continuum mapping of the Galactic center (Kapitzky & Dent, 1974; Mezger & Smith, 1976; Downes et al., 1980). These observations identified three main sources: G 0.5–0.0 (Sgr B1), a bright peak G 0.6–0.0, and a yet brighter region G 0.7–0.0 (Sgr B2). The designations were based simply on radio continuum brightness peaks, and did not necessarily identify physically isolated or connected regions. Subsequent observations at higher spatial resolutions showed that the individual sources contain multiple components. Interferometric radio continuum imaging (Mehringer et al., 1992; Lang et al., 2010) showed arcs and bars of emission across Sgr B1, compact sources in G 0.6–0.0, and very bright compact cores within Sgr B2. In this paper we associate the G 0.6–0.0 and Sgr B1 regions with extended [C ii]-bright emission that surrounds those sources and extends further to positive latitude, since these all appear to be parts of the same general structure, while the Sgr B2 cores Sgr B2(M) and (N), and perhaps (S), seem to be quite distinct foreground objects.
While the brightest material surrounding the dense young stellar clusters in Sgr B2’s cores have been of great interest for many years, the larger region encompassing Sgr B2, Sgr B1, G 0.6–0.0, and their diffuse envelope emission, has received much less attention. Goicoechea et al. (2004) identified extended far-IR fine structure line emission around Sgr B1 and Sgr B2 in their ISO satellite cross-cuts of the region with the LWS grating spectrometer. Simpson et al. (2018) and Simpson et al. (2021) imaged the Sgr B1 region in mid-and far-IR lines to investigate conditions in the ionized and neutral material. Santa-Maria et al. (2021) used the Herschel-SPIRE FTS to make a broad spectral survey of the region around the luminous Sgr B2 star formation cores. None of these observations had sufficient spectral resolution to separate components within the beams by velocity, however.
Single pointings toward the most luminous core, Sgr B2(M), found [C ii] and [O i] 63 m absorption from material from the Galactic plane in ISO LWS Fabry-Perot observations (Goicoechea et al., 2004), and Herschel-HIFI made high spectral resolution observations in a much smaller beam as part of the HEXOS key project that showed absorption near the center of the emission line (Bergin et al., 2010; Möller et al., 2021). Langer et al. (2017) observed [C ii] emission in strip maps toward the edge of the CMZ with Herschel-HIFI. While their observations had the high spectral resolution needed to identify different physical components, their strips close to Sgr B did not cross any of its main clouds.
Here we report full two-dimensional spectroscopic imaging of the Sgr B complex with 0.55 pc and 1 km s-1 resolutions. Section 2 describes our observations, Sec. 3 is a summary of the main results, and Sec. 4 discusses implications for the Galactic center and interpretation of observations of external galaxies.
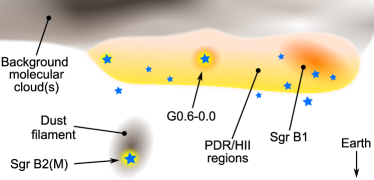
To set a preliminary framework for discussion, Fig. 1 is a sketch of the physical structure of the region. We explore our logic for reaching this view in Sec. 4.3, but in brief: [C ii] velocities and its spatial distribution indicate that the Sgr B region is a coherent structure that physically incorporates Sgr B1 and G 0.6–0.0, then continues past the Galactic latitude of the Sgr B2 cores. The bright Sgr B2 star formation cores appear to be associated with the dark dust lane that crosses in front (closer to Earth) of the main Sgr B cloud, which may or may not be physically connected to the main [C ii]-emitting region. Lack of [C ii] self-absorption across the Sgr B body places the [C ii] and [O i] at or close to the surface of a larger background (further from Earth) cloud or clouds visible in molecular and long-wavelength dust emission. Loosely-distributed stars in and near the surface provide UV photons to ionize, excite, and heat the gas and dust in the surface layer.
Sec. 5 provides brief summaries of our main findings.
Far-infrared observations have ties to both infrared and radio conventions, so we quote intensities in units either energy-based (e.g., ) or velocity-integrated brightness temperatures (e.g., [K km s-1]) depending on context. The two are related by
| (1) |
through the Rayleigh-Jeans expansion that defines brightness temperature from specific intensity , and the Doppler relationship between frequency and velocity.
2 Observations
Our results are part of our larger [C ii] spectral data cube (Güsten et al., 2021) of the Central Molecular Zone. Our larger cube covers in longitude and in latitude. The map center for this entire CMZ project was , . Data presented here were obtained during two observing campaigns flying from New Zealand in 2017 June and July and 2018 June, yielding the most positive Galactic longitude () “tiles” that formed the basic structure of the imaging project. Each tile covered arcseconds. Together, these tiles covered an area by centered at , .
Each tile was mapped in total power on-the-fly mode in rotated Right Ascension-Declination frames corresponding to Galactic coordinates. Individual integrations were recorded every 0.3 sec, with spacing of 7′′ along the scan direction; final images were convolved to 15′′ FWHM Gaussian beams on a 6.9′′ rectangular grid. The rms pointing accuracy was 2′′. Tile offset positions allowed for one row (column) of overlap between neighboring tiles. Each tile was observed in orthogonal directions to reduce striping and residual scanning structure. We used two reference “off” positions: a relatively nearby position with some expected line contamination during mapping (, ), and a distant field far from the Galactic plane (, ) to measure and correct the contamination in the closer “off” position.
We observed the 1.901 THz (157.74 m) [C ii] and the 4.748 THz (63.18 m) [O i] fine structure transitions with the upgraded German Receiver for Astronomy at Terahertz Frequencies (upGREAT111upGREAT is a development by the Max-Planck-Institut für Radioastronomie and the I. Physikalisches Institut of the Universität zu Köln, in cooperation with the DLR Institut für Optische Sensorsysteme.) (Risacher et al., 2018) on the Stratospheric Observatory For Infrared Astronomy (SOFIA, Young et al. 2012). Rapid imaging of [C ii], with auxiliary data in [O i] (the observing strategy was geared to the brighter [C ii] line), was possible with upGREAT’s dual frequency focal plane array configured for parallel observations with both the low frequency arrays (LFA) and high frequency array (HFA). Main beam sizes were 14.1′′ for the LFA, and 6.3′′ for the HFA. Both arrays use niobium nitride hot electron bolometer mixers, pumped with either a solid-state source (LFA) or quantum cascade laser (HFA) local oscillator. The LFA has seven dual-polarized pixels in a hexagonal arrangement with 31.8′′ radial spacing around a central pixel. The HFA has the same symmetry, centered on the LFA’s central pixel, with single-polarized pixels on 13.8′′ radial spacing. Fast Fourier Transform Spectrometers (FFTS4G, updated from Klein et al. 2012) produced spectra across the 0-4 GHz intermediate frequency bands, with 32k channels binned for 1 km s-1 velocity resolution.
Raw data were amplitude calibrated with the software package (versions 2017.08 and 2018.07) following Guan et al. (2012). Line temperatures are on a scale, with estimated absolute uncertainty below 20%. Small but repeatable receiver instabilities produced spectral baseline structure that we removed using a family of baseline structures derived from differences between nearby “off” spectra (Higgins, 2011; Kester et al., 2014; Higgins et al., 2021). This method retains information in broad lines and is superior to partly subjective low-order polynomial fits. Further processing used the GILDAS packages CLASS and GREG.
3 Results
3.1 [C ii] emission from the main body of the Sgr B cloud
| Pos. | ||||||||||
|---|---|---|---|---|---|---|---|---|---|---|
| [deg] | [deg] | [K] | [ km s-1] | [ km s-1] | [K km s-1] | [K] | [ km s-1] | [ km s-1] | [K km s-1] | |
| A | 0.483 | -0.057 | ||||||||
| B | 0.507 | -0.033 | — | — | — | — | ||||
| C | 0.549 | -0.054 | — | — | — | — | ||||
| D | 0.599 | -0.047 | ||||||||
| E | 0.606 | -0.067 | ||||||||
| F | 0.629 | -0.068 | ||||||||
| G | 0.652 | -0.043 | ||||||||
| H | 0.657 | -0.036 | ||||||||
| I | 0.665 | -0.023 | ||||||||
| J | 0.666 | -0.034 | ||||||||
| K | 0.666 | -0.058 | ||||||||
| L | 0.674 | -0.065 | — | — | — | — | ||||
| M | 0.683 | -0.034 | ||||||||
| N | 0.640 | -0.092 |
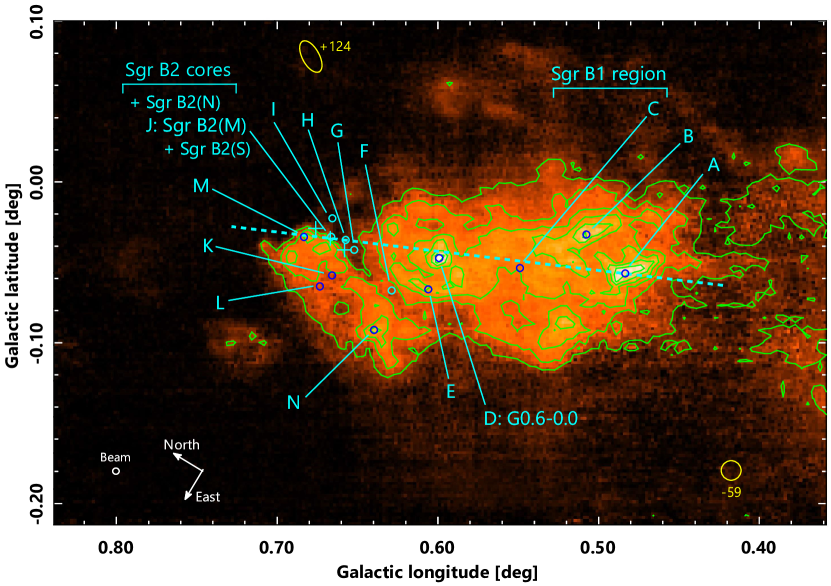
Figures 2 and 3 provide overviews of the spatial and spectral characteristics of [C ii] emission toward the Sgr B region. Spatial and velocity continuity in [C ii] indicate that the Sgr B1 and the G 0.6–0.0 H ii region are part of a larger structure that extends to positive Galactic longitude () to behind and beyond Sgr B2. As seen in [C ii], the distinction between these different regions appears to be rooted in the resolution of historical single-dish continuum surveys (Mezger & Smith, 1976, e.g.), rather than the separation of physically disconnected structures.
Figure 2 is an image of [C ii] 158 m line intensity in K km s-1 integrated over to km s-1. For a characteristic distance of 8 kpc to the main Sgr B cloud, the Sgr B [C ii] region stretches approximately 34 pc along Galactic longitude , and 15 pc in latitude . The bright emission contained within the 175 K km s-1 (lowest) contour around the main body, encompasses 465 pc2.
All of the main [C ii] emission peaks are associated with bright radio continuum emission, although the converse is not always true. The brightest [C ii] regions, marked by circles A and B, are within the radio continuum sources named the “ionized rim” and “ionized bar,” respectively, by Mehringer et al. (1992). The peak at (region D) is the G 0.6–0.0 H ii region, with its associated bright arc visible below (region E is in the arc). Crosses in the figure indicate the locations of the luminous compact star forming cores Sgr B2(N), Sgr B2(M) (region J), and Sgr B2(S). As we discuss in Sec. 4.4, none of the cores emit detectable [C ii] emission.
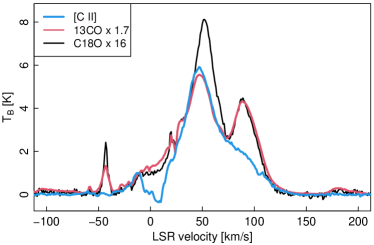
Figure 3 compares the [C ii], 13CO, and C18O (Riquelme et al., 2022) spectra averaged over the main body of the Sgr B cloud indicated by the 175 K km s-1 contour at the center of Fig. 2. The [C ii] line peaks near km s-1, with emission from about to km s-1. There appear to be two main components, and a two-component Gaussian fit gives good estimates of these, separating emission into a main component centered at km s-1, with K peak temperature and km s-1 width; and another at km s-1, with K peak and km s-1 width. Absorption from the Galactic plane blocks [C ii] emission around 0 km s-1, masking a likely wing to lower velocity. The 50 km s-1 component is associated molecular and ionized gas (Riquelme et al., 2022; Mehringer et al., 1992), and contains 69% of the total [C ii] flux in this decomposition. The subsidiary peak at near km s-1 is considerably more prominent in extended CO emission than in [C ii].
Overall agreement between [C ii], 13CO, and C18O velocity structures near km s-1 indicates that [C ii] and molecular emission are associated to a large degree. All of these lines, as well as the H 110 radio recombination line (Mehringer et al., 1992), peak close to km s-1, indicating that the [C ii] emission is associated with the main column of molecular gas and its ionized surface. Comparison of the CO lines suggests that the line shapes are dominated by large-scale motions, and that these lines are not very optically thick on average.
The km s-1 [C ii] emission is present across much of the image. It is likely associated with extended, moderately excited, molecular material previously identified by Vogel et al. (1987) toward Sgr B2. Excitation and velocity suggest that the emission is generally associated with the Galactic center rather than the Galactic disk. APEX CO and isotopologue data cubes show an emission component around km s-1 that stretches across the entire CMZ.
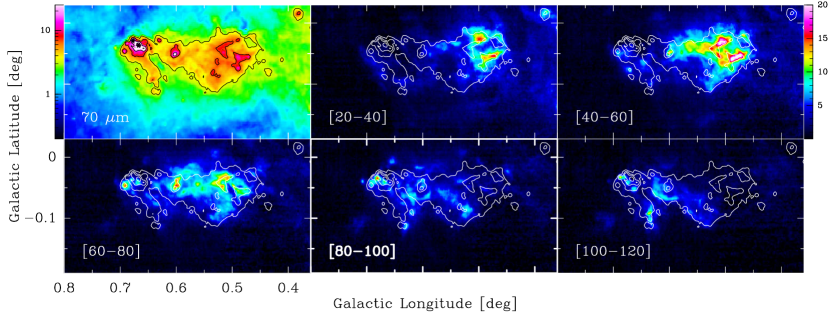
Figures 4 and 5 show that the velocity field across the bright body of Sgr B has overall coherence in a smooth increase in velocity with increasing Galactic longitude, along with a great deal of fine structure. Linewidths of 30 to above 50 km s-1 are common across the region in individual 0.55 pc beams, indicating that the [C ii]-emitting material shares in the broad linewidths typical for the Galactic center’s dynamic molecular clouds.
Figure 4 is a set of velocity channel maps in 20 km s-1 bins, with the 70 m continuum image and contours for comparison. The km s-1 [C ii] component is brightest toward Sgr B1’s radio continuum and 70 m peaks (Mehringer et al., 1992; Lang et al., 2010; Molinari et al., 2016), with additional lower-level emission around this velocity across the entire [C ii]-bright region. The channel maps also show a very wide linewidth in the emission arc wrapping around G 0.6–0.0 to negative latitude (). The arc is visible at a variety of wavelengths, and may be material swept up and compressed by winds from G 0.6–0.0’s central luminosity sources. In addition to extended km s-1 emission, km s-1 [C ii] is also bright along a North-South band of wide linewidth emission near the G 0.6–0.0 H ii region at .
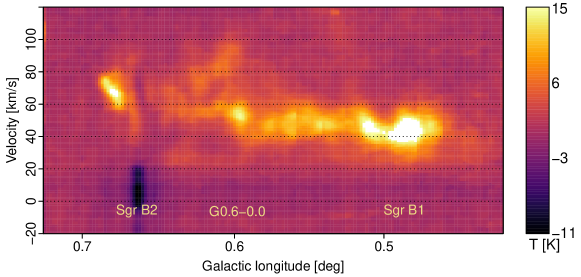
Overall velocity trends are clear in Figure 5, a position-velocity diagram along a line cut through a bright [C ii] peak (region A), and through and beyond Sgr B2(M) (region J). The mean velocity of the main component of [C ii] emission across the entire Sgr B body follows a smooth trajectory in the sense of Galactic rotation, velocity increasing with . Lineshapes broaden and become more complex at G 0.6–0.0 and beyond. Bright 158 m continuum associated with a North-South dust lane and perhaps the Sgr B2 cores at causes strong absorption from material in the Galactic plane at km s-1. A faint streamer stretching in velocity from to over 110 km s-1 from to in Fig. 5 is from line wings with velocities above 100 km s-1 visible in spectra between Sgr B1 and G 0.6–0.0.
Overall velocity trends are clear, but the velocity field is complex in detail. Figure 6 explores the complexity by comparing lineshapes from 15′′ diameter samples across Sgr B, with locations keyed to the letters in Fig. 2. Our convention is to set baselines to zero brightness, so line absorption against continuum appears as negative-going structure. Double Gaussian component fits to the lineshapes provide good representative summaries of the main emission; fit parameters are in Table 1.
Sgr B’s most intense emission, in regions marked A and B, is associated with the bright Sgr B1 “rim” and “arc” radio continuum regions near . Their [C ii] velocities of 44 and 47 km s-1 agree well with H 110 recombination line velocities (Mehringer et al., 1992). Position A’s linewidths are 49 and 20 km s-1, but B is better fit by a single 33 km s-1 FWHM component. Both peaks A and B have correspondence in 70 m continuum structures, but none in 160 m.
Continuing to positive longitude, a spectrum sampling the body of the cloud at position C has a 32 km s-1 FWHM component at 53 km s-1. The main [C ii] line component from the G 0.6–0.0 H ii region at position D has a center velocity of 50 km s-1 and width 33 km s-1 FWHM, with a distinct second component at the substantially higher velocity of 84 km s-1, with 57 km s-1 FWHM. As is typical for all but the Sgr B2 cores, [C ii] and C18O lineshapes share similarities, indicating that the spectrum identifies two separate structures rather than a single broad line with foreground absorption at an intermediate velocity. G 0.6–0.0 has what appears to be a partial shell, appearing as an arc toward negative latitude; the spectrum at position E is representative along the arc, with a 26 km s-1 FWHM peak near 80 km s-1 matching the component in G 0.6–0.0 itself, and a very broad (93 km s-1 FWHM) wing to lower velocity, centered at 62 km s-1.
Regions F through I sample emission along the dust lane that crosses most of Sgr B’s body. The Sgr B2(M), (N), and (S) cores are all close to the (eastern) side of this high column density dust structure that matches the size and shape of the [C ii]-dark notch and [C ii]-dim stripe visible in Fig. 2. As we discuss in Sec. 4.1, this approximately North-South strip is a clear feature in infrared continuum images, becoming increasingly darker and longer from 70 m to 8 m wavelengths. At 160 m, which is representative of continuum underlying the 158 m [C ii] line, the lane is bright at its northern end, encompassing regions G-J and N, with peaks at the Sgr B2 cores, fading in brightness to the south before dropping to the typical cloud brightness level just beyond region F. All [C ii] spectra along this [C ii]-dim and IR-dark lane have similar lineshapes dominated by a 65 to 70 km s-1 FWHM component centered near 67 km s-1. All but the southernmost position F have sufficient 158 m continuum to cause absorption from about 0 to 20 km s-1 in the Galactic plane. [C ii] emission’s lineshape similarity and run of peak line brightness with dust column density suggest that the spectra originate in a generally cool dust lane that may be optically thick to [C ii] from emission behind it. It appears that the material producing the notch and dark lane are between us and the continuous body of Sgr B otherwise highlighted in [C ii].
The most dramatic spectrum is at position J, coincident with the maximum absorption toward Sgr B2(M) and the peak of 1.3 mm continuum measured by ALMA (Sánchez-Monge et al., 2017). Ignoring Galactic plane absorption from to 20 km s-1 visible against Sgr B2(M)’s intense continuum, emission in this spectrum is best represented as a 66 km s-1 FWHM line centered at 68 km s-1, with a 37 km s-1 FWHM absorption to approximately zero brightness centered at 70 km s-1. We discuss this feature and its implications in detail in Secs. 4.3 and 4.4. While [C ii] absorption from the Galactic plane is strongest against Sgr B2(M), and is slightly enhanced by increased 158 m continuum toward Sgr B2(N) and (S), it extends along the entire 160 m-bright (and [C ii]-faint) North-South strip visible in Fig. 2. With the exception of the 70 km s-1 absorption notch, the emission lineshape toward J is very similar to surrounding positions including I, which is in the darkest part of the dark lane at shorter wavelengths, and brightest at 160 m.
Velocity components near 70 and 50 km s-1 are present throughout the regions near Sgr B2(M) and to larger longitudes (see also Fig. 4). The bright spot at position M, near Sgr B2(M), has both 19 and 66 km s-1 FWHM lines centered at 67 km s-1. Further to , region K has components centered at both 44 and 76 km s-1, and region L peaks at 45 km s-1. Sampling to , the bright region K has two velocity peaks, one at 76 km s-1 with 60 km s-1 FWHM, and the other at 44 km s-1 with 34 km s-1 FWHM. The run of nearby spectra shows that these are separate emission peaks, and not the residuals from absorption against a broader line at intermediate velocity. As with other [C ii] peaks, this region is close to a local peak of 20 cm (Lang et al., 2010) and 70 m continua, but has no 160 m (Molinari et al., 2016) enhancement.
3.2 Additional [C ii] components
The [C ii] data cube reveals a number of isolated clouds at velocities other than those that are typical for Sgr B’s body. The most prominent are:
A distinct 40′′ diameter source with a 9.2 K peak, 6.5 km s-1 FWHM line toward , (). At an LSR velocity of km s-1, this source is likely associated with the so-called 3 kpc expanding arm. The source appears as a bright spot at the southern end of a small 13CO filamentary cloud with the same linewidth and velocity. A lack of a radio continuum counterpart in the Lang et al. (2010) 20 cm continuum data implies the absence of an H ii region, in line with the general lack of compact H ii regions in the 3 kpc arm. Other similarly narrow line components in the [C ii] data cube fall close in velocity to the Galactic plane absorption, but are most likely remnants of the wings of broader self-absorbed lines.
A small elliptical cloud with size 37′′ by 77′′ at PA and peak K, velocity 124 km s-1, and width 36 km s-1 is centered at , (, ). 13CO and C18O in the area show mainly emission peaking at about km s-1. The bulk of [C ii] here is from material with very low CO emissivity: while 13CO at velocities near km s-1 is present in patches throughout the region, it matches only the edge of the higher-velocity [C ii] wing, and C18O is not clearly present.
3.3 [O i] spectroscopy
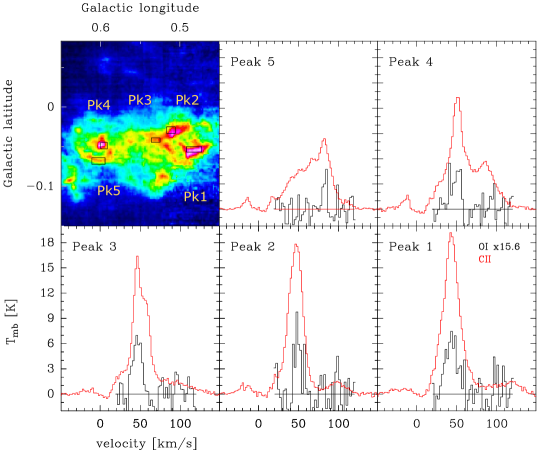
Figure 7 shows the upGREAT velocity-resolved [O i] 63 m spectra from the brightest [C ii] regions. [O i] emission is mostly at the 50 km s-1 velocity of the Sgr B cloud, and shares peak velocities with [C ii] even when multiple components are visible in the [C ii] line. Coincidence between [C ii] and [O i] indicates that [C ii] is associated with neutral gas, and that emission from photodissociation regions (PDRs) may dominate in the brighter, narrower-line [C ii] component. The peaked [O i] lineshapes suggest that the lines are not self-absorbed, so [O i] intensities are accurate measures of [O i]’s contribution to gas cooling.
Comparing line intensities gives (Table 2). Ratios from Table 2 are equivalent to the typical value of 0.3 from unresolved ISO-LWS spectra in 80′′ beams (Goicoechea et al., 2004) across the Sgr B cloud. In our data, only the brightest [C ii] regions show the weaker [O i] clearly. Our mapping strategy was driven by the signal to noise ratio for the [C ii] line; residual spectral baseline structure in the [O i] spectra prevented extraction of lower-level [O i] emission averaged over larger regions. The similar intensity ratio with the ISO data suggests that [O i] scales with [C ii] in fainter regions as well, however, pointing to a component of [C ii] with similar physical conditions and associated with neutral gas sufficiently dense ( cm-3) to excite [O i] across the entire bright region.
| Peak | Size | Vel. | ([C ii]) | ([O i]) | ([O i])/ | ||
|---|---|---|---|---|---|---|---|
| [deg] | [deg] | [arcsec] | [km/s] | ([C ii]) | |||
| 1 | 0.482 | 25–60 | 2.99 | 0.87 | 0.29 | ||
| 2 | 0.511 | 40–60 | 1.96 | 0.57 | 0.29 | ||
| 3 | 0.531 | 35–60 | 1.93 | 0.64 | 0.33 | ||
| 4 | 0.596 | 40–60 | 1.41 | 0.42 | 0.30 | ||
| 5 | 0.603 | 75–90 | 0.75 | 0.15 | 0.21 |
4 Discussion
With 12% of the [C ii] emission from only 6% of the area in our large scale map of the entire CMZ (Güsten et al., 2021), the Sgr B1 region is a notable contributor to the entire [C ii] line flux emitted by the Galactic center region. The Sgr B1 region is second only to the Sgr A-Arches region as the brightest source of [C ii] across the entire CMZ, with the difference due to Sgr B’s smaller extent rather than lower surface brightness. Our data cube with sub-parsec spatial and 1 km s-1 spectral resolution over an area of 3000 pc2 provides context to understand the [C ii] excitation within the Galactic center, as well as serving as a case study for interpreting [C ii] emission from other galactic nuclei.
4.1 Following the UV from young stars
Ultraviolet radiation from young stars produces bright [C ii] and heats dust as the surfaces of nuclear molecular clouds intercept and convert essentially all UV to longer wavelengths. [C ii] is therefore expected to be a good spectroscopic tracer of star formation in obscured regions throughout the universe (e.g., Stacey et al. 1991, 2010b; De Looze et al. 2014; Pineda et al. 2014; Herrera-Camus et al. 2015). SOFIA-upGREAT’s resolution and the Galactic center’s proximity allow us to examine the relationship between [C ii] and far-IR luminosities within a galactic nucleus in detail. Imaging of Sgr B is at a scale between small isolated clouds conducive to modeling and scales where relationships between the far-UV from star formation and indirect tracers on square kiloparsec scales hold (e.g., Calzetti et al. 2010; Kennicutt & Evans 2012).
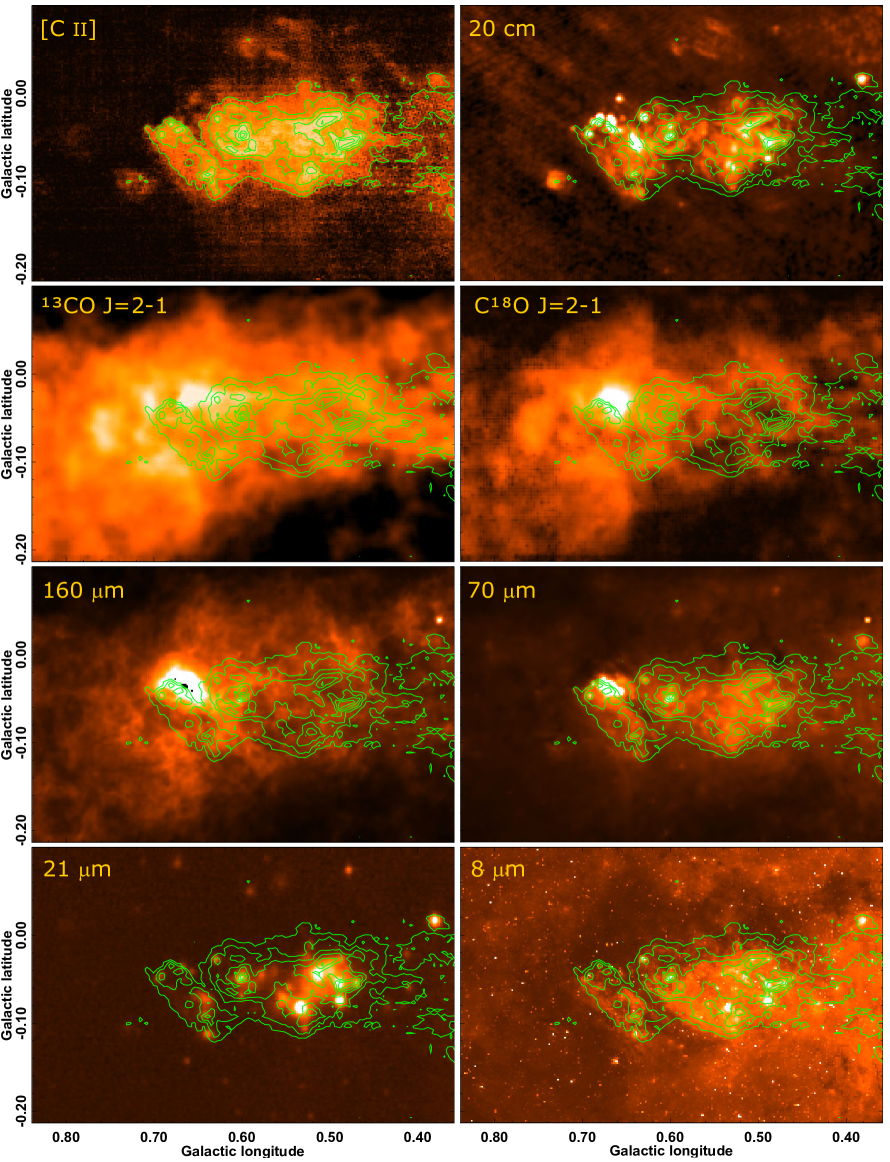
Figure 8 shows comparisons of a number of potential indirect tracers of far-UV. The panels all show [C ii] (contours) with integrated intensity images of 20 cm radio continuum (Lang et al., 2010), APEX CO isotopologues integrated over km s-1 (Riquelme et al., 2022), Herschel/PACS 160 m and 70 m continuum (Molinari et al., 2016), and MSX 21 m and Spitzer 8 m (Price et al., 2001; Stolovy et al., 2006) continuum, all sampled to the [C ii] beamsize. Visually, the 20 cm and 70 m distributions appear most similar to [C ii]’s morphology. 13CO, C18O, and 160 m are more extended, especially to . The mid-IR images have yet different distributions, more concentrated toward the [C ii] peaks.
To put the spatial comparisons on a quantitative basis, Figure 9 shows the amplitudes of the first two components in a principal components analysis (PCA) decomposition of this set of images. PCA is a standard tool of multivariate analysis, long used for multi-spectral imaging, either in different wavebands or across spectra (Frieden 1991; Ungerechts et al. 1997; Heyer & Schloerb 1997 among others, contain tutorials and examples). PCA constructs an orthogonal set of basis vectors from the data themselves, here the concatenated and normalized columns of each image. Any image can be reconstructed from a linear combination of the new basis vectors. After arranging the principal components (PCs) in decreasing order of variation, the first principal component (PC1) gives the most common vector (or image); orthogonality ensures that the second PC (PC2) shows the largest difference from PC1 and is independent from it; PC3 shows the largest independent differences from both PC1 and PC2; and so on. Higher principal moments typically contain little information other than noise. Vectors with similar principal component amplitudes highlight similar structure within the vectors, or equivalently, in the images.
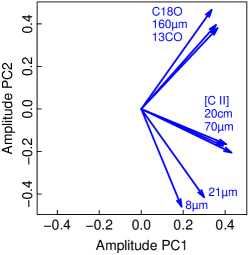
Figure 9 is a plot of the amplitudes of the PC1 and PC2 vectors from the 8 images. The first two principal components contain 80% of the total variation among the images, so considering these two PCs reveals the major commonalities and differences between the images. All the vectors in Fig. 9 have a positive PC1, indicating a similar overall structure, but their PC2s, showing deviations from the common structure, form three distinct groups. The uppermost group contains C18O , 160 m, and 13CO . The middle group shows a very tight cluster of [C ii], VLA 20 cm, and 70 m emission. Infrared 21 m and 8 m images form a looser third group. This confirms the visual impression from Fig. 8: while all images trace a roughly similar structure, the top group shows more extended emission than the others (Fig. 8), tracing large background cloud emission, while the bottom group has high contrast between extended emission and bright compact sources. With a large PC1 compared with a smaller and negative PC2, the middle group of [C ii], 20 cm, and 70 m is more typical of the global emission, although with somewhat more of the compact than the extended emission. For full sensitivity to the extended emission, this decomposition blanked a region ′′ by ′′ centered at , () in all data sets. This region covers the Sgr B2 cores and their immediate surroundings, while retaining more than 95% of the total flux in all of the images. Without blanking, the middle set of vectors spreads to some extent, while still retaining their grouping, but there is no effect on the ordering, and little effect on the top and bottom groups.
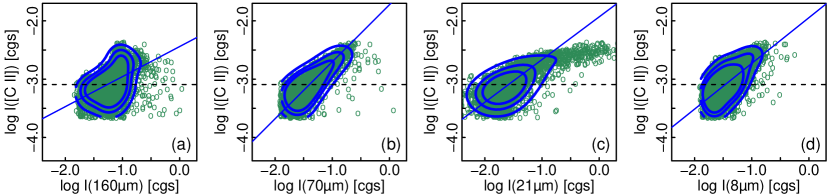
Another quantitative view of the spatial relationships between different wavebands is the spatial correlation of [C ii] with dust continuum in bands frequently used to trace star formation. Figure 10 shows such correlations. Each point in the plots represents an average over an independent 21′′ region with signal detected above in both tracers. Contour lines show the density of points, with the straight line giving a linear fit to the density of data points, weighted by the density of points to discriminate against outliers. Table 3 contains fit results. In all panels, the sprays of points to higher infrared intensities lacking strong correlation with [C ii] intensities are from compact and IR-luminous regions with unrelated [C ii] emission. The correlation is tightest for [C ii]-70 m, panel (b), with the same relationship within the body of Sgr B and in the fainter regions outside that.
| IR band | r | ||
|---|---|---|---|
| 160 m | 0.44 | ||
| 70 m | 0.89 | ||
| 21 m | 0.72 | ||
| 8 m | 0.66 |
Correlation is poor for 160 m-[C ii], panel (a), as the bright continuum luminosity is concentrated around the Sgr B2 cores and the northern end of the dark lane, while [C ii] is bright across the Sgr B body. The brightest [C ii] regions do not have corresponding peaks at 160 m, and vice versa. At lower intensities, 160 m traces the column density of the larger background cloud that is also apparent in CO isotopologues. Some hint of two clusters of points in the correlation plot may be attributable to separation between bright and background emission.
The best-calibrated mid-IR tracer for obscured star formation over large scales, Spitzer 24 m (Calzetti et al., 2010), had saturated regions that prevented comparisons over the entire field, so we show MSX 21 m data as an alternative in panel (c). The distribution is tadpole-shaped, showing a general relationship between much of the emission at the two wavelengths, with a flatter power law indicating low correlation between bright 21 m emission from the compact sources and [C ii]. The 8 m-[C ii] correlation is in panel (d). The broader distributions about the mean compared with 70 m reflect the differences in spatial distributions. A much tighter correlation between 8 m and [C ii] intensities in the Orion region (Pabst et al., 2017) is attributed to UV excitation of both 8 m bands of polycyclic aromatic hydrocarbons (PAHs) and [C ii] in PDRs. Unlike those sources, which are largely isolated and extended diffuse clouds, the Sgr B field contains a mix of extended and compact sources, and is affected by absorption and emission from the 8 kpc of Galactic plane along the line of sight.
Figure 11 provides a view of the relationship between [C ii] and 70 m intensities across Sgr B. Using the same data and fitting method as for Fig. 10, we find a slope of , indicating that radiation and physical conditions toward Sgr B do not appreciably suppress the conversion of UV to [C ii]. [C ii] and 70 m trace UV deposition at the cloud surface equally well across Sgr B’s body, with the exception of the brightest emission associated with the Sgr B2 cores. 70 m emission is near the peak of a graybody dust emission curve (Sec. 4.2) and is tightly correlated with [C ii], making it an accurate proxy for the total FIR intensity from the [C ii]-emitting regions in Sgr B. A scaling factor between 70 m and FIR intensities would change axis offsets but not the relationship’s slope in Fig. 11, indicating that the heating efficiency, measured as the ratio of [C ii] to FIR intensities, vs. FIR intensity, is also nearly constant.
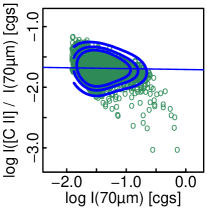
All of the comparisons above show a close connection between [C ii] and 70 m continuum, reinforcing the interpretation that they both arise from UV depositing energy at cloud edges. The comparisons also show that 20 cm VLA imaging at 15′′ resolution toward the Galactic center (Mehringer et al., 1992; Lang et al., 2010) resolves out the Galactic plane emission accounting for about half of the total flux toward the center in single-dish observations (Law et al., 2008), while retaining good sensitivity to the free-free emission from structures in the center. Agreement between the far-IR and 20 cm distributions also confirms that the synchrotron contribution toward Sgr B at 20 cm is small. The other bands we considered do not pick out the far-UV as cleanly. Emission at 160 m, 13CO, and C18O are products of temperature and column density, and trace combinations of large columns of cooler material in background clouds as well as warm surfaces. Emission from 8 m and 21 m in the Galactic center is weighted toward bright, compact regions, with dust absorption obscuring the most luminous cores, and line of sight material in the Galactic plane causing some confusion for extended emission. These results favoring [C ii] and 70 m as UV tracers likely hold in other galactic nuclei as well. A fortunate combination of circumstances for 20 cm radio continuum (i.e., the fraction of resolved large-scale emission, emission size scale, and lack of significant non-thermal emission) may not apply elsewhere in the Galactic center or in other galactic nuclei, however.
4.2 Physical conditions in the [C ii] emission regions
In this section we examine the emission from the bright body of Sgr B contained within the lowest contour in Fig. 2 to derive overall properties. A key question we approach is the fraction of [C ii] emitted from H ii regions compared with photodissociation regions (PDRs). This is of intrinsic interest in understanding the emission from the CMZ, and it is also a guide to interpreting [C ii] emission from external galaxies.
We set a lower limit on the column density and mass of singly ionized carbon in the bright [C ii] region of Sgr B’s body by assuming that the ions are in collisional equilibrium with their surroundings ( of a few thousand cm-3 in molecular hydrogen gas, or an order of magnitude lower in ionized hydrogen plasma; Launay & Roueff 1977; Flower & Launay 1977; Wiesenfeld & Goldsmith 2014); that the temperature is well above the level energy (91 K); and that the emission is optically thin. From expression (A2) in Crawford et al. (1985) (see also Goldsmith et al. 2012), the measured [C ii] intensity of the bright region outlined in Fig. 2 is erg cm-2 s-1 sr-1, corresponding to a C+ column density cm-2 and a mass M⊙. Following Genzel et al. (1990) to allow direct comparisons with other Galactic center results, we take a [C]/[H] abundance ratio of and assume all carbon is in C+, deriving a hydrogen column density cm-2 and a mass M⊙. These values are comparable with those Genzel et al. (1990) found for the Arches region of the Galactic center. A lower gas-phase carbon abundance, such as that found along diffuse lines of sight in the Galactic disk (Sofia et al., 2004), or with carbon in forms other than C+, would proportionally increase these estimates.
We use the Lang et al. (2010) 20 cm VLA and Law et al. (2008) 21 cm Green Bank Telescope radio continuum data over the same region as the bright [C ii] emission within the lowest contour of Fig. 2 to constrain the [C ii] contribution from H ii regions. We estimate that about one half of the 20 cm flux averaged over the entire region is from the foreground Galactic plane by averaging across longitude over the latitudes toward Sgr B. Comparing VLA and GBT fluxes toward Sgr B, we estimate that the VLA image contains 0.54 of the total Sgr B flux, spatially resolving out the rest. Mehringer et al. (1992) report continuum and recombination line observations of compact regions across Sgr B1 and G 0.6–0.0, which cover much of the Sgr B complex area. They estimate that the 20 cm emission is optically thin with little contribution from synchrotron radiation in this region, an estimate confirmed in multi-frequency single-dish observations by Law et al. (2008), and give typical electron temperatures of K for the compact regions. With this electron temperature and the Lang et al. (2010) flux density corrected for power resolved out by the interferometer, the emission measure across Sgr B’s bright region is pc cm-6. The relationship between emission measure, column density , and particle density is , allowing an estimate of . Infrared fine-structure lines from the Sgr B H ii region provide estimates of electron density of about 300 cm-3 (Goicoechea et al., 2004; Simpson et al., 2018; this is also sufficient to thermalize any [C ii] line emission from the H ii region). Combining these values, we find cm-2, for a total ionized mass of M⊙ in the region. These densities imply that the ionized gas has a characteristic line of sight depth of pc, which seems plausible as a relatively thin layer over the region’s surface.
Taking the values above, and given the uncertainties in the continuum contribution from the Galactic plane, the H+ filling factor, and the atomic carbon abundance, we find a representative ratio of /. Most corrections push this ratio to lower values: Although the [C ii] lines are still in the “effectively optically thin” regime found by Goldsmith et al. (2012), there is some evidence for [C ii] optical depths of a few within the CMZ (Güsten et al., 2021), and substantial [C ii] optical depths would decrease the ratio. A lower gas-phase carbon abundance or increased electron density would also decrease the ratio, as would synchrotron contributions to the radio flux. Ionized hydrogen columns increase sub-linearly with .
Both PDRs and H ii regions emit [C ii] line radiation, but [O i] is excited in PDRs and destroyed in H ii regions. PDR models combined with observed [C ii], [O i], and far-infrared continuum therefore provide another constraint on the fraction of [C ii] emission from neutral material.
We measure the [C ii] and [O i] intensities directly, but we must separate the PDR’s far-infrared dust intensity from cooler and warmer cloud components. Since 70 m is very similar in spatial distribution to [C ii] (Sec. 4.1), we estimate (FIR) by scaling the intensity falling within the 70 m PACS filter passband to the full 8–500 m FIR band from a
| (2) |
graybody. Goicoechea et al. (2004) used a two-component version of this expression to fit far-IR continuum fluxes in the region. They found cool and warm dust components, with warm dust component temperatures of 30–38 K and in the bodies of the massive clouds in their 80′′ beams.
For the warmer dust associated with the PDRs, we prefer a temperature of 45 K , based on the tight similarity of the 70 m and [C ii] images and match to the 70 m/21 m flux ratio, including a correction for PAH emission (Draine & Li, 2007).
With this combination of temperature and , a fraction 0.245 of the total 8 to 500 m far-IR flux falls in the PACS 70 m filter bandwidth, or (70 m)/0.245. The observed 70 m mean intensity of 0.11 erg s-1 cm-2 sr-1 translates to (FIR) = 0.45 erg s-1 cm-2 sr-1 from the PDR regions. This value is insensitive to modest changes in temperature or because the 70 m band is on the Rayleigh-Jeans side close to the graybody peak. For , K gives a fraction of 0.262; while at K, of 1.25 to 1.75 gives 0.248 to 0.239. Our derived intensity of ([C ii])/(FIR)% is in line with ratios of 0.1 to 1% for starbursts (Stacey et al., 1991) and % for a large sample of disk galaxies (Smith et al., 2017). We conclude that the 70 m flux can be scaled to provide a good measure of the total FIR intensity for PDR modeling.
Figure 12 shows our data as contours along predictions of models from the updated PhotoDissociation Region Toolbox (Pound & Wolfire, 2008; Kaufman et al., 2006, 1999). This model’s face-on geometry matches that of the Sgr B region. Given the changing physical conditions across Sgr B, we use center-of-error fluxes as guides to identify boundaries on representative physical conditions, with more detailed modeling left to future work. Since [O i] is only associated with the km s-1 clouds, we take only the km s-1 [C ii] emission component in the comparison, for erg cm-2 s-1 sr-1. We use the typical intensity ratio from Table 2 and Goicoechea et al. (2004). has been derived above. This set of parameters does not produce a model solution (the solid curves for ratios in the figure do not touch).
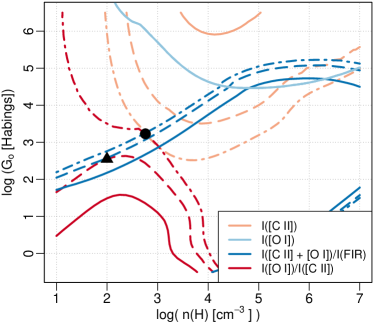
Using the total observed [C ii] flux for modeling includes radiation from H ii regions as well as PDRs, however. Finding successful PDR model solutions with reduced [C ii] flux allows us to deduce the relative amounts of [C ii] from PDRs and H ii regions. Ratioed quantities in the models set a lower limit of 58% of the [C ii] flux from H ii regions (red and blue dashed ratio lines in Fig. 12 first touch, marked by a triangle) for cm-3 and a radiation field of G Habing units. Matching the absolute [C ii] and [O i] intensities in this case would require multiple optically thin PDRs along the line of sight (intensities add, but ratios remain approximately constant). Bringing ratios and the [C ii] intensity together for a single PDR (dash-dot lines cross, marked by dot) sets an approximate upper limit of 76% of [C ii] from H ii regions of cm-3 and G Habing units. These densities and fields are in agreement with those deduced from a different approach for assessing the H ii region contribution, but a very similar PDR model, using the [C ii] and upper-state 145 m [O i] lines Simpson et al. (2021). Since the line intensity falls rapidly with decreasing density below the critical density of about cm-3, bright emission regions are very likely from material with density above or near this. Neither solution matches the intensity in the ground-state 63 m [O i] line, a frequent problem between observation and theory for [O i], although the discrepancy could be reduced by geometries not considered in the model. Still, with the predicted , [O i] is a major gas coolant in the PDRs, even as [C ii] remains the dominant coolant for the region as a whole.
The smaller bright regions identified in Fig. 7 and Table 2 require even more [C ii] from H ii regions and have an even larger discrepancy with ([O i]). Many of these small bright regions could be structures seen edge-on that would not fit the model’s geometrical assumptions, and may have higher densities as well.
Taking all information together, we find that approximately 50% of the [C ii] emission is from H ii regions, with the other half from PDRs. The proton column density comparison from [C ii] and 20 cm radio continuum intensities is more precise; PDR modeling indicates that this is reasonable, with bounds of about 58% to 76%. These fractions agree well with values from H ii regions obtained from ratios of [N ii]/[C ii] intensities in samples across the Galaxy, in the Arches region of the Galactic center, in the Carina nebula, and averaged over the nuclei of the galaxies NGC 891 and IC 342 (Goldsmith et al., 2015; García et al., 2021; Oberst et al., 2006; Stacey et al., 2010a; Röllig et al., 2016). Accounting for [C ii] emission from both PDRs and H ii regions is necessary when interpreting [C ii] emission from galactic nuclei.
4.3 Physical structure of the Sgr B region
Figure 1 provided an introductory overview of our understanding of the Sgr B region; here we summarize and then explore the information that led us to those conclusions. [C ii] emission stretching from is continuous in brightness and velocity (Sec. 3.1; Figs. 2 and 5), implying that the entire region we imaged is physically connected. The [C ii]-bright area encompasses Sgr B1 and G 0.6–0.0 as brighter regions, and at least some of the source in the Sgr B2 region. As we discuss below, the luminous star formation cores Sgr B2(N), (M), and (S) are essentially invisible in [C ii], and are likely somewhat physically separate from the extended region, although not entirely so.
[C ii] velocities closely match the velocity field seen in the H110 hydrogen recombination line, associating [C ii] with the H ii region or regions seen at radio and in mid-infrared spectral lines (Mehringer et al., 1992; Goicoechea et al., 2004; Simpson et al., 2018). At the same time, brighter [C ii] regions are coincident with [O i] 63 and 145 m emission peaks (Sec. 3.3; Fig. 7; Simpson et al. 2021), implying that these regions are edge-on PDRs, consistent with some exciting stars being mixed with the [C ii]-emitting material. The absence of large-scale intensity gradients in [C ii] or 70 m brightness also indicates that the exciting sources are distributed, rather than being concentrated in one or a few compact sources. A similar case can be made at 70 m: despite Sgr B2(M)’s luminosity, it contributes only 5% of the total 70 m intensity across the larger Sgr B region, and it is not at the center of a large-scale intensity gradient.
The general velocity field traced along the [C ii] and H ii surface also matches that of the molecular cloud along the same lines of sight, linking the [C ii] to molecular clouds as well as H ii regions (Fig. 3, Mehringer et al. 1992). Molecular and dust emission is more extended than the [C ii]-bright region in Galactic longitude, and even more to increasing longitude (Fig. 8). Lack of [C ii] self-absorption features indicates that the region bright in [C ii] and H ii is on the near (Earth) side of this cloud or clouds. The velocity field becomes increasingly complex with increasing longitude beyond G 0.6–0.0.
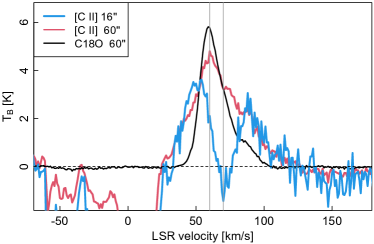
Of all the cores, only Sgr B2(M) has an absorption feature other than those from the Galactic plane. Absorption is from a source smaller than the beam that is coincident with the Sgr B2(M) continuum peak. Figure 13 shows this 70 km s-1 feature in a 16′′ FWHM beam (blue line, duplicated spectrum J of Fig. 6). Both visual comparison of the spectra in Fig. 13 and the two-component Gaussian fit shows that the absorption is at a different velocity than the emission peak. From Table 1, the absorption is centered at km s-1, while the emission component is centered at km s-1. The absorption is shifted somewhat from the 65 km s-1 cm-wave H2CO and H i absorptions (Mehringer et al., 1995; Lang et al., 2010), although Qin et al. (2008) find multiple velocities in their SMA imaging of submillimeter H2CO absorption lines, with the strongest absorptions at 68 and 76 km s-1. Considering velocity centroids, it seems most probable that the [C ii] absorption is associated with a compact H ii region within the Sgr B2(M) complex. De Pree et al. (1996) found that their sub-source B within the Sgr B2(M) complex, one of the two brightest sources at 1.3 cm, has its H66 emission velocity peak at 71 km s-1 (34 km s-1 FWHM). Both line center and width are in good agreement with the [C ii] absorption parameters.
The [C ii] absorption dips close to the continuum level, either because the [C ii] is thermalized at the dust temperature, or more likely because surrounding emission in the beam’s wings adds flux at the absorption velocity to diminish a deeper absorption. This latter effect is apparent in Fig. 13, where the absorption feature has completely disappeared in the 30′′ beam.
The difference in [C ii] emission and absorption linewidths firmly place Sgr B2(M) on the Earth side of Sgr B’s extended [C ii] emission. If the Sgr B2(M) continuum source were behind the extended Sgr B cloud, then the [C ii] absorption would cover the velocity range typical of that cloud (as it does for the Galactic plane features), but the absorption is considerably narrower. Instead, Sgr B2(M) is most likely embedded in the dark lane seen against Sgr B’s extended [C ii] emission (see Fig. 10). Similar cm-wave absorption line center velocities against the Sgr B2 cores’ continua (e.g., Mehringer et al. 1993; Lang et al. 2010; Mills et al. 2018) and spatial association of the three Sgr B2 cores and other star formation along the dark dust lane (Ginsburg et al., 2018) suggest that the molecular absorption velocity is from the high column of material that forms the dark lane, and that all of the cores are within the lane. The dark dust lane may well be the physical manifestation of the “moderate density envelope” Huettemeister et al. (1995) and others suggest surrounds the star-forming cores.
A lack of obvious [C ii] or H ii emission from the lane’s outer regions suggests that it is either some distance from the stars irradiating the Sgr B molecular cloud behind it, or that the dust has sufficient optical depth to absorb most of the [C ii] emitted by the side of the lane between the Sgr B stars and the Earth. Some UV must be present to produce the C+ causing Sgr B2(M)’s 70 km s-1 absorption feature, but since absorption features are missing toward Sgr B2(N) or (S), the material must be local to structure within Sgr B(M), as suggested by the De Pree et al. (1996) H66 velocity measurements.
Given the close association between Sgr B2(M) in velocity and projected distance to other star formation across the overall Sgr B region, it seems likely that the Sgr B2 cores and dust lane, while somewhat separate from the larger Sgr B emission region, are still physically related, and are not completely separate objects.
4.4 “Missing” [C ii] flux from the Sgr B2 cores
Figure 13 compares area-averaged [C ii] emission in 16′′ FWHM and arcminute-scale beams centered on Sgr B2(M). In emission averaged over 1′ diameter areas, [C ii] and C18O have single-component fit peak velocities of 64 and 62 km s-1, with 61 km s-1 in a area for H110 Mehringer et al. 1993; the absorption feature is distinctly displaced, at 70 km s-1. Central velocity comparisons show that the emission component of the 16′′ spectrum is characteristic of the area surrounding Sgr B2(M), rather than of the source seen in absorption. Lineshape similarities away from the absorption feature in Fig. 13 further imply that the core is a minor contributor to the region’s [C ii] luminosity at most. Indeed, it has no obviously detectable [C ii] emission.
The insignificant amount of [C ii] emission from Sgr B2(M) and the other luminous cores is especially striking, since they are regions with extreme star formation densities. A low [C ii]/FIR intensity ratio compared with that in galactic star formation regions and starburst galaxies (e.g., Sec. 4.1, Stacey et al. 1991, 2010b; De Looze et al. 2014; Pineda et al. 2014; Herrera-Camus et al. 2015, 2018a), is reminiscent of the “C+ deficit” first discovered in (ultra) luminous infrared galaxies, or (U)LIRGs, by Fischer et al. (1999). With an FIR luminosity of at least a L⊙(e.g., Odenwald & Fazio 1984; Lis et al. 1991; Gordon et al. 1993; Schmiedeke et al. 2016) and a maximum linear size of the star formation region of about 1 pc (e.g., Ginsburg et al. 2018), a conservative lower limit on its luminosity density exceeds a L⊙ kpc-2. Even allowing for substantial beam dilution observations averaging multiple similar regions spread over large scales in distant galaxies, this is in the range of beam-averaged luminosity surface brightnesses for ULIRGs of M⊙ kpc-2 (e.g., Herrera-Camus et al. 2018a).
This comparison of Sgr B2(M) with (U)LIRGs is not new (e.g., Goicoechea et al., 2004; Kamenetzky et al., 2014; Santa-Maria et al., 2021); our contribution to the discussion is the combination of velocity resolution and spatial dynamic range that definitively shows that the emitted [C ii] from the cores themselves have negligible intensity, even as the surrounding area provides [C ii] more typical of extended star forming regions.
A number of explanations have been advanced to explain the low [C ii]/FIR ratio with increasing FIR: high optical depth, dust-bounded H ii regions that emit strong FIR but little [C ii], intense UV fields that destroy C+, grain charging that reduces the number of photoelectrons exciting PDRs, and others (Luhman et al. 1998; Malhotra et al. 2001; see also recent summaries in Herrera-Camus et al. 2018b and Santa-Maria et al. 2021 for more details and references). In their study of a wide range of IR-luminous galactic nuclei, Herrera-Camus et al. (2018b) found that the dominant mechanism suppressing [C ii] in most (U)LIRGs is a reduction in photoelectric heating efficiency as the ionization parameter increases; they note that optical depth may be important as well. Comparisons of [C ii] emission intensities within and just beyond the edge of the dark lane near Sgr B2(M) provide estimates of lane attenuation factors of 3–5 for [C ii] emission. Density gradients around the cores themselves will increase the attenuation toward the most luminous regions, so attenuation alone can quite plausibly reduce any [C ii] intensity from dense cores by more than an order of magnitude.
To the extent that Sgr B is representative of regions around extreme star formation in galactic nuclei, we must be seeing a mixture of extended and compact star formation in external galaxies, with weighting toward extended and relatively unobscured regions, and away from the densest star formation cores. Proximity and a wealth of data at many wavelengths all make Sgr B2(M) a valuable local region to continue detailed investigations into the physical mechanisms operating within (U)LIRG star formation regions.
4.5 Implications for Galactic center star formation models
There is debate about the origin of star formation across Sgr B. Mehringer et al. (1992) proposed that Sgr B1’s extended ionization comes from a dissipating cluster of mostly O stars that formed earlier than the clusters and compact H ii regions in G 0.6–0.0 and Sgr B2. Goicoechea et al. (2004) and Simpson et al. (2018) also found that late-O stars are consistent with most of the amount and degree of ionized material in the H ii region that lies between the Sgr B background dust and molecular cloud and the Earth.
The Sgr B2 cores’ more recent burst of star formation suggests some kind of trigger, most probably associated with a special position along the region’s orbit. The existence of the dark lane and its association with the cores suggests that shock-driven propagating star formation across Sgr B is at play. Narrow dust lanes are common signs of shock-concentrated material in other galaxies with nuclear bars and in interacting galactic nuclei.
Star formation triggered by cloud-cloud collisions near Sgr B2 had been suggested by Hasegawa et al. (1994), among others over the years, supported by observations of shock-tracing SiO (e.g., Huettemeister et al. 1995; Armijos-Abendaño et al. 2020; Santa-Maria et al. 2021). The [C ii] p-v diagram (Fig. 5) shows that linewidths broaden substantially with increasing longitude from G 0.6–0.0, possibly signaling accelerated gas motions from interactions between the Sgr B region and the material to yet higher traced in CO and 160 m emission (Fig. 8). Simpson et al. (2018) also concluded that shocks or other mechanisms are needed to produce the very energetic radiation needed to explain the high excitation species they observe in the Sgr B H ii region. An alternative to shocks that they propose, a tidal tail of hot stars from the dissolving Quintuplet cluster, as Habibi et al. (2014)’s modeling might suggest, seems a less attractive explanation than shocks because it requires a group of stars with just the right geometry to excite the Sgr B area of the molecular cloud.
There are two popular dynamical models for triggered star formation in gas orbiting the Galactic center: One proposes that gas cloud compression by tidal interactions at orbital pericenter (e.g., Kruijssen et al. 2015; Barnes et al. 2017) dominates. The other proposes cloud-cloud collisions close to the apocenters (e.g., Binney et al. 1991; Sormani et al. 2020; Tress et al. 2020) as the chief mechanism.
The first model accounts for the spatial differences in star formation between the extended star formation in Sgr B1 and the highly concentrated clusters of the Sgr B2 cores by proposing that the two regions could be on very different positions along their orbits. In this model, Sgr B2 is on the near side of its orbit around the center after a relatively recent encounter with the central mass concentration that compressed it and triggered star formation. Sgr B1, on a similar orbit, passed the center well before Sgr B2, and has now passed its apocenter and is returning toward the center on the far side of its orbit. Its stars have disrupted their birthplaces and are drifting apart, accounting for the more extended region. The positional alignment between Sgr B1 and the Sgr B2 cores is by chance. As Simpson (2018) and Simpson et al. (2018) point out, however, one problem with this explanation is that the difference in stellar ages between Sgr B1 and Sgr B2 is larger than orbital timescales predict. If the Sgr B2 cores are indeed associated with the dark lane, another problem is in explaining how this long, narrow structure would be produced and then persist over a substantial fraction of its orbit around the Galactic center. Typical velocity widths in molecular absorptions features toward the Sgr B2 cores imply a dark lane lifetime well under yr, considerably shorter than the orbital time since periapse.
In the second model, Sgr B1 and Sgr B2 are physically related, and close to an apocenter of their orbit. Cloud-cloud collisions between individual gas clouds or streams flowing from the outer galaxy into the central region along orbits (Contopoulos & Grosbol, 1989) and clouds on the orbits around the center (Sormani et al., 2020; Tress et al., 2020), or interactions between gas on cusped or crossing orbits (Jenkins & Binney, 1994) of the orbits themselves, then trigger star formation. Association of vigorous star formation with the dark dust lane, and the increasingly complex [C ii] velocity field with increasing latitude across Sgr B are qualitatively consistent with this model. Such a model for Sgr B, which accommodates different stages of star formation across the associated regions that comprise Sgr B, is very appealing.
5 Summary
Our large-scale, fully velocity-resolved spectroscopic imaging of [C ii] has revealed:
-
1.
With 12% of the total [C ii] flux from 6% of the area of our large-scale image covering all of the [C ii]-bright Central Molecular Zone, Sgr B is a major contributor to the entire Galactic center’s [C ii] luminosity.
-
2.
The Sgr B region extends as a continuous, coherent structure that encompasses the luminous components identified in early radio continuum maps of the Galactic center. Sgr B starts near , contains Sgr B1 (), runs along the Galactic plane past G 0.6–0.0, and continues behind and beyond Sgr B2 () to . This is a span of some 34 pc in longitude, with width of some 15 pc in latitude. Fainter emission extends further, particularly to lower toward Sgr A. Many of the region’s components appear to be part of the same physical structure, although the Sgr B2 region appears as a foreground region that may or may not have a physical connection to the larger region.
-
3.
The spectra of [C ii] in the Sgr B region show two main velocity components at 50 km s-1 and 90 km s-1, with additional emission from to km s-1. The dominant emission is centered at 50 km s-1, in agreement with the region’s velocity in molecular and radio recombination lines. The secondary component at 90 km s-1 is mainly associated with extended, moderately excited, molecular material. Individual components have typical linewidths of 30–60 km s-1 FWHM, indicating emission from a highly turbulent medium. A linear gradient of the mean velocity along Sgr B’s body runs from 40 to 70 km s-1 in the same sense as Galactic rotation.
-
4.
Emission across the Sgr B region is spatially complex. Arcs, ridges, and other structures have nearly exact counterparts in 70 m and 20 cm continua (Molinari et al., 2016; Mehringer et al., 1992; Lang et al., 2010). Other tracers share the same general distribution, but have significant differences from [C ii] and each other. 160 m continuum and CO line emission highlight extended emission from extended background clouds, while 21 m and 8 m continua highlight compact sources and structure.
-
5.
The absence of obvious self-absorption in [C ii] spectra, spatial agreement with 70 m and 20 cm radio continuum, and disparity with the more extended CO and 160 m spatial distributions, indicate that the [C ii] is emitted from the near surface of a larger molecular cloud or cloud complex.
-
6.
Comparison of a variety of tracers indicates that 70 m, [C ii], and 20 cm continua are all excellent tracers of the UV flux produced by young stars across the Sgr B region. Velocity information in [C ii] is invaluable for separating physical components along the line of sight. Longer-wavelength UV tracers are especially important for the Galactic center and other edge-on observations of galactic nuclei where even infrared obscuration is influential.
-
7.
Velocity resolved [C ii]/[O i] flux ratios from a sample of bright regions are close to those from large scale measurements (Goicoechea et al., 2004; Simpson et al., 2021), suggesting that PDRs are present across the entire Sgr B region. The lineshape we measure for the [O i] 63 m line is similar to the km s-1 [C ii] component, indicating that it is mainly associated with Sgr B itself, rather than other clouds along the line of sight. Its lineshape also indicates that the [O i] line is not significantly affected by self-absorption, and can be a significant gas coolant.
-
8.
PDR modeling places bounds of approximately 58% to 76% of [C ii] flux from H ii regions toward Sgr B, with [C ii] and radio continuum fluxes suggesting a fraction of more than 50%. These values agree with those obtained with an independent method using [N ii]/[C ii] intensity ratios. Emission from both PDRs and H ii regions are important in interpreting [C ii] emission from galactic nuclei.
-
9.
Distributed star formation is common across Sgr B. The vast majority of UV illumination comes from sources other than the Sgr B2 embedded cores, which produce only 5% of the 70 m flux across the region.
-
10.
In [C ii], the Sgr B2 cores appear only as enhanced [C ii] absorption against their 158 m Sgr B2(M) continuum. Sgr B2(M) may be an analog of the intense star formation regions in ULIRGs, which exhibit a “C+ deficit” (e.g., Fischer et al. 1999) when compared to their star formation rates. This region is an excellent local source to study the phenomenon in detail.
-
11.
The Sgr B2(M), (N), and (S) cores appear to be objects within with a dark dust lane in front of the larger Sgr B region. Velocity and positional coincidence suggest that the cores and lane are still dynamically associated with the larger region, even as they are somewhat separated from it.
-
12.
Taken together, our results support triggered star formation models that invoke local cloud-cloud collisions close to apocenters of orbits in a barred potential (e.g., Binney et al. 1991; Sormani et al. 2020), rather than models that invoke tidal compression at pericenter passage close to a central mass concentration (e.g., Kruijssen et al. 2015; Barnes et al. 2017).
References
- Armijos-Abendaño et al. (2020) Armijos-Abendaño, J., Banda-Barragán, W. E., Martín-Pintado, J., et al. 2020, MNRAS, 499, 4918, doi: 10.1093/mnras/staa3119
- Barnes et al. (2017) Barnes, A. T., Longmore, S. N., Battersby, C., et al. 2017, MNRAS, 469, 2263, doi: 10.1093/mnras/stx941
- Bergin et al. (2010) Bergin, E. A., Phillips, T. G., Comito, C., et al. 2010, A&A, 521, L20, doi: 10.1051/0004-6361/201015071
- Binney et al. (1991) Binney, J., Gerhard, O. E., Stark, A. A., Bally, J., & Uchida, K. I. 1991, MNRAS, 252, 210, doi: 10.1093/mnras/252.2.210
- Boselli et al. (2002) Boselli, A., Gavazzi, G., Lequeux, J., & Pierini, D. 2002, A&A, 385, 454, doi: 10.1051/0004-6361:20020156
- Calzetti et al. (2010) Calzetti, D., Wu, S. Y., Hong, S., et al. 2010, ApJ, 714, 1256, doi: 10.1088/0004-637X/714/2/1256
- Contopoulos & Grosbol (1989) Contopoulos, G., & Grosbol, P. 1989, A&A Rev., 1, 261, doi: 10.1007/BF00873080
- Crawford et al. (1985) Crawford, M. K., Genzel, R., Townes, C. H., & Watson, D. M. 1985, ApJ, 291, 755, doi: 10.1086/163113
- De Looze et al. (2014) De Looze, I., Cormier, D., Lebouteiller, V., et al. 2014, A&A, 568, A62, doi: 10.1051/0004-6361/201322489
- De Pree et al. (1996) De Pree, C. G., Gaume, R. A., Goss, W. M., & Claussen, M. J. 1996, ApJ, 464, 788, doi: 10.1086/177364
- Downes et al. (1980) Downes, D., Wilson, T. L., Bieging, J., & Wink, J. 1980, Astronomy and Astrophysics Supplement Series, 40, 379
- Draine & Li (2007) Draine, B. T., & Li, A. 2007, ApJ, 657, 810, doi: 10.1086/511055
- Fischer et al. (1999) Fischer, J., Luhman, M. L., Satyapal. S., et al. 1999, in Astronomical Society of the Pacific Conference Series, Vol. 177, Astrophysics with Infrared Surveys: A Prelude to SIRTF, ed. M. D. Bicay, R. M. Cutri, & B. F. Madore, 175
- Flower & Launay (1977) Flower, D. R., & Launay, J. M. 1977, Journal of Physics B Atomic Molecular Physics, 10, 3673, doi: 10.1088/0022-3700/10/18/024
- Frieden (1991) Frieden, B. 1991, Probability, Statistical Optics, and Data Testing, 2nd edn., Springer Series in Information Sciences (Springer)
- García et al. (2021) García, P., Abel, N., Röllig, M., Simon, R., & Stutzki, J. 2021, A&A in press, arXiv:2104.02489. https://arxiv.org/abs/2104.02489
- Genzel et al. (1990) Genzel, R., Stacey, G. J., Harris, A. I., et al. 1990, ApJ, 356, 160, doi: 10.1086/168827
- Gildas Team (2013) Gildas Team. 2013, GILDAS: Grenoble Image and Line Data Analysis Software. http://ascl.net/1305.010
- Ginsburg et al. (2018) Ginsburg, A., Bally, J., Barnes, A., et al. 2018, ApJ, 853, 171, doi: 10.3847/1538-4357/aaa6d4
- Goicoechea et al. (2004) Goicoechea, J. R., Rodríguez-Fernández, N. J., & Cernicharo, J. 2004, ApJ, 600, 214, doi: 10.1086/379704
- Goldsmith et al. (2012) Goldsmith, P. F., Langer, W. D., Pineda, J. L., & Velusamy, T. 2012, The Astrophysical Journal Supplement Series, 203, 13, doi: 10.1088/0067-0049/203/1/13
- Goldsmith et al. (2015) Goldsmith, P. F., Yıldız, U. A., Langer, W. D., & Pineda, J. L. 2015, ApJ, 814, 133, doi: 10.1088/0004-637X/814/2/133
- Gordon et al. (1993) Gordon, M. A., Berkermann, U., Mezger, P. G., et al. 1993, A&A, 280, 208
- Guan et al. (2012) Guan, X., Stutzki, J., Graf, U. U., et al. 2012, A&A, 542, L4, doi: 10.1051/0004-6361/201218925
- Güsten (1989) Güsten, R. 1989, in The Center of the Galaxy, ed. M. Morris, Vol. 136, 89
- Güsten et al. (2021) Güsten et al. 2021, in prep.
- Habibi et al. (2014) Habibi, M., Stolte, A., & Harfst, S. 2014, A&A, 566, A6, doi: 10.1051/0004-6361/201323030
- Hasegawa et al. (1994) Hasegawa, T., Sato, F., Whiteoak, J. B., & Miyawaki, R. 1994, ApJ, 429, L77, doi: 10.1086/187417
- Herrera-Camus et al. (2015) Herrera-Camus, R., Bolatto, A. D., Wolfire, M. G., et al. 2015, ApJ, 800, 1, doi: 10.1088/0004-637X/800/1/1
- Herrera-Camus et al. (2018a) Herrera-Camus, R., Sturm, E., Graciá-Carpio, J., et al. 2018a, ApJ, 861, 94, doi: 10.3847/1538-4357/aac0f6
- Herrera-Camus et al. (2018b) —. 2018b, ApJ, 861, 95, doi: 10.3847/1538-4357/aac0f9
- Heyer & Schloerb (1997) Heyer, M. H., & Schloerb, F. P. 1997, ApJ, 475, 173, doi: 10.1086/303514
- Higgins (2011) Higgins, D. 2011, PhD thesis, National University of Ireland Maynooth
- Higgins et al. (2021) Higgins, R., Kabanovic, S., Pabst, C., et al. 2021, A&A, in press
- Huettemeister et al. (1995) Huettemeister, S., Wilson, T. L., Mauersberger, R., et al. 1995, A&A, 294, 667
- Jenkins & Binney (1994) Jenkins, A., & Binney, J. 1994, MNRAS, 270, 703, doi: 10.1093/mnras/270.3.703
- Joye & Mandel (2003) Joye, W. A., & Mandel, E. 2003, in Astronomical Society of the Pacific Conference Series, Vol. 295, Astronomical Data Analysis Software and Systems XII, ed. H. E. Payne, R. I. Jedrzejewski, & R. N. Hook, 489
- Kamenetzky et al. (2014) Kamenetzky, J., Rangwala, N., Glenn, J., Maloney, P. R., & Conley, A. 2014, ApJ, 795, 174, doi: 10.1088/0004-637X/795/2/174
- Kapitzky & Dent (1974) Kapitzky, J. E., & Dent, W. A. 1974, ApJ, 188, 27, doi: 10.1086/152679
- Kaufman et al. (2006) Kaufman, M. J., Wolfire, M. G., & Hollenbach, D. J. 2006, ApJ, 644, 283, doi: 10.1086/503596
- Kaufman et al. (1999) Kaufman, M. J., Wolfire, M. G., Hollenbach, D. J., & Luhman, M. L. 1999, ApJ, 527, 795, doi: 10.1086/308102
- Kennicutt & Evans (2012) Kennicutt, R. C., & Evans, N. J. 2012, ARA&A, 50, 531, doi: 10.1146/annurev-astro-081811-125610
- Kester et al. (2014) Kester, D., Avruch, I., & Teyssier, D. 2014, Bayesian Inference and Maximum Entropy Methods in Science and Engineering, 1636, 62, doi: 10.1063/1.4903711
- Klein et al. (2012) Klein, B., Hochgürtel, S., Krämer, I., et al. 2012, A&A, 542, L3, doi: 10.1051/0004-6361/201218864
- Kruijssen et al. (2015) Kruijssen, J. M. D., Dale, J. E., & Longmore, S. N. 2015, MNRAS, 447, 1059, doi: 10.1093/mnras/stu2526
- Lang et al. (2010) Lang, C. C., Goss, W. M., Cyganowski, C., & Clubb, K. I. 2010, The Astrophysical Journal Supplement Series, 191, 275, doi: 10.1088/0067-0049/191/2/275
- Langer et al. (2017) Langer, W. D., Velusamy, T., Morris, M. R., Goldsmith, P. F., & Pineda, J. L. 2017, A&A, 599, A136, doi: 10.1051/0004-6361/201629497
- Launay & Roueff (1977) Launay, J. M., & Roueff, E. 1977, Journal of Physics B Atomic Molecular Physics, 10, 879, doi: 10.1088/0022-3700/10/5/024
- Law et al. (2008) Law, C. J., Yusef-Zadeh, F., Cotton, W. D., & Maddalena, R. J. 2008, ApJS, 177, 255, doi: 10.1086/533587
- Lis et al. (1991) Lis, D. C., Carlstrom, J. E., & Keene, J. 1991, ApJ, 380, 429, doi: 10.1086/170601
- Luhman et al. (1998) Luhman, M. L., Satyapal, S., Fischer, J., et al. 1998, ApJ, 504, L11, doi: 10.1086/311562
- Malhotra et al. (2001) Malhotra, S., Kaufman, M. J., Hollenbach, D., et al. 2001, ApJ, 561, 766, doi: 10.1086/323046
- Mehringer et al. (1995) Mehringer, D. M., Palmer, P., & Goss, W. M. 1995, ApJS, 97, 497, doi: 10.1086/192148
- Mehringer et al. (1993) Mehringer, D. M., Palmer, P., Goss, W. M., & Yusef-Zadeh, F. 1993, ApJ, 412, 684, doi: 10.1086/172954
- Mehringer et al. (1992) Mehringer, D. M., Yusef-Zadeh, F., Palmer, P., & Goss, W. M. 1992, ApJ, 401, 168, doi: 10.1086/172050
- Mezger & Smith (1976) Mezger, P. G., & Smith, L. F. 1976, A&A, 47, 143
- Mills (2017) Mills, E. A. C. 2017, arXiv e-prints, arXiv:1705.05332. https://arxiv.org/abs/1705.05332
- Mills et al. (2018) Mills, E. A. C., Corby, J., Clements, A. R., et al. 2018, ApJ, 869, 121, doi: 10.3847/1538-4357/aaed3f
- Molinari et al. (2016) Molinari, S., Schisano, E., Elia, D., et al. 2016, A&A, 591, A149, doi: 10.1051/0004-6361/201526380
- Möller et al. (2021) Möller, T., Schilke, P., Schmiedeke, A., et al. 2021, arXiv e-prints, arXiv:2104.13150. https://arxiv.org/abs/2104.13150
- Morris & Serabyn (1996) Morris, M., & Serabyn, E. 1996, ARA&A, 34, 645, doi: 10.1146/annurev.astro.34.1.645
- Oberst et al. (2006) Oberst, T. E., Parshley, S. C., Stacey, G. J., et al. 2006, ApJ, 652, L125, doi: 10.1086/510289
- Odenwald & Fazio (1984) Odenwald, S. F., & Fazio, G. G. 1984, ApJ, 283, 601, doi: 10.1086/162345
- Pabst et al. (2017) Pabst, C. H. M., Goicoechea, J. R., Teyssier, D., et al. 2017, A&A, 606, A29, doi: 10.1051/0004-6361/201730881
- Pety (2005) Pety, J. 2005, in SF2A-2005: Semaine de l’Astrophysique Francaise, ed. F. Casoli, T. Contini, J. M. Hameury, & L. Pagani, 721
- Pineda et al. (2014) Pineda, J. L., Langer, W. D., & Goldsmith, P. F. 2014, A&A, 570, A121, doi: 10.1051/0004-6361/201424054
- Pound & Wolfire (2008) Pound, M. W., & Wolfire, M. G. 2008, in Astronomical Society of the Pacific Conference Series, Vol. 394, Astronomical Data Analysis Software and Systems XVII, ed. R. W. Argyle, P. S. Bunclark, & J. R. Lewis, 654
- Price et al. (2001) Price, S. D., Egan, M. P., Carey, S. J., Mizuno, D. R., & Kuchar, T. A. 2001, AJ, 121, 2819, doi: 10.1086/320404
- Qin et al. (2008) Qin, S.-L., Zhao, J.-H., Moran, J. M., et al. 2008, ApJ, 677, 353, doi: 10.1086/529067
- R Core Team (2017) R Core Team. 2017, R: A Language and Environment for Statistical Computing, R Foundation for Statistical Computing, Vienna, Austria. https://www.R-project.org/
- Reid et al. (2014) Reid, M. J., Menten, K. M., Brunthaler, A., et al. 2014, ApJ, 783, 130, doi: 10.1088/0004-637X/783/2/130
- Riquelme et al. (2022) Riquelme et al. 2022, in prep.
- Risacher et al. (2018) Risacher, C., Güsten, R., Stutzki, J., et al. 2018, Journal of Astronomical Instrumentation, 7, 1840014, doi: 10.1142/S2251171718400147
- Röllig et al. (2016) Röllig, M., Simon, R., Güsten, R., et al. 2016, A&A, 591, A33, doi: 10.1051/0004-6361/201526267
- Sánchez-Monge et al. (2017) Sánchez-Monge, Á., Schilke, P., Schmiedeke, A., et al. 2017, A&A, 604, A6, doi: 10.1051/0004-6361/201730426
- Santa-Maria et al. (2021) Santa-Maria, M. G., Goicoechea, J. R., Etxaluze, M., Cernicharo, J., & Cuadrado, S. 2021, A&A, 649, A32, doi: 10.1051/0004-6361/202040221
- Schmiedeke et al. (2016) Schmiedeke, A., Schilke, P., Möller, T., et al. 2016, A&A, 588, A143, doi: 10.1051/0004-6361/201527311
- Simpson (2018) Simpson, J. P. 2018, ApJ, 857, 59, doi: 10.3847/1538-4357/aab55b
- Simpson et al. (2018) Simpson, J. P., Colgan, S. W. J., Cotera, A. S., Kaufman, M. J., & Stolovy, S. R. 2018, ApJ, 867, L13, doi: 10.3847/2041-8213/aae8e4
- Simpson et al. (2021) —. 2021, ApJ, 910, 59, doi: 10.3847/1538-4357/abe636
- Smith et al. (2017) Smith, J. D. T., Croxall, K., Draine, B., et al. 2017, ApJ, 834, 5, doi: 10.3847/1538-4357/834/1/5
- Smithsonian Astrophysical Observatory (2000) Smithsonian Astrophysical Observatory. 2000, SAOImage DS9: A utility for displaying astronomical images in the X11 window environment. http://ascl.net/0003.002
- Sofia et al. (2004) Sofia, U. J., Lauroesch, J. T., Meyer, D. M., & Cartledge, S. I. B. 2004, ApJ, 605, 272, doi: 10.1086/382592
- Sormani et al. (2020) Sormani, M. C., Tress, R. G., Glover, S. C. O., et al. 2020, MNRAS, 497, 5024, doi: 10.1093/mnras/staa1999
- Stacey et al. (2010a) Stacey, G. J., Charmandaris, V., Boulanger, F., et al. 2010a, ApJ, 721, 59, doi: 10.1088/0004-637X/721/1/59
- Stacey et al. (1991) Stacey, G. J., Geis, N., Genzel, R., et al. 1991, ApJ, 373, 423, doi: 10.1086/170062
- Stacey et al. (2010b) Stacey, G. J., Hailey-Dunsheath, S., Ferkinhoff, C., et al. 2010b, ApJ, 724, 957, doi: 10.1088/0004-637X/724/2/957
- Sternberg & Dalgarno (1995) Sternberg, A., & Dalgarno, A. 1995, ApJS, 99, 565, doi: 10.1086/192198
- Stolovy et al. (2006) Stolovy, S., Ramirez, S., Arendt, R. G., et al. 2006, in Journal of Physics Conference Series, Vol. 54, Journal of Physics Conference Series, 176–182, doi: 10.1088/1742-6596/54/1/030
- Tielens & Hollenbach (1985) Tielens, A. G. G. M., & Hollenbach, D. 1985, ApJ, 291, 722, doi: 10.1086/163111
- Tress et al. (2020) Tress, R. G., Sormani, M. C., Glover, S. C. O., et al. 2020, MNRAS, 499, 4455, doi: 10.1093/mnras/staa3120
- Ungerechts et al. (1997) Ungerechts, H., Bergin, E. A., Goldsmith, P. F., et al. 1997, ApJ, 482, 245, doi: 10.1086/304110
- van Dishoeck & Black (1988) van Dishoeck, E. F., & Black, J. H. 1988, ApJ, 334, 771, doi: 10.1086/166877
- Vogel et al. (1987) Vogel, S. N., Genzel, R., & Palmer, P. 1987, ApJ, 316, 243, doi: 10.1086/165196
- Wiesenfeld & Goldsmith (2014) Wiesenfeld, L., & Goldsmith, P. F. 2014, ApJ, 780, 183, doi: 10.1088/0004-637X/780/2/183
- Wolfire et al. (1990) Wolfire, M. G., Tielens, A. G. G. M., & Hollenbach, D. 1990, ApJ, 358, 116, doi: 10.1086/168966
- Young et al. (2012) Young, E. T., Becklin, E. E., Marcum, P. M., et al. 2012, ApJ, 749, L17, doi: 10.1088/2041-8205/749/2/L17