On Charon’s Far-Ultraviolet Surface Reflectance
Abstract
We present the first measurements of Charon’s far-ultraviolet surface reflectance, obtained by the Alice spectrograph on New Horizons. We find no measurable flux shortward of 1650 Å, and Charon’s geometric albedo is () at 1600 Å. From 1650–1725 Å Charon’s geometric albedo increases to , and remains nearly constant until 1850 Å. As this spectral shape is characteristic of \ceH2O ice absorption, Charon is the first Kuiper belt object with a \ceH2O ice surface to be detected in the far-ultraviolet. Charon’s geometric albedo is times lower than Enceladus’ at these wavelengths, but has a very similar spectral shape. We attribute this to similarities in their surface compositions, and the difference in absolute reflectivity to a high concentration or more-absorbing contaminants on Charon’s surface. Finally, we find that Charon has different solar phase behavior in the FUV than Enceladus, Mimas, Tethys, and Dione, with a stronger opposition surge than Enceladus and a shallower decline at intermediate solar phase angles than any of these Saturnian satellites.
1 Introduction
NASA’s New Horizons mission completed its historic flyby of the Pluto system in July 2015 (Stern et al., 2015a). For much of the far-ultraviolet (FUV) Pluto’s atmosphere is optically thick (Young et al., 2018), which complicates efforts to measure its surface reflectance. Nevertheless, Steffl et al. (2020) found that Pluto has a wavelength-independent surface reflectance () of 0.17 between 1400 and 1850 Å.
Pluto’s FUV reflectance is in the middle of the range found for other icy bodies. For example, the FUV reflectance of Comet 67P/Churyumov-Gerasimenko is only 0.01–0.02 (Stern et al., 2015b). The FUV reflectance of icy Saturnian satellites varies over a wide range, from (Phoebe, Iapetus, Dione, Rhea; Hendrix & Hansen, 2008a, b; Hendrix et al., 2018), to comparable to Pluto (Mimas, Tethys; Hendrix et al., 2018), to (Enceladus; Hendrix et al., 2010, 2018).
Except for Pluto, all of these bodies show the characteristic upturn in reflectance near 1650 Å that is diagnostic of \ceH2O ice. Impurities in the \ceH2O ice matrix can alter the shape of the upturn (e.g., Ganymede; Molyneux et al., 2020) and different grain sizes can shift the wavelength where the upturn begins (Hendrix & Hansen, 2008a), but neither can produce a constant FUV reflectance between 1400 and 1850 Å. The brightest regions on Pluto are dominated by \ceCH4, \ceN2, and \ceCO ices (Stern et al., 2015a; Grundy et al., 2016), none of which show an FUV absorption feature. Thus, it is not surprising that Pluto’s FUV surface reflectance has a different spectral shape than other icy bodies with surfaces composed mostly of water ice.
Charon’s mid-ultraviolet (mid-UV) reflectance was previously measured by the Hubble Space Telescope (HST), finding a nearly constant geometric albedo of from 2250–3300 Å (Krasnopolsky, 2001; Stern et al., 2012). Its FUV reflectance could not be measured due to reduced solar flux at these wavelengths.
Here we report the first measurements of Charon’s FUV surface reflectance, measured by New Horizons’ Alice ultraviolet spectrograph (Stern et al., 2008). Unlike Pluto, Charon’s surface is composed primarily of \ceH2O ice (Buie et al., 1987; Grundy et al., 2016), so its FUV reflectance should more closely resemble that of the icy satellites of the giant planets. We detail the Alice observations of Charon in Section 2. Section 3 presents Charon’s FUV surface reflectance and discusses its implications. We summarize our conclusions in Section 4.
| Observing | UTC Start | aaMedian signal-to-noise ratio per pixel (1.8 Å) in the wavelength range 1650–1850 Å. | Range | Apparent | Solar | Sub-S/CbbThe sub-spacecraft longitude of Charon at the time of observation. | ccVariance-weighted mean of Charon from 1750–1850 Å; the first uncertainty is the random uncertainty and the second is the systematic uncertainty (see Section 3.1). | |||
|---|---|---|---|---|---|---|---|---|---|---|
| Sequence | Diameter | Phase | Lon. | |||||||
| (s) | (s) | (km) | (deg) | (deg) | (deg) | |||||
| PC_Airglow_Fill_2 | 2015-07-13 19:14:11 | 2680 | 2680 | 5.0 | 814,601 | 0.085 | 16.61 | 5\@alignment@align.28 | 0.0771±0.0016±0.0008 | |
| PC_Airglow_Appr_1 | 2015-07-13 23:25:11 | 600 | 600 | 3.2 | 625,079 | 0.111 | 17.28 | -3\@alignment@align.06 | 0.0714±0.0025±0.0022 | |
| PC_Airglow_Appr_4 | 2015-07-14 05:20:31 | 600 | 534 | 4.1 | 331,578 | 0.209 | 19.74 | -14\@alignment@align.64 | 0.0706±0.0018±0.0022 | |
| C_LEISA_LORRI_1 | 2015-07-14 09:15:23 | 314 | 108 | 2.7 | 140,023 | 0.495 | 26.83 | -17\@alignment@align.65 | 0.0623±0.0024±0.0022 | |

2 Observations
The Alice instrument aboard New Horizons is a lightweight, low-power spectrograph with a bandpass of 520–1870 Å (Stern et al., 2008). Its imaging microchannel plate detector produces a data array, but only the central pixels are illuminated. This study uses the narrow () portion of the Alice entrance slit, which covers the bottom two-thirds of the detector. Each detector row subtends in the spatial dimension, and the filled-slit spectral resolution is 9 Å.
Table 1 summarizes the Alice observations of Charon, listing: (1) observing sequence identifier; (2) UTC start time of the exposures analyzed; (3) total exposure time of the exposures analyzed; (4) effective exposure time (i.e., the total time Charon was in the Alice slit) of the exposures analyzed; (5) median signal-to-noise ratio per pixel for Charon in the wavelength range 1650–1850 Å; (6) New Horizons’ range to Charon; (7) Charon’s apparent angular diameter; (8) Charon’s solar phase angle; (9) Charon’s sub-spacecraft longitude; and (10) Charon’s variance-weighted mean from 1750–1850 Å and its random and systematic uncertainties (see Section 3.1). These observations were obtained as part of longer “observing sequences,” or collections of exposures obtained for the same scientific purpose. Within each sequence, we focus our analysis on the subset of exposures where Charon’s position in the Alice slit is relatively stable (i.e., there is minimal jitter), and only details of those exposures are tabulated.
Figure 2 shows the positions of Pluto and Charon in the Alice slit for each observing sequence. These snapshots are calculated at the midpoint of each observing sequence, or the midpoint of Charon’s scan through the slit if , as are the Charon-specific values in Table 1. We analyze nine exposures in PC_Airglow_Fill_2, and it is the only sequence in which Charon’s angular diameter is smaller than the Alice slit width. PC_Airglow_Appr_1 consists of two 300-s exposures and the pointing is stable throughout. Charon’s position in the slit is also stable during the first three 150-s exposures of PC_Airglow_Appr_4, but it drifts out of the slit partway through the final exposure. Finally, C_LEISA_LORRI_1 is a single integration where Charon scans through the slit mid-exposure. The effective exposure time for PC_Airglow_Appr_4 and C_LEISA_LORRI_1 is the amount of time that Charon was in the slit during the exposures analyzed, as determined by the GeoViz111https://geoviz.space.swri.edu/ software package (Throop et al., 2009) using SPICE kernels (Acton et al., 2018) created from reconstructed instrument pointing.
All exposures were corrected as described in Steffl et al. (2020) for the effects of detector dead time, dark counts, and scattered light from the wings of the Ly profile generated by hydrogen in the interplanetary medium. Spectra of Charon were then extracted from individual exposures, and when possible exposures from the same observing sequence were combined using a variance-weighted mean. These coadditions are shown in Figure 4, along with the solar spectrum at Pluto arbitrarily reduced to fit on the scale of the plot. We adopt the solar spectrum of Young et al. (2018), which combines SUMER reference spectra (Curdt et al., 2001) with observations from TIMED/SEE (Woods et al., 2005) for the New Horizons observation dates.
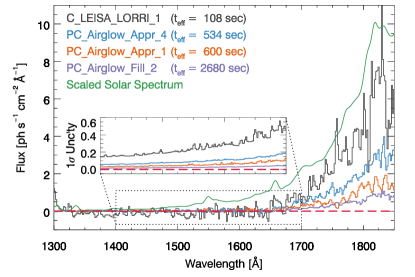
Owing largely to declining solar flux, Charon shows no observable flux below 1650 Å in any of the sequences, and the observed flux at longer wavelengths increases as New Horizons approaches Charon. However, Charon’s position in the Alice slit is most stable (i.e., its is largest) when New Horizons is far from Charon. The combination of these effects leads to the modest and relatively constant signal-to-noise ratios in Table 1.
3 Results and Discussion
We determine the radiance of Charon in each observing sequence by dividing the fluxes in Figure 4 by Charon’s solid angle as observed by Alice. We then take the ratio of Charon’s radiance to the radiance of a Lambertian surface normally illuminated by the Sun (i.e., ) to derive Charon’s surface reflectance (). The spectral shape of Charon’s is the same in all sequences, and the inset of Figure 6 shows the surface reflectance from PC_Airglow_Appr_4 as an example. The characteristic upturn from \ceH2O ice absorption is present, as the reflectance rapidly increases from zero blueward of 1650 Å to 0.07 at 1725 Å, and remains at that level until 1850 Å.
3.1 Solar Phase Dependence
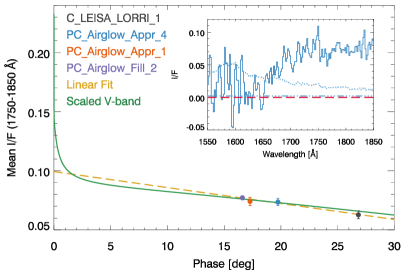
Figure 6 shows Charon’s variance-weighted mean from 1750–1850 Å as a function of solar phase angle. We estimate two different statistical uncertainties in Charon’s surface reflectance. The first is a random uncertainty based on photon-counting (i.e., Poisson) statistics and the second is a systematic uncertainty that accounts for Charon’s motion in the Alice slit. We assume a 3% systematic pointing uncertainty for sequences where Charon fills the slit, and a 1% pointing uncertainty for sequences where it does not. Further, for sequences where we assume a 2-s uncertainty on .
Since Charon’s is nearly constant at these wavelengths (see Figure 6 inset) and we average over spectral pixels, the random uncertainties in the mean are small despite the modest signal-to-noise ratio of the data; however, the systematic uncertainties are not reduced when averaging. The error bars in Figure 6 are the quadrature sum of the random and systematic uncertainties for each sequence. Their individual contributions are listed in the final column of Table 1.
We use the photometric model of (Verbiscer et al. 2021, in preparation) to study changes in Charon’s relative FUV reflectance with solar phase. This model expands upon the models of Buratti et al. (2019) and Howett et al. (2021) by fitting New Horizons LORRI images and HST images from Programs 13667 (Buie PI), 15261 (Verbiscer PI), and 15505 (Verbiscer PI). The phase angle ranges of the Buratti et al. and Howett et al. data sets were –. The phase angle range of the Verbiscer et al. data set was –, and included 10 points between and from HST Programs 15261 and 15505 that were not included in the previous analyses.
The best-fit Hapke (2012) parameters for the Verbiscer et al. (2021, in preparation) model are a single-scattering albedo at 5500 Å of , two-term Henyey & Greenstein (1941) phase function parameters of and , macroscopic roughness of , shadow-hiding amplitude of and width of , and coherent backscatter amplitude of and width of . A least-squares fit finds that the solar phase curve of Verbiscer et al. (2021, in preparation) matches the Alice data when a multiplicative scale factor of is applied, as was done to produce the solid line in Figure 6; this is equivalent to the Verbiscer et al. solar phase curve with a single-scattering albedo at 1800 Å of . Once this multiplicative scale factor is applied, the scaled -band model is consistent with the Alice measurements obtained at phase angles of – (see Table 1), as is a simple linear fit (Figure 6), but they have very different predictions for Charon’s surface reflectance at zero phase. We discuss this in detail in Section 3.3.
Charon’s FUV phase coefficient (the slope of the solar phase curve; see dashed line in Figure 6) over the range of solar phase angles probed by Alice is mag/deg. This value is much lower than that of Dione’s leading hemisphere (0.039 mag/deg; Royer & Hendrix, 2014) measured over the same range in solar phase angle. With the exception of Enceladus, all other icy Saturnian satellites studied by Cassini/UVIS have steeper solar phase curves than Dione’s leading hemisphere (see Section 3.4). This difference in solar phase behavior may be due to E-ring particle and/or high-energy electron bombardment in the Saturn system that Charon does not experience. It may also result from physical processes unique to Charon; e.g., conversion of seasonally cold-trapped non-water volatiles escaping from Pluto’s atmosphere into reddish tholins in Mordor Macula by photolysis/radiolysis (Grundy et al., 2016).
3.2 Charon’s Partial FUV Rotation Curve
We use the scaled -band phase curve from Figure 6 to compensate for the varying solar phase angles of each observing sequence. After this correction is applied we can search for brightness changes in Charon’s FUV rotation curve, despite the limited rotational range ( or of a rotation) covered by the Alice observations. The result is shown in Figure 8.

We find no evidence of variability as a function of longitude in the Alice observing sequences. All of the sequences are consistent with the model expectation, and each other, to within the statistical uncertainties. The maximum absolute deviation from the model expectation is % and the maximum deviation among the Alice sequences is %. These uncertainties take into account the uncertainty in the multiplicative scale factor for the -band phase curve. This result is consistent with Charon’s -band rotation curve, which has an amplitude of just 8% (0.08 mag; Buie et al., 1997, 2010).
We have also searched for hemispherical differences in Charon’s brightness in PC_Airglow_Appr_4 and C_LEISA_LORRI_1, where Charon subtends more than one spatial row on the Alice detector. We find no row-to-row variations in either spectrum at the level. However, the modest signal-to-noise ratio of the data precludes us from detecting variations %.
Although the above limits on Charon’s rotational (longitudinal) and hemispherical (latitudinal) FUV surface reflectance variations are not particularly constraining, it will likely be decades before another FUV spectrograph obtains superior data of Charon. Thus, we believe it is important to report the results derived from all the data in hand, even if they are inconclusive.
3.3 Charon’s FUV Geometric Albedo
The Alice observing sequences must be corrected to zero phase to determine Charon’s FUV geometric albedo. Both the scaled -band solar phase curve of Verbiscer et al. (2021, in preparation) and a simple linear fit are a good match to the Alice data (Figure 6) at solar phase angles of –. Extrapolating these curves to zero phase yields geometric albedos of and , respectively. The random statistical uncertainties of these predictions are much smaller than the variation between them, so the systematic uncertainty of extrapolating to zero phase in the absence of constraining FUV data clearly dominates.
Since it predicts no opposition surge at all, the linear fit to the Alice data sets a lower bound on Charon’s geometric albedo at 1800 Å. The scaled -band model predicts a very strong opposition surge; however, the strength of the opposition surge varies with wavelength and is weaker in the FUV than in -band (Hapke, 2021). Therefore, we treat the scaled -band model as an upper bound to Charon’s geometric albedo at 1800 Å. Even though the strength of the opposition surge is weaker in the FUV than in -band, we nonetheless expect one to be present in the FUV since bodies such as Charon with intermediate albedos are found to have the strongest opposition surges (Nelson et al., 2004; Hapke, 2021). In the discussion below we adopt a value halfway between the bounds discussed above; i.e., a geometric albedo of .
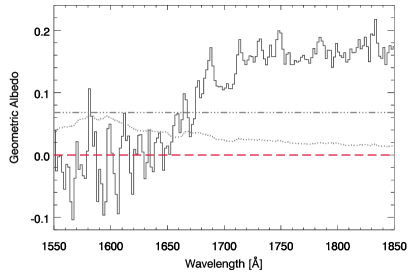
Since there is no evidence of brightness variations in Charon’s FUV rotation curve (Figure 8), after correcting each sequence to zero phase we combine them using a variance-weighted mean to increase the signal-to-noise ratio. Figure 10 shows the geometric albedo of Charon obtained from averaging all of the Alice observing sequences. A least-squares fit to the plateau in the 1710–1850 Å region finds a geometric albedo of at 1800 Å and a slope of % per 1000 Å; this slope is only valid for the relatively flat region from 1710-1850 Å, not the transition region from approximately 1650-1700 Å. Charon’s geometric albedo is () at 1600 Å, derived from a variance-weighted mean of the measurements from 1550-1650 Å. The uncertainties on these values only take into account the random uncertainty in Charon’s geometric albedo. Its systematic uncertainty is much larger, as discussed above.
Charon’s geometric albedo at 1800 Å is lower than the value of from 2250–3000 Å found by HST (Krasnopolsky, 2001; Stern et al., 2012). Although the FUV spectral slope is substantial, it is not large enough to reconcile the measurements, predicting a geometric albedo of at 2250 Å using the linear fit to the 1710–1850 Å region described above. However, this difference is not surprising since Charon is composed primarily of \ceH2O ice, like the Saturnian satellites, and \ceH2O-ice-rich surfaces decrease strongly in reflectance between 2250 Å and 1850 Å (e.g., Hendrix et al., 2018). The scaled -band phase curve of Verbiscer et al. (2021, in preparation) predicts a geometric albedo at 1800 Å that is much closer to the value measured by HST at 2250 Å, which we interpret as further evidence that it can be treated as an upper bound to Charon’s FUV geometric albedo.
| Satellite | Hemisphere | 1800 Å | 3000 Å | 5500 Å |
|---|---|---|---|---|
| Charon | 0.166±0.068 | 0.25±0.01^(1) | 0.41±0.01^(2) | |
| Mimas | Leading | 0.37^(3) | 0.583^(4) | 0.920±0.004^(5) |
| Trailing | 0.38^(3) | 0.639^(4) | 1.008±0.004^(5) | |
| Enceladus | Leading | 0.59^(4) | 0.881^(4) | 1.329±0.008^(5) |
| Trailing | 0.63^(4) | 0.944^(4) | 1.425±0.008^(5) | |
| Tethys | Leading | 0.46^(3) | 0.868^(4) | 1.288±0.005^(5) |
| Trailing | 0.31^(3) | 0.652^(4) | 1.175±0.005^(5) | |
| Dione | Leading | 0.27^(3) | 0.799^(4) | 1.261±0.004^(5) |
| Trailing | 0.14^(3) | 0.424^(4) | 0.826±0.004^(5) | |
| Rhea | Leading | ∼0.16^(4) | 0.572^(4) | 1.077±0.003^(5) |
| Trailing | ∼0.12^(4) | 0.439^(4) | 0.848±0.002^(5) |
3.4 Comparisons to Icy Saturnian Satellites
Charon’s geometric albedos in the FUV, mid-UV, and visible are compared to the albedos of icy Saturnian satellites in Section 3.3. Since the Saturnian satellites often show leading-trailing hemispheric brightness differences, we tabulate them separately. All of the satellites in Section 3.3 are considerably brighter in the visible than the UV; however, the steepness of the decline varies. Between 5500 Å and 3000 Å, the albedo of all satellites declines by a factor of 1.5–2. The range is wider between 3000 Å and 1800 Å, where the albedos of Charon, Mimas, Enceladus, and Tethys decline by a factor of , and the albedos of Dione and Rhea decline by a factor of 3–4. Overall, the albedos of these satellites decrease by factors ranging from 2.3 (Enceladus) to (Rhea) between 5500 Å and 1800 Å.
Comparing the albedos at each wavelength finds that Mimas (2.2–2.6) and Enceladus (3.2–3.9) have the most consistent albedo ratios compared to Charon. This suggests that their spectral shapes from the FUV to the visible are most similar to Charon’s. Rhea and the trailing hemisphere of Dione are the most dissimilar to Charon because their albedos are comparable at 1800 Å but more than two times larger at 5500 Å.
Figure 12 compares the geometric albedo of Charon as a function of wavelength to that of Enceladus using Cassini/UVIS data from Hendrix et al. (2018). After reducing the geometric albedo of Enceladus by a factor of 3.7 (the hemispherically-averaged ratio of their albedos at 1800 Å from Section 3.3), we find that the FUV spectrum of Enceladus is a good match to Charon’s, as the preceding comparison suggested.
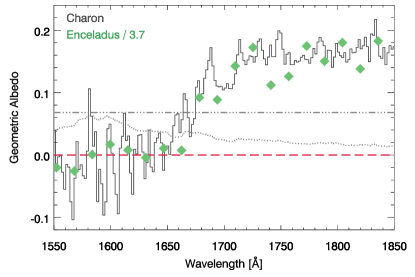
Hendrix et al. (2010) found that the reflectance of Enceladus from the FUV through the visible could be explained if its surface is composed of primarily \ceH2O ice with a small amount of \ceNH3 and a small amount of tholin. New Horizons observations of Charon in the visible and near-infrared find a very similar composition (Grundy et al., 2016); \ceH2O ice comprises most of the surface, but there are isolated areas of exposed \ceNH3 ice or ammoniated hydrates, and Mordor Macula at its north pole is blanketed in red tholins. Thus, it is not surprising that the reflectances of Enceladus and Charon have similar FUV spectral shapes.
The tholins modeled by Hendrix et al. (2010) have wavelength-independent reflectances of in the FUV and act as spectrally neutral darkening agents at these wavelengths. Further, other surface contaminants such as silicates, sulfur compounds, and organics that are not tholins can also be spectrally neutral in the FUV (see, e.g., Molyneux et al., 2020). Thus, the lower overall FUV reflectance of Charon compared to Enceladus could plausibly be explained by Charon having more and/or less-reflective surface contaminants. The presence of large, dark terrains on Charon (e.g., Mordor Macula) supports this hypothesis, as does Enceladus’ much higher visible albedo (Section 3.3).
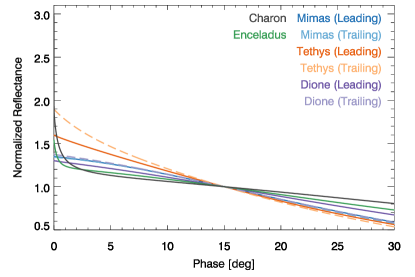
As discussed in Section 3.1, Charon’s solar phase behavior differs from that of the Saturnian satellites. This is illustrated in Figure 14, which compares Hapke (2012) model fits for Charon (Verbiscer et al. 2021, in preparation), Enceladus (Hendrix et al., 2010), and the leading and trailing hemispheres of Mimas, Tethys, and Dione (Royer & Hendrix, 2014) at solar phase angles of –. To emphasize the effects of solar phase variations at angles near where Charon was observed (see Figure 6), all these fits have been normalized to one at a solar phase angle of 15.
Enceladus and the leading hemisphere of Dione (Section 3.1) exhibit the shallowest declines with increasing solar phase of the Saturnian satellites. Dione’s trailing hemisphere and both hemispheres of Mimas have very similar solar phase behavior. Both hemispheres of Tethys decline somewhat more steeply than Mimas and Dione, as noted by Royer & Hendrix (2014).
Charon’s brightness variation with solar phase is most simlar to Enceladus’. However, Charon has a stronger opposition surge (its brightness diminishes by % from –) than Enceladus, followed by a shallower decline than any of the Saturnian satellites between phase angles of and . We caution that Charon’s opposition surge should only be directly compared to Enceladus’ because Verbiscer et al. (2021, in preparation) and Hendrix et al. (2010) incorporate both the shadow-hiding and coherent backscatter opposition effects in their Hapke (2012) models, whereas Royer & Hendrix (2014) only model the shadow-hiding opposition effect. It is beyond the scope of this work to determine why Charon’s solar phase behavior differs from these Saturnian satellites, but we speculate that it is linked to their different physical environments.
Finally, we compare the FUV reflectances of Charon and Iapetus. Both satellites have similar sizes ( km diameter for Iapetus compared to km for Charon; Roatsch et al., 2009; Stern et al., 2015a), and Iapetus’ location well outside Saturn’s E-ring yields a more benign environment than for the Saturnian satellites in Section 3.3. The leading hemisphere of Iapetus is much darker than its trailing hemisphere, which has a very similar geometric albedo (; Blackburn et al., 2010) to Charon’s in the visible. The geometric albedo of Iapetus in the FUV has not been published, but Hendrix & Hansen (2008a) found that its bright terrain has at 1800 Å and a solar phase angle of . Using the scaled -band phase curve of Verbiscer et al. (2021, in preparation) to adjust Charon’s 1800-Å reflectance, we predict that Charon would have at the same solar phase. Thus, Charon’s reflectance is % larger than Iapetus’ bright, trailing hemisphere in the FUV, even though Iapetus trailing hemisphere is slightly more reflective than Charon in the visible.
4 Conclusions
We have measured Charon’s FUV surface reflectance for the first time by combining data from four observing sequences acquired by the Alice imaging spectrograph during the New Horizons flyby of the Pluto system. We find that Charon has the upturn in reflectance at 1650 Å that is diagnostic of \ceH2O ice. This is reassuring since it has long been known that \ceH2O ice is the primary constituent of Charon’s surface (Buie et al., 1987).
We find that the relative change in Charon’s FUV reflectance with varying solar phase is well-described by its -band phase curve (Verbiscer et al. 2021, in preparation) scaled by a multiplicative factor of (Figure 6). We do not observe rotational variability in Charon’s FUV reflectance, at least over the small range of rotation we sampled.
Charon has a geometric albedo of () at 1600 Å and at 1800 Å (Figure 10), which makes it darker in the FUV than the mid-UV (Krasnopolsky, 2001; Stern et al., 2012). We compare Charon’s geometric albedo to that of the icy Saturnian satellites, and find that Charon and Enceladus have very similar spectral shapes in the FUV (Figure 12), although Enceladus is 3.7 times more reflective than Charon. We attribute the similarities in spectral shape to \ceH2O ice being the primary constituent of both bodies, and attribute the difference in absolute reflectance to a larger contribution of surface contaminants on Charon compared to Enceladus.
Finally, we compare Charon’s solar phase behavior at 1800 Å (Figure 14) to that of Enceladus, Mimas, Tethys, and Dione (Hendrix et al., 2010; Royer & Hendrix, 2014). Mimas and the trailing hemisphere of Dione have similar declines in reflectance between solar phases of and , and Tethys declines more steeply. Enceladus’ phase behavior is most similar to Charon’s, but Charon exhibits a stronger opposition surge and a shallower decline from –.
We thank A. Hendrix for Enceladus’ FUV geometric albedo spectrum and helpful discussions. We also thank the Alice team, including our late team member David C. Slater, for an excellent instrument. This work was supported by NASA’s New Horizons project.
References
- Acton et al. (2018) Acton, C., Bachman, N., Semenov, B., & Wright, E. 2018, Planet. Space Sci., 150, 9
- Blackburn et al. (2010) Blackburn, D. G., Buratti, B. J., Ulrich, R., & Mosher, J. A. 2010, Icarus, 209, 738
- Buie et al. (1987) Buie, M. W., Cruikshank, D. P., Lebofsky, L. A., & Tedesco, E. F. 1987, Nature, 329, 522
- Buie et al. (2010) Buie, M. W., Grundy, W. M., Young, E. F., Young, L. A., & Stern, S. A. 2010, AJ, 139, 1117
- Buie et al. (1997) Buie, M. W., Tholen, D. J., & Wasserman, L. H. 1997, Icarus, 125, 233
- Buratti et al. (2017) Buratti, B. J., Hofgartner, J. D., Hicks, M. D., et al. 2017, Icarus, 287, 207
- Buratti et al. (2019) Buratti, B. J., Hicks, M. D., Hillier, J. H., et al. 2019, ApJ, 874, L3
- Curdt et al. (2001) Curdt, W., Brekke, P., Feldman, U., et al. 2001, A&A, 375, 591
- Grundy et al. (2016) Grundy, W. M., Binzel, R. P., Buratti, B. J., et al. 2016, Science, 351, aad9189
- Hapke (2012) Hapke, B. 2012, Theory of reflectance and emittance spectroscopy, 2nd edn. (Cambridge Univ. Press)
- Hapke (2021) —. 2021, Icarus, 354, 114105
- Hendrix et al. (2018) Hendrix, A. R., Filacchione, G., Paranicas, C., Schenk, P., & Scipioni, F. 2018, Icarus, 300, 103
- Hendrix & Hansen (2008a) Hendrix, A. R., & Hansen, C. J. 2008a, Icarus, 193, 323
- Hendrix & Hansen (2008b) —. 2008b, Icarus, 193, 344
- Hendrix et al. (2010) Hendrix, A. R., Hansen, C. J., & Holsclaw, G. M. 2010, Icarus, 206, 608
- Henyey & Greenstein (1941) Henyey, L. G., & Greenstein, J. L. 1941, ApJ, 93, 70
- Howett et al. (2021) Howett, C. J. A., Olkin, C. B., Protopapa, S., et al. 2021, in The Pluto System After New Horizons, ed. S. A. Stern, R. P. Binzel, W. M. Grundy, J. M. Moore, & L. A. Young (Tucson: University of Arizona Press)
- Krasnopolsky (2001) Krasnopolsky, V. A. 2001, Icarus, 153, 277
- Molyneux et al. (2020) Molyneux, P. M., Nichols, J. D., Becker, T. M., Raut, U., & Retherford, K. D. 2020, Journal of Geophysical Research (Planets), 125, e06476
- Nelson et al. (2004) Nelson, R. M., Hapke, B. W., Smythe, W. D., Hale, A. S., & Piatek, J. L. 2004, in Lunar and Planetary Science Conference, ed. S. Mackwell & E. Stansbery, Lunar and Planetary Science Conference, 1089
- Roatsch et al. (2009) Roatsch, T., Jaumann, R., Stephan, K., & Thomas, P. C. 2009, in Saturn from Cassini-Huygens, ed. M. K. Dougherty, L. W. Esposito, & S. M. Krimigis (Dordrecht: Springer), 763
- Royer & Hendrix (2014) Royer, E. M., & Hendrix, A. R. 2014, Icarus, 242, 158
- Steffl et al. (2020) Steffl, A. J., Young, L. A., Strobel, D. F., et al. 2020, AJ, 159, 274
- Stern et al. (2012) Stern, S. A., Cunningham, N. J., Hain, M. J., Spencer, J. R., & Shinn, A. 2012, AJ, 143, 22
- Stern et al. (2008) Stern, S. A., Slater, D. C., Scherrer, J., et al. 2008, Space Sci. Rev., 140, 155
- Stern et al. (2015a) Stern, S. A., Bagenal, F., Ennico, K., et al. 2015a, Science, 350, aad1815
- Stern et al. (2015b) Stern, S. A., Feaga, L. M., Schindhelm, E., et al. 2015b, Icarus, 256, 117
- Throop et al. (2009) Throop, H. B., Stern, S. A., Parker, J. W., Gladstone, G. R., & Weaver, H. A. 2009, in AAS/Division for Planetary Sciences Meeting Abstracts, Vol. 41, AAS/Division for Planetary Sciences Meeting Abstracts #41, 68.20
- Verbiscer et al. (2007) Verbiscer, A., French, R., Showalter, M., & Helfenstein, P. 2007, Science, 315, 815
- Woods et al. (2005) Woods, T. N., Eparvier, F. G., Bailey, S. M., et al. 2005, Journal of Geophysical Research (Space Physics), 110, A01312
- Young et al. (2018) Young, L. A., Kammer, J. A., Steffl, A. J., et al. 2018, Icarus, 300, 174