Fold analysis of crumpled sheet using micro computed tomography
Abstract
Hand crumpled paper balls involve intricate structure with a network of creases and vertices, yet show simple scaling properties, which suggests self-similarity of the structure. We investigate the internal structure of crumpled papers by the micro computed tomography (micro-CT) without destroying or unfolding them. From the reconstructed three dimensional data, we examine several power laws for the crumpled square sheets of paper of the sizes mm, and obtain the mass fractal dimension by the relation between the mass and the radius of gyration of the balls, and the fractal dimension for the internal structure of each crumpled paper ball by the box counting method in the real space and the structure factors in the Fourier space; The data for the paper sheets are consistent with , suggesting that the self-similarity in the structure of each crumpled ball gives rise to the similarity among the balls with different sizes. We also examine the cellophane sheets and the aluminium foils of the size mm and obtain for both of them. The micro-CT also allows us to reconstruct 3-d structure of a line drawn on the crumpled sheets of paper. The Hurst exponent for the root mean square displacement along the line is estimated as for the length scale shorter than the scale of the radius of gyration, beyond which the line structure becomes more random with .
pacs:
I Introduction
Crumpling a sheet of paper is the easiest way to make effective shock absorbing buffer. A hand crumpled paper ball is very light with typically more than 80% of its volume being empty, still shows strong resistance against compression. These properties make it ideal spacer for box packing. Origin of these properties is the large stretching energy in comparison with the bending energy for a thin paper sheet. As a result, upon crumpling a sheet, Gaussian curvature remains close to zero everywhere except for at singular points of developable cone structures[1, 2, 3, 4]. This imposes stringent constraint on the way how the paper sheet crumples, thus produces strong resistance against compression even if much of the space is still empty[5, 6].
In spite of their complex structure, the balls of crumpled sheet have been known to show simple scaling laws[7, 8, 9]. The radius of the ball follows the scaling relation with the size of the original sheet as
| (1) |
and with the force applied to make the crumpled ball as
| (2) |
The exponents have been estimated as for aluminium foil and paper, and for aluminium foil [7, 8, 9, 6, 5, 10, 11]. The small value of corresponds to the fact that the crumpled sheets resists strongly against compression.
These two power law relations suggest the fractal structure in the object, and may be combined into the single relation[12, 5]
| (3) |
where and are the 2-d Young modulus and the sheet thickness, respectively. The scaling relations (1) and (2), however, represent different aspects of the structure, namely, the former implies the scaling in the structure among the crumpled balls with different sizes, and the latter suggests self-similarity of internal structure of each crumpled ball[13]111 It should be noted that the definition of the applied force and the radius of crumpled ball depend on an experimental protocol. Due to the plasticity and the relaxation involved during and after crumpling, there is certain subtleties in what these values really mean, but we will not go into this problem, simply assuming that such ambiguity does not affect the scaling relations we will study in the present work.
The internal structure of the crumpled paper ball has been studied by examining the crease networks on an unfolded sheets[15, 16, 17, 18], the cross sections obtained by cutting the balls in half[19, 11, 18], or the sequences of holes made by a needle piercing through the balls[13] as well as numerical simulations[12, 20, 21, 22]. These are indirect way of observing the internal structure.
The X-ray micro computed tomography (micro-CT) is computer tomography with the high resolution of the order of 100 m, and makes it possible to study the internal structure of crumpled sheets without either unfolding or destroying them. It has been used to study the crumpled balls of aluminium foil to examine the density distribution, the curvatures of the sheets, and the fractal dimensions of the structure[23, 24, 25]. In this paper, we use micro-CT to examine the internal structure of crumpled sheets of paper, cellophane, and aluminium foils to determine scaling properties of the structure. Experimental procedure is described in Sec.II, the scaling analysis for the observed quantities is provided in Sec.III, experimental results are presented to obtain several exponents in Sec. IV, and the discussions are given in Sec. V.
II Experimental procedure
| Tracing paper | Cellophane | Aluminium foil | |
|---|---|---|---|
| Manufacturer | Kokuyo Co., Ltd. | Toyo Co. | Shimojima Co., Ltd. |
| Thickness [mm] | 0.0385 0.0008 | 0.02030.0002 | 0.01150.0004 |
| Density [] | 42.70.5 | 30.00.7 | 27.40.6 |
Square sheets of tracing paper with the side length 50, 100, 200, and 300 mm are hand crumpled without any specific protocol. Before being scanned, the crumpled balls are left for 7 days under the environment with the temperature C and the humidity % to allow them to settle, in order to avoid structure relaxation during about 30 minutes of the scanning time222 See Supplemental Material at [url] for the relaxation effects during the 7-day waiting time in the sample preparation. . The X-ray micro-CT (inspeXio SMX-100CT, Shimadzu Corporation, Kyoto, Japan) is operated at 40 kV with 100 A, and scans a cubic region of the space with the linear size around cm at a resolution 50150 with around voxels. We also scan hand crumpled cellophane sheets and aluminium foils of the size mm following the same procedure described above except that, in the case of aluminium foil, the samples are scanned on the day when they are crumpled. The thicknesses and densities of the samples are listed in Table 1.
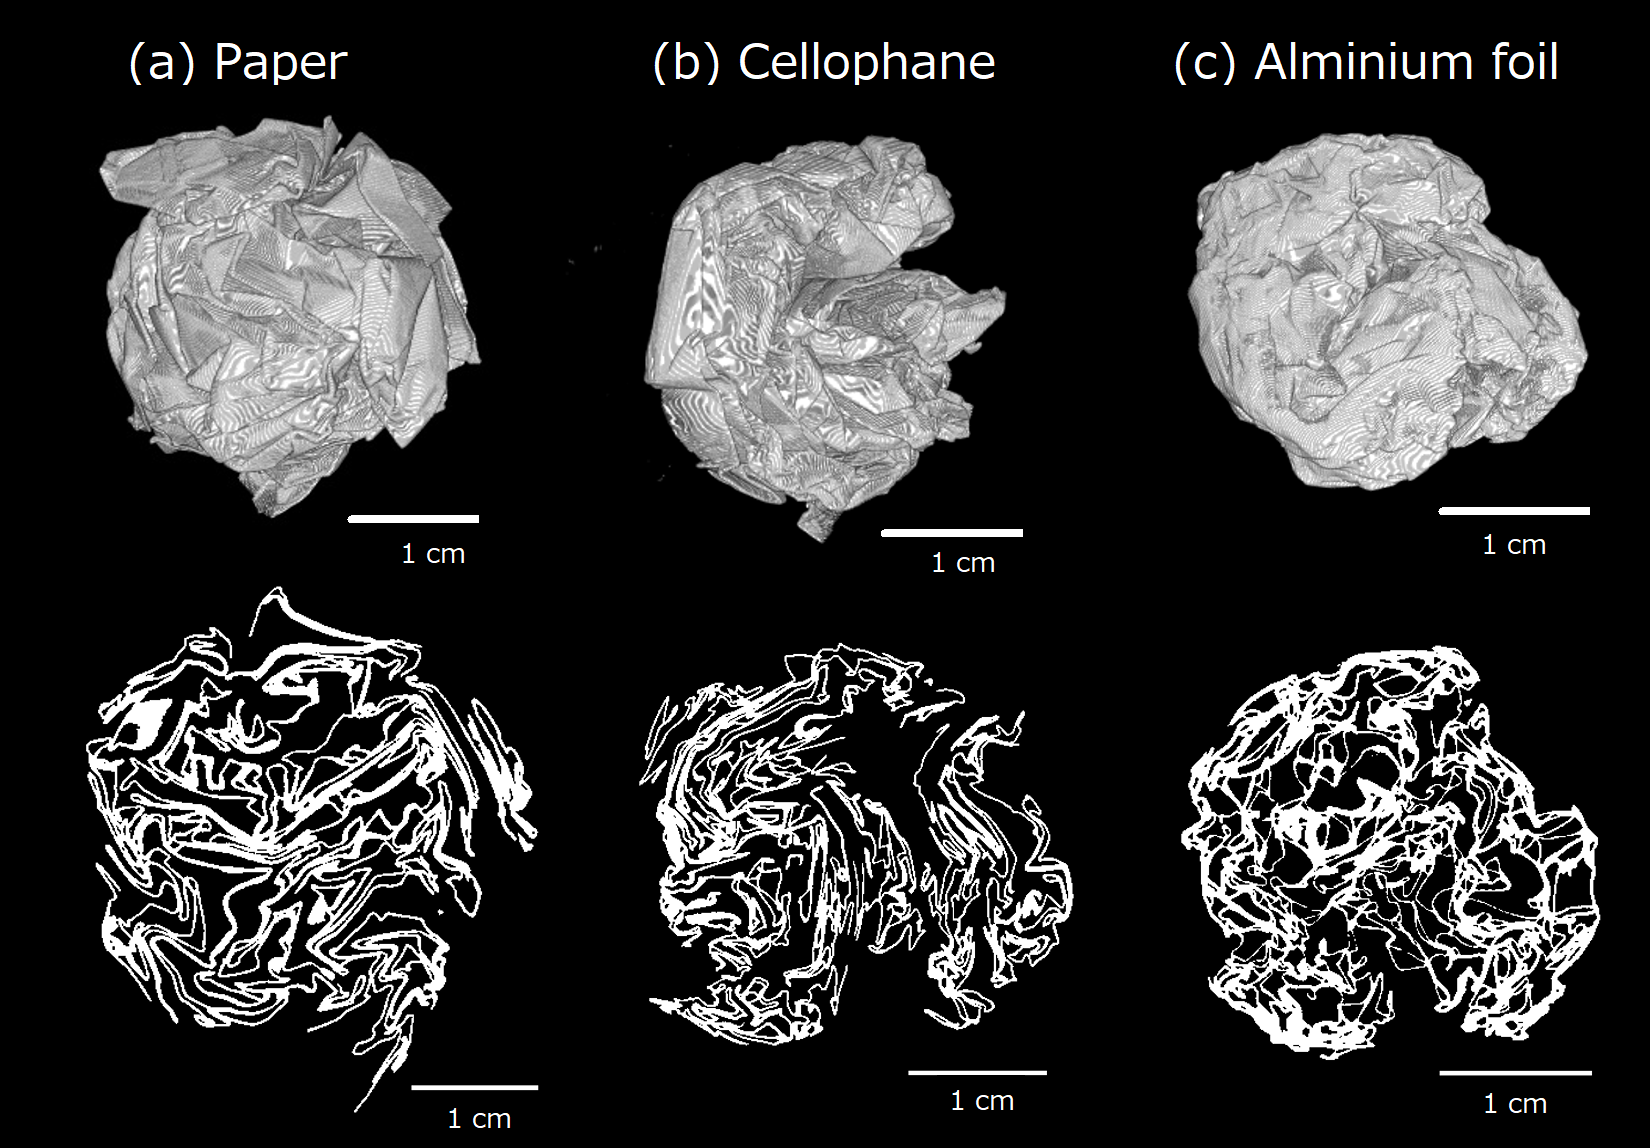
The micro-CT produces grey scale data for each slice of cross section; the black and white binary data are generated by setting appropriate threshold, and then the 3-d structures are reconstructed. Figure 1 shows examples of the reconstructed 3-d structures from the CT images and the cross sections for crumpled paper, cellophane sheet, and aluminium foil.
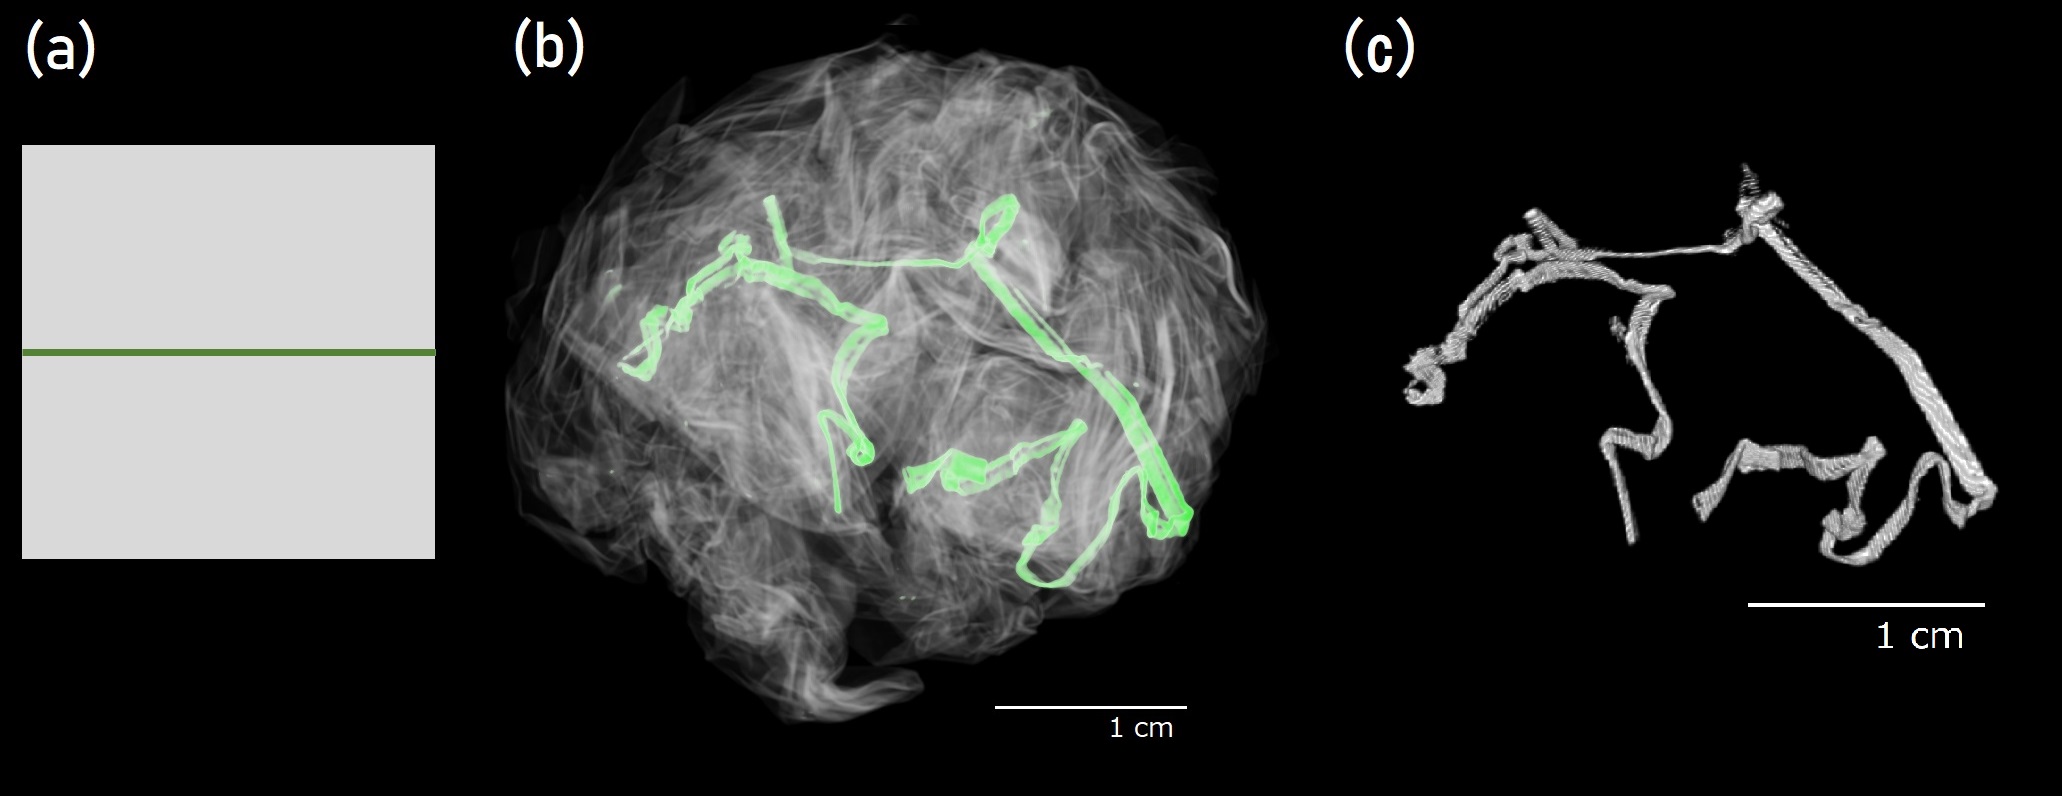
We also reconstruct the 3-d configurations of a line drawn on a crumpled paper (Fig.2). A straight line is drawn using the ink that contains tungsten (Macky gold, Zebra, Tokyo, Japan), which absorbs X-rays more efficiently than the paper. Thus the line positions can be extracted from the CT images by setting a higher threshold than that for the paper structure.
III Observed Quantities and Scaling Analysis
Before we show our experimental results, we give some scaling analysis for the physical quantities we observe.
Three dimensional structure of crumpled sheets:
The mass fractal dimension is defined by the scaling relation between the mass of the paper and the radius of the crumpled paper ball as
| (4) |
Since the mass of the paper is proportional to its area, , the mass fractal dimension is related to the exponent in Eq.(1) as
| (5) |
On the other hand, the fractal dimension of the internal structure of each crumpled ball is measured by the box counting method, using the relation
| (6) |
where is the number of occupied boxes with the linear size .
These two exponents correspond to two distinct features, i.e. the fractal dimension defined by Eq.(6) describes the self-similarity of each crumpled paper ball structure while the mass fractal dimension represents the similarity among crumpled paper balls with different size . However, the self-similar structure of each crumpled paper ball suggests the self-similarity among those of different sizes, and Eq.(6) could be extended as
| (7) |
where is the paper thickness and is the area density of the sheet. This leads to if is identified as the box size that corresponds to , i.e.
| (8) |
The structure factor is the Fourier transform of the density correlation function ,
| (9) |
where the density correlation is defined by
| (10) |
in terms of the density distribution . Here, means the ensemble average. If the structures of the crumpled paper ball are self-similar with the fractal dimension , then the density correlation should be of the scaling form,
| (11) |
then the structure factor is expected to be of the scaling form
| (12) |
Cross section of a crumpled sheet:
A 3-d CT image consists of hundreds of two dimensional slices of the density distribution in the cross sections. We analyze the structure of the cross section which contains the center of mass of the crumpled sheet. Suppose that we take the center of mass of the crumpled sheet as the origin of the co-ordinate, and consider the cross section by the plane. Let denote the 2-d density distribution on the cross section as a function of a position on the plane,
| (13) |
The density correlation on the cross section is defined by
| (14) |
and the structure factor of the cross section is given by the 2-d Fourier transform
| (15) |
where is the wave vector within the cross section plane. If we assume the same form as Eq.(11) for as
| (16) |
then the structure factor would behaves as
| (17) |
which simply shows that the fractal dimension for the cross section is .
Straight line drawn on a crumpled paper:
The CT technique allows us to study the structure of a line drawn on a crumpled paper. A straight line on a flat paper is deformed into a random structure as the paper is crumpled. The configuration of the crumpled line can be represented by the function
| (18) |
where is the distance along the line from one of the end. The root mean square (RMS) distance from one of the end points is defined by
| (19) |
If this shows the power law behavior with the Hurst exponent ,
| (20) |
then the scaling argument based on the self-similarity assumption leads to the scaling law
| (21) |
for the correlation of the line in 3-d space, and the scaling law
| (22) |
for the 3-d structure factor of the line.
The size of the crumpled line is expected to scale with the size of the paper as
| (23) |
If the size of the line should be of the same order with the size of the crumpled ball , and also with RMS of the end-to-end distance of the line of Eq.(20), then the Hurst exponent should be related to the mass fractal dimension as
| (24) |
IV Experimental Results
We analyze the 3-d structures of the crumpled sheet balls, the cross sections of the balls, and the lines drawn on the paper.
Three dimensional structure of crumpled sheets:
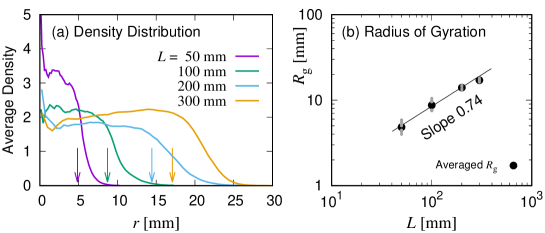
Figure 3(a) shows the averaged density distribution of crumpled paper as a function of the distance from the center of mass . Each line represents the average distribution over the direction and around 10 samples, and the arrows show the average values of the radii of gyration for the corresponding sizes of the paper. One can see that the averaged density distribution inside the ball is roughly uniform, but it is a slightly decreasing function of for the crumpled balls of the smaller sheets and 100 mm, almost constant in the range of mm for that of mm, and slightly increasing in mm for that of mm. It is not clear how this tendency extends to larger sheets. In Fig.3(b), the radii of gyration are plotted against the paper size in the logarithmic scale. The data range is less than one decade and not enough to give a precise value of the exponent, but the plots are consistent with the power law behavior
| (25) |
with the exponent . This gives from Eq.(5).
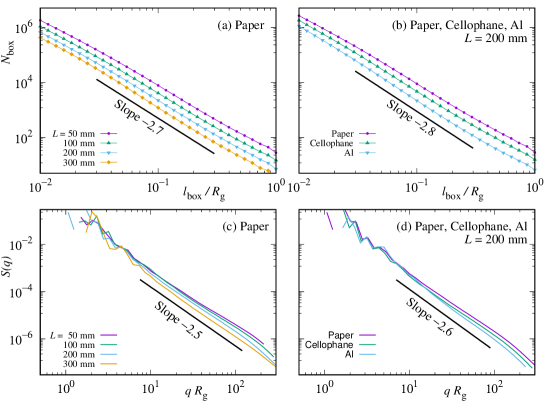
We estimate the fractal dimensions by the box counting method; the number of occupied boxes are plotted against the linear size of the box divided by in the logarithmic scale in Fig.4(a) for paper and (b) for cellophane and aluminium foil. Each data point is an average of about 10 samples. The data for different size or different materials are shifted vertically by multiplying by the factor 2 to avoid overlapping of the plots. The estimated for the crumpled paper is 2.7 from Fig.4(a). This is consistent with estimated by , and suggests the self-similarity in the 3-d structure of the crumpled paper ball as we have discussed. The fractal dimensions for both the cellophane sheet and aluminium foil are estimated as 2.8 from Fig.4(b).
The structure factors for the reconstructed 3-d structures from the CT data are plotted in the logarithmic scale for the paper of sizes mm in Fig.4(c), and for the paper sheets, the cellophane sheets, and the aluminium foils of the size mm in Fig.4(d). Each data point represents averaged value of about 10 samples. These structure factors show the power law behavior
| (26) |
The apparent value of the exponent for the crumpled paper in Fig.4(c) increases with the paper size and the fitted value for the largest paper size mm is . The exponents for the cellophane sheets and the aluminium foils are estimated from the plots for mm in Fig.4(d) as . These values of estimated by are slightly smaller than those of estimated by the box counting method although they should coincide as
| (27) |
from Eq.(12) if the self-similarity holds.
Cross section structure of crumpled sheets:
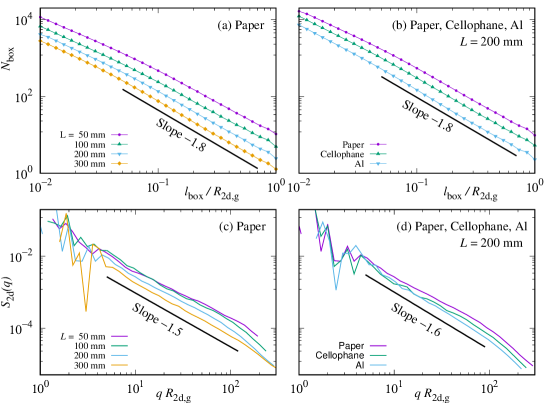
The structure of the cross section of the crumpled sheet is examined in the same way. Figure 5 shows the box counting data and the 2-d structure factor for the cross section of the crumpled sheets; The horizontal axes are scaled by the 2-d radius of gyration
The fractal dimensions for the cross sections are estimated by the box counting method, and we obtain for the paper of the size mm, and for cellophane and aluminium of the size mm. The 2-d structure factor also shows the power law behavior
| (28) |
with the exponent for the paper and for the cellophane and the aluminium. Since the self-similarity leads to the relation
| (29) |
from Eq.(17), the obtained values for are consistent with the corresponding exponents for the 3-d structure.
Structure of a line on a crumpled paper:
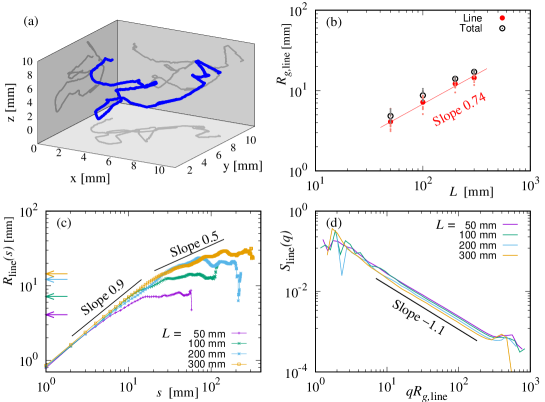
Fig.6(a) shows a configuration of a line one a crumpled paper. The radii of gyration for the lines are plotted as a function of the paper size in Fig.6(b) along with for the whole structure as have been plotted in Fig.3(b); the values of are somewhat smaller than those of , but the plot is consistent with the power law behavior with the same exponents as it should be, i.e.
| (30) |
with . In Fig.6(c), RMS distance defined by Eq.(19) is plotted as a function of in the logarithmic scale to estimate the Hurst exponent . The plot shows roughly the power law behavior
| (31) |
with for the range , beyond which it saturates and seems to follow the power law with a smaller exponent , but the range is too small to determine its behavior with confidence. Finally, Fig.6(d) shows that the 3-d structure factor for the line behaves as
| (32) |
The results by Eqs.(31) and (32) are consistent with the relation (22), but not with the relation (24).
| 3-d structure | cross section | line | ||||||
|---|---|---|---|---|---|---|---|---|
| Paper ( mm) | 0.74 | 2.5 | 2.7 | 1.5 | 1.8 | 0.74 | 0.9 | 1.1 |
| Cellophane ( mm) | 2.6 | 2.8 | 1.6 | 1.8 | ||||
| Aluminium foil ( mm) | 2.6 | 2.8 | 1.6 | 1.8 | ||||
V Discussions
We have estimated several exponents which describe the scaling behaviors of the structure of crumpled sheets; The results are tabulated in Table 2. Considering the range of the data points and the data fluctuations, error bars for each exponent would be around .
As is described in Sec.II, the paper and cellophane samples are scanned 7 days after they are crumpled. This is to avoid the structural relaxation immediately after crumpling and to obtain steady values of measurement. One might wonder if the 7-day waiting time is enough to obtain steady values, especially when logarithmically slow relaxation has been observed up to three weeks in similar systems of crumpled thin sheets[27, 16, 28]. In these works, the slow relaxation is observed in the compaction height under a constant force[27], the diameter of crumpled ball after the folding force is withdrawn[16], and the stress under a constant compression[28]. We have checked if a similar slow relaxation shows any significant effect on the quantities we measure in the present work, but it turns out that the relaxation effects are virtually invisible in the scaling exponents of the structure beyond one hour after crumpling (See Supplemental Material).
As we have discussed in Sec.III, the exponents in Table 2 are related to the two basic exponents: the mass fractal dimension and the fractal dimension . The former represents the scaling behavior among the crumpled balls of the different sheet sizes while the latter describes the self-similarity of the structure of each crumpled sheet. For the paper sheet of the size mm, the mass fractal dimension estimated from by Eq.(5) is . The fractal dimension for the internal structure are estimated from the box counting and the structure factor; The structure factor tends to give smaller values for the fractal dimension as has been found also in [25], but overall data suggest that the fractal dimension is in the range . These estimates are consistent with
| (33) |
within the accuracy of our estimate, suggesting that the self-similarity in the structure of each crumpled ball gives rise to the similarity among the balls with different sizes. For the cellophane and the aluminium with the size 200 mm, the estimated fractal dimension for the structure , which are slightly larger than that for the paper; We do not have data to estimate for the cellophane and the aluminium.
These values for and are somewhat larger than the values obtained for in previous works: 2.51 [9] and 2.12.5 [13] for paper, and 2.5 [7, 8] and 2.3 [5] for aluminium foil. In these estimates, the external diameter is used for the size of the ball while in the present work the radius of gyration calculated from the density distribution is used. This may lead to some difference in estimating especially when the data range is not large enough although they should give the same exponent in the limit of the infinite data range. Note that the fractal dimensions obtained in the present work for cellophane and aluminium foil are for the internal structure of each crumpled ball.
The unique piece of information that the micro-CT can provide is the structure of a line drawn of the crumpled paper sheets. The estimated value of the Hurst exponent for the short length scale suggests that the line configuration is quite ballistic for the length scale up to , but it eventually approaches the random walk for the longer scale. The value of the Hurst exponent is consistent with the relation (22) to the exponent for the structure factor , but not with the relation (24) to or the mass fractal dimension . In other words, for the line on a crumpled paper, the self-similarity of each line structure in the short length scale is not consistent with the overall scaling upon changing the size in contrast to the case of the whole structure of a crumpled paper, in which case , thus the self-similarity of the internal structure is consistent with the global scaling. The existence of these two regimes for the line structure may come from the layered structure of crumpled sheets; The whole structure of crumpled sheets consists of random folding of a wrinkled sheet, and typical scale of random folding is of order of while wrinkling gives shorter length scale with .
Before concluding, let us discuss some of the previous works using CT technique. Lin et al. [25, 24] examined the structure of crumpled aluminium foils by CT. The aluminium foils of different radius mm are crumpled into the ball with the same final radius mm, i.e. different compaction ratios. They estimate the fractal dimension by the box counting and the correlation dimension as a function of the compaction ratio [25]. Their estimates of the dimensions coincide fairly well with our estimates for the aluminium foil by the box counting and the Fourier transform. They also measured the correlation for the tangent vector and observed the layered structure[24].
Cambou and Menon[23] also used CT to examine the internal structure of crumpled aluminium foils. They obtained the mass distribution, the distribution of the normal vector and the curvature radii, and found that they are distributed quite uniformly. They also found the layered structure, but again their orientation is distributed uniformly. These uniform distributions might appear to contradict the fractal structure that has been found in the present work as well as earlier studies[13, 25, 19, 18]. They are, however, not contradicting because what they studied are averaged distributions of the quantities; Spatial inhomogeneity of fractal structure varies from a sample to another, thus does not likely show in the averaged distribution.
In the present work, we did not examine the scaling relation with the applied force, Eq.(2). Its exponent should represent how the crumpling energy increases as a paper sheet is crumpled into a smaller ball, thus should come from the self-similarity of the internal structure, although we do not know yet how it is related with other exponents.
Acknowledgements.
This work is partially supported by JSPS KAKENHI Grant Number JP20K03882.References
- Lobkovsky et al. [1995] A. Lobkovsky, S. Gentges, H. Li, D. Morse, and T. A. Witten, Science 270, 1482 (1995).
- Cerda and Mahadevan [1998] E. Cerda and L. Mahadevan, Phys. Rev. Lett. 80, 2358 (1998).
- Cerda et al. [1999] E. Cerda, S. Chaieb, F. Melo, and L. Mahadevan, Nature 401, 46 (1999).
- Witten [2007] T. A. Witten, Rev. Mod. Phys. 79, 643 (2007).
- Balankin et al. [2007a] A. S. Balankin, I. C. Silva, O. A. Martínez, and O. S. Huerta, Phys. Rev. E 75, 051117 (2007a).
- Lin et al. [2008] Y. C. Lin, Y. L. Wang, Y. Liu, and T. M. Hong, Phys. Rev. Lett. 101, 125504 (2008).
- Kantor et al. [1986] Y. Kantor, M. Kardar, and D. R. Nelson, Phys. Rev. Lett. 57, 791 (1986).
- Kantor et al. [1987] Y. Kantor, M. Kardar, and D. R. Nelson, Phys. Rev. A 35, 3056 (1987).
- Gomes [1987] M. A. Gomes, J. Phys. A: Math. Gen 20, L283 (1987).
- Habibi et al. [2017] M. Habibi, M. Adda-Bedia, and D. Bonn, Soft Matter 13, 4029 (2017).
- Deboeuf et al. [2013] S. Deboeuf, E. Katzav, A. Boudaoud, D. Bonn, and M. Adda-Bedia, Phys. Rev. Lett. 110, 104301 (2013).
- Vliegenthart and Gompper [2006] G. A. Vliegenthart and G. Gompper, Nature Materials 5, 216 (2006).
- Balankin et al. [2007b] A. S. Balankin, R. C. M. de Oca, and D. S. Ochoa, Phys. Rev. E 76, 032101 (2007b).
- Note [1] It should be noted that the definition of the applied force and the radius of crumpled ball depend on an experimental protocol. Due to the plasticity and the relaxation involved during and after crumpling, there is certain subtleties in what these values really mean, but we will not go into this problem, simply assuming that such ambiguity does not affect the scaling relations we will study in the present work.
- Blair and Kudrolli [2005] D. L. Blair and A. Kudrolli, Phys. Rev. Lett. 94, 166107 (2005).
- Balankin et al. [2006] A. S. Balankin, O. S. Huerta, R. Cortes Montes de Oca, D. S. Ochoa, J. Martínez Trinidad, and M. A. Mendoza, Phys. Rev. E 74, 061602 (2006).
- Andresen et al. [2007] C. A. Andresen, A. Hansen, and J. Schmittbuhl, Phys. Rev. E 76, 026108 (2007).
- Balankin et al. [2013] A. S. Balankin, A. Horta Rangel, G. García Pérez, F. Gayosso Martinez, H. Sanchez Chavez, and C. L. Martínez-González, Phys. Rev. E 87, 052806 (2013).
- Balankin et al. [2010] A. S. Balankin, D. S. Ochoa, I. A. Miguel, J. P. n. Ortiz, and M. A. M. Cruz, Phys. Rev. E 81, 061126 (2010).
- Tallinen et al. [2008] T. Tallinen, J. A. Åström, and J. Timonen, Phys. Rev. Lett. 101, 106101 (2008).
- Tallinen et al. [2009] T. Tallinen, J. A. Åström, and J. Timonen, Nature Materials 8, 25 (2009).
- Liou et al. [2014] S.-F. Liou, C.-C. Lo, M.-H. Chou, P.-Y. Hsiao, and T.-M. Hong, Phys. Rev. E 89, 022404 (2014).
- Cambou and Menon [2011] A. D. Cambou and N. Menon, Proceedings of the National Academy of Sciences 108, 14741 (2011).
- Lin et al. [2009a] Y.-C. Lin, J.-M. Sun, J.-H. Hsiao, Y. Hwu, C. L. Wang, and T.-M. Hong, Phys. Rev. Lett. 103, 263902 (2009a).
- Lin et al. [2009b] Y.-C. Lin, J.-M. Sun, H. W. Yang, Y. Hwu, C. L. Wang, and T.-M. Hong, Phys. Rev. E 80, 066114 (2009b).
- Note [2] See Supplemental Material at [url] for the relaxation effects during the 7-day waiting time in the sample preparation.
- Matan et al. [2002] K. Matan, R. B. Williams, T. A. Witten, and S. R. Nagel, Phys. Rev. Lett. 88, 076101 (2002).
- Lahini et al. [2017] Y. Lahini, O. Gottesman, A. Amir, and S. M. Rubinstein, Phys. Rev. Lett. 118, 085501 (2017).
Supplemental Material to
“Fold analysis of crumpled sheet using micro computed tomography”
Yumino Hayase, Hitoshi Aonuma, Satoshi Takahara,
Takahiro Sakaue, Shun’ichi Kaneko, and Hiizu Nakanishi
()
Relaxation effects on paper samples after crumpling are examined for some of the scaling exponents that we report in the main text. It turns out that the effects are negligible already at one hour after crumpling in comparison with the overall accuracy of the measurement.
As being described in the text, the crumpled paper and cellophane balls are left for 7 days after crumpling before being CT-scanned in order to allow them to settle. Some may wonder if the 7-day waiting time is enough because it has been observed that crumpled paper balls undergo slow relaxation logarithmic in time over more than three weeks. In order to examine how our results may or may not depend on the waiting time, we measure the time evolution of some of the quantities we report in the main text.
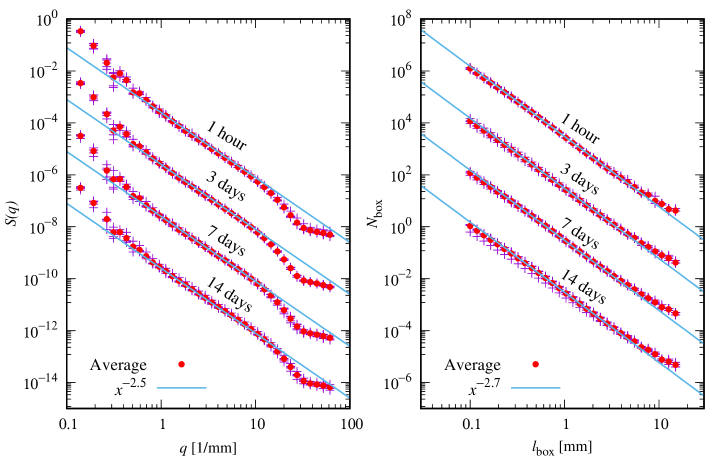
The quantities we examined in this supplemental material are (i) the radius of gyration , (ii) the power spectrum of the density distribution , and (iii) the box counting data for the fractal dimension. Five sheets of square paper with the size mm are crumpled by hands, and are scanned by micro-CT at one hour, 3 days, 7 days, and 14 days after being crumpled. The samples are kept under fairly constant condition controlled at the temperature C and the humidity .
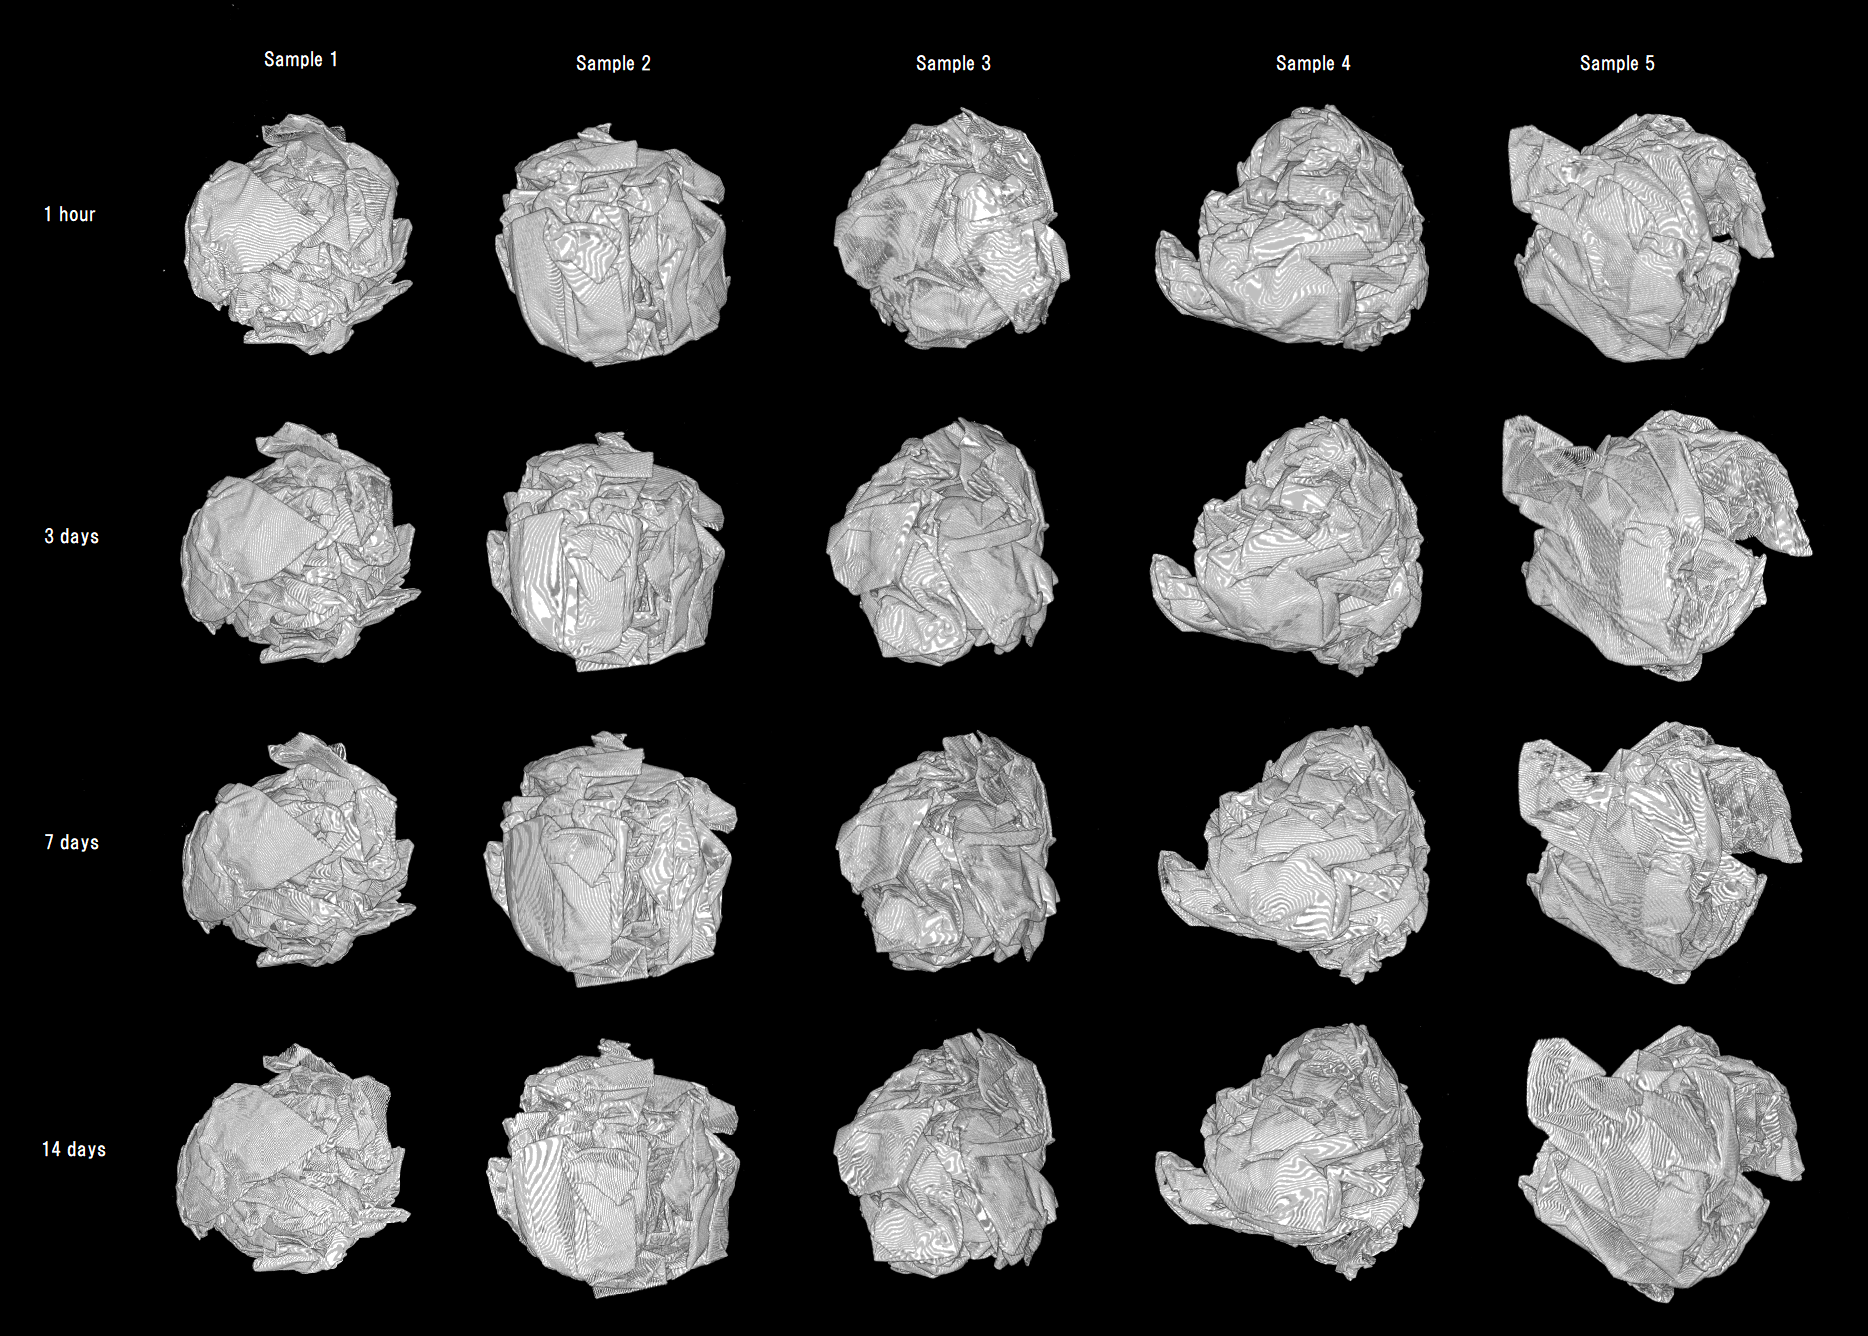
Before we present the measured quantities, we show the reconstructed images of the samples upon each scan in Fig.S1. The sample orientation is not controlled at the scanning, thus the lines of sight for these images are adjusted on the computer by 3d viewer after each image is reconstructed. One may notice some relaxation of the configuration, but they do not change much after one hour.
The calculated radii of gyration are listed in Table S1. They increase slightly over time, but the change in the radius for each sample after one hour is less than 1 mm; it is smaller than variation among samples, and should not have any effect on the estimate of the exponent in Fig.3(b) of the main text. The last data of Sample 5 is smaller than the earlier ones. We do not understand how this happened, but a certain relaxation in the density inhomogeneity inside the ball could yield such a fluctuation of .
time Sample 1 Sample 2 Sample 3 Sample 4 Sample 5 1 hour 12.31 11.48 11.58 12.04 12.44 3 days 12.52 11.52 11.67 12.16 12.71 7 days 12.83 11.76 11.99 12.45 13.21 14 days 13.11 11.97 12.28 12.85 12.49
Figure S2 shows the evolution of the power spectra of the density distributions and the box counting data v.s. for the fractal dimension; the plus marks show the data for each sample and the red solid circles show the average over the 5 samples. The lines are the scaling fits by and with and . The data for different scan times are shifted by the factor . One may find small changes over time at the both ends of or , but the data are quite stable in the middle range, where the exponents are estimated, therefore, the estimates for the exponent and do not depend on the waiting time for all the data we examine.