The HI angular momentum-mass relation
Abstract
We study the relationship between the Hi specific angular momentum () and the Hi mass () for a sample of galaxies with well measured Hi rotation curves. We find that the relation is well described by an unbroken power law α over the entire mass range (107 – 1010.5 M⊙), with (scatter 0.18 dex). This is in reasonable agreement with models which assume that evolutionary processes maintain Hi disks in a marginally stable state. The slope we observe is also significantly different from both the relation expected for dark matter haloes from tidal torquing models and the observed slope of the specific angular momentum-mass relation for the stellar component of disk galaxies. Our sample includes two Hi–bearing ultra diffuse galaxies, and we find that their angular momentum follows the same relation as other galaxies. The only discrepant galaxies in our sample are early–type galaxies with large rotating Hi disks which are found to have significantly higher angular momentum than expected from the power law relation. The Hi disks of all these early–type galaxies are misaligned or counter-rotating with respect to the stellar disks, consistent with the gas being recently accreted. We speculate that late stage wet mergers, as well as cold flows play a dominant role in determining the kinematics of the baryonic component of galaxies as suggested by recent numerical simulations.
keywords:
dwarf-galaxies: fundamental parameters–galaxies: kinematics and dynamics1 Introduction
Studies of the correlations between global parameters of galaxies (e.g. rotation velocity vs. luminosity, or star formation rate vs. stellar mass) provide critical observational tests of galaxy formation and evolution models. One specific parameter which is receiving increasing attention is the angular momentum. This is in part because it is only now that, thanks to large IFU surveys as well as large Hi surveys, measurements of angular momentum are becoming available for a sizeable number of galaxies (e.g. Walter et al., 2008; Hunter et al., 2012; Sánchez et al., 2012; Bryant et al., 2015; Bundy et al., 2015; Stott et al., 2016). Further, our theoretical understanding of how galaxies acquire angular momentum is also rapidly evolving as numerical models become more sophisticated and better able to capture the details of the physics of the baryonic component of galaxies.
The traditional understanding was that galaxies acquire their angular momentum via tidal torquing of collapsing proto-halos by neighbouring mass concentrations. In such models the bulk of the angular momentum gain happens around the turn around time of the proto-halo and the angular momentum remains roughly constant after that epoch. The angular momentum of the final collapsed halo is generally quantified by its ‘spin parameter’ (where is the total angular momentum of the halo, the total energy, and the total mass). Both analytical calculations (Peebles (1969)), as well as numerical simulations (e.g. Bett et al. (2007); Rodríguez-Puebla et al. (2016)) find that the spin parameter is roughly independent of the total mass of the halo. This leads to a scaling relation between the halo specific angular momentum () and the halo mass, viz. . If one assumes that the baryonic matter and dark matter have similar distributions at early times and that galaxies form by cooling and angular momentum conserving collapse of the baryonic component (Fall (1983); Mo et al. (1998)) then a similar scaling relation would be expected for the baryonic component of galaxies, viz. 2/3. It has been found that such a scaling relation is indeed obtained for the stellar component of galaxies, although individual galaxies can deviate significantly from the relation and the constant of proportionality varies between early and late type galaxies, as well as with bulge fraction(Fall, 1983; Romanowsky & Fall, 2012; Fall & Romanowsky, 2018)
This traditional understanding has been challenged by several numerical simulations (e.g. Desmond et al., 2017; Jiang et al., 2019) of galaxy formation that include the effects of mergers and coldflows. These simulations show that the collapsed baryonic component of galaxies does not arise solely from the cooling and contraction of the initial hot baryonic component of the proto-halo. Both mergers as well as ‘cold’ flows of baryonic material along filaments that penetrate deep into the halo (e.g. Kereš et al., 2005, 2009; Brooks et al., 2009) could result in a significant change in the final baryonic mass as well as the final angular momentum. The effect on the angular momentum depends on whether the merger was ‘wet’ (i.e. with a gaseous progenitor) or dry (i.e. with a gas poor progenitor) as well as the relative orientation of the spin of the incoming material vis a vis that of the galaxy (see e.g. Naab et al., 2014; Choi & Yi, 2017; Lagos et al., 2018). Additionally, the final baryonic mass as well as the angular momentum are affected by the energy input from stellar winds and supernovae which could cause an outflow of material from the galaxy. The strength of the outflows depends on whether the supernovae explosions are clustered or not. Since clustering of supernovae typically happens only near the centres of galaxies (i.e. in regions where the material has low specific angular momentum, (sAM)) outflows lead to a preferential loss of low specific angular momentum material. This results in an increase in the specific angular momentum of the remaining material in the galaxy (Dutton, 2009; Brook et al., 2011; Sharma et al., 2012). As a consequence of these processes the angular momentum of the galaxy is not determined during its formation phase, but rather is affected by the entire evolutionary path of the galaxy. Both the morphology as well as the angular momentum appear to be driven more by evolutionary processes and a galaxy’s merger history than the original spin parameter of the dark matter halo (see e.g. Stewart et al., 2017; Zjupa & Springel, 2017; Jiang et al., 2019; Renzini, 2020). For example, simulations show that accretion of low sAM or counter rotating gas leads to a central compact galaxy ("blue nugget"), with an outer spheroidal stellar distribution, and possibly an outer counter-rotating disk, while accretion of co-rotating material typically leads to a disk type galaxy with gas density stable against rapid gravitational collapse (see e.g. Zolotov et al., 2015; Jiang et al., 2019; Kretschmer et al., 2020).
Recent observational studies have also begun to indicate that the relationship between the specific angular momentum and the mass is more nuanced than a simple scaling. For the stellar – relation, Posti et al. (2018, 2019) find a unbroken power-law α with for all the galaxies in the stellar mass range of 107–1011.5 M⊙. On the other hand for the gas – relation Mancera Piña et al. (2021) have recently reported a slope of . Earlier studies have also found that gas rich dwarf galaxies appear to have an excess baryonic specific angular momentum compared to that expected from the scaling relation for bulgeless spirals given by Obreschkow & Glazebrook (2014) (e.g. Butler et al., 2017; Chowdhury & Chengalur, 2017; Kurapati et al., 2018). Kurapati et al. (2018) also find that the elevation in specific angular momentum occurs for the galaxies with masses lower than M⊙. The scaling relation hence appears to depend both on the details of the galaxy morphology, as well as which component (stars, gas) of the galaxy is under consideration.
Here we study the relation between the baryonic specific angular momentum and mass, as well as that between the Hi specific angular momentum ( ) and Hi mass ( ) for a diverse sample of gas rich galaxies including Hi-bearing ultra-diffuse galaxies (HUDs), normal dwarf galaxies, spiral galaxies, and early–type galaxies. We discuss the results in terms of the range of simulations discussed above. This paper is organized as follows. In §2.1, we describe the sample and observations. In § 3, we determine the gas angular momentum and gas mass relation. We present a discussion in § 4 and summarize the main results in § 5.
2 Determination of specific angular momentum
2.1 Sample
Our sample consists of a wide variety of galaxies including dwarf galaxies, Hi bearing ultra diffuse galaxies, spiral galaxies, as well as early–type galaxies. For some galaxies we present fresh measurements. We supplement this sample with measurements that are available in the literature. We discuss first the galaxies for which we present fresh measurements.
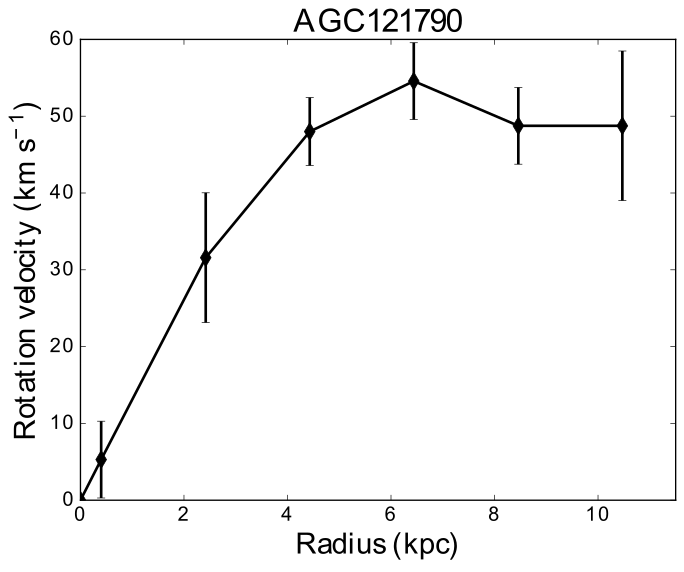
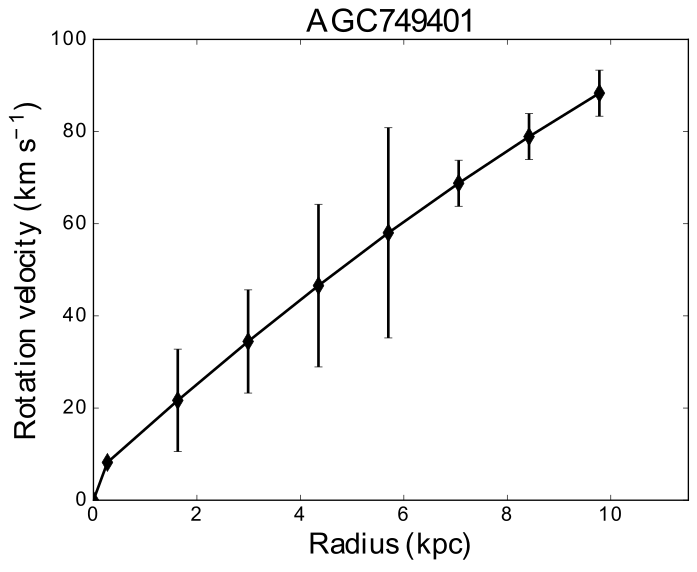
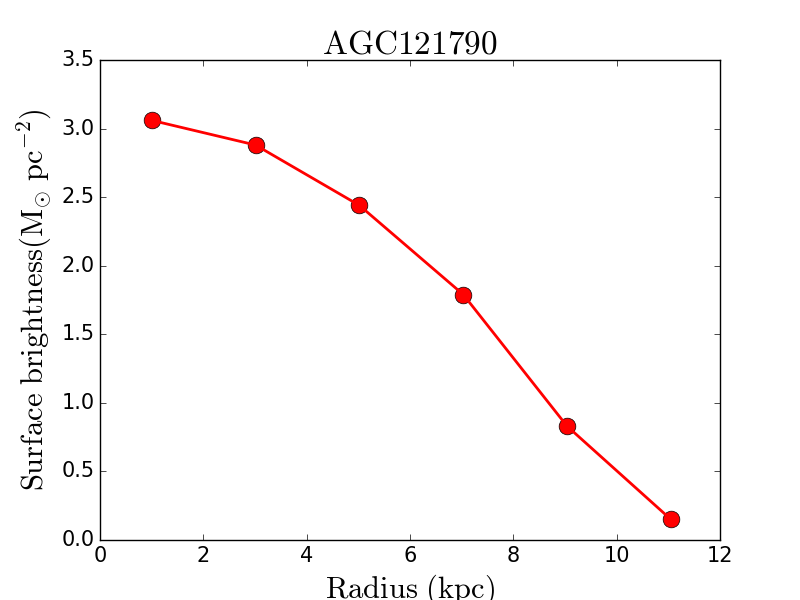
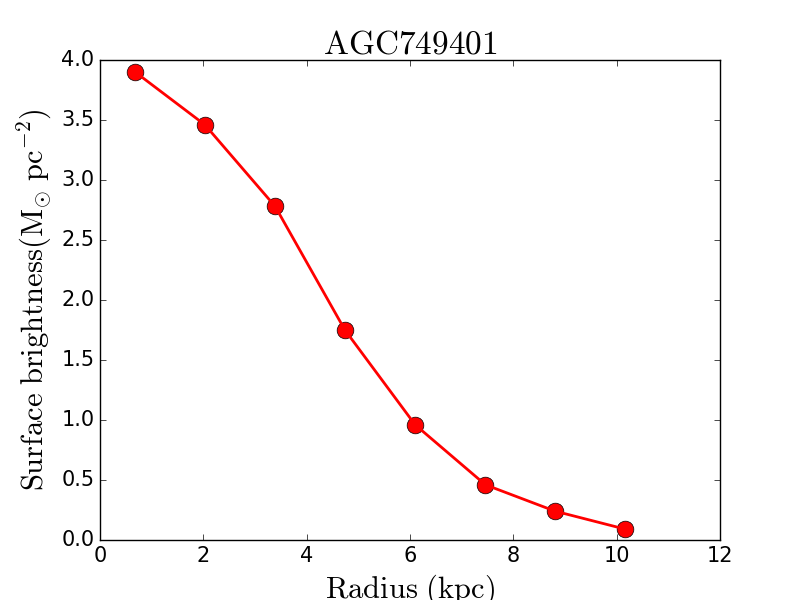
The Hi bearing ultra-diffuse galaxies (HUDs) were selected from the ‘more restrictive’ sample of Leisman et al. (2017), with half light radii r kpc, mag arcsec-2, and g-band Magnitude > -16.8 mag, i.e. more extreme stellar sizes as compared to their stellar magnitudes. We used new Giant Metrewave Radio Telescope (GMRT) observations to obtain Hi morphologies and kinematics of 2 HUDs as part of a pilot study for a larger survey. We derive the rotation curves and Hi surface brightness profiles for these galaxies using Fully Automated TiRiFiC (FAT; Kamphuis et al., 2015) by fitting a tilted ring model to the data cube. The derived rotation curves and surface brightness profiles for ultra–diffuse galaxies are shown in Figures 16 and 18 respectively.
Spiral galaxies are taken from the samples of Verheijen & Sancisi (2001). Verheijen & Sancisi (2001) presented results from a synthesis imaging survey of 43 galaxies in the nearby Ursa Major region using the Westerbork Synthesis Radio Telescope (WSRT). We require a sample of galaxies where rotation curves can be reliably derived. Hence, we consider only the galaxies that are well resolved across the major axis and exclude the galaxies that are in interacting pairs or that have disturbed velocity fields. 16 of 43 galaxies remain after the imposition of these criteria. We use K’ band luminosity profiles (as measured in Verheijen (2001)) to calculate the stellar mass profiles since the uncertainties in the derivation of the mass to light ratio are much less in the mid-infrared compared to the optical. We assume a constant K’ band mass to light ratio of 0.24 to calculate the stellar surface density profiles (Ponomareva et al., 2018). We use the rotation curves and the radial Hi surface density profiles from Verheijen (2001) to calculate the baryonic and gas specific angular momentum.
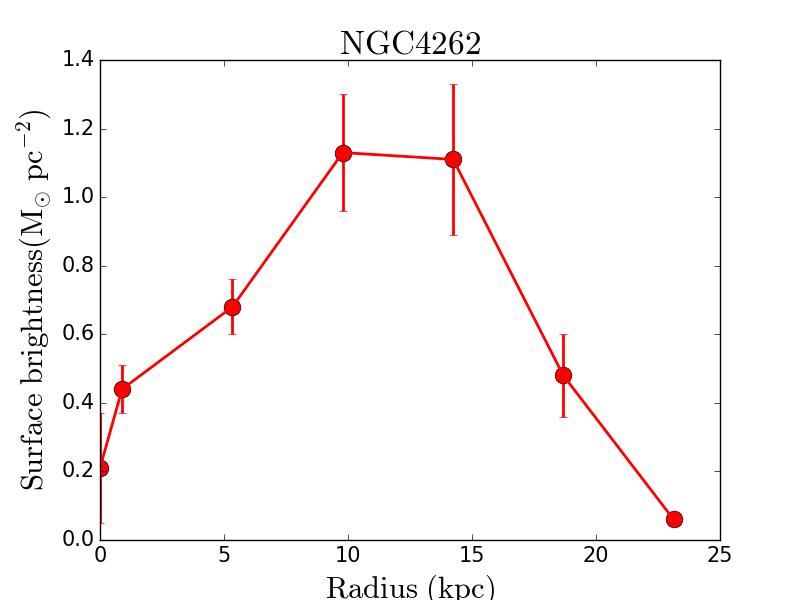
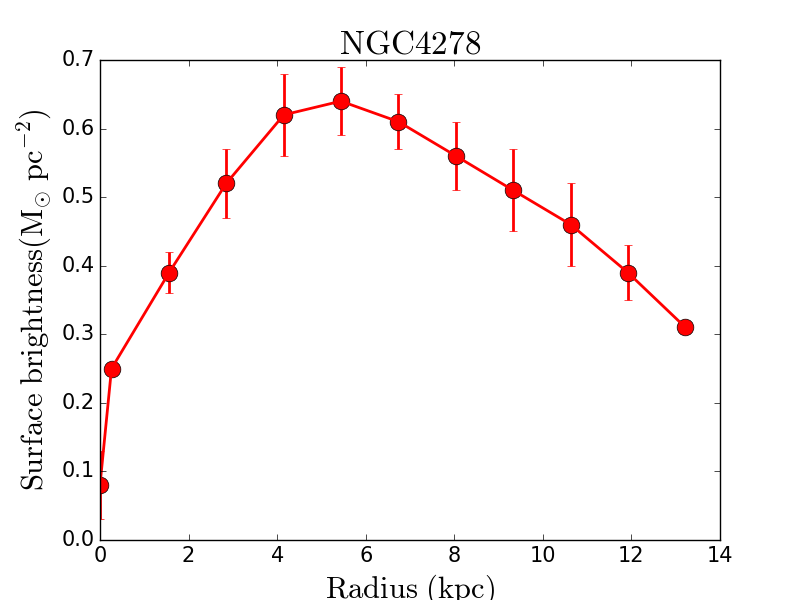
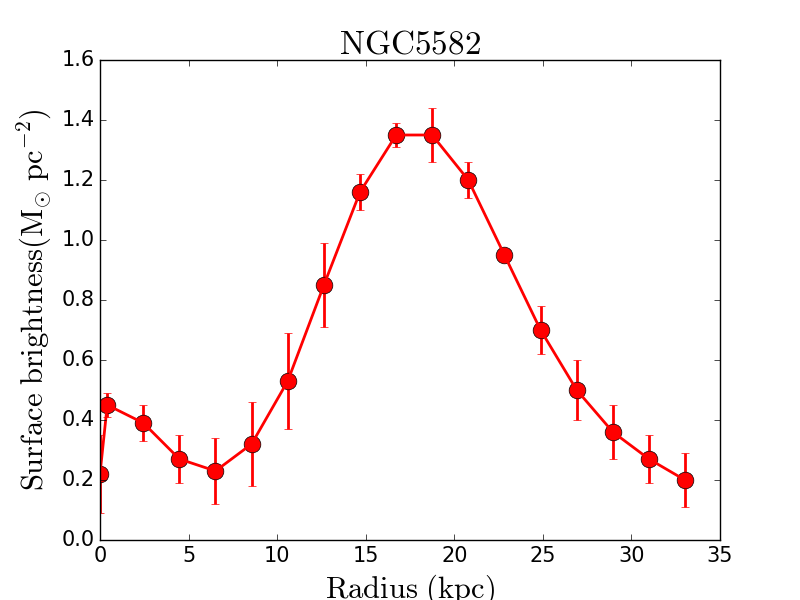
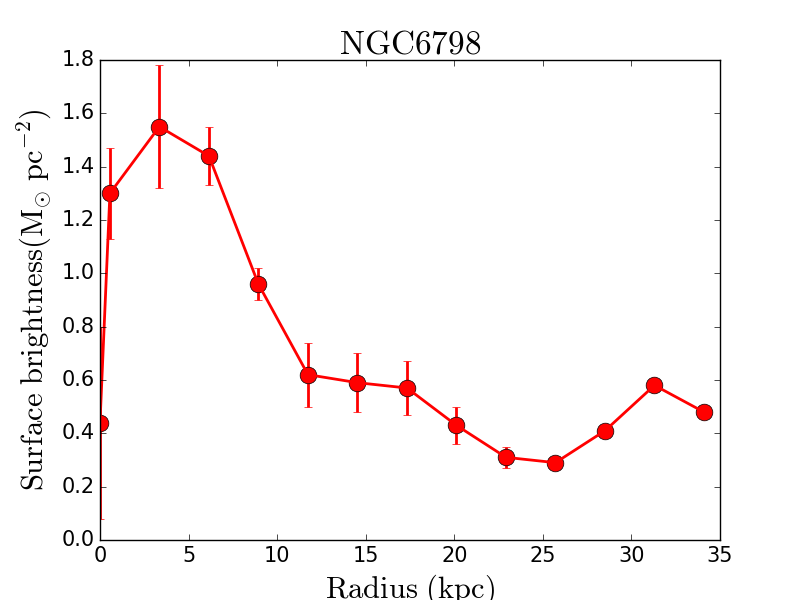
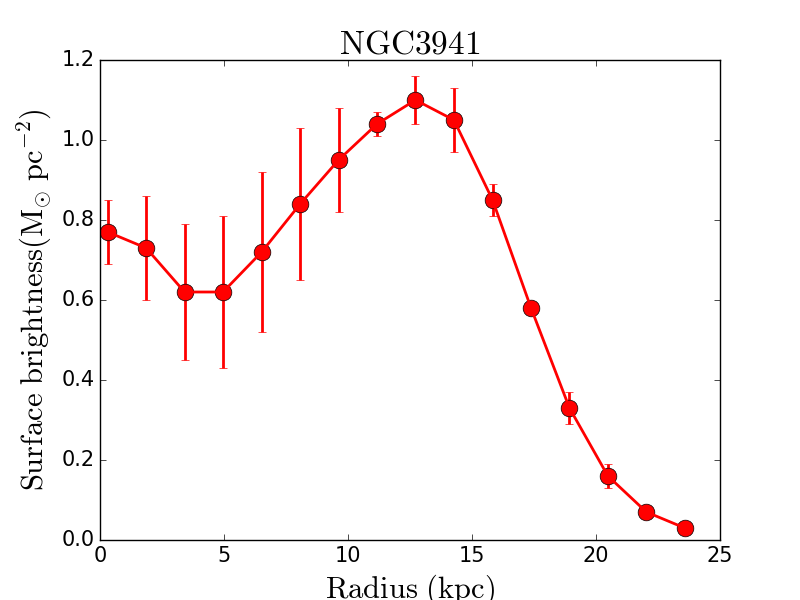
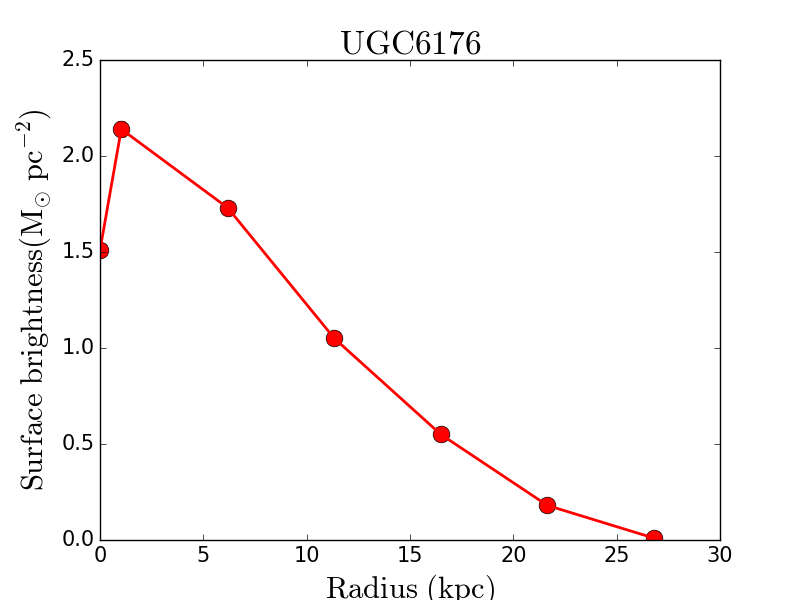
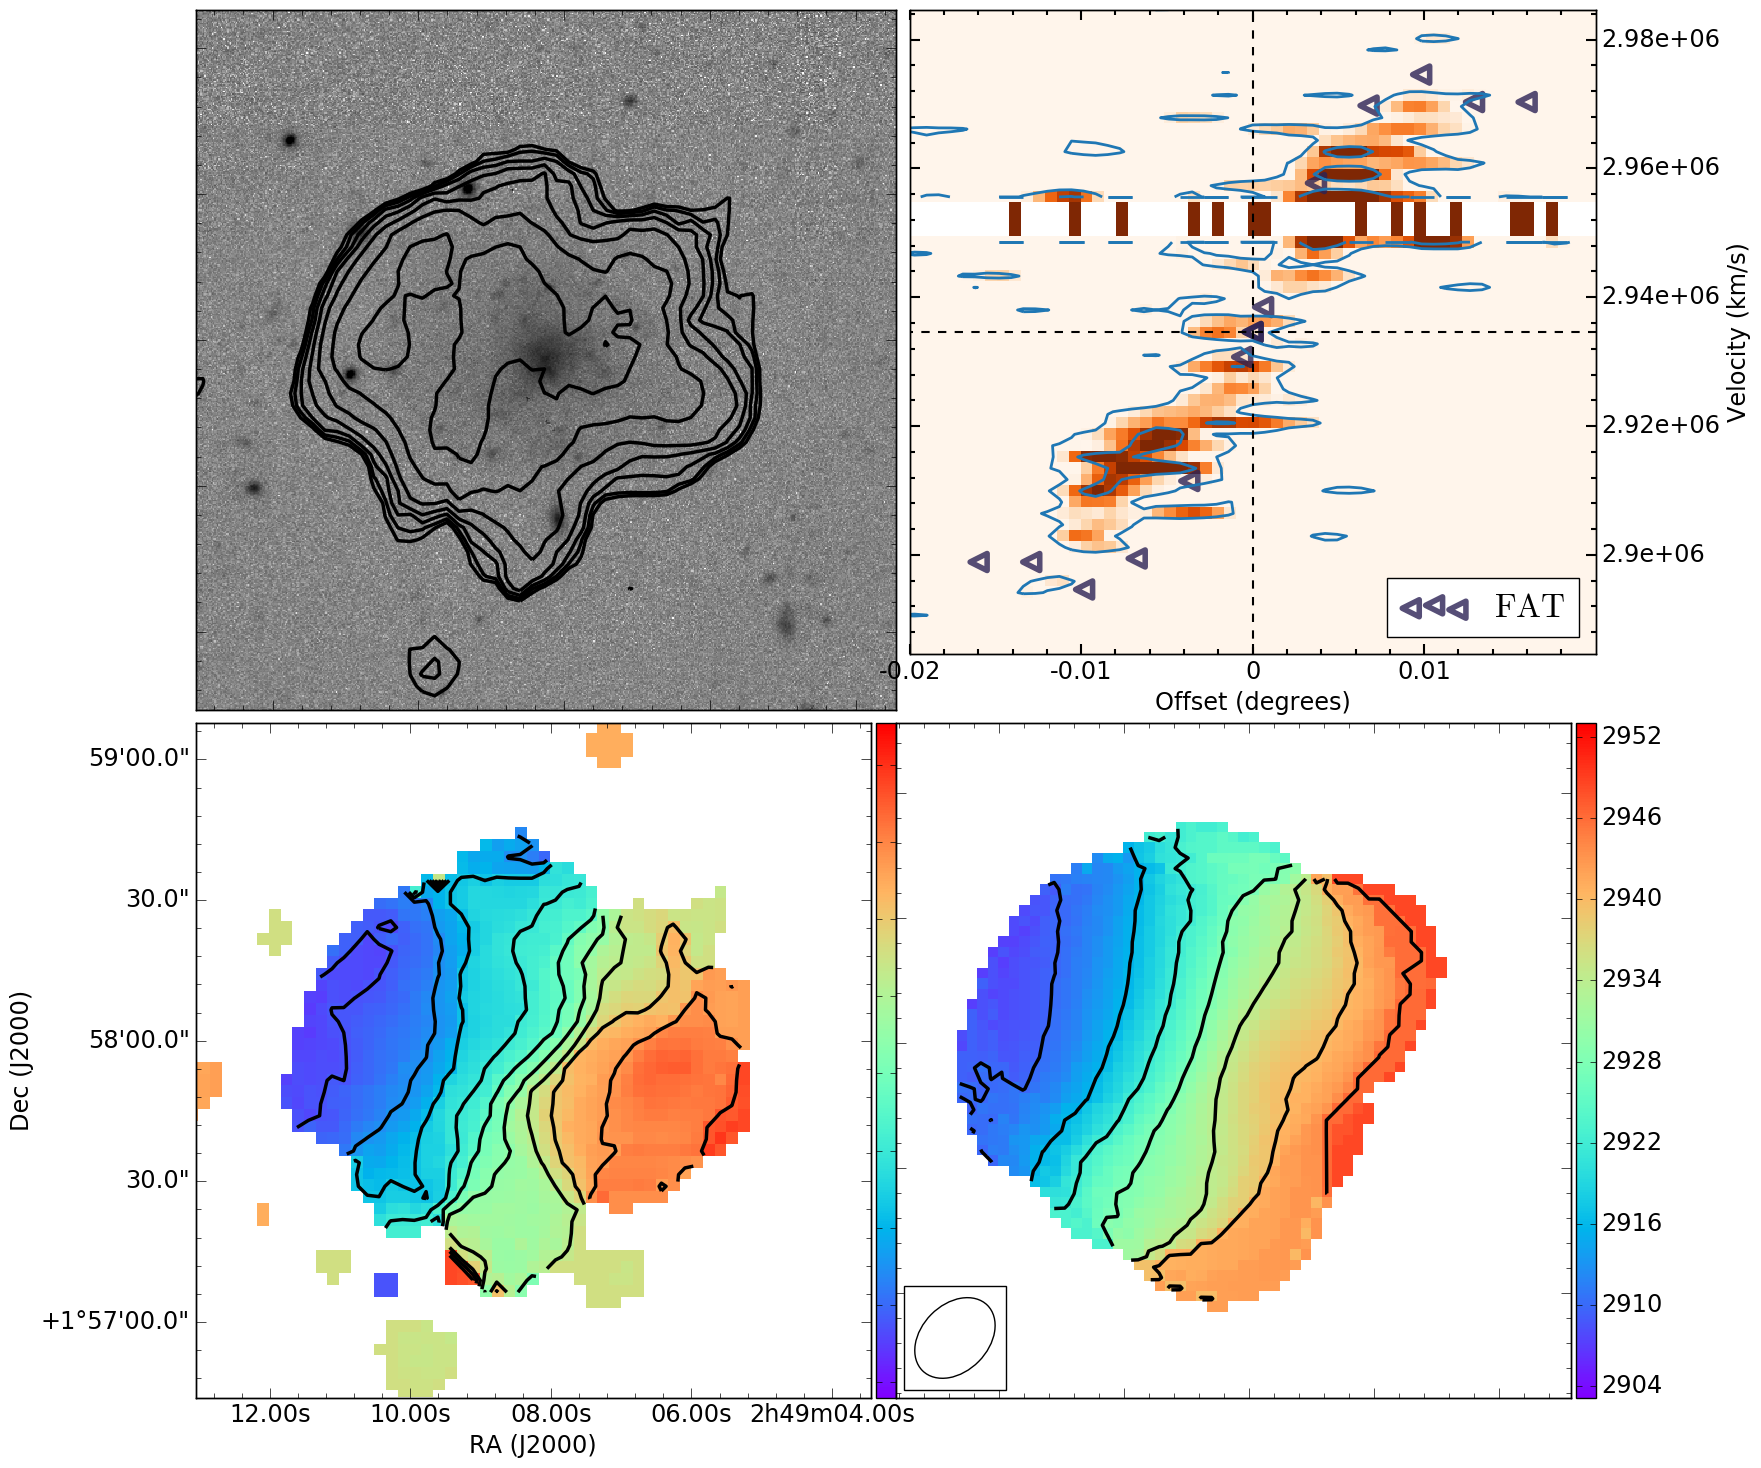
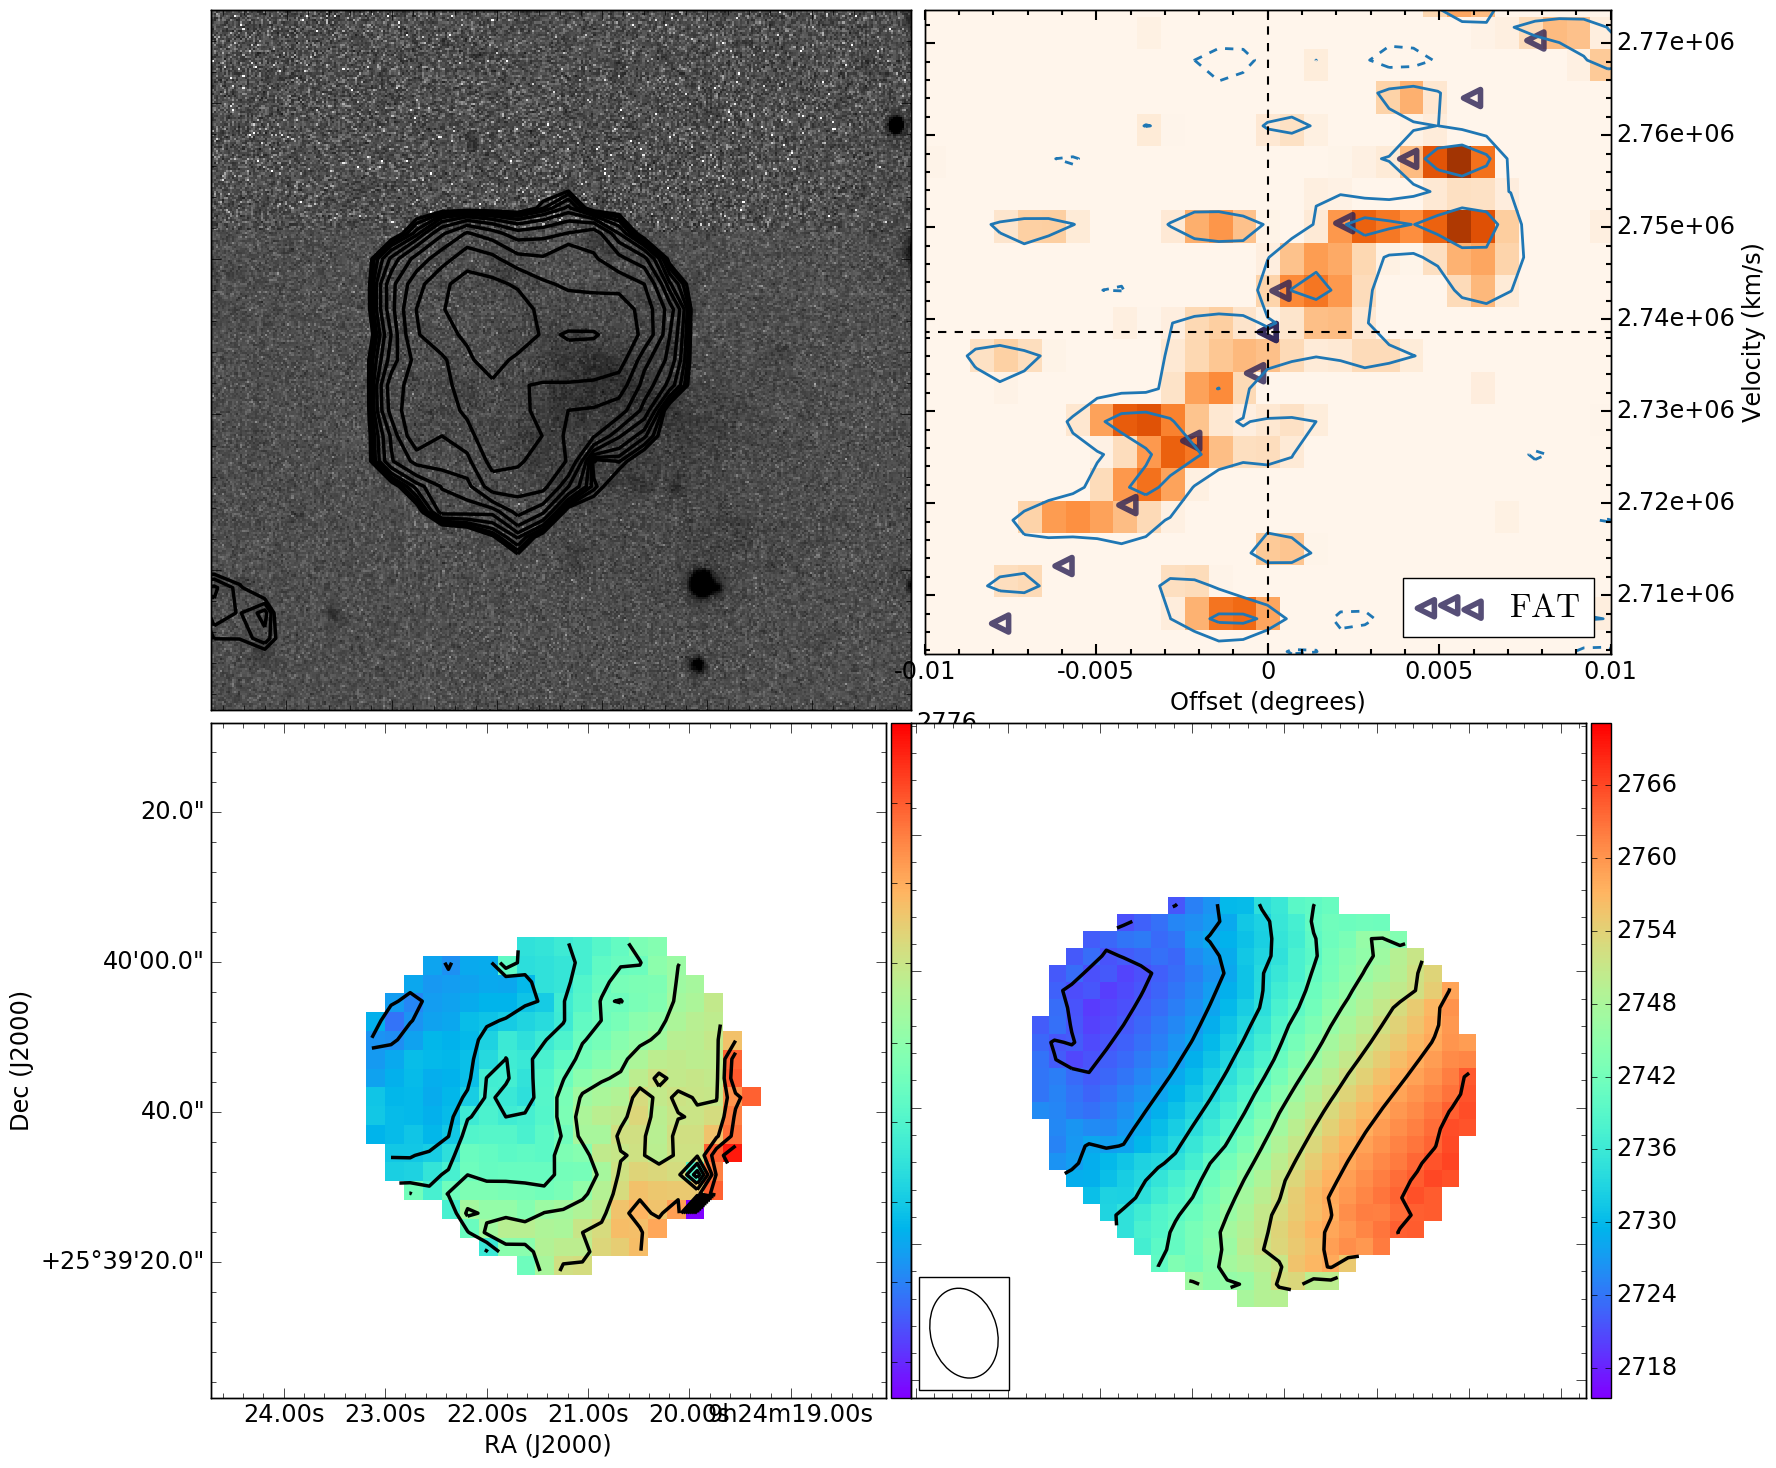
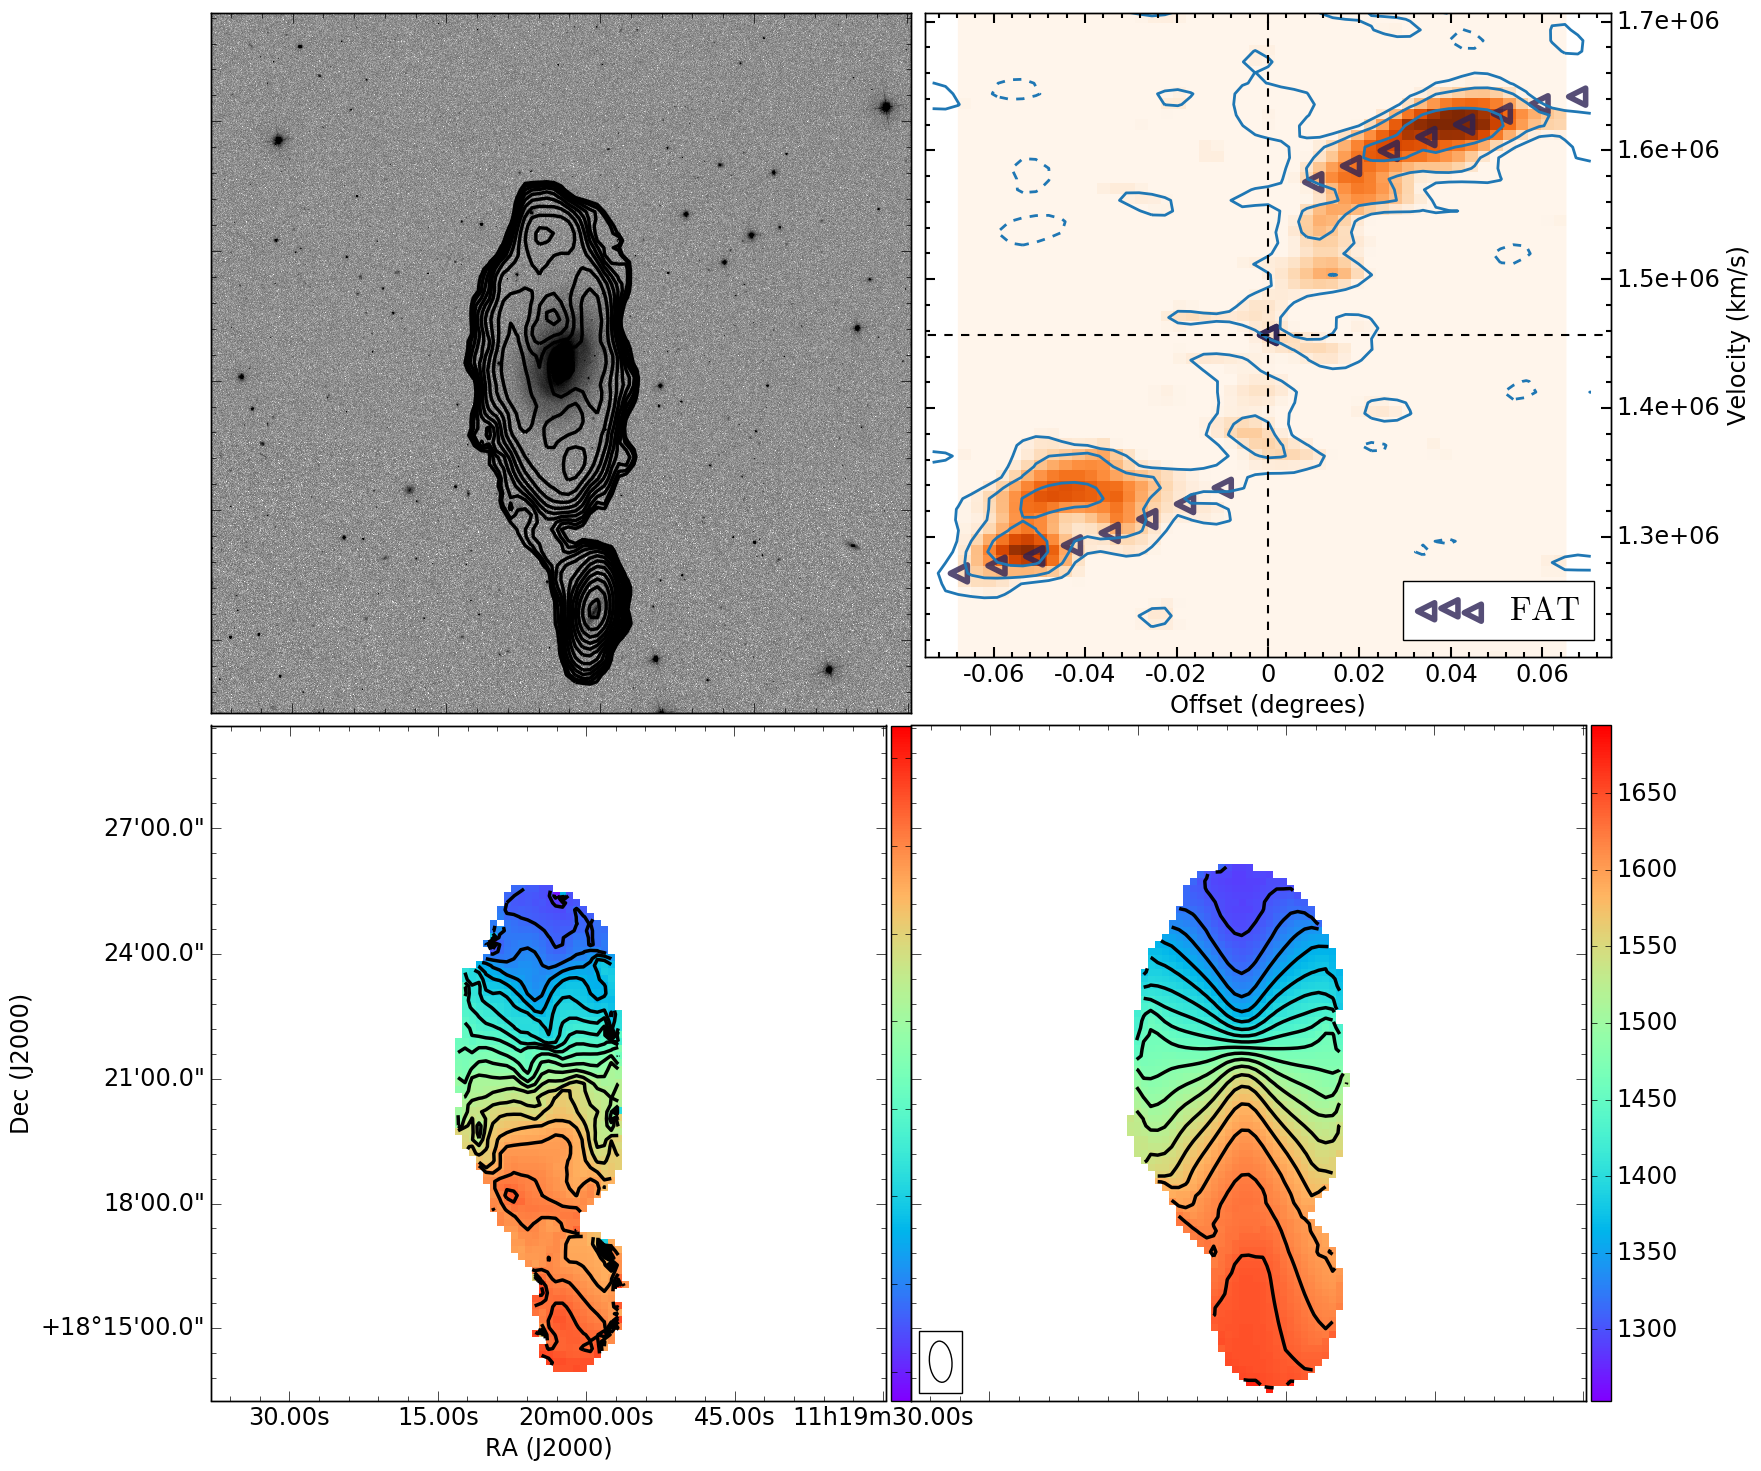
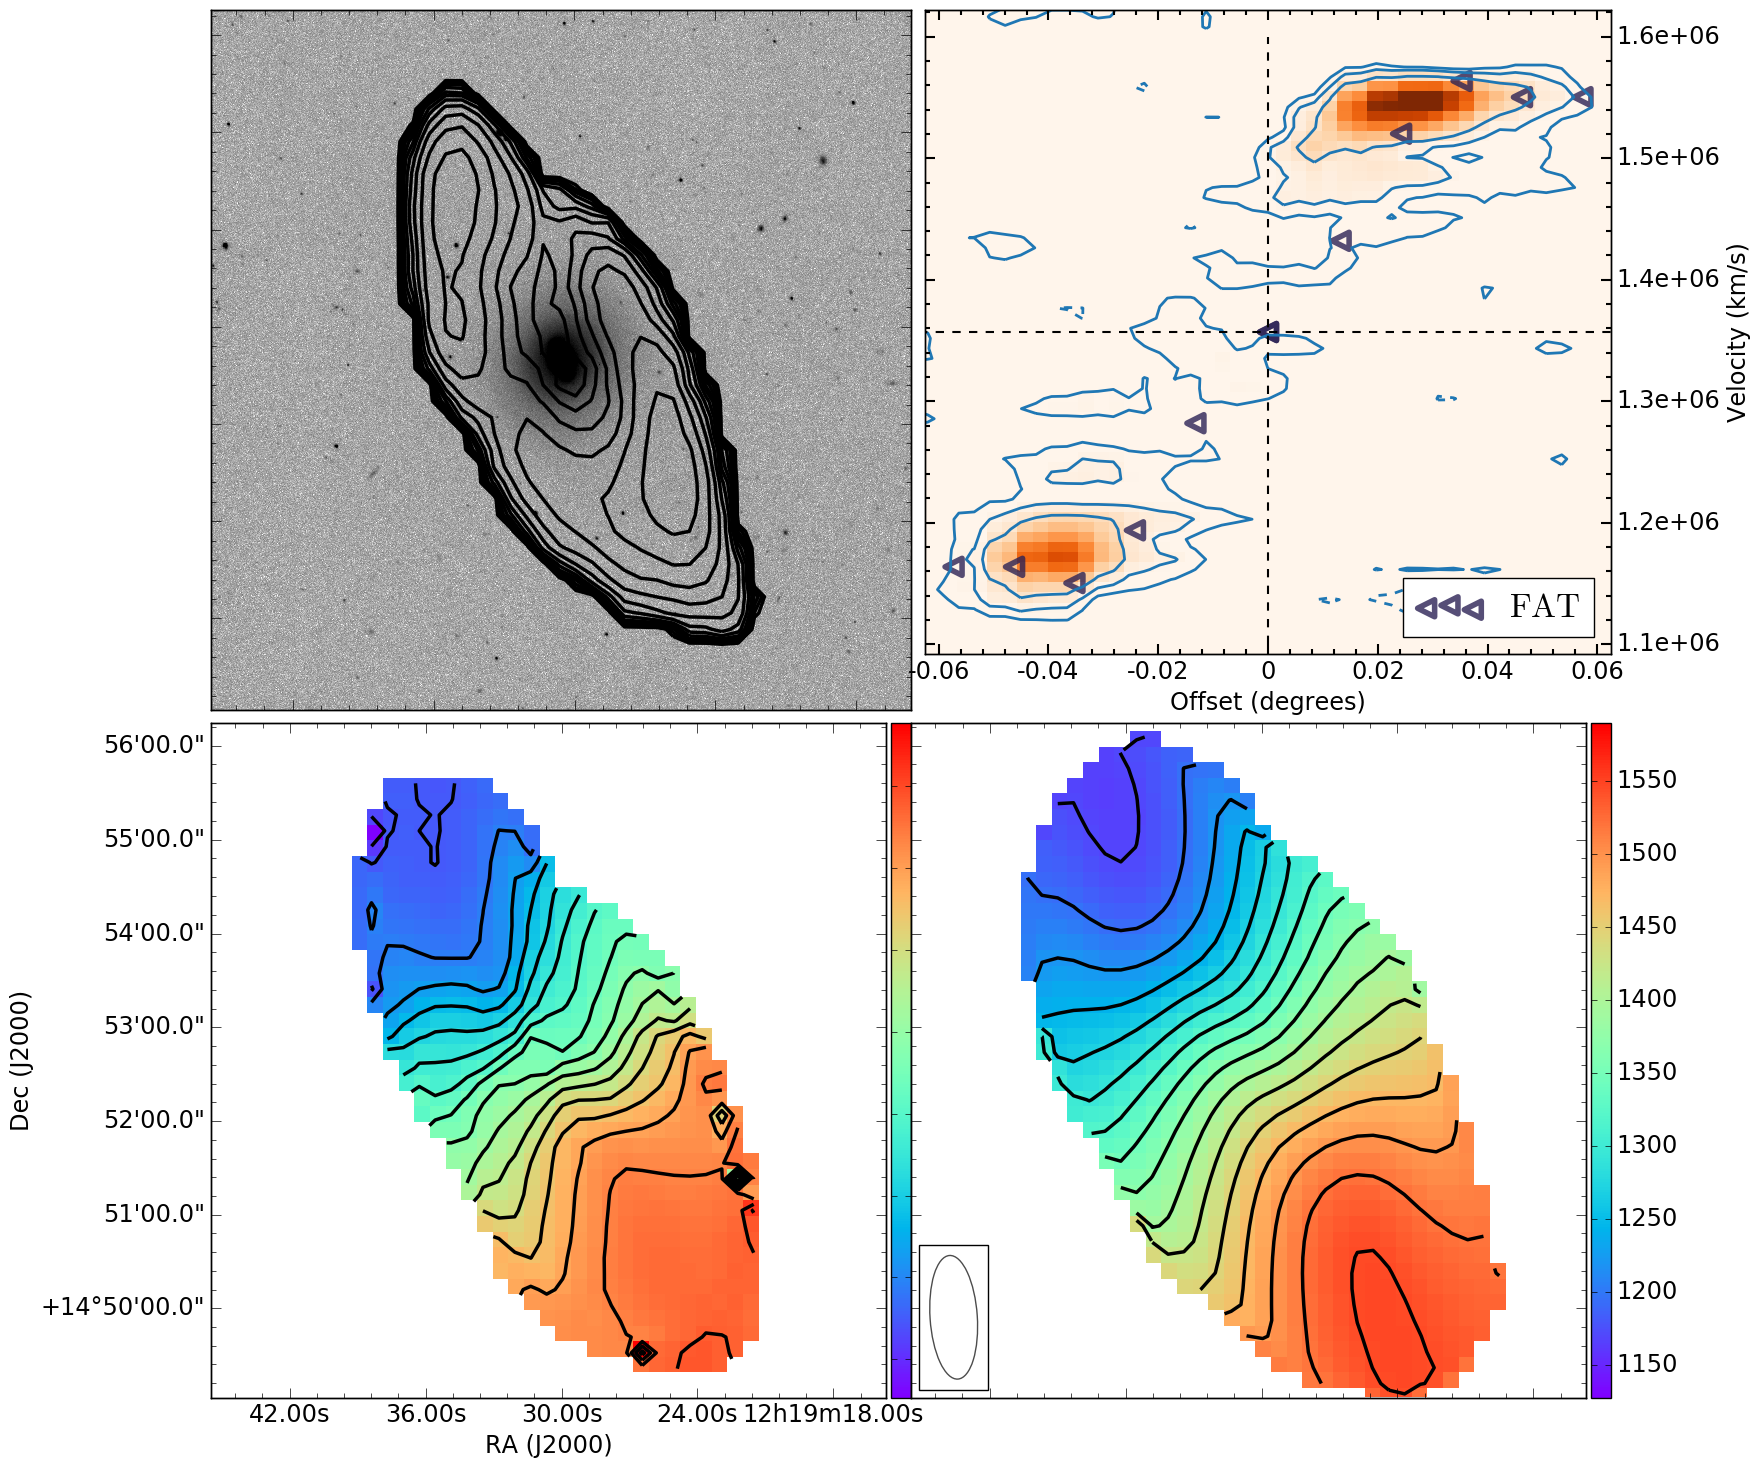
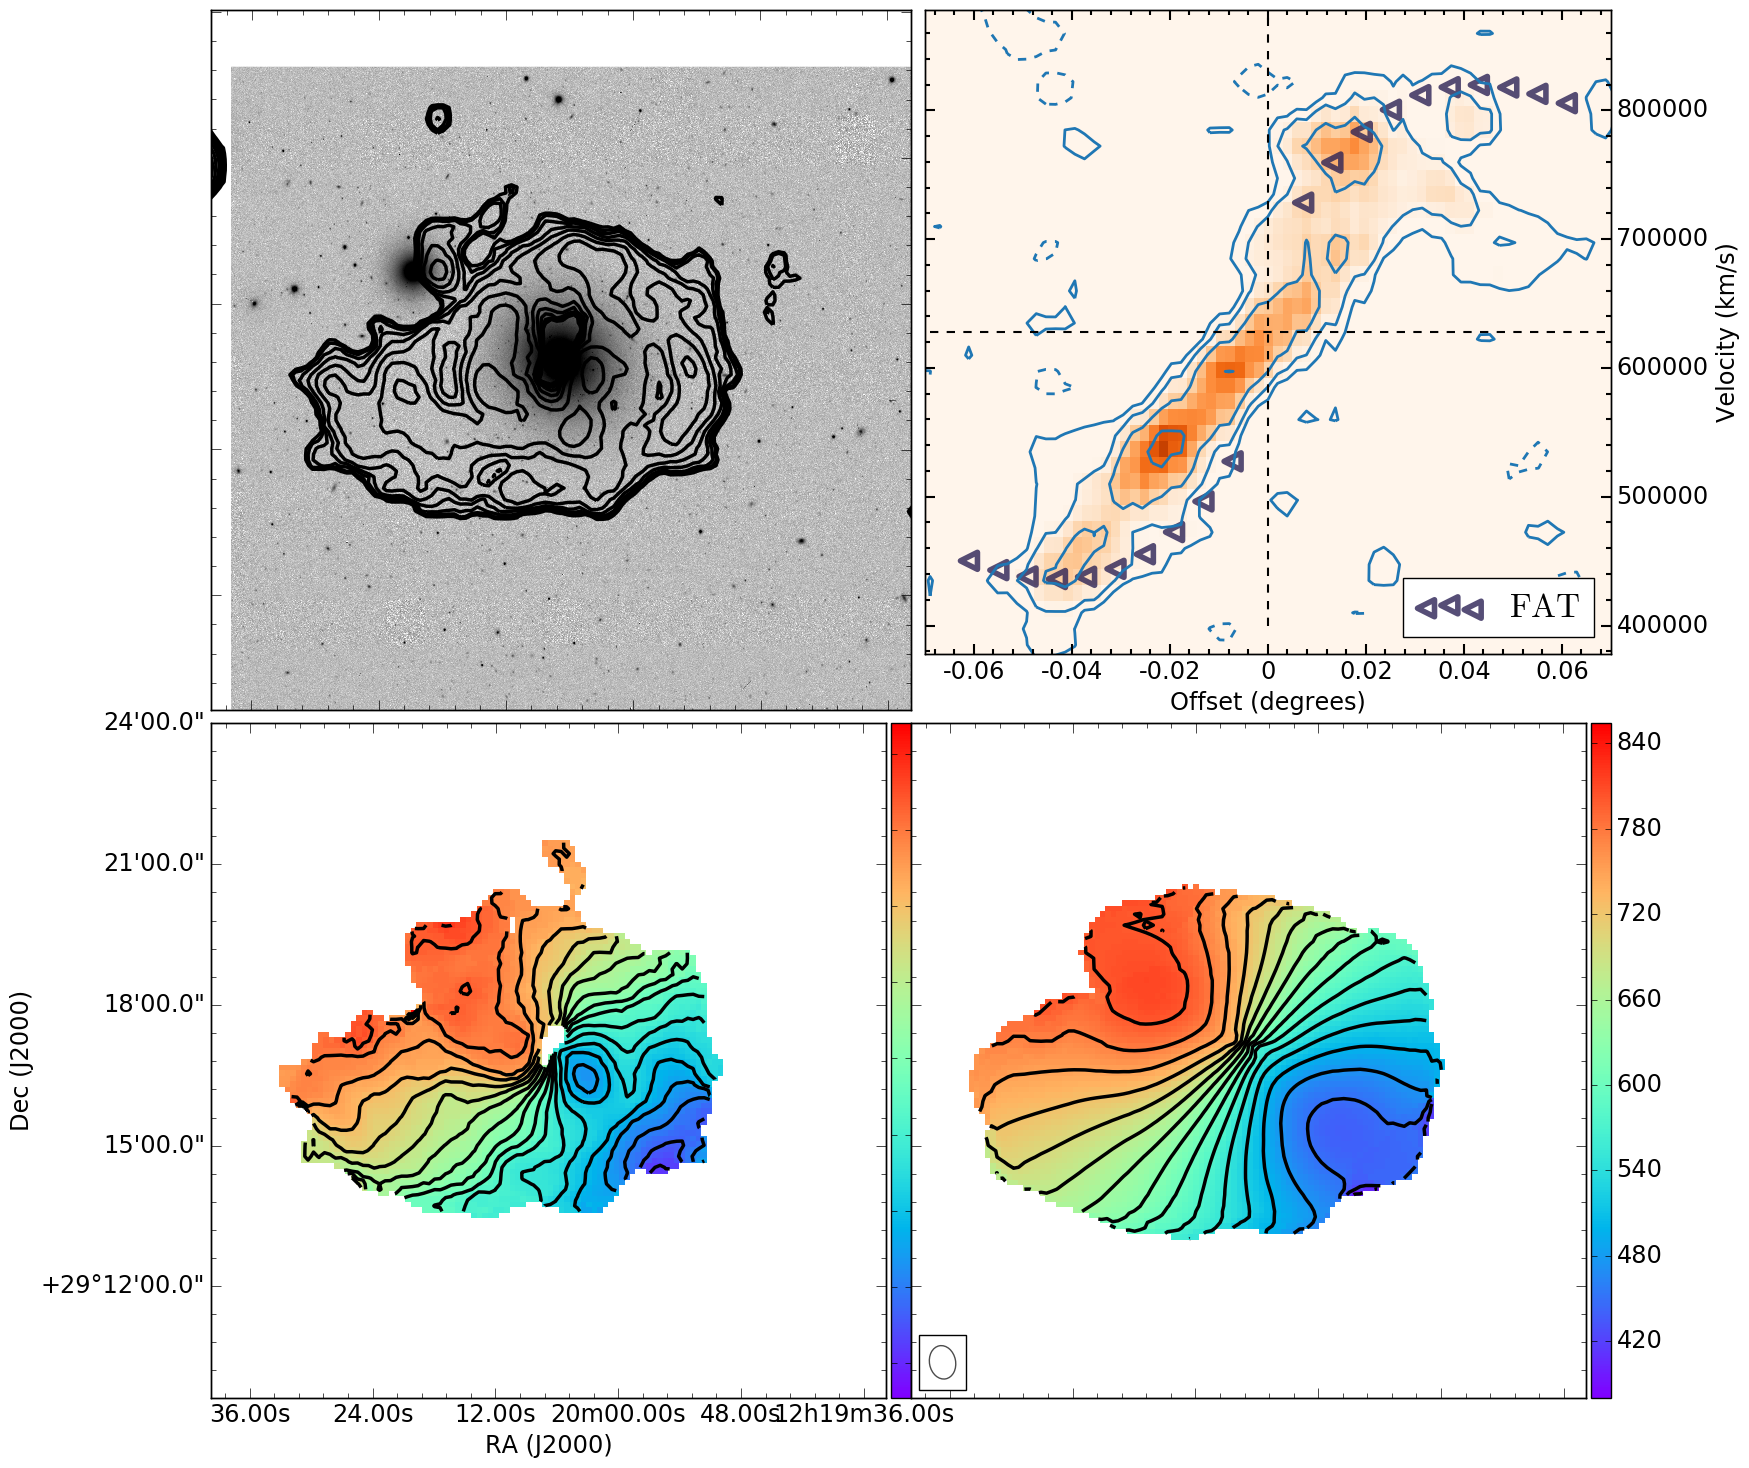
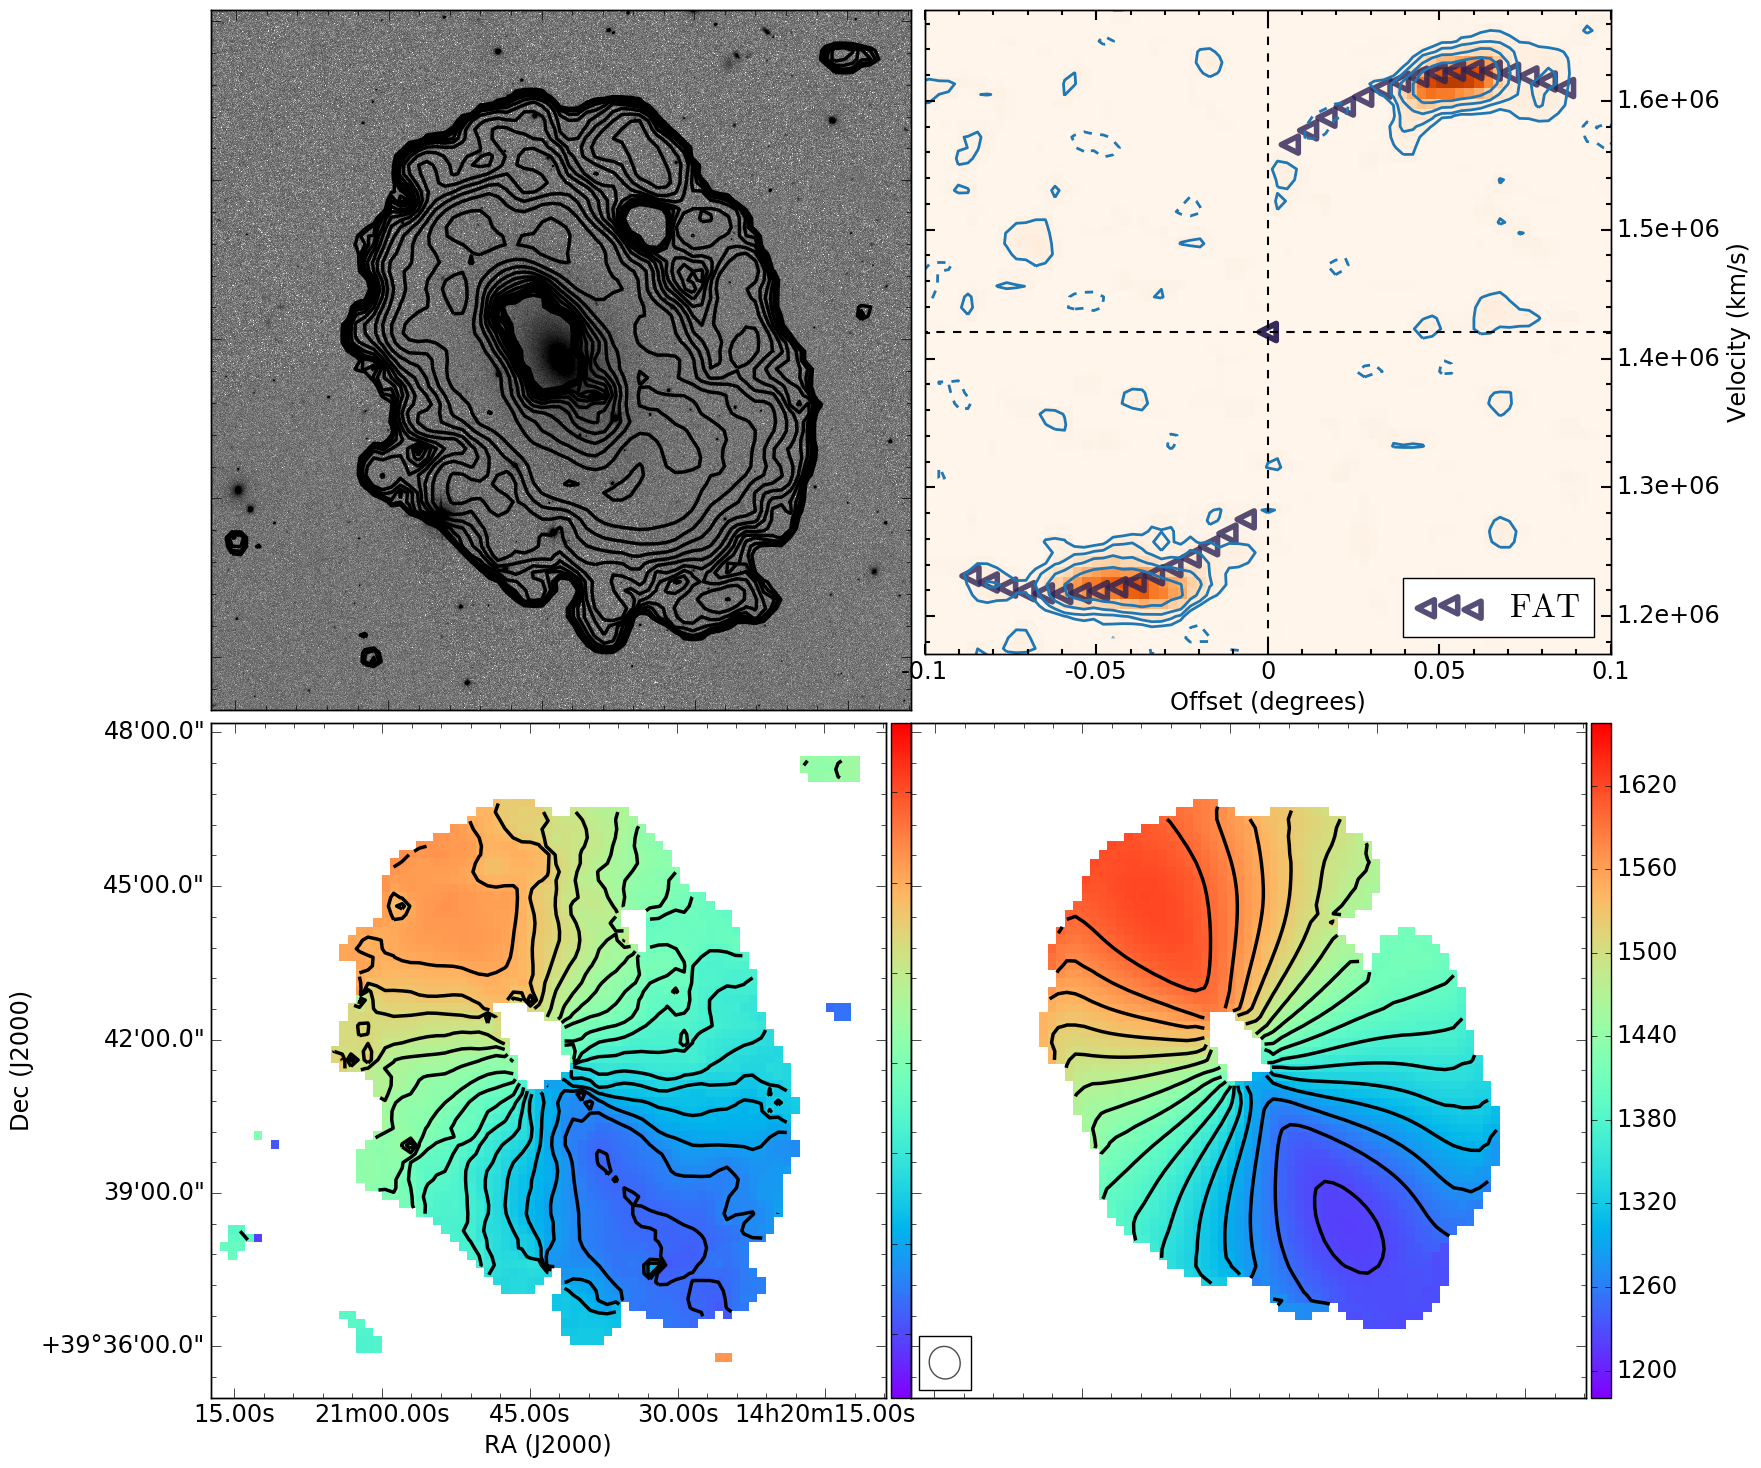
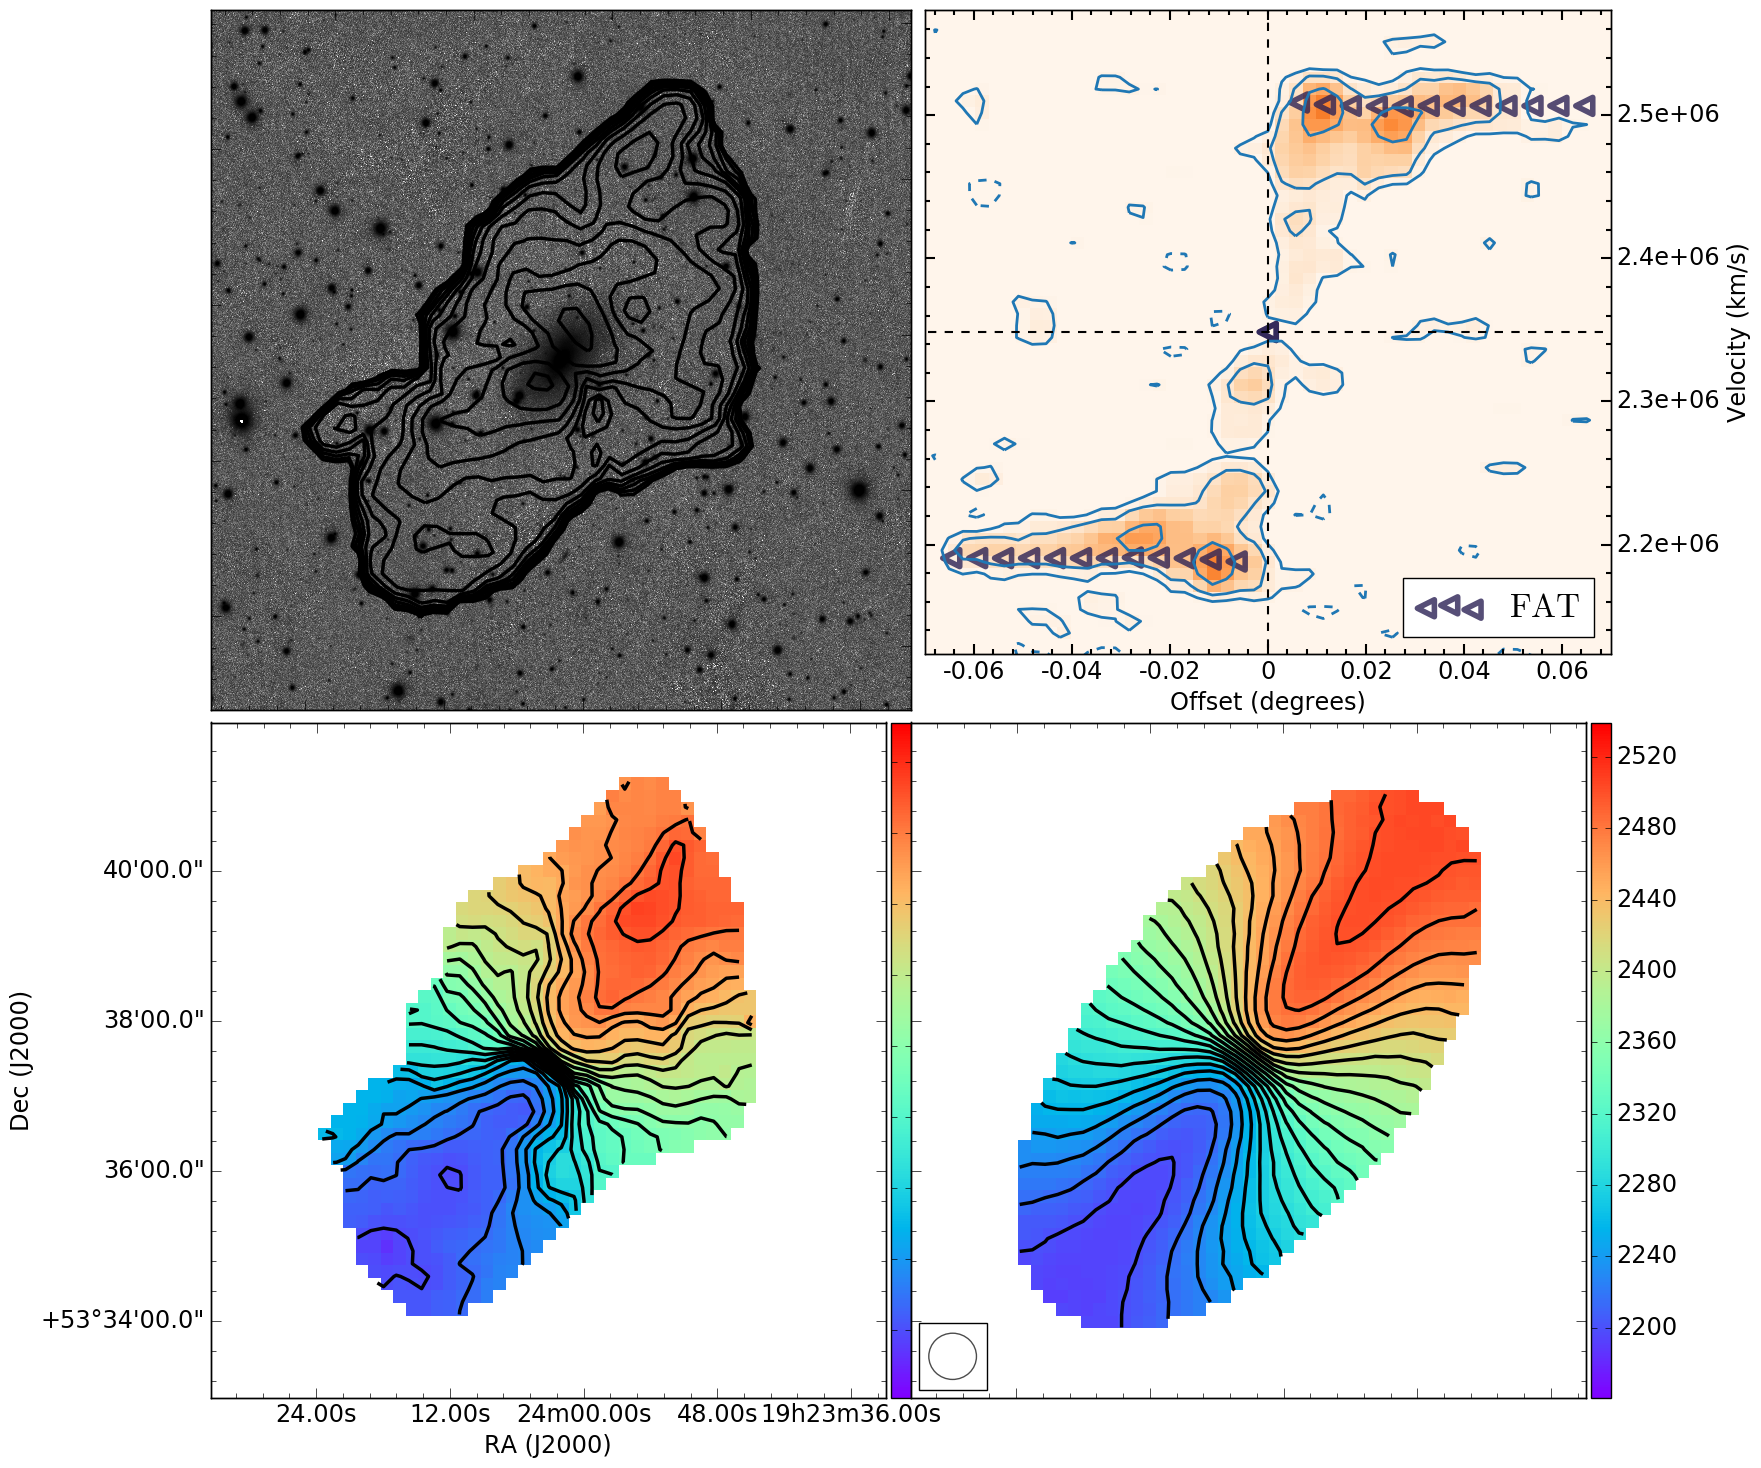
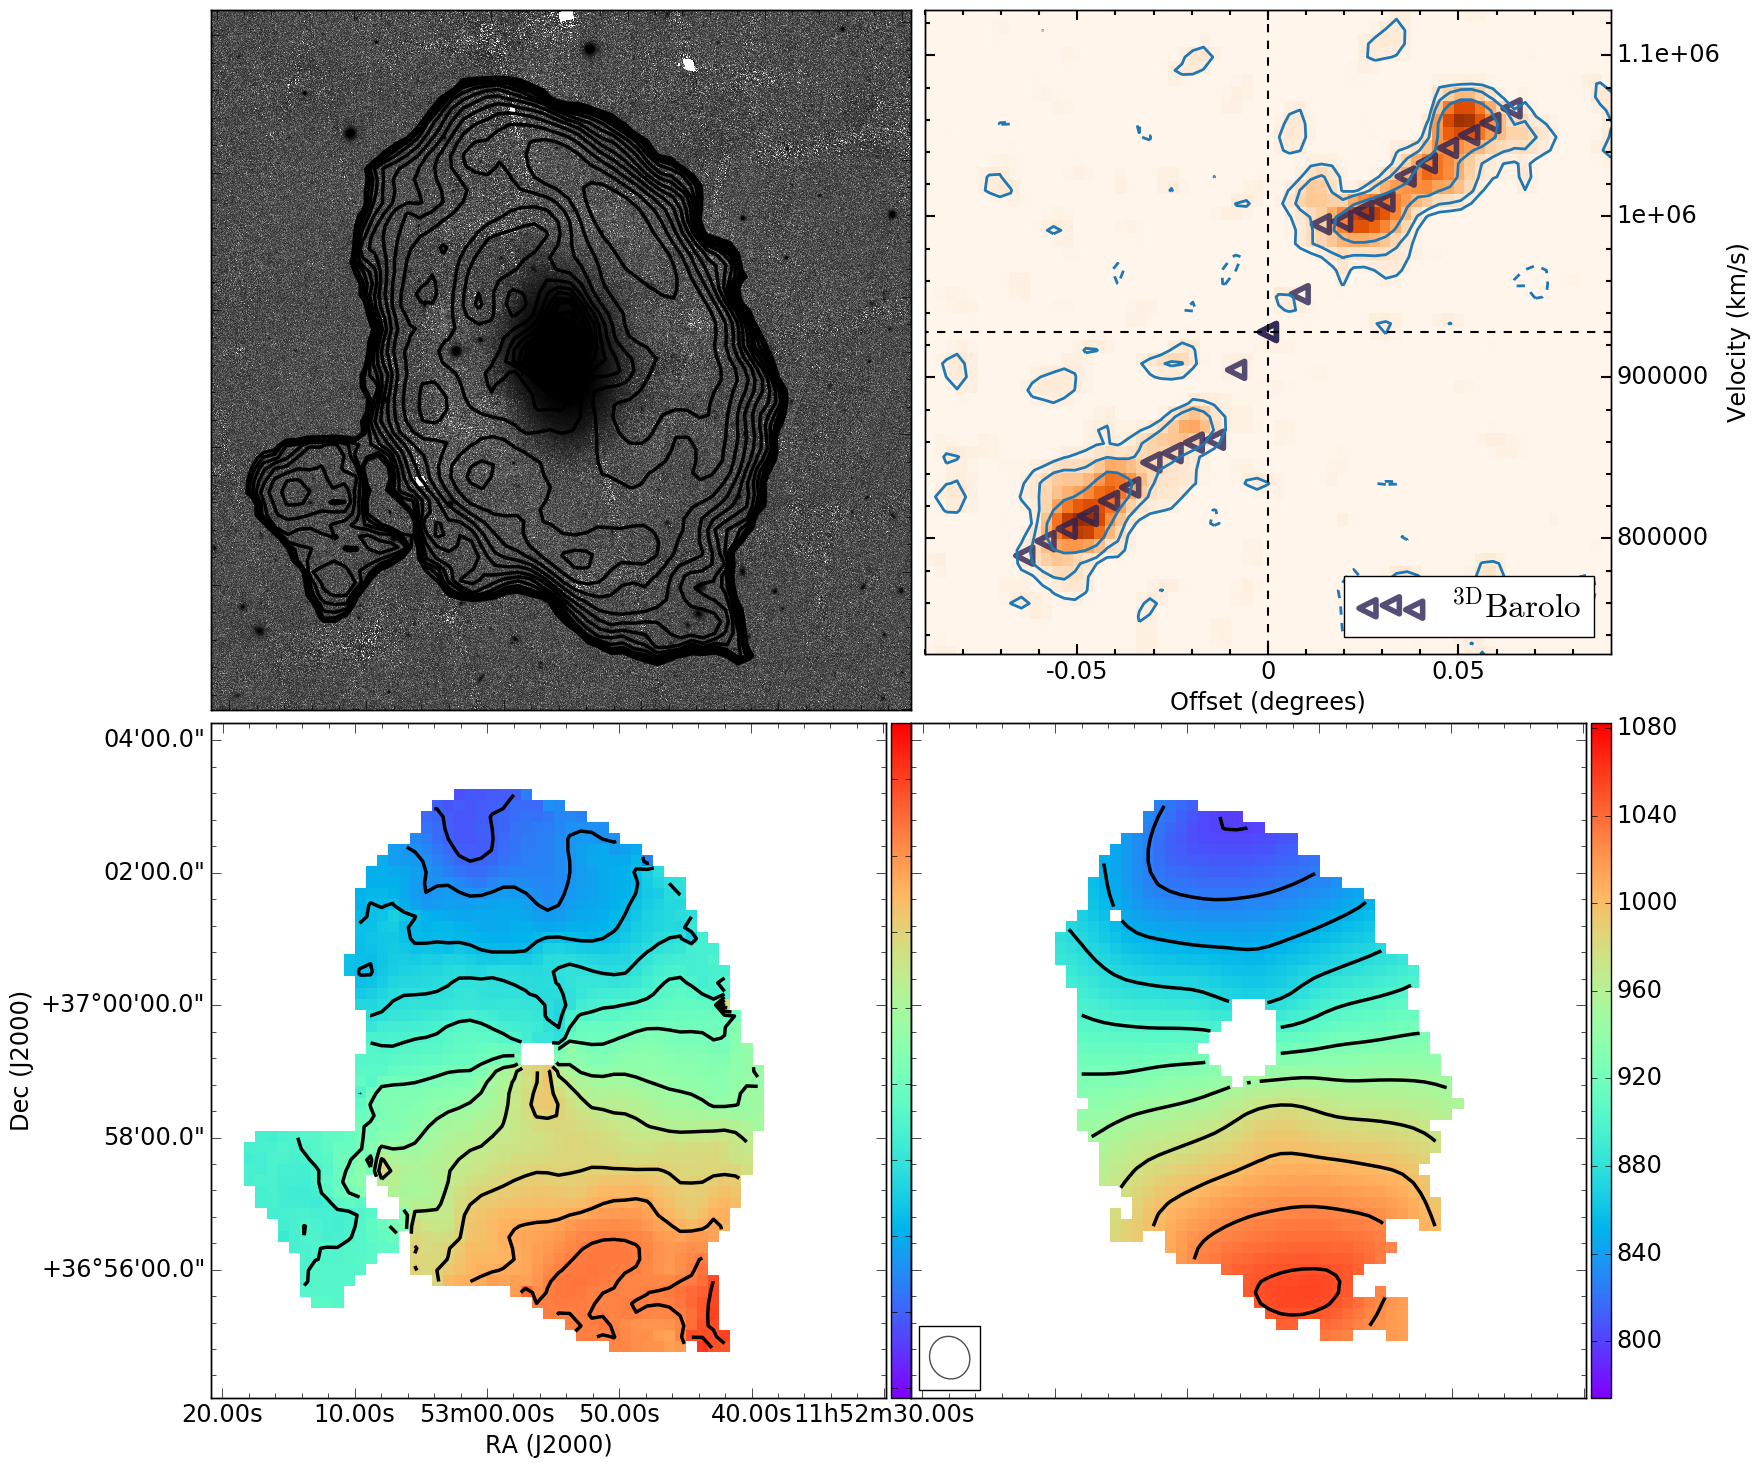
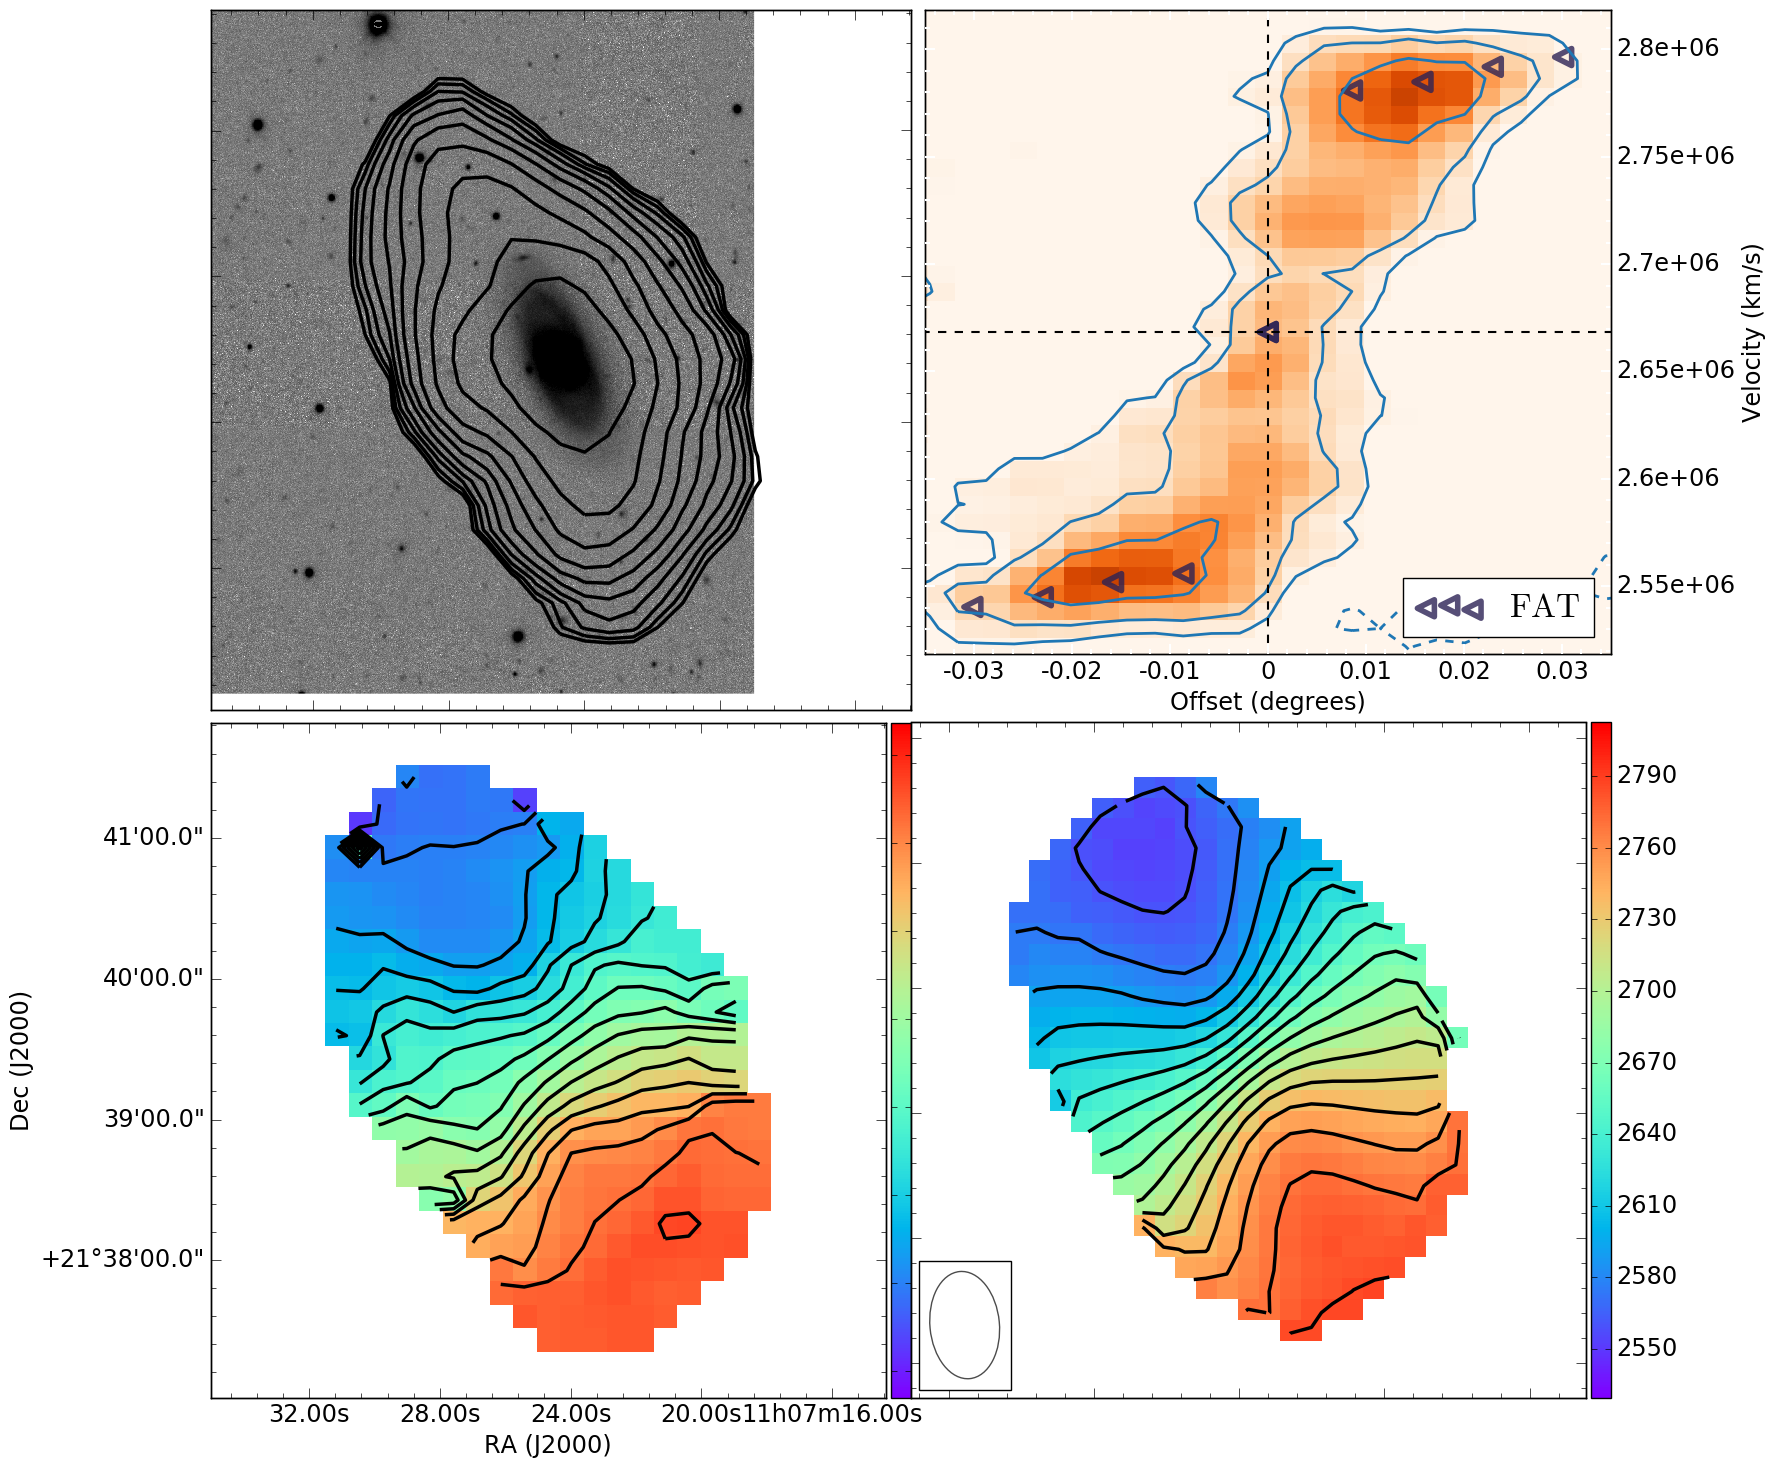
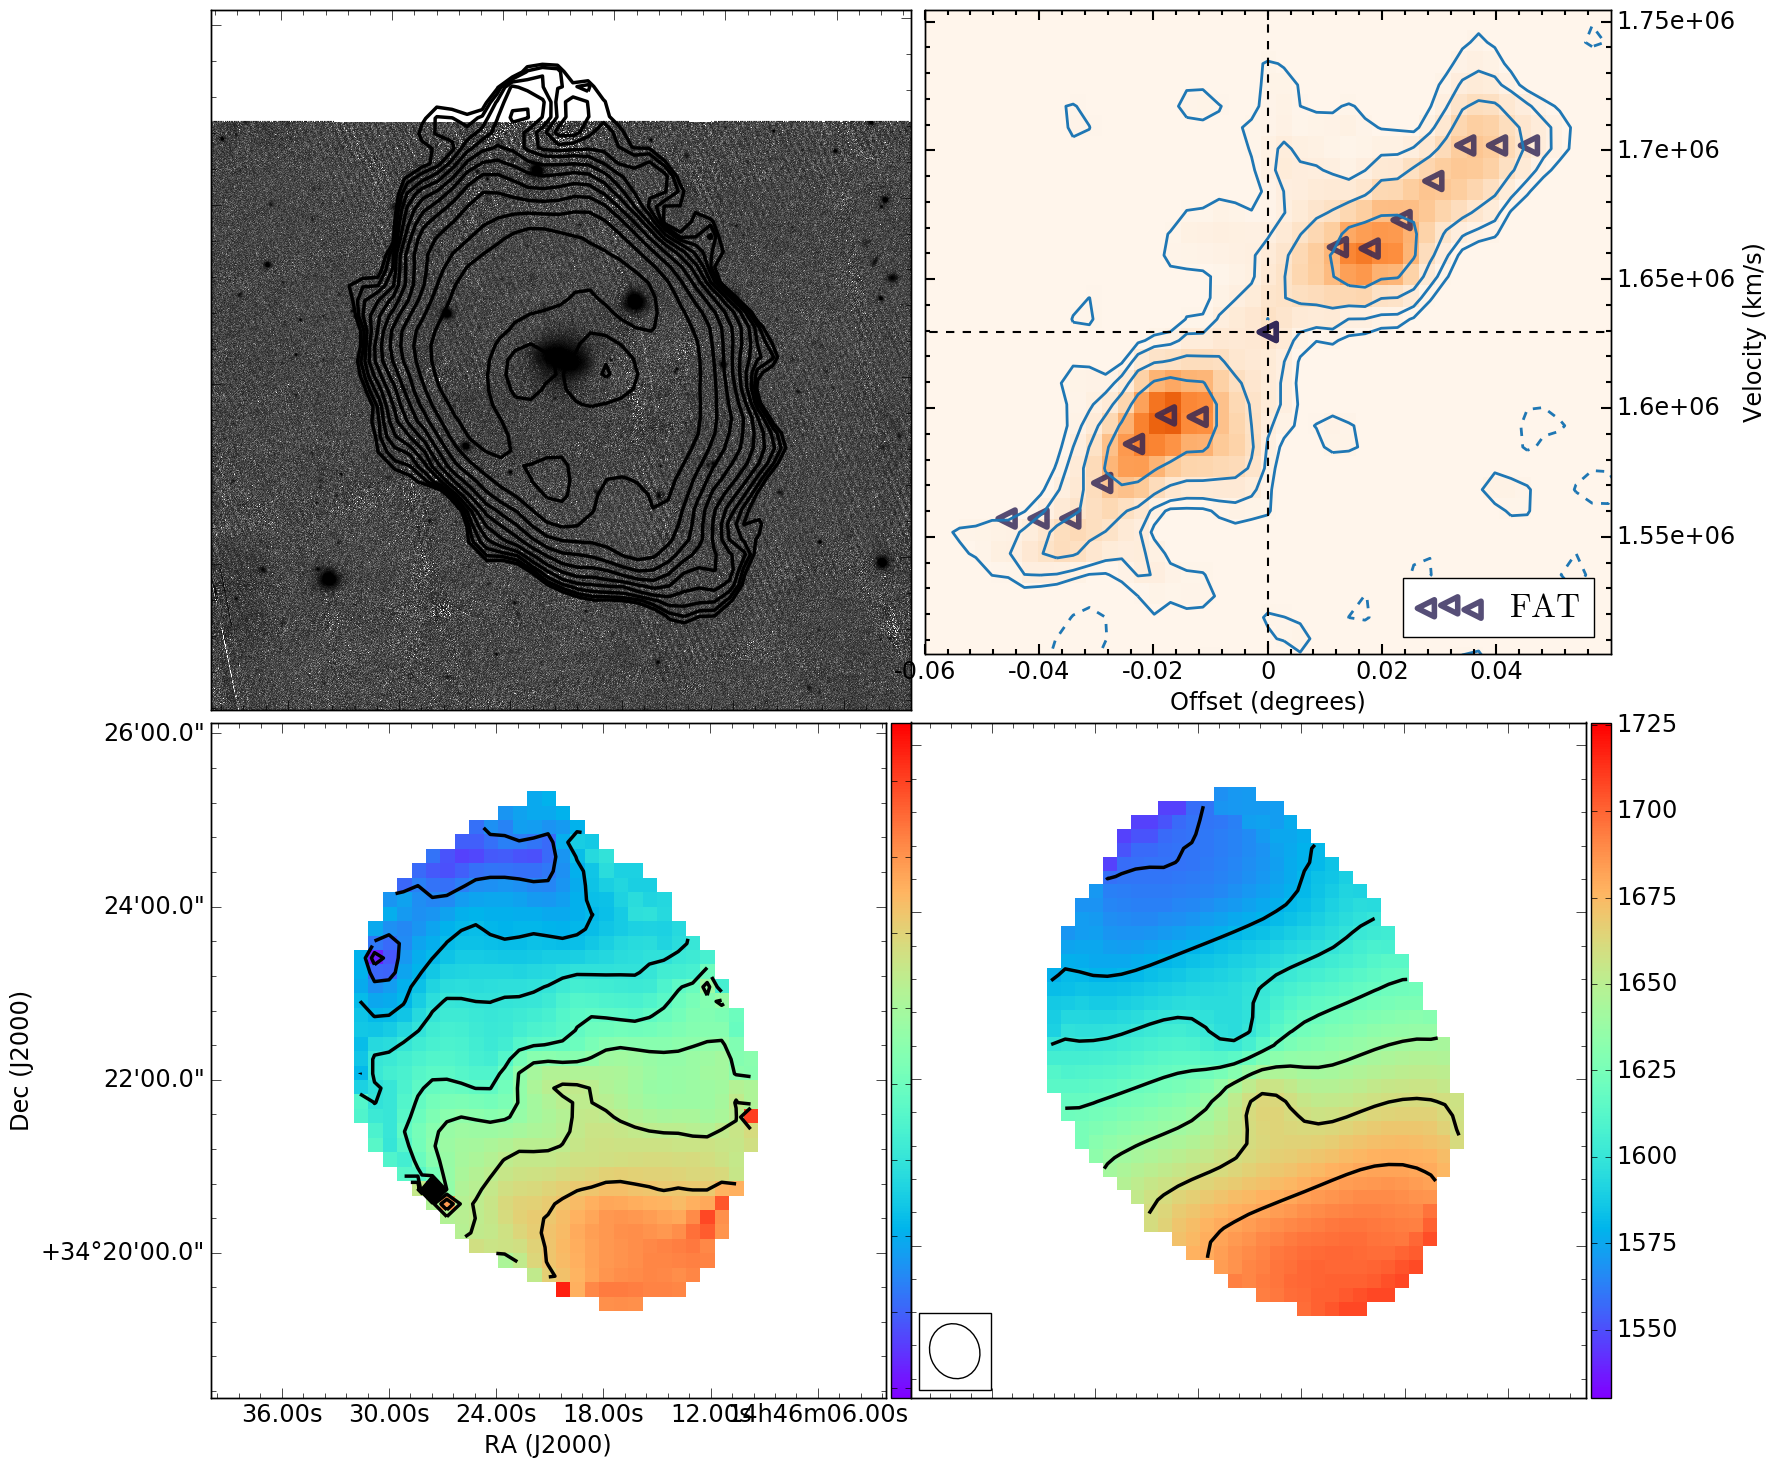
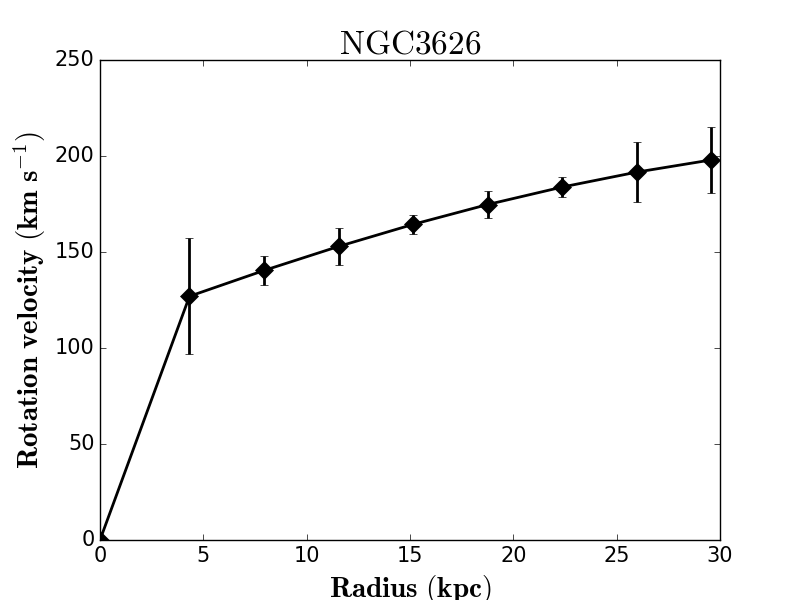
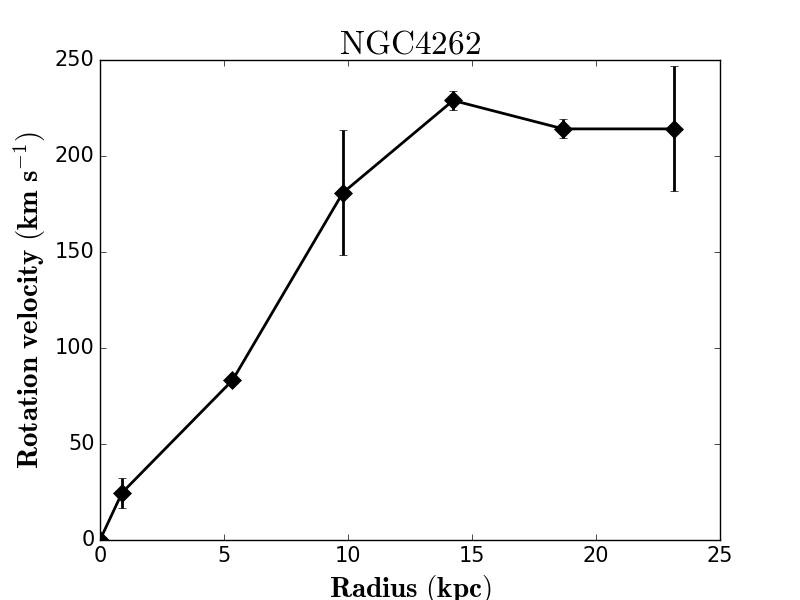
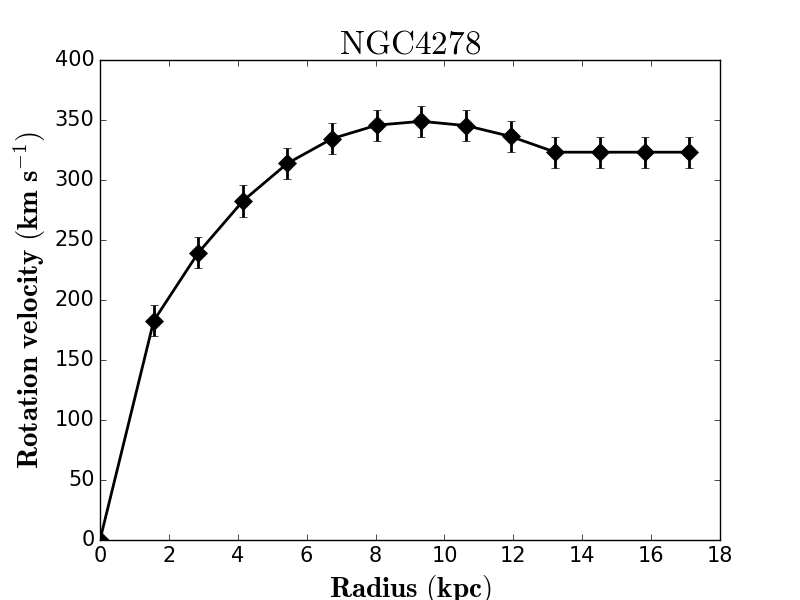
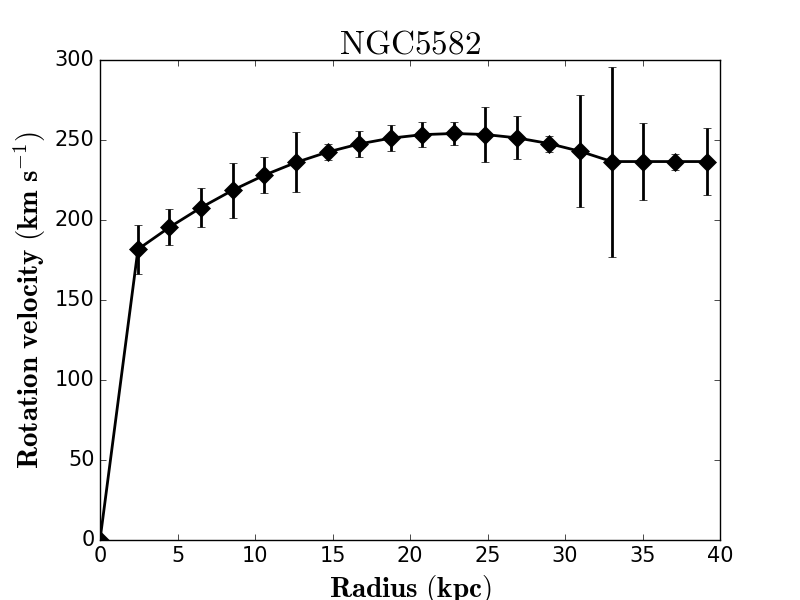
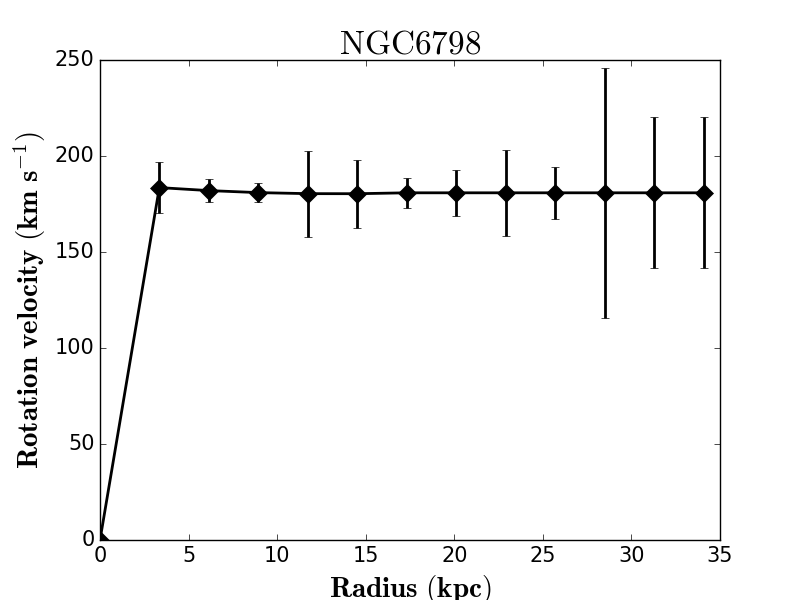
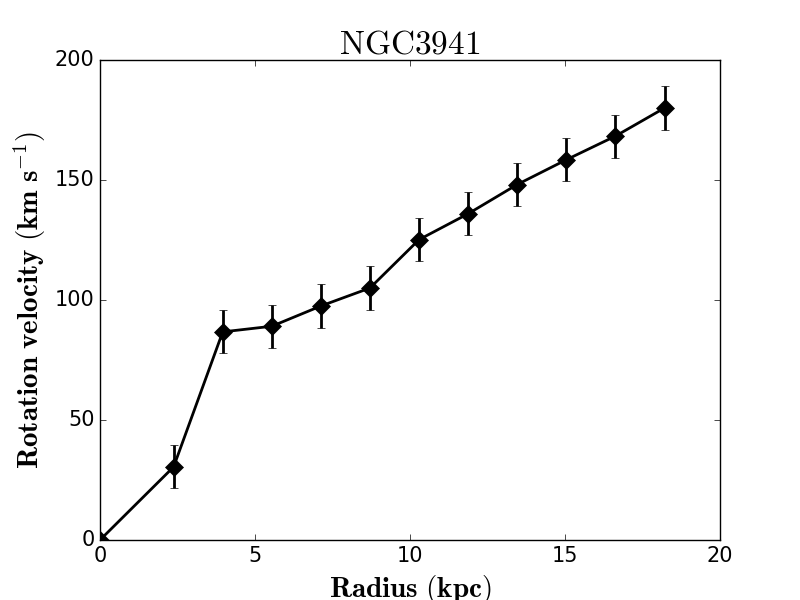
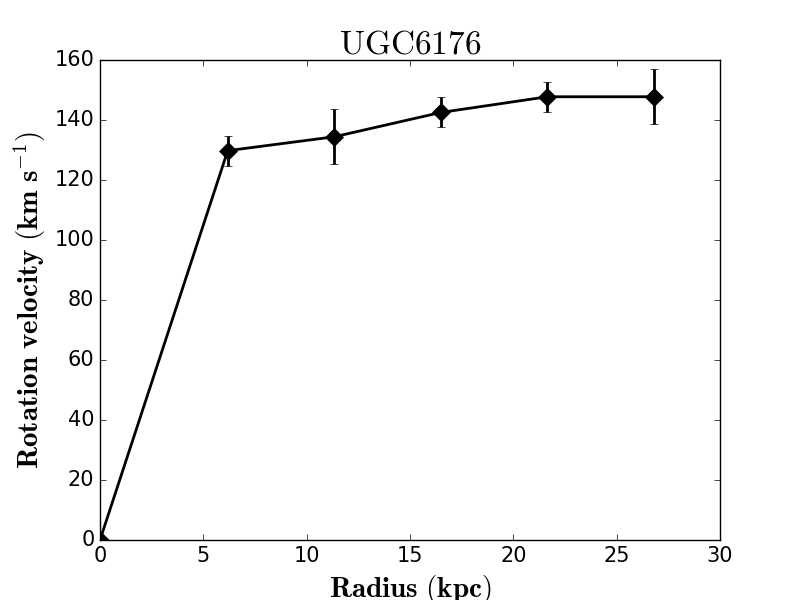
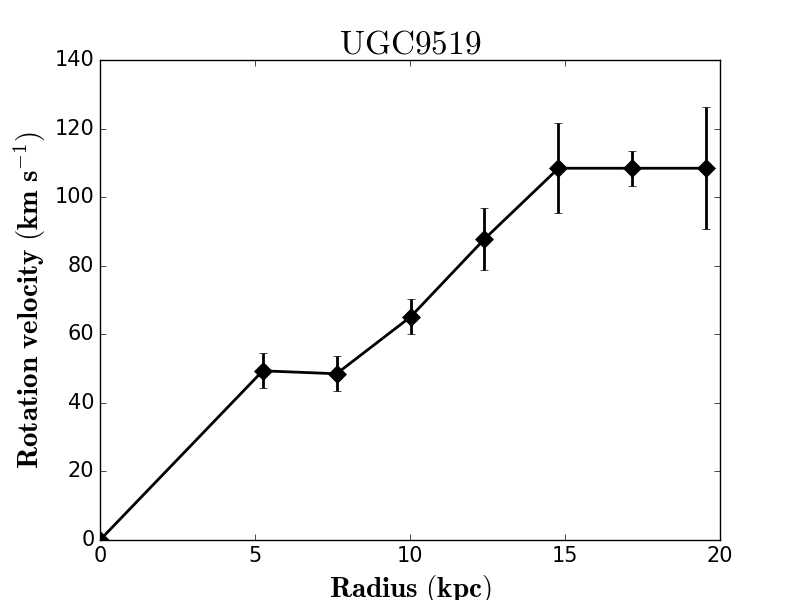
The early–type galaxies were selected from the ATLAS3D Hi survey of a volume-limited, complete sample of 166 nearby early-type galaxies (ETGs) brighter than MK = -21.5 (Serra et al., 2012). In constructing the sub-sample we first restrict the selection to galaxies with morphologies later than T > -4.0. Serra et al. (2012) divided the galaxies with detected Hi into four morphological classes, viz. (i) large discs - most of the Hi rotates regularly and is distributed in a disc or ring larger than the stellar body of the galaxy, (ii) small discs - most of the Hi rotates regularly and is distributed in a small disc confined within the stellar body of the galaxy, (iii) unsettled - most of the Hi exhibits an unsettled morphology (e.g. tails or stream of gas) and kinematics, and (iv) clouds - the Hi is found in small, scattered clouds around the galaxy. In order to calculate the angular momentum accurately, we require a sample where reliable rotation curves can be derived. Hence, we have considered only the galaxies from the first class, i.e. those with large discs that have regular velocity fields. We derived the rotation curve for these galaxies using FAT or 3DBarolo (Di Teodoro & Fraternali, 2015) on the final ATLAS3D data products, i.e Hi cubes with a typical angular resolution of 35 arcsecs. We chose the galaxies that are well resolved across its major axis ( 6 beams). Our final sample consists of those galaxies for which reliable rotation curves could be obtained by FAT or BAROLO. BAROLO was used to derive the rotation curve for only one of the galaxies (NGC 3941), since the FAT derived rotation curve was unreliable.Two of the early–type galaxies (NGC3626 and NGC3941) have companions, which were excluded for the measurements of mass and specific angular momentum. The derived rotation curves and surface brightness profiles for the final sample of early–type galaxies are shown in Figures 17 and 19 respectively. In Fig. 6 - 15, we show (i) the integrated Hi intensity map contours overlaid on the optical image, (ii) Position-Velocity (PV) diagram taken along the major axis of the galaxy with the rotation curves overlaid on them. The dashed lines indicate the systemic velocity and kinematic center. The overplotted violet triangles represent the rotation curve derived by ’FAT’ (iii) the intensity weighted first moment of the galaxy, and (iv) velocity field of the best fitting FAT model for all the HUDs and early-type galaxies. We find that all the rotation curves broadly follow the PV diagram. We note that PV diagrams are not fully representative of the rotation curve as they may reflect the effects of non-circular motion while FAT and other algorithms also take pixels off the kinematic major axis into account.
As mentioned above, in our analysis we also use the published data from various earlier studies; the details are given in the relevant sections.
2.2 Measuring mass and specific angular momentum
The Hi mass was calculated using the standard formula, MHI= 2.36 105 S , where is the distance in Mpc, is the flux density in Jy and is in km s-1 (Roberts, 1962). The distances for early-type galaxies are taken from Cappellari et al. (2011), which were obtained with the surface brightness fluctuation (SBF) method. These distance estimates have an error of 7 – 10 . The distance estimates for the UDGs are taken from Leisman et al. (2017), which were calculated using the ALFALFA flow model, and the distance uncertainties due to proper motions are 15 . The distances for the Ursa Major spiral galaxies are taken from Sorce et al. (2014), which were derived by using the Tully Fisher relation as an empirical distance estimator which provides a distance accuracy of 3–10 . We assume a conservative error of 15 on distance measurements for all the galaxies. The quoted uncertainties on gas mass are based on the errors on the distance measurements as well as the error on flux densities. The error on the flux density is dominated by the calibration uncertainties, which are typically 10%. We do not consider the mass to light ratio uncertainties while calculating the uncertainties of baryonic masses for the ultra-diffuse galaxies as they are dominated by the gas mass. We calculate the uncertainties of the baryonic masses for the UMa spirals (following (Lelli et al., 2016)) by
| (1) |
where and , are the errors on Mg and L due to uncertainties on total fluxes and is the uncertainty in mass to light ratio. We assume 0.1 dex for K’-band data (Ponomareva et al., 2018). The specific angular momentum j is computed by numerically evaluating the integral,
| (2) |
where, is the azimuthally averaged surface density, v(r) is the circular velocity at radius r, i(r) is the difference in inclination with respect to the central disc inclination and R is the radius of the gas disk. This integral is evaluated separately for the stellar, the gaseous, and the baryonic components of the galaxy. The procedure used for the estimation of specific angular momentum is similar for the galaxies from this work and for the galaxies that are taken from the literature. In this work, only the stellar, Hi, and Helium contributions to the baryonic mass are considered. Hence, the total baryonic surface density is = + 1.35 , where the 1.35 factor accounts for the He contribution. No correction was made for molecular hydrogen as well as ionized gas. The optical deprojected radial surface brightness profiles were derived by fitting elliptical annuli to the optical images by using the ELLINT task in the GIPSY package. The specific angular momentum of gas, stars and baryons was computed by numerically evaluating the integral in Equation (1). For all quantities, the integral converges within the error bars. The uncertainties on the specific angular momentum of the various components are based on the errors on distance measurements, on rotation velocities, surface brightness values, and inclination values. The uncertainty in jk ( being stars or gas) is given by:
| (3) |
where is the inclination ( is its uncertainty). vi is the rotation velocity at each point on rotation curve ( is its uncertainty), Si is the surface brightness value at each point on surface brightness profile ( is its uncertainty), Ji is the evaluated angular momentum in each ring and J is the total angular momentum of galaxy. The errors on specific angular momentum are often dominated by the errors on distance measurement.
In Tables 1 and 2, we present the measurements of stellar, gas, and baryonic mass and specific angular momentum of UMa spiral galaxies and ultra-diffuse galaxies respectively: The columns are as follows. Column (1) name of the galaxy; (2) stellar mass ; (3) gas mass; (4) total baryonic mass; (5) stellar specific angular momentum; (6) gas specific angular momentum and (7) baryonic specific angular momentum. In Table 3 we show the properties and the measurements of the gas mass and gas specific angular momentum of the early–type galaxies. The columns are as follows. Column (1) name of the galaxy; (2) morphology ; (3) distance in Mpc (4) gas mass; (5) gas specific angular momentum and (6) Notes on galaxies.
2.3 Convergence criteria
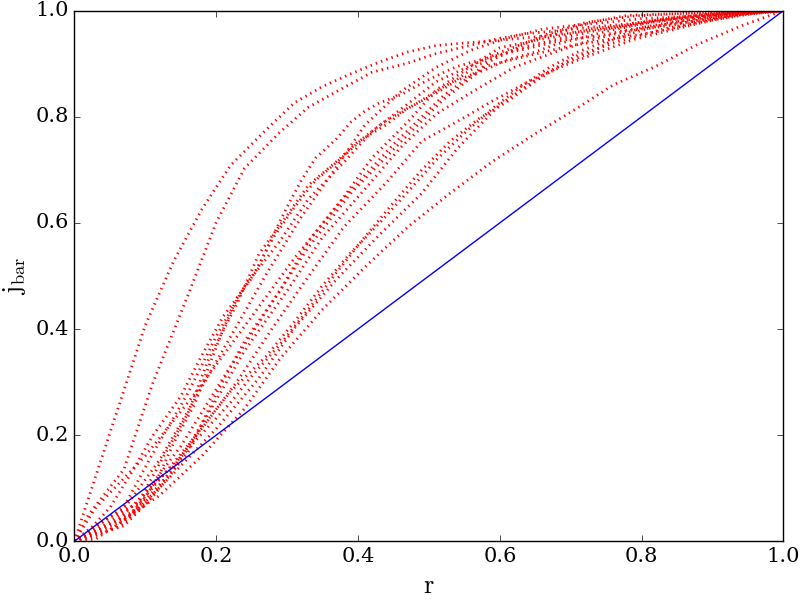
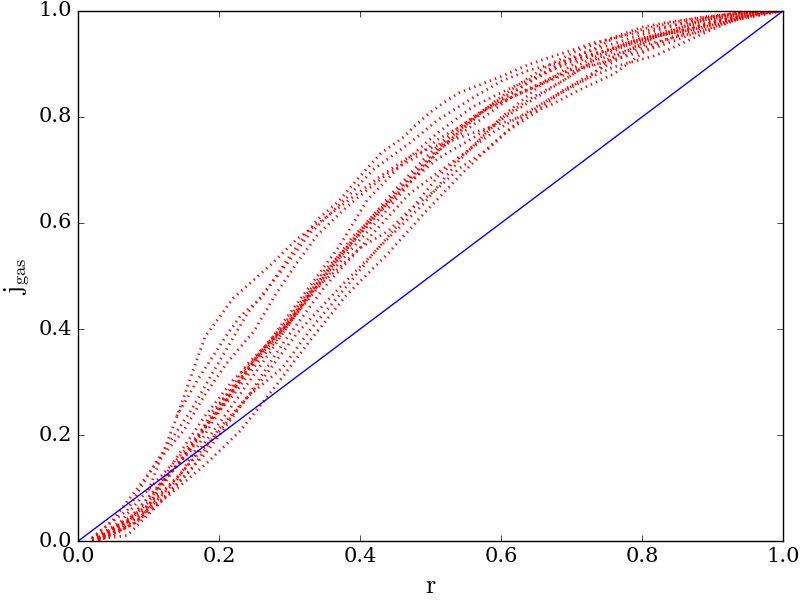
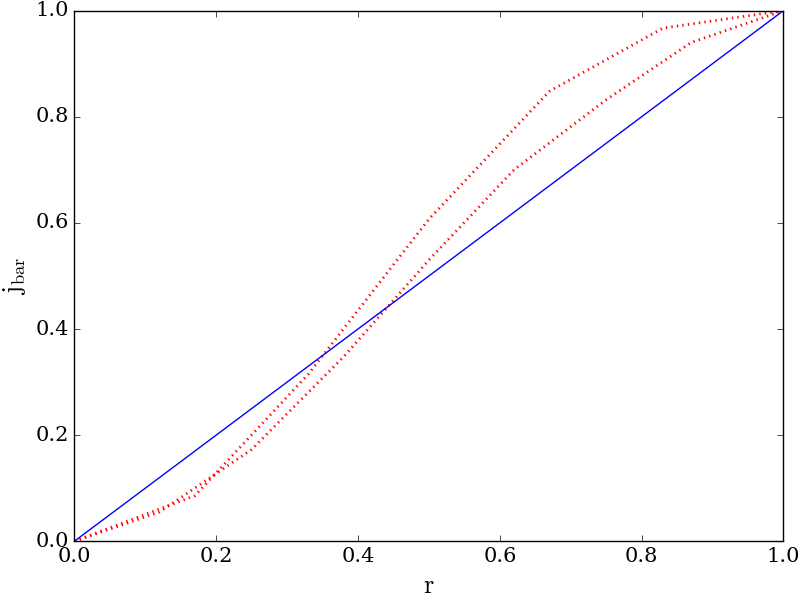
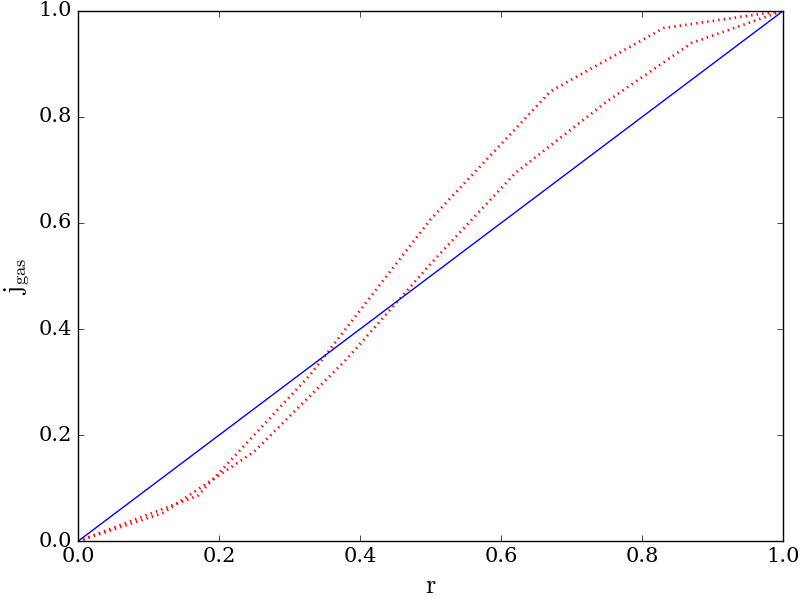
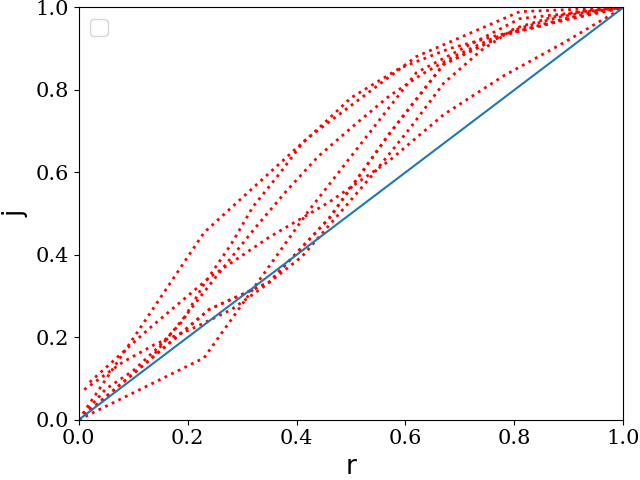
We show the cumulative specific angular momentum profiles for 2 HUDs (both and profiles), 16 UMa spirals (both and profiles), and 8 early-type galaxies (only profiles) in Figures 20, 21, and 22 respectively. We normalize the specific angular momentum and radius axes to allow the comparison between the profiles. We also make a quantitative assessment of the convergence of these profiles. We follow Posti et al. (2018) to determine whether the specific angular momentum of a galaxy has converged or not. We select galaxies satisfying the following criteria:
| (4) |
i.e. that the last two points of the j profile differ by less than 10 and that the logarithmic slope of the j profile in the outer-most point is less than 1/2. We find that all the galaxies except two early-type galaxies (NGC3626 and NGC6798) follow the convergence criterion.
We also fit a function = k. exp(-a/x), (which is zero at x 0+ becomes constant as x ) to the last three points of the cumulative j profile. We then, take the ratio (k being baryons/gas) of at last measured point to the maximum value that would have if extrapolated to infinity. This ratio, (i.e. the convergence factor), is calculated for all the jbar and jgas profiles and listed for all the galaxies in Tables 4, 5 and 6. Only 2 of the early-type galaxies (NGC 3626 and NGC6798) and 1 of the ultra-diffuse galaxies have a convergence factor 0.7.
Several angular momentum studies, e.g. Murugeshan et al. (2020), Elson (2017) do not check for convergence. Disk galaxies show a range of rotation curve shapes with low mass galaxies typically having rising rotation curves. However, in general, dwarf galaxies show a large diversity of rotation curve shapes, even at fixed maximum rotation speed (e.g. Oman et al., 2015). Restricting the analysis to a set of galaxies that meet a user defined convergence criterion may lead to a non representative sample, particularly for the galaxies with lower baryonic masses. For studies where one is considering the specific angular momentum of the galaxy disk, (as opposed to making inferences about the halo), it is not clear that a restriction of the sample to those whose specific angular momentum curves meet a user defined convergence is essential.
3 Results
3.1 Specific angular momentum of the Hi disk
As discussed in the introduction, recent simulations indicate that the angular momentum of galaxies is governed more by evolutionary processes and the physics of the baryonic material than by the the initial spin of the ‘parent’ dark matter halo. Numerical simulations also support the picture that star formation occurs in marginally stable gas disks, where inflows provide both the gas required for the star formation, as well as energy to keep the disks marginally stable against gravitational instability (e.g. Dekel et al. (2013)). Models of disk galaxies where the disks are critically stable also appear to provide a reasonable description of the specific angular momentum-mass relation of the gas disks of local galaxies (e.g. Zasov, 1974; Zasov & Zaitseva, 2017; Kurapati et al., 2018; Romeo, 2020). Observational constraints on models where the gas mass and angular momentum of Hi disks are set by the requirement that the disk be critically stable have been presented by e.g. Obreschkow et al. (2016); Zasov & Zaitseva (2017). It would hence be interesting to look at how well such models fit the Hi specific angular momentum () and the Hi mass () for our heterogeneous sample of galaxies.
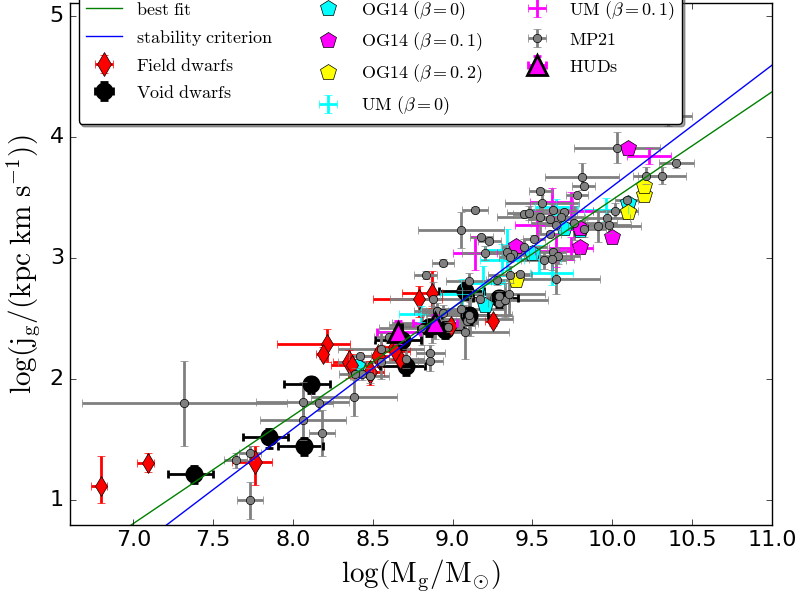
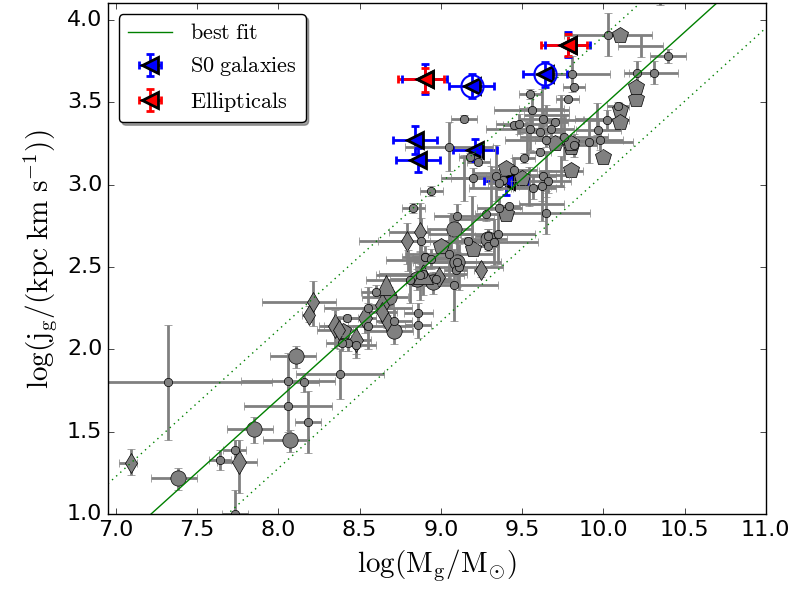
We show in Fig. 1 the Hi specfic angular momentum and Hi gas mass relation for our sample galaxies along with other samples taken from the literature (details are given in the figure caption). Interestingly, the galaxies show a smooth – relation across the entire mass range. We estimate the best fitting linear regression between and by using the BCES algorithm (Akritas & Bershady, 1996) that accounts for errors on both and as well as for the fact that these errors are correlated. The best-fit - relation is given by, = qα with = 0.89 0.05 and log10 q = -5.42 0.41. We do not include early–type galaxies while fitting for the – relation since these galaxies are peculiar in that the gas is counter-rotating or misaligned with the stellar kinematics. We discuss these galaxies further below. The existence of such a relation between the Hi mass and the Hi specific angular momentum (suggested earlier also by e.g. Zasov (1974)) is interesting in itself, and we return to this in Sec. 4. We also note that the slope that we find for the – relation is significantly different from that seen for the – relation (i.e. ) by Posti et al. (2019). The slope we get is slightly smaller than (but statistically consistent with) the value of recently reported by Mancera Piña et al. (2021). We return to a discussion of this in Sec. 4. Here we focus on how the relation that we find compares with expectations from the critically stable disk model.
The commonly used criterion for stability is the Toomre Q parameter. Strictly speaking, the Toomre criterion is for a thin single component disk, while at least some of the galaxies that we are analysing have significant stellar masses as well as a non negligible disk thickness. Issues associated with applying the Toomre-Q criterion to such galaxies have been discussed in detail in Zasov & Zaitseva (2017) and Romeo (2020). Romeo (2020) in particular takes a phenomenological approach, and suggests that the different components (molecular, atomic, stellar) of galaxy disks follow scaling laws derived from the relation
where , with being the disk averaged velocity dispersion of component (Hi , H2, or stars), and is the mass averaged Toomre-Q parameter. The value of is not derived from fundamental principals, but is instead determined by a fit to observational data. Romeo (2020) uses data from Leroy et al. (2008) (which overlaps with the Obreschkow & Glazebrook (2014) sample) to determine the value for . For the Hi component the derived value is 11 km/s. We show this empirical relation, log(j) = log(M)-6.41 (with km/s) in Fig. 1. As can be seen, it provides a good fit to the data, the majority of which is independent from the sample used by Romeo (2020). This further supports the idea that the structure of the Hi disks in galaxies settles to a critical density, as would happen in models where the star formation rate (and hence mass outflow rate) is driven by the mass inflow rate.
As discussed in the introduction, simulations also show that spheroidal stellar distributions with extended counter-rotating gas disks could arise in systems where there has been a recent accretion of gas whose spin is not aligned with that of the parent galaxy (e.g. Kretschmer et al., 2020). In the context of such models it would be interesting to examine the position of extremely gas rich early–type galaxies in the plane. As can be seen from Table 1, for many of the galaxies in our sample the gas is counter-rotating or misaligned with the stellar kinematics, consistent with results from simulations. Figure 2 shows the location of early–type galaxies, as well as all our other sample galaxies in the – plane. The green solid line indicates the best fit line using the linear regression for all the galaxies except the early–type galaxies and green dotted lines indicate 3 vertical scatter. As can be seen, most of the early–type galaxies lie above the 3 scatter, i.e. their Hi disks have significantly higher specific angular momentum as compared to other galaxies with the same Hi mass. A Kolmogorov–Smirnov (KS) test(Fasano & Franceschini, 1987, https://github.com/syrte/ndtest/blob/master/ndtest.py) gives a probability of 7 10-4 for the early–type galaxies being drawn from the same distribution as the other galaxies.
Two of these early-type galaxies (NGC3626 and NGC6798, marked with a circle around the blue open triangles in Fig 2) do not satisfy the convergence criterion. We note that they do not appear to have discrepant as that of the early-type galaxies with converged specific angular momentum curves. If the lack of convergence means that these two galaxies have a higher specific angular momentum than measured, it does not affect the result that the early–type galaxies in our sample have significantly higher than expected from the - power law. Our observations hence support the picture in which these gas rich early-type galaxies have acquired the gas via a recent inflow of high, but misaligned sAM gas. The elevated specific angular momentum is consistent with the decreased star formation efficiency of early–type galaxies since higher angular momentum stabilizes the gas against Jeans instabilities and subsequent star formation (Toomre, 1964; Obreschkow et al., 2016).
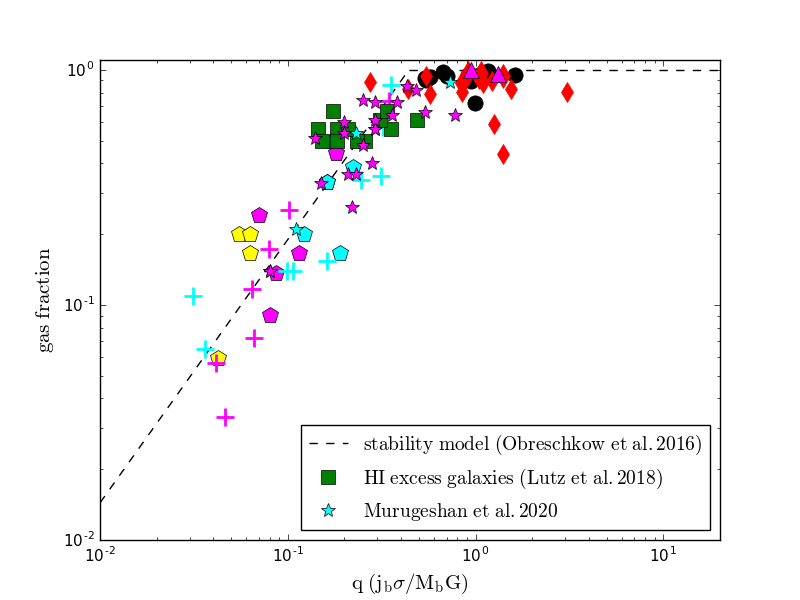
We also show the scaling relation between the atomic gas fraction (fatm) and the stability parameter (q) for all the galaxies in our sample in Figure 3 for which these parameters are available. The dotted line shows the relation expected from Obreschkow et al. (2016). We find that all the galaxies in our sample largely follow the relation consistently. We do not show early–type galaxies in this figure since we can not measure their baryonic specific angular momentum as the gas does not in general co-rotate with the stars for these galaxies. The dwarf galaxies lie in the saturated region (f 1). We also show the Hi excess (higher atomic gas fraction) galaxies from Lutz et al. (2018) for comparison; they follow the relation between the atomic to baryonic mass fraction and the global stability parameter given by Obreschkow et al. (2016).
3.2 Baryonic Specific Angular Momentum
Several earlier studies (e.g. Obreschkow & Glazebrook, 2014; Kurapati et al., 2018; Murugeshan et al., 2020; Mancera Piña et al., 2021) have studied the correlation between the specific angular momentum and mass of the baryonic (i.e. gas + stars) component of galaxies. In particular Kurapati et al. (2018) investigated the relation considering the baryonic mass for a sample of gas rich dwarf galaxies in a range of environments, using the bulgeless spiral relation found by Obreschkow & Glazebrook (2014) for comparison. They concluded that the baryonic specific angular momentum of dwarfs was higher as compared to the extrapolation of the trend seen for higher mass bulge-less spirals. The increase in specific angular momentum was found to set in at a mass threshold of 109 M⊙. However, more recent studies (e.g. Mancera Piña et al. (2021)) find that the -relation is well fit by a single power law.
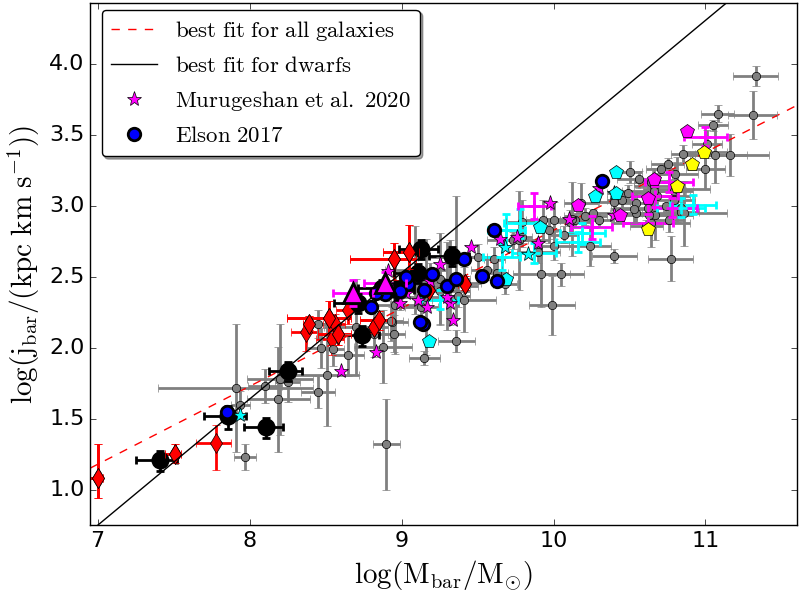
Fig. 4 shows the relation between the baryonic specific angular momentum and the baryonic mass for the UMa sample of spiral galaxies from this work, along with the galaxies in Obreschkow & Glazebrook (2014); Butler et al. (2017); Chowdhury & Chengalur (2017); Elson (2017); Kurapati et al. (2018); Murugeshan et al. (2020); Mancera Piña et al. (2021) We do not use the early–type galaxies from the current work this analysis since, as discussed above for these galaxies the gas does not in general co-rotate with the stars. If fit a single power law to our sample (red dashed line in Fig. 4), we obtain a slope 0.55 0.02 in good agreement with the slope measured by Mancera Piña et al. (2021). However, all the galaxies having 108 M⊙ lie significantly below the relation while the galaxies having 108 M 109 M⊙ are consistently above the relation. In this context, we note that the Mancera Piña et al. (2021) sample does not contain galaxies with baryonic mass lower than 108M⊙. This suggests that there may be some curvature in the the – relation, and it may not be best described by a single unbroken power law.
In order to test how well the – relation is described a single unbroken power law, we estimate the best fit linear regression between and independently for two separate mass ranges, viz. galaxies with 109 M⊙ and for the galaxies with 109 M⊙. We find significantly different slopes for the – relation, with a slope of 0.80 0.05 for low mass galaxies and a slope of 0.52 0.02 for high mass galaxies. This suggests that a single power law is not the best description of the data. On the other hand, the slopes of - relation match within the error bars for low mass galaxies ( 0.85 0.05) and high mass galaxies ( 0.93 0.07), suggesting that a single power law is an adequate description.
We also use the “Chow test" (Chow, 1960) to test whether the – relation is well fit by a single unbroken power law. The test checks for the statistical significance of postulated change in slope in a regression. We run the Chow test on both the – and - relations (https://github.com/jtloong/chow_test) to test the significance of a difference in slope between the high and low mass ends, with the nominal dividing point taken as 109 M⊙. As per the Chow test, the null hypothesis that the baryonic j-M relation follows a unbroken power law is rejected at a high significance, with a p value of 5.5 10-5. This indicates that there is a significant change in slope, with a broken power law providing a better fit. We note that the test does not independently identify a sharp break-point; a curved relation with a gradual change in slope as one moves from lower to higher baryonic masses would also be better fit by a broken power law rather than a single one. In contrast to this, we find a fairly large p value (0.2) for the gas j-M relation which indicates that it is adequately fit by a single power law. We note that the number of galaxies with low baryonic masses in the sample is still quite modest, and it is important to increase the sample size at the low mass end. We return to a discussion of the possible reasons for the change in slope seen in the relation in the next section.
Finally, we draw attention to one more feature in Fig. 4, the location of the ultra-diffuse dwarfs. Ultra-diffuse dwarf galaxies (UDGs) are a recently discovered population of very low surface brightness galaxies, which have stellar masses of dwarfs, but have sizes as large as L∗ galaxies (van Dokkum et al., 2015). The majority of the UDGs are red and appear more common in clusters. However, galaxies with extreme ratios of stellar mass to stellar scale length were also discovered in Hi surveys of isolated environments (e.g. Leisman et al. 2017). These galaxies are called Hi–bearing ultra diffuse galaxies (HUDs), which are bluer and have significant reservoirs of Hi as compared to the UDGs in the clusters. Several formation scenarios have been proposed to explain the formation of the UDGs. Some authors propose a scenario in which UDGs are failed Milky Way like galaxies which lost their gas after forming the first stars (van Dokkum et al., 2015) and others argue that they are genuinely dwarf galaxies residing in high spin parameter halos (Amorisco & Loeb, 2016). These formation scenarios can be tested by measuring the angular momentum of UDGs and comparing them to the normal dwarf galaxies. Figure 4 shows the baryonic specific angular momentum versus the baryonic mass of Hi–bearing UDGs (magenta triangles) and normal dwarf galaxies of similar masses. We find that the specific angular momentum of Hi–bearing UDGs is similar to other normal dwarf galaxies at a given mass. This is in contrast with the formation scenarios that predict that UDGs are genuinely dwarf galaxies residing in high spin haloes. We note that our result is in contradiction with a recent analysis by Mancera Piña et al. (2021), who find that ultra diffuse galaxies have higher-than-average stellar specific angular momentum, but have circular velocities much lower than galaxies with similar baryonic mass. They assume flat rotation curves and exponential light curves and approximate the stellar specific angular momentum to be the product of circular velocity and the stellar disk scale length since they lack the resolution to integrate angular momentum over the entire disk. This, along with the very small size of our sample, make it important to confirm these results with high resolution observations of a larger sample.
4 Discussion
As we saw above both the – relation (this work and Mancera Piña et al. (2021)) as well as the – relation (Posti et al., 2018) follow an unbroken power law over the mass range of 107 – 1010.5 M⊙. However their slopes are very different, viz. with slopes of (this work) and (Posti et al., 2018) respectively. In contrast to these relations, the - relation is better fit by a broken power law, with gas rich low mass galaxies having higher specific angular momentum compared to the extrapolated trend from high mass galaxies. We test the scenario that this increase in baryonic specific angular momentum essentially reflects the different relative contributions of the stellar and gas angular momenta to the total baryonic angular momentum following from the different slopes of stellar and gas j–M relations.
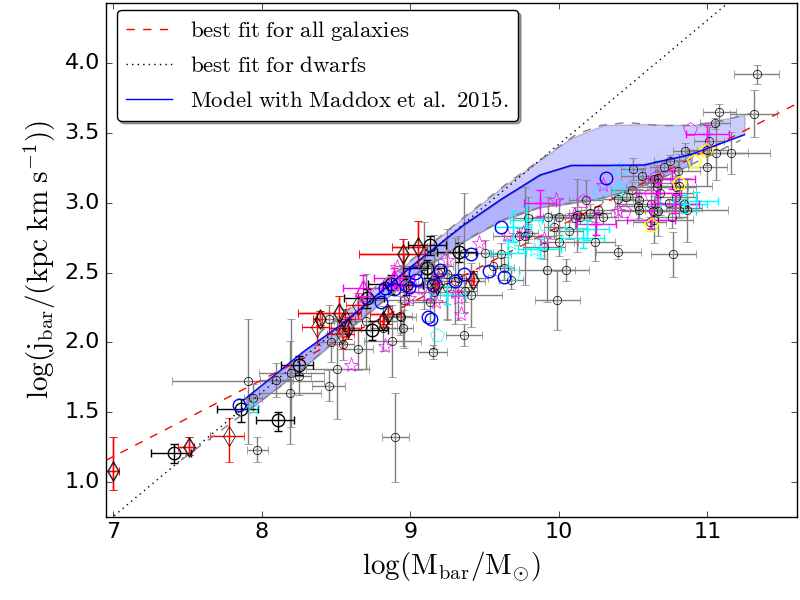
We calculate the general expected trend of with by using the observed Mg - Ms and - and js – Ms relations as well as the relation between MHI and Ms from Maddox et al. (2015). The predicted - curve from these relations is shown in Fig. 5, where we have included the contribution of helium to the gas mass by multiplying MHI by a factor of 1.35. For the predicted relation we have used the median Hi mass values and their 1 uncertainties derived for galaxies in the Maddox et al. (2015) sample for which SDSS spectra are available. The blue solid curve indicates the expected - relation and the blue shaded region indicates the 1 scatter. The relation obtained if use the relation from Maddox et al. (2015) derived from the sample that includes galaxies for which no SDSS spectrum is available matches the blue curve within the 1 scatter. As can be seen, the model curve is in broad qualitative agreement with the data showing a change in slope around , although the values in this mass range are somewhat larger than the observed points. We note that the actual gas fractions of the sample being used would shift the location of the points in the – plane. However, the broad qualitative agreement between this simple model and the data supports the idea that the different slopes obtained at the low and high mass ends of the relation is a consequence of the changing contribution of the stars and gas to the total angular momentum at the high and low ends.
It is also interesting to ask how the power law relations between the specific angular momentum and the mass fit in with the other known scaling relations? To address this question we consider a simple model galaxy where the stars and gas have exponential surface brightness profiles with scale lengths rs and rg as well as a flat rotation curve with V(r) = Vc. This gives j Vcr. From this expression we calculate the expected slope () for the - relation by using the stellar mass size relation, rs M (Bell & de Jong, 2001) and the stellar TF relation, Vc M (Bloom et al., 2017), which gives 0.28+0.31 = 0.59 which compares well with the observed slope of 0.55 0.02. For the gas rich galaxies we use the baryonic TF relation, V M (Ponomareva et al., 2018) and assume that the baryons are dominated by gas for the dwarf galaxies, which gives V M. Observations suggest that the Hi mass and radius are related as r M (Wang et al., 2016). This also arises from simulations if we assume a exponential Hi disk, with the inner radius and outer radius being set by molecular transition and observational threshold for detecting Hi (Obreschkow et al., 2009). The combination of baryonic TF relation and the gas mass-size relation gives the slope () for the – relation, 0.51+0.33 = 0.84, in excellent agreement with what we observe. For less gas rich galaxies, if we combine the stellar TF relation Vc M from Bloom et al. (2017) and the gas fraction relation / = -0.53 from Romeo (2020), we find V M. and 0.66+0.51 = 1.17 in reasonable agreement with what we observe. We cannot determine the predicted values of the intercepts, since they depend on the ratio of the size of the HI disk to its scale length, which is not well measured.
5 Summary and Conclusions
We have examined the relation between the Hi mass and the Hi specific angular momentum for a sample of galaxies with well measured rotation curves that spans a range of morphology. Combining this with data from the literature, we find that the relation is well fit by an unbroken power law over the mass range . The scatter in this relation is small, and this supports earlier suggestions that the relationship between the angular momentum and mass is a fundamental scaling relation for galaxies. The slope that we measure for the power law is also significantly different from that expected for dark matter haloes from tidal torquing models which predict , as well as the observed slope of for the stellar component of disk galaxies. The slope we get for the relation is slightly smaller than (but statistically consistent with) the value of recently reported by Mancera Piña et al. (2021). Our sample includes two Hi bearing ultra-diffuse galaxies, and we find that they lie along the relationship defined by the other galaxies in our sample. The only discrepant galaxies are early–type galaxies with large well rotating disks. These are found to have excess angular momentum compared to that predicted by the relation. In all of these galaxies, the Hi disk also appears to be kinematically distinct from the stellar disk, indicating that it represents recently acquired material. Overall, our observations leads us to suggest that the kinematics of the baryonic component of gas rich galaxies is more affected by cold flows and late stage mergers than by the spin parameter of the ‘parent’ dark matter halo as suggested by recent numerical simulations. We also find that the relation is better fit by a broken power law than a single power law, indicating that there is some curvature in this relation. We suggest that the change in slope of the relation arises from the changing gas to stellar mass ratio with mass as well as the different slopes of the and relations.
Acknowledgements
This paper is based in part on observations taken with the GMRT. We thank the staff of the GMRT who made these observations possible. The GMRT is run by the National Centre for Radio Astrophysics of the Tata Institute of Fundamental Research. This work was supported by the DAE grant 12-R&D-TFR-5.02-0700. MV acknowledges support by the Netherlands Foundation for Scientific Research (NWO) through VICI grant 016.130.338 and thanks the NCRA staff for their hospitality. We are grateful for insightful comments from one of the anonymous reviewers that helped improve this paper.
References
- Akritas & Bershady (1996) Akritas M. G., Bershady M. A., 1996, ApJ, 470, 706
- Amorisco & Loeb (2016) Amorisco N. C., Loeb A., 2016, mnras, 459, L51
- Bell & de Jong (2001) Bell E. F., de Jong R. S., 2001, ApJ, 550, 212
- Bett et al. (2007) Bett P., Eke V., Frenk C. S., Jenkins A., Helly J., Navarro J., 2007, MNRAS, 376, 215
- Bloom et al. (2017) Bloom J. V., et al., 2017, MNRAS, 472, 1809
- Brook et al. (2011) Brook C. B., et al., 2011, MNRAS, 415, 1051
- Brooks et al. (2009) Brooks A. M., Governato F., Quinn T., Brook C. B., Wadsley J., 2009, ApJ, 694, 396
- Bryant et al. (2015) Bryant J. J., et al., 2015, MNRAS, 447, 2857
- Bundy et al. (2015) Bundy K., et al., 2015, ApJ, 798, 7
- Butler et al. (2017) Butler K. M., Obreschkow D., Oh S.-H., 2017, ApJ, 834, L4
- Cappellari et al. (2011) Cappellari M., et al., 2011, MNRAS, 413, 813
- Choi & Yi (2017) Choi H., Yi S. K., 2017, The Astrophysical Journal, 837, 68
- Chow (1960) Chow G. C., 1960, Econometrica, 28, 591
- Chowdhury & Chengalur (2017) Chowdhury A., Chengalur J. N., 2017, MNRAS, 467, 3856
- Dekel et al. (2013) Dekel A., Zolotov A., Tweed D., Cacciato M., Ceverino D., Primack J. R., 2013, MNRAS, 435, 999
- Desmond et al. (2017) Desmond H., Mao Y.-Y., Wechsler R. H., Crain R. A., Schaye J., 2017, MNRAS, 471, L11
- Di Teodoro & Fraternali (2015) Di Teodoro E. M., Fraternali F., 2015, MNRAS, 451, 3021
- Dutton (2009) Dutton A. A., 2009, MNRAS, 396, 121
- Elson (2017) Elson E. C., 2017, MNRAS, 472, 4551
- Fall (1983) Fall S. M., 1983, in Athanassoula E., ed., IAU Symposium Vol. 100, Internal Kinematics and Dynamics of Galaxies. pp 391–398
- Fall & Romanowsky (2018) Fall S. M., Romanowsky A. J., 2018, ApJ, 868, 133
- Fasano & Franceschini (1987) Fasano G., Franceschini A., 1987, MNRAS, 225, 155
- Hunter et al. (2012) Hunter D. A., et al., 2012, AJ, 144, 134
- Jiang et al. (2019) Jiang F., et al., 2019, MNRAS, 488, 4801
- Kamphuis et al. (2015) Kamphuis P., Józsa G. I. G., Oh S.-. H., Spekkens K., Urbancic N., Serra P., Koribalski B. S., Dettmar R.-J., 2015, MNRAS, 452, 3139
- Kereš et al. (2005) Kereš D., Katz N., Weinberg D. H., Davé R., 2005, MNRAS, 363, 2
- Kereš et al. (2009) Kereš D., Katz N., Fardal M., Davé R., Weinberg D. H., 2009, MNRAS, 395, 160
- Kretschmer et al. (2020) Kretschmer M., Agertz O., Teyssier R., 2020, arXiv e-prints, p. arXiv:2003.03368
- Kurapati et al. (2018) Kurapati S., Chengalur J. N., Pustilnik S., Kamphuis P., 2018, MNRAS, 479, 228
- Lagos et al. (2018) Lagos C. d. P., Schaye J., Bahé Y., Van de Sande J., Kay S. T., Barnes D., Davis T. A., Dalla Vecchia C., 2018, MNRAS, 476, 4327
- Leisman et al. (2017) Leisman L., et al., 2017, apj, 842, 133
- Lelli et al. (2016) Lelli F., McGaugh S. S., Schombert J. M., 2016, ApJ, 816, L14
- Leroy et al. (2008) Leroy A. K., Walter F., Brinks E., Bigiel F., de Blok W. J. G., Madore B., Thornley M. D., 2008, AJ, 136, 2782
- Lutz et al. (2018) Lutz K. A., et al., 2018, MNRAS, 476, 3744
- Maddox et al. (2015) Maddox N., Hess K. M., Obreschkow D., Jarvis M. J., Blyth S. L., 2015, MNRAS, 447, 1610
- Mancera Piña et al. (2021) Mancera Piña P. E., Posti L., Fraternali F., Adams E. A. K., Oosterloo T., 2021, A&A, 647, A76
- Mo et al. (1998) Mo H. J., Mao S., White S. D. M., 1998, MNRAS, 295, 319
- Murugeshan et al. (2020) Murugeshan C., Kilborn V., Jarrett T., Wong O. I., Obreschkow D., Glazebrook K., Cluver M. E., Fluke C. J., 2020, MNRAS, 496, 2516
- Naab et al. (2014) Naab T., et al., 2014, MNRAS, 444, 3357
- Obreschkow & Glazebrook (2014) Obreschkow D., Glazebrook K., 2014, ApJ, 784, 26
- Obreschkow et al. (2009) Obreschkow D., Croton D., De Lucia G., Khochfar S., Rawlings S., 2009, ApJ, 698, 1467
- Obreschkow et al. (2016) Obreschkow D., Glazebrook K., Kilborn V., Lutz K., 2016, ApJ, 824, L26
- Oman et al. (2015) Oman K. A., et al., 2015, MNRAS, 452, 3650
- Peebles (1969) Peebles P. J. E., 1969, ApJ, 155, 393
- Ponomareva et al. (2018) Ponomareva A. A., Verheijen M. A. W., Papastergis E., Bosma A., Peletier R. F., 2018, MNRAS, 474, 4366
- Posti et al. (2018) Posti L., Fraternali F., Di Teodoro E. M., Pezzulli G., 2018, A&A, 612, L6
- Posti et al. (2019) Posti L., Marasco A., Fraternali F., Famaey B., 2019, A&A, 629, A59
- Renzini (2020) Renzini A., 2020, MNRAS,
- Roberts (1962) Roberts M. S., 1962, AJ, 67, 437
- Rodríguez-Puebla et al. (2016) Rodríguez-Puebla A., Behroozi P., Primack J., Klypin A., Lee C., Hellinger D., 2016, MNRAS, 462, 893
- Romanowsky & Fall (2012) Romanowsky A. J., Fall S. M., 2012, ApJS, 203, 17
- Romeo (2020) Romeo A. B., 2020, MNRAS, 491, 4843
- Sánchez et al. (2012) Sánchez S. F., et al., 2012, A&A, 538, A8
- Serra et al. (2012) Serra P., et al., 2012, MNRAS, 422, 1835
- Sharma et al. (2012) Sharma S., Steinmetz M., Bland-Hawthorn J., 2012, ApJ, 750, 107
- Sorce et al. (2014) Sorce J. G., Tully R. B., Courtois H. M., Jarrett T. H., Neill J. D., Shaya E. J., 2014, MNRAS, 444, 527
- Stewart et al. (2017) Stewart K. R., et al., 2017, ApJ, 843, 47
- Stott et al. (2016) Stott J. P., et al., 2016, Monthly Notices of the Royal Astronomical Society, 457, 1888
- Toomre (1964) Toomre A., 1964, ApJ, 139, 1217
- Verheijen (2001) Verheijen M. A. W., 2001, ApJ, 563, 694
- Verheijen & Sancisi (2001) Verheijen M. A. W., Sancisi R., 2001, A&A, 370, 765
- Walter et al. (2008) Walter F., Brinks E., de Blok W. J. G., Bigiel F., Kennicutt Robert C. J., Thornley M. D., Leroy A., 2008, AJ, 136, 2563
- Wang et al. (2016) Wang J., Koribalski B. S., Serra P., van der Hulst T., Roychowdhury S., Kamphuis P., Chengalur J. N., 2016, MNRAS, 460, 2143
- Zasov (1974) Zasov A. V., 1974, Azh, 51, 1225
- Zasov & Zaitseva (2017) Zasov A. V., Zaitseva N. A., 2017, Astronomy Letters, 43, 439
- Zjupa & Springel (2017) Zjupa J., Springel V., 2017, MNRAS, 466, 1625
- Zolotov et al. (2015) Zolotov A., et al., 2015, MNRAS, 450, 2327
- van Dokkum et al. (2015) van Dokkum P. G., Abraham R., Merritt A., Zhang J., Geha M., Conroy C., 2015, apjl, 798, L45
Appendix A Data
In this appendix, we present the data and the kinematic analysis of 2 Hi– bearing ultra diffuse galaxies and 8 early–type galaxies. In Fig. 6 - 15, we show (i) the integrated Hi intensity map contours overlaid on the optical image, (ii) Position-velocity diagram taken along the major axis of the galaxy with the rotation curves overlaid on them. The dashed lines indicate the systemic velocity and kinematic center. The overplotted violet triangles represent the rotation curve derived by ’FAT’ (iii) the intensity weighted first moment of the galaxy, and (iv) velocity field of the best fitting FAT model for all the HUDs and early-type galaxies.
| Galaxy | dist | Ms | Mg | Mbar | js | jg | jbar |
|---|---|---|---|---|---|---|---|
| (Mpc) | (log10 M⊙) | (log10 M⊙) | (log10 M⊙) | (log10 kpc km/s) | (log10 kpc km/s) | (log10 kpc km/s) | |
| AGC749401 | 41.8 | 7.31 0.131 | 8.66 0.137 | 8.68 0.131 | 2.12 0.110 | 2.39 0.093 | 2.39 0.092 |
| AGC121790 | 37.5 | 6.40 0.131 | 8.89 0.137 | 8.89 0.136 | 2.00 0.081 | 2.46 0.074 | 2.46 0.075 |
| Galaxy | dist | Ms | Mg | Mbar | js | jg | jbar |
|---|---|---|---|---|---|---|---|
| (Mpc) | (log10 M⊙) | (log10 M⊙) | (log10 M⊙) | (log10 kpc km/s) | (log10 kpc km/s) | (log10 kpc km/s) | |
| NGC3877 | 15.27 | 10.6 0.170 | 9.14 0.137 | 10.62 0.164 | 2.87 0.065 | 3.04 0.142 | 2.88 0.066 |
| NGC3917 | 17.14 | 10.13 0.170 | 9.34 0.137 | 10.19 0.147 | 2.75 0.065 | 3.07 0.169 | 2.81 0.077 |
| NGC3953 | 18.82 | 10.73 0.170 | 9.62 0.137 | 10.76 0.158 | 3.14 0.067 | 3.46 0.120 | 3.17 0.068 |
| NGC3972 | 20.04 | 10.10 0.170 | 9.31 0.137 | 10.16 0.147 | 2.70 0.066 | 2.98 0.132 | 2.75 0.071 |
| NGC3992 | 27.04 | 10.91 0.170 | 10.23 0.137 | 11.0 0.143 | 3.36 0.068 | 3.84 0.068 | 3.49 0.068 |
| NGC4013 | 19.23 | 10.81 0.170 | 9.65 0.137 | 10.84 0.159 | 2.93 0.065 | 3.42 0.065 | 2.99 0.065 |
| NGC4100 | 20.04 | 10.62 0.170 | 9.74 0.137 | 10.67 0.151 | 3.01 0.066 | 3.39 0.156 | 3.07 0.074 |
| NGC4157 | 16.29 | 10.87 0.170 | 9.96 0.137 | 10.92 0.152 | 2.92 0.065 | 3.40 0.097 | 3.01 0.068 |
| NGC4183 | 17.21 | 10.12 0.170 | 9.65 0.137 | 10.25 0.132 | 2.76 0.066 | 3.06 0.137 | 2.85 0.082 |
| NGC4217 | 18.19 | 10.75 0.170 | 9.53 0.137 | 10.78 0.161 | 2.97 0.065 | 3.27 0.114 | 2.99 0.066 |
| UGC6399 | 22.08 | 9.48 0.171 | 9.19 0.137 | 9.66 0.122 | 2.54 0.069 | 2.79 0.141 | 2.64 0.091 |
| UGC6446 | 18.03 | 8.83 0.172 | 9.62 0.137 | 9.69 0.121 | 2.29 0.088 | 2.88 0.100 | 2.83 0.112 |
| UGC6667 | 18.45 | 9.80 0.170 | 9.06 0.137 | 9.87 0.145 | 2.67 0.065 | 2.70 0.125 | 2.67 0.068 |
| UGC6917 | 20.41 | 9.42 0.171 | 9.54 0.137 | 9.78 0.107 | 2.67 0.073 | 2.99 0.117 | 2.88 0.101 |
| UGC6983 | 21.28 | 9.29 0.170 | 9.74 0.137 | 9.87 0.111 | 2.62 0.071 | 3.08 0.095 | 3.00 0.091 |
| UGC7089 | 11.50 | 9.06 0.171 | 8.80 0.137 | 9.25 0.120 | 2.19 0.067 | 2.54 0.066 | 2.34 0.067 |
| Galaxy | Morp | dist | Mg | jg | Notes |
| (Mpc) | (log10 M⊙) | (log10 kpc km s-1) | |||
| NGC3626 | S0 | 19.5 | 9.19 0.137 | 3.60 0.073 | C |
| NGC4262 | S0 | 15.4 | 8.84 0.137 | 3.27 0.086 | R |
| NGC4278 | E | 15.6 | 8.90 0.137 | 3.64 0.091 | M, L |
| NGC5582 | E | 27.7 | 9.78 0.137 | 3.85 0.074 | R |
| NGC3941 | S0 | 11.9 | 8.86 0.137 | 3.15 0.073 | C, R |
| NGC6798 | S0 | 37.5 | 9.64 0.137 | 3.67 0.077 | C |
| UGC6176 | S0 | 40.1 | 9.21 0.137 | 3.21 0.068 | W |
| UGC9519 | S0 | 27.6 | 9.40 0.137 | 3.02 0.081 | M |
| Notes on Hi morphology and kinematics: | |||||
| C = Hi counter-rotating relative to the stellar kinematics; | |||||
| L= lopsided Hi morphology; M= Hi misaligned relative to | |||||
| the stellar kinematics; R= ring; W= warp | |||||
| Galaxy | rbar | rg |
|---|---|---|
| N3877 | 0.90 | 0.90 |
| N3917 | 0.94 | 0.86 |
| N3953 | 0.98 | 0.90 |
| N3972 | 0.94 | 0.82 |
| N3992 | 0.97 | 0.95 |
| N4013 | 0.97 | 0.88 |
| N4100 | 0.96 | 0.90 |
| N4157 | 0.95 | 0.88 |
| N4183 | 0.91 | 0.82 |
| N4217 | 0.97 | 0.83 |
| U6399 | 0.86 | 0.78 |
| U6446 | 0.94 | 0.94 |
| U6667 | 0.66 | 0.73 |
| U6917 | 0.89 | 0.88 |
| U6983 | 0.94 | 0.94 |
| U7089 | 0.82 | 0.86 |
| Galaxy | rbar | rg |
|---|---|---|
| AGC121790 | 0.74 | 0.74 |
| AGC749401 | 0.61 | 0.60 |
| Galaxy | rg |
|---|---|
| NGC4262 | 0.80 |
| NGC4278 | 0.71 |
| NGC3626 | 0.61 |
| NGC3941 | 0.89 |
| NGC5582 | 0.85 |
| NGC6798 | 0.43 |
| UGC9519 | 0.74 |
| UGC6176 | 0.85 |