Location Data Reveals Disproportionate Disaster Impact Amongst the Poor: A Case Study of the 2017 Puebla Earthquake Using Mobilkit
Abstract.
Location data obtained from smartphones is increasingly finding use cases in disaster risk management. Where traditionally, CDR has provided the predominant digital footprint for human mobility, GPS data now has immense potential in terms of improved spatiotemporal accuracy, volume, availability, and accessibility. GPS data has already proven invaluable in a range of pre- and post-disaster use cases, such as quantifying displacement, measuring rates of return and recovery, evaluating accessibility to critical resources, planning for resilience. Despite its popularity and potential, however, the use of GPS location data in DRM is still nascent, with several use cases yet to be explored. In this paper, we consider the 2017 Puebla Earthquake in Mexico to (i) validate and expand upon post-disaster analysis applications using GPS data, and (ii) illustrate the use of a new toolkit, Mobilkit, to facilitate scalable, replicable extensions of this work for a wide range of disasters, including earthquakes, typhoons, flooding, and beyond.
1. Introduction
As global temperatures increase, intense climate-related disasters rise, and the world grapples with economic losses at an unprecedented scale owing to the coronavirus pandemic, it has never been more important to foster sustainable development and resilience in areas prone to hazards (Hallegatte et al., 2016). Traditionally, when these risks have materialized, their impact has been quantified using census data and surveys—measures that are costly and challenging to scale (Fussell et al., 2014). More recently, however, location datasets made available by technology companies and cellular providers have made it possible to access and measure high resolution changes to human mobility quickly and at relatively low cost.
Initially, these primarily took the form of Call Detail Records (CDRs), which triangulate user locations from network towers. CDR data features in several well-proven disaster use cases (Bengtsson et al., 2015; Finger et al., 2016; Bengtsson et al., 2011; Wilson et al., 2016). However, access depends on case-by-case negotiations with providers, and is only spatially precise within the ‘cell’ where a user is triangulated. As smartphones equipped with GPS technologies become more ubiquitous, location data traces have become far more resolved than CDR data, enabling mapping of user trajectories in space (precise latitude and longitude) and time (down to seconds) (Gonzalez et al., 2008; Blondel et al., 2015). GPS traces have the potential to power a new wave of resilience and disaster risk management (DRM) efforts. Notably, Yabe et al. (Yabe et al., 2020) recently leveraged GPS data to understand population displacement and return patterns in the contexts of five disasters across Puerto Rico, Florida, and Japan. GPS data also typically required negotiation with fewer providers with penetration in several countries at a time.
At this stage, however, important challenges remain for the application and adoption of GPS data (Barra et al., 2020) in DRM and urban resilience efforts. Important dimensions of interest (Mueller et al., 2014; Chen and Mueller, 2018), such as household income, disaster intensity, and inequality remain challenging to overlay and link with location data. Technical and computational barriers to entry preclude near-real time analysis of this data. To narrow this operational gap, in this study, we seek to elucidate a range of applications of mobility data for post-disaster analytics. We use the Puebla Earthquake as a case study (magnitude Mw 7.1, epicenter 55 km south of Puebla city), which occurred on September 19, 2017 in Mexico, causing the collapse of more than 40 buildings, displacing over 5000 people and affecting over 34,000 homes (Alcocer et al., 2018) in and around Greater Mexico City. For each analytical finding, we present how Mobilkit, a Python library purpose-built for DRM analytics using location data, can be leveraged for for scalable, replicable analysis in other DRM contexts.
2. Data and Methods
2.1. Data
2.1.1. Smartphone location data.
Anonymized and privacy-enhanced smartphone location data was provided by Cuebiq Inc, which collects first-party data from users who opt in through a GDPR-compliant framework (https://www.cuebiq.com/). The data spanned a 5-week period from the last week of August to end September, 2017. The Puebla earthquake occurred 2 weeks into the dataset. The dataset contained 774,343 anonymized unique user ids, each with a variable number of observations throughout the period. To ensure a reliable signal, the analysis was conducted on users with high observation rates: users with an average of less than three observations per day were excluded, as well as those who were observed for less than 5 days at their estimated home locations during the 14 day period prior to the earthquake.
2.1.2. Socio-demographic data.
Population data was provided by Mexico’s National Institute of Statistics and Geography (INEGI) via their microdata portal (https://www.inegi.org.mx/datos/default.html#Microdatos). Since median household income data was not available for Mexico, a composite measure of average values for asset ownership, such as vehicles, refrigerators, and computers, as well as access to services such as education and health, was created at the manzana level (the smallest administrative unit). This multitude of features was then reduced to a single index via principle component analysis (PCA) (Fraiberger et al., 2020; Vyas and Kumaranayake, 2006). We refer to this index as the “poverty index” in this study.
2.1.3. Seismic intensity data.
A seismic intensity map produced by the United States Geological Survey111https://earthquake.usgs.gov/earthquakes/eventpage/us2000ar20/shakemap/ was used to observe exposure. Seismic intensities of greater than 7.0 were observed in Puebla and parts of greater Mexico City. By overlaying these geographic extents with administrative boundaries, seismic intensities were mapped to each administrative unit.
2.2. Methods
2.2.1. Home location estimation.
Home locations (assuming one primary location for each user) were detected by applying the mean-shift clustering algorithm (Cheng, 1995; Calabrese et al., 2011) to nighttime stay points observed between 8PM and 6AM. The algorithm requires 2 parameters; the density function of the kernel (Gaussian), and the kernel bandwidth (we used 200m).
2.2.2. Data representativeness analysis.
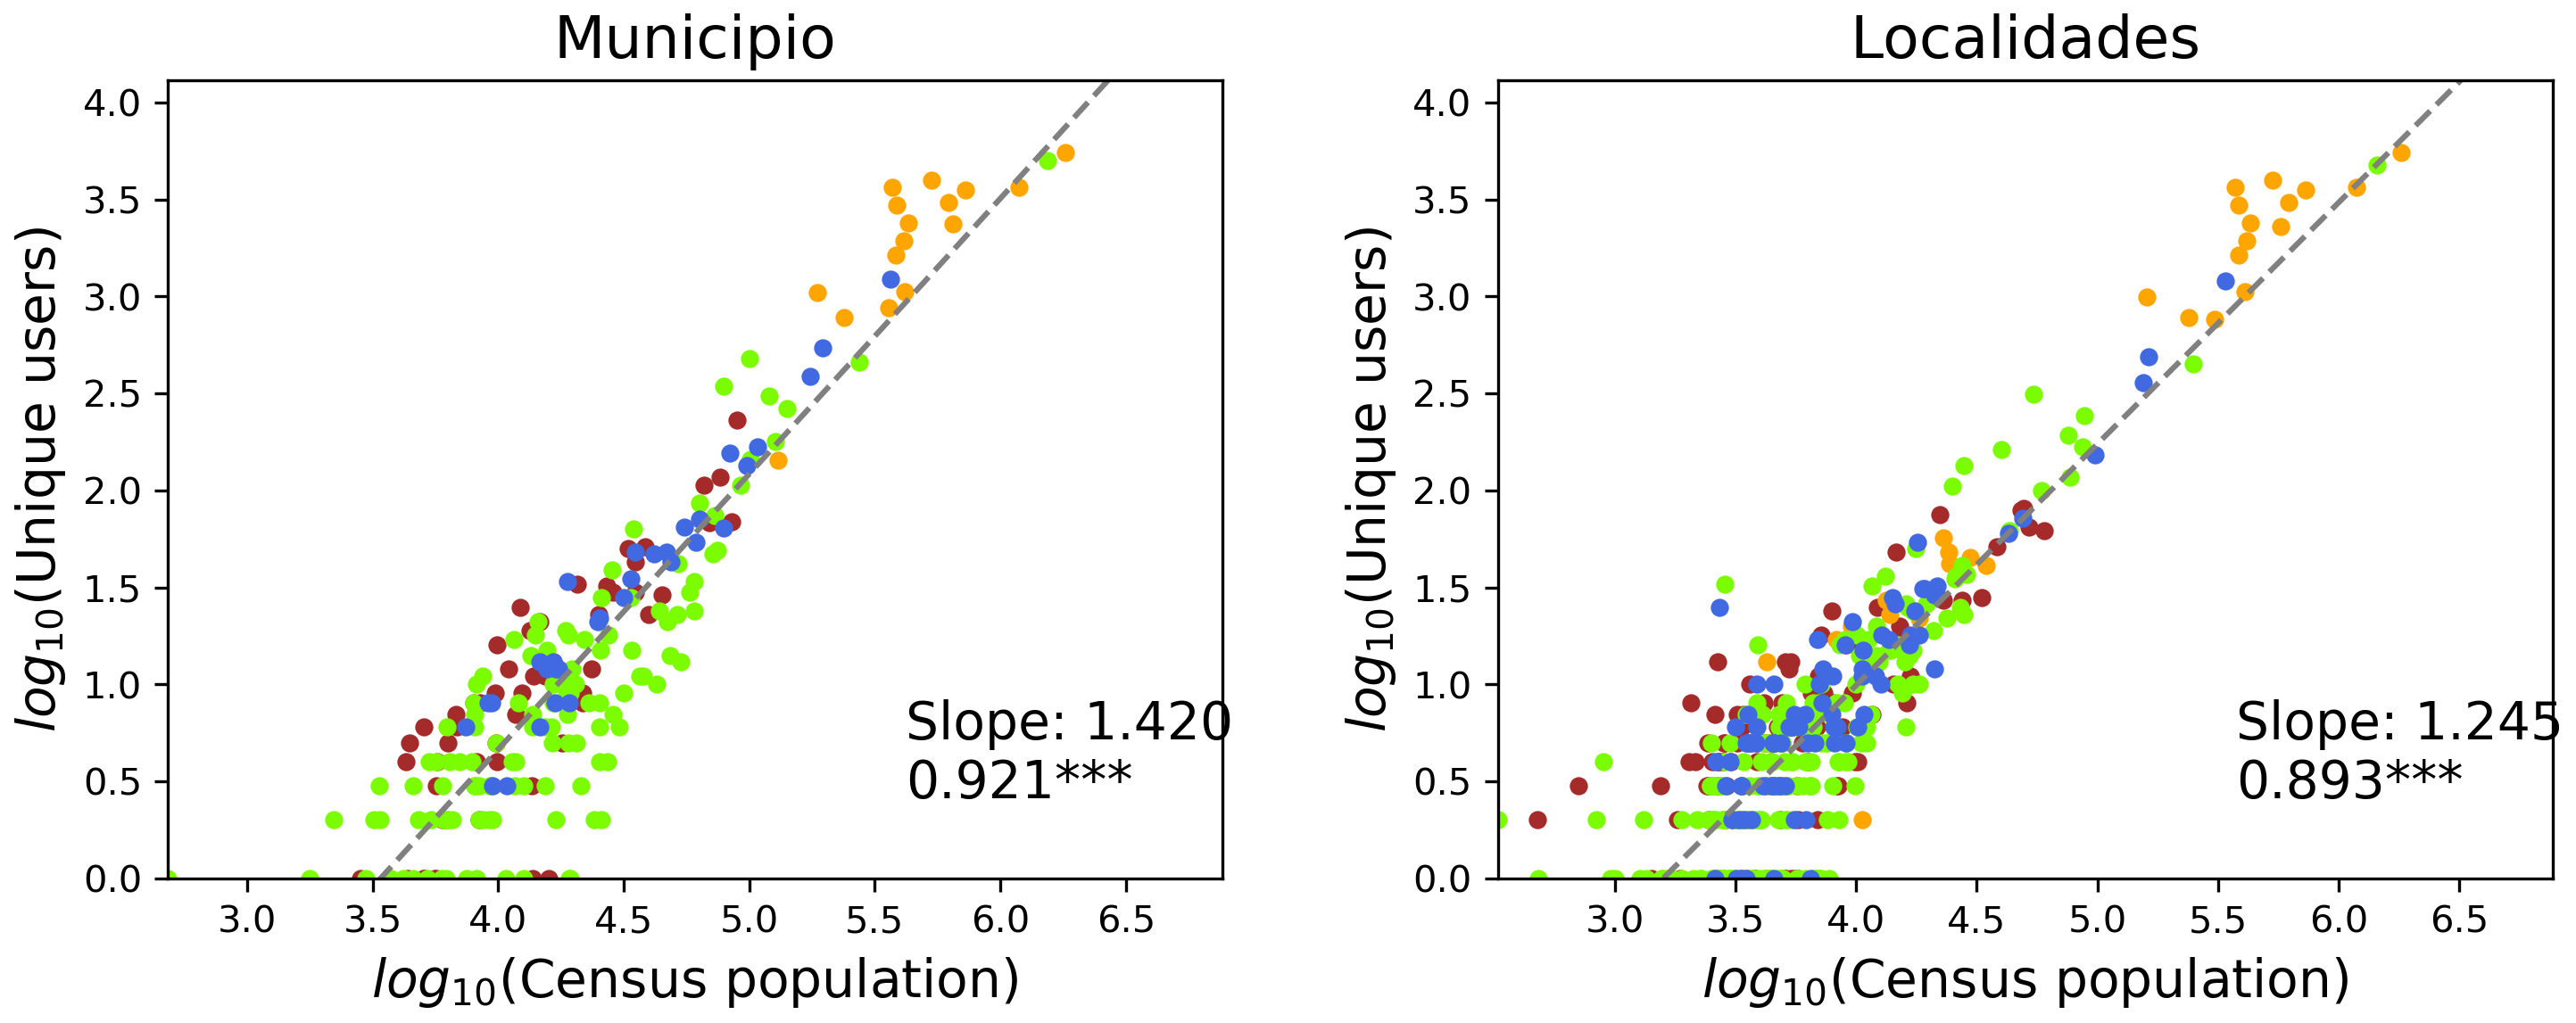
In order to quantify potential sampling bias in the data, the correlation between the number of mobile phone users and corresponding census populations at municipio and localidades levels was calculated. Figure 1 illustrates a strong positive correlation between the number of mobile phone users and census population data on both the municipio and localidades levels, (R-squared=0.9, showing good fit; *** denotes ).
2.2.3. Mobilkit.
A series of helper functions was developed to facilitate the analysis below, and packaged into Mobilkit, a Python library purpose-built for DRM analytics using location data. Further details are provided in an upcoming paper (Ubaldi et al., 2021). The code is open-source, released under the MIT license and can be accessed on Github (https://github.com/GFDRR/mobilkit), with complete documentation, examples and tutorials in the form of jupyter notebooks (https://mobilkit.readthedocs.io/en/latest/). Mobilkit can be easily installed on the command line, with pip install mobilkit. Mobilkit hosts a wide range of functions to conduct pre-processing and validation of a GPS location dataset before jumping into the analysis. For example, functions in the stats.py class such as userStats() compute statistics for each user, including the number of days spanned (time from first to last ping), number of days active (actual number of days being active), number of pings per user, and number of pings per user per active day. plotUsersHist() allows us to plot the 2-dimensional histogram of the user selection threshold parameters and the number of selected users in the dataset.
3. Results
3.1. Quantifying displacement using anomaly detection methods
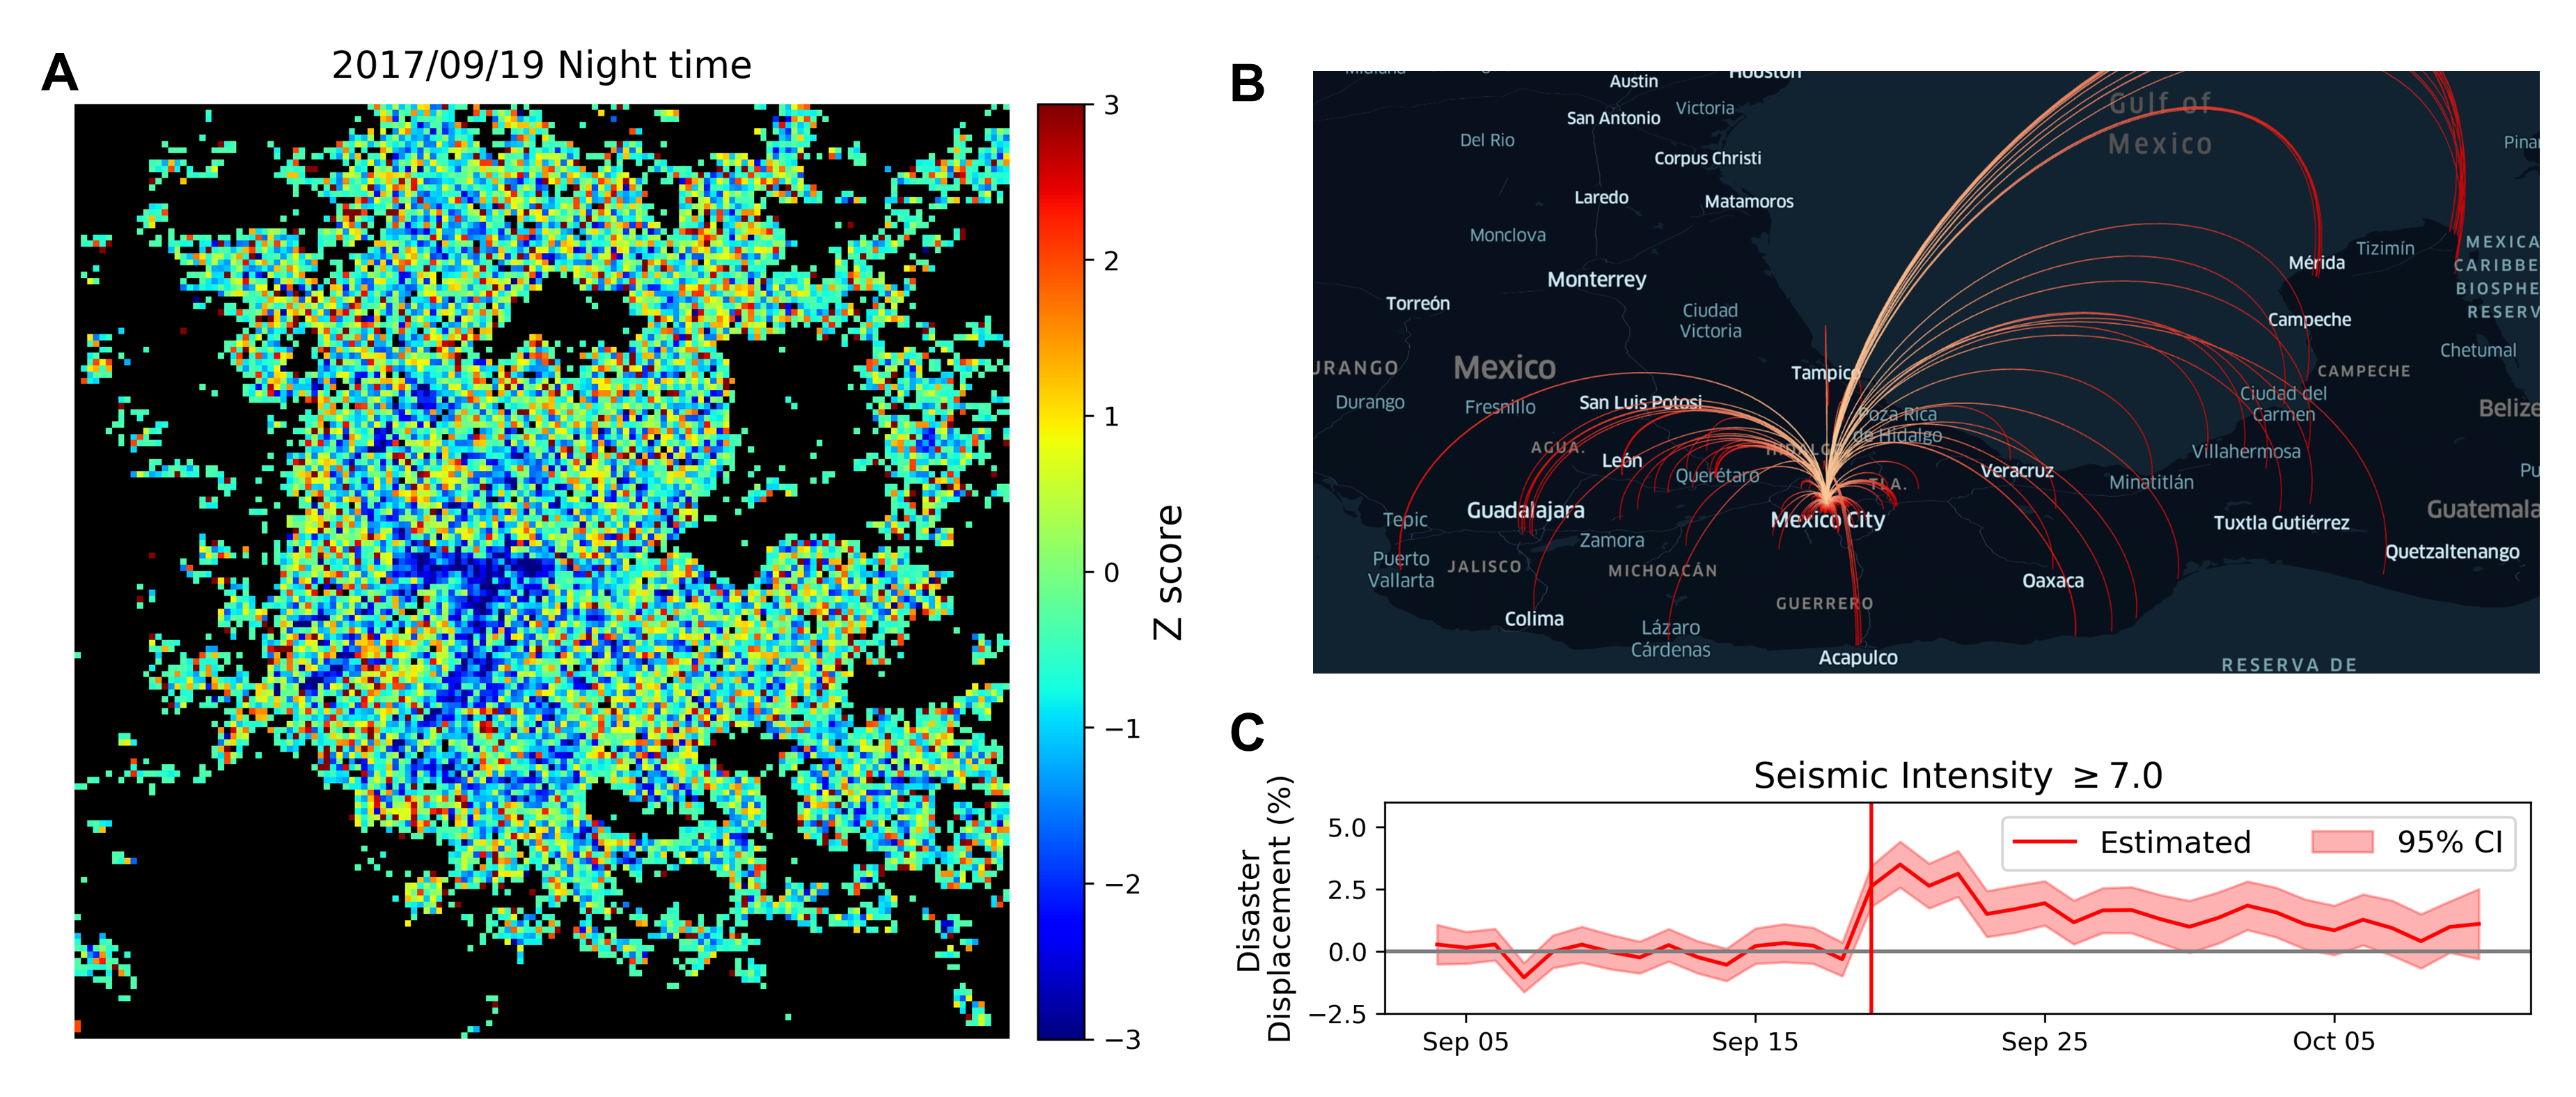
In order to visualize population displacement patterns after disaster events, we can map the z-scores of the nighttime population in Mexico City on the day of the earthquake (September 19th, 2017), as shown in Figure 2A. The z-score is defined as the number of standard deviations from the pre-disaster mean population, for each grid cell. We observe blue-colored clusters (z) in central Mexico City, indicating significant population displacement. Figure 2B visualizes the destinations of those users displaced from central Mexico City using kepler.gl. While most users stay close to Mexico City, some users travel 100s of kilometers to further regions such as Cancun and Acapulco.
In order to reproduce this analysis using Mobilkit, the calc_displacement() function can be used to compute (i) the average and minimum distances from home, (ii) the closest point to home, and (iii) the original home location of the user on each day for each user. Functions in the viz class, such as plot_density_map(), can be used to spatially plot the population density and their anomaly values in user-identified spatial granularity and scale.
3.2. Quantifying Displacement Rates and Recovery
The displacement distance of a user is defined as the minimum distance from home during the nighttime, and the user is labeled as ‘displaced’ if the minimum displacement distance is further than the distance threshold (500 meters). Figure 2C shows that around 4% of the users that experienced a seismic intensity greater than 7.0 were initially displaced due to the disaster, and the impact persisted for more than 2 weeks after the disaster. Similarly to other disasters studied in the past including Hurricanes Maria, Irma, and the Tohoku Tsunami, we observe a gradual, exponential-like decrease in population displacement (Yabe et al., 2020).
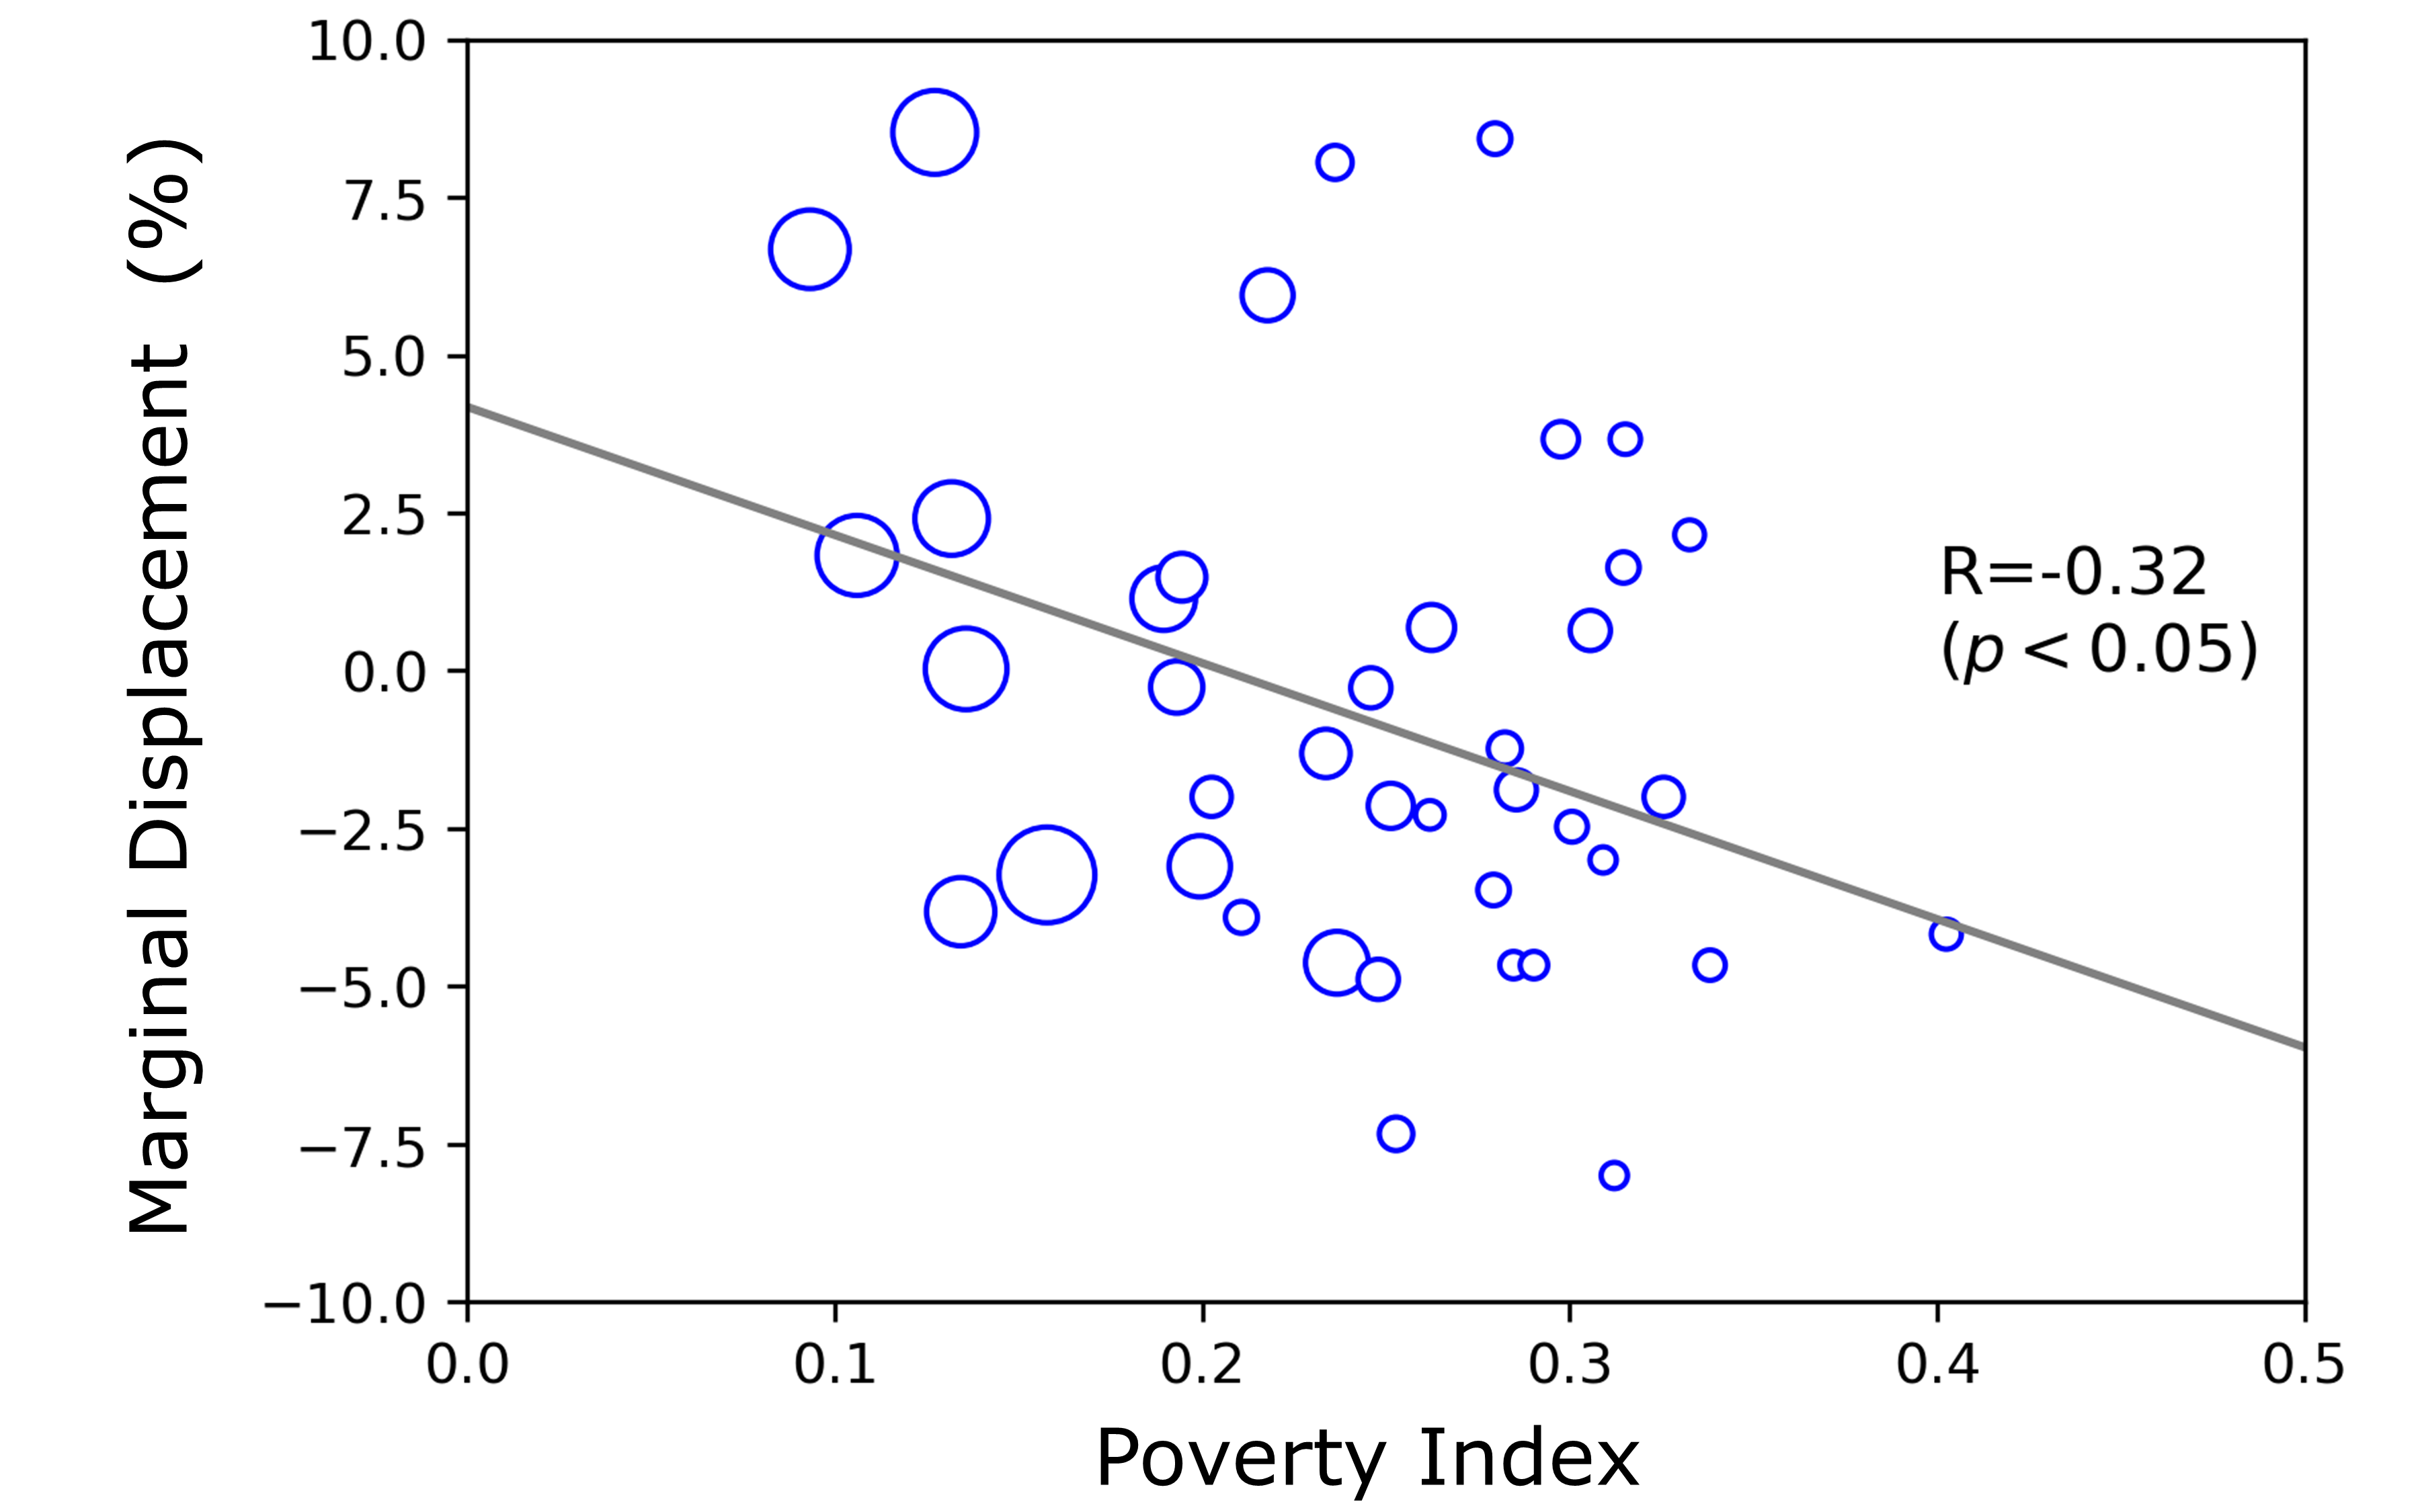
Furthermore, as shown in Figure 3, analysis showed a statistically significant positive correlation between wealth (poverty index) and displacement rates, indicating inequality in post-disaster displacement mobility, where poorer communities are less likely to move out of disaster affected areas than wealthier communities. Such analysis on displacement rates over time, and displacement rates across different socio-demographic and income groups, can be conducted using functions in the stats.py class of Mobilkit. The documentation of Mobilkit demonstrates how different datasets (e.g., income data and administrative boundary data) are spatially joined and processed to produce these plots.
3.3. Post-Disaster Gathering Locations
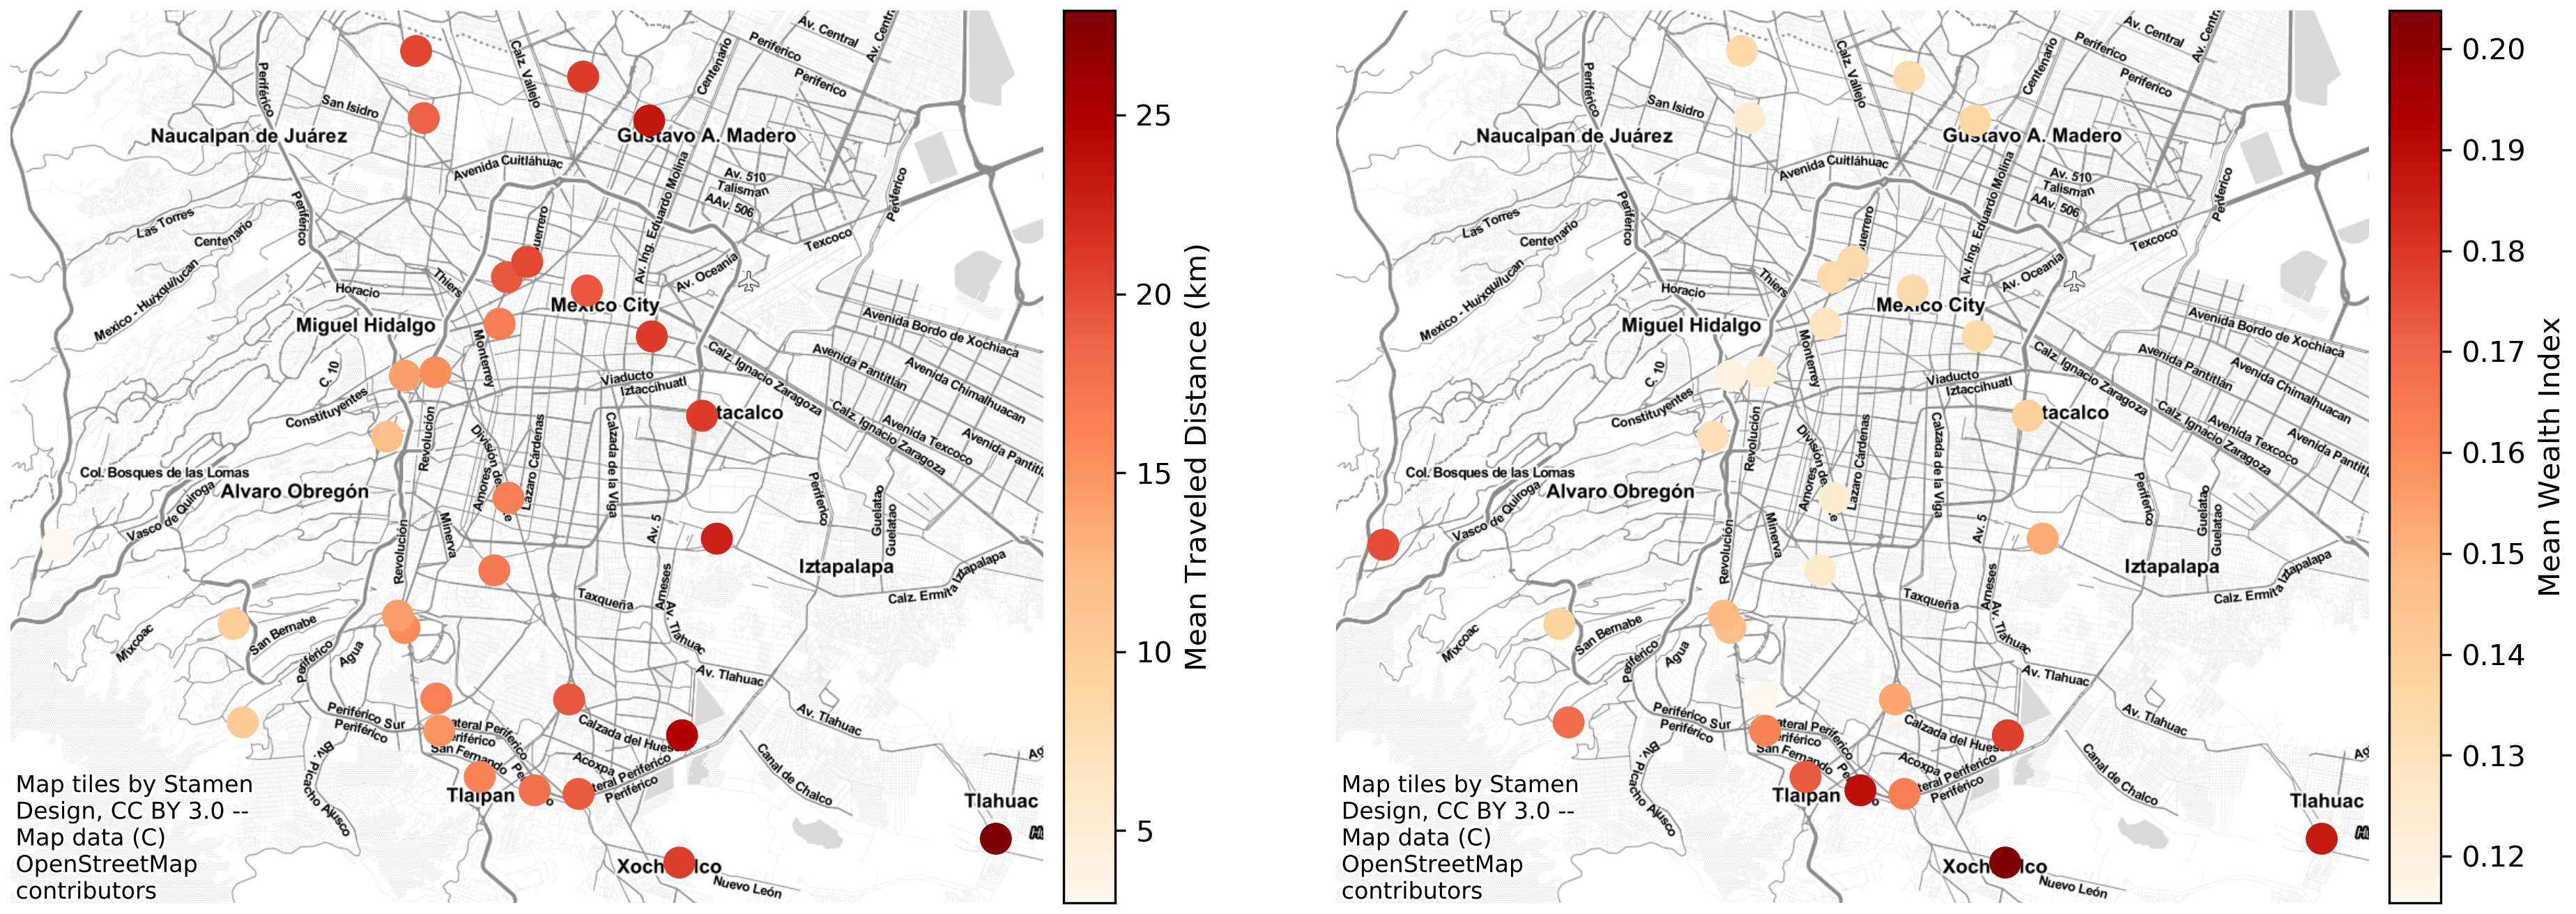
To understand catchment characteristics of gathering locations after disasters, we analyze the profiles of users who visited each gathering location. Figure 4 shows the differences in user profiles across gathering locations. The left panel shows that the distance traveled varies, and that gathering locations in east CDMX tend to have longer travel distances, indicating poor shelter accessibility. The right panel shows the mean poverty index value of users who visited each gathering location in CDMX. There is strong spatial correlation, where gathering locations in southern CDMX accommodate residents of poorer areas. Such information could be useful for decision makers to develop strategies for the allocation of emergency goods and services.
The number of visits to different points-of-interest (POIs) can be computed using raw mobility data using functions in the spatial.py class, such as the compute_poi_visit() function, which utilizes the spatial tree algorithm to efficiently calculate the set of users and number of users visiting a given POI for each time period identified by the user.
4. Discussion
In this paper we illustrate the utility of increasingly available ‘big data’ from smartphones for post-disaster mobility analytics, such as quantifying displacement, evacuation, long-term migration, scale of impact, and more. This approach can be leveraged for a variety of disaster contexts beyond earthquakes that can affect human movement, such as flood impact mapping, wildfires, and more. The methods we use to detect change in population density, conduct disaster displacement analysis at varying levels of regional scale, and map movement to POIs, can be leveraged at each stage of the disaster risk management cycle. In initial emergency phases, policymakers and local officials can leverage these methods to localize hotspots and deploy more targeted aid. Through the recovery phase, mobility data can be used to track displacement rates in time, to quantify variations in recovery and dynamically track medium-term impact. In later stages, officials can leverage long-term displacement and migration patterns in urban planning and resilience efforts, to build new shelters, reconstruct affected areas, and ’build back better’.
Acknowledgements.
We extend our sincere gratitude to Cuebiq for providing the data to support this effort, and Purdue University and Mind Earth for their contribution. This work has been conducted under a grant from the Spanish Fund for Latin America and the Caribbean (SFLAC) under the Disruptive Technologies for Development (DT4D) initiative at the World Bank. The findings, interpretations, and conclusions expressed in this paper are entirely those of the authors. They do not necessarily represent the views of the International Bank for Reconstruction and Development/World Bank and its affiliated organizations, or those of the Executive Directors of the World Bank or the governments they represent.References
- (1)
- Alcocer et al. (2018) SM Alcocer, D Muriá, JC Arce, R Durán, L Fernández, M Ordaz, D Arroyo, MA Jaimes, G Rodríguez, and M Rodríguez. 2018. Advisory Services to Support the Recovery of School Infrastructure in Mexico Affected by the September 2017 Earthquakes. Mexico: Institute of Engineering, UNAM 435 (2018).
- Barra et al. (2020) Alvaro Federico Barra, Mika-Petteri Torhonen, Abbas Rajabifard, Katie Potts, and Richard John Grover. 2020. Solid Ground: Increasing Community Resilience Through Improved Land Administration and Geospatial Information Systems. Technical Report. The World Bank.
- Bengtsson et al. (2015) Linus Bengtsson, Jean Gaudart, Xin Lu, Sandra Moore, Erik Wetter, Kankoe Sallah, Stanislas Rebaudet, and Renaud Piarroux. 2015. Using mobile phone data to predict the spatial spread of cholera. Scientific reports 5 (2015), 8923.
- Bengtsson et al. (2011) Linus Bengtsson, Xin Lu, Anna Thorson, Richard Garfield, and Johan Von Schreeb. 2011. Improved response to disasters and outbreaks by tracking population movements with mobile phone network data: a post-earthquake geospatial study in Haiti. PLoS Med 8, 8 (2011), e1001083.
- Blondel et al. (2015) Vincent D Blondel, Adeline Decuyper, and Gautier Krings. 2015. A survey of results on mobile phone datasets analysis. EPJ data science 4, 1 (2015), 10.
- Calabrese et al. (2011) Francesco Calabrese, Giusy Di Lorenzo, Liang Liu, and Carlo Ratti. 2011. Estimating Origin-Destination flows using opportunistically collected mobile phone location data from one million users in Boston Metropolitan Area. IEEE Pervasive Computing 10, 4 (2011), 36–44.
- Chen and Mueller (2018) J Chen and Valerie Mueller. 2018. Coastal climate change, soil salinity and human migration in Bangladesh. Nature Climate Change 8, 11 (2018), 981.
- Cheng (1995) Yizong Cheng. 1995. Mean shift, mode seeking, and clustering. IEEE transactions on pattern analysis and machine intelligence 17, 8 (1995), 790–799.
- Finger et al. (2016) Flavio Finger, Tina Genolet, Lorenzo Mari, Guillaume Constantin de Magny, Noël Magloire Manga, Andrea Rinaldo, and Enrico Bertuzzo. 2016. Mobile phone data highlights the role of mass gatherings in the spreading of cholera outbreaks. Proceedings of the National Academy of Sciences 113, 23 (2016), 6421–6426.
- Fraiberger et al. (2020) Samuel P Fraiberger, Pablo Astudillo, Lorenzo Candeago, Alex Chunet, Nicholas KW Jones, Maham Faisal Khan, Bruno Lepri, Nancy Lozano Gracia, Lorenzo Lucchini, Emanuele Massaro, et al. 2020. Uncovering socioeconomic gaps in mobility reduction during the COVID-19 pandemic using location data. arXiv preprint arXiv:2006.15195 (2020).
- Fussell et al. (2014) Elizabeth Fussell, Katherine J Curtis, and Jack DeWaard. 2014. Recovery migration to the City of New Orleans after Hurricane Katrina: a migration systems approach. Population and environment 35, 3 (2014), 305–322.
- Gonzalez et al. (2008) Marta C Gonzalez, Cesar A Hidalgo, and Albert-Laszlo Barabasi. 2008. Understanding individual human mobility patterns. nature 453, 7196 (2008), 779.
- Hallegatte et al. (2016) Stephane Hallegatte, Adrien Vogt-Schilb, Mook Bangalore, and Julie Rozenberg. 2016. Unbreakable: building the resilience of the poor in the face of natural disasters. World Bank Publications.
- Mueller et al. (2014) Valerie Mueller, Clark Gray, and Katrina Kosec. 2014. Heat stress increases long-term human migration in rural Pakistan. Nature climate change 4, 3 (2014), 182.
- Ubaldi et al. (2021) Enrico Ubaldi, Takahiro Yabe, Nicholas K. W. Jones, Maham Faisal Khan, S.V. Ukkusuri, and Emanuele Strano. 2021. Mobilkit: A Python Toolkit for Urban Resilience and Disaster Risk Management Analytics using High Frequency Human Mobility Data. KDD Workshop on Data-driven Humanitarian Mapping held with the 27th ACM SIGKDD Conference on Knowledge Discovery and Data Mining (KDD ’21).
- Vyas and Kumaranayake (2006) Seema Vyas and Lilani Kumaranayake. 2006. Constructing socio-economic status indices: how to use principal components analysis. Health policy and planning 21, 6 (2006), 459–468.
- Wilson et al. (2016) Robin Wilson, Elisabeth zu Erbach-Schoenberg, Maximilian Albert, Daniel Power, Simon Tudge, Miguel Gonzalez, Sam Guthrie, Heather Chamberlain, Christopher Brooks, Christopher Hughes, et al. 2016. Rapid and near real-time assessments of population displacement using mobile phone data following disasters: the 2015 Nepal Earthquake. PLoS currents 8 (2016).
- Yabe et al. (2020) Takahiro Yabe, Kota Tsubouchi, Naoya Fujiwara, Yoshihide Sekimoto, and Satish V Ukkusuri. 2020. Understanding post-disaster population recovery patterns. Journal of the Royal Society Interface 17, 163 (2020), 20190532.