On the impact of an intermediate duration X-ray burst on the accretion environment in IGR J17062–6143
Abstract
We report on a spectroscopic analysis of the X-ray emission from IGR J in the aftermath of its June 2020 intermediate duration Type I X-ray burst. Using the Neutron Star Interior Composition Explorer, we started observing the source three hours after the burst was detected with MAXI/GSC, and monitored the source for the subsequent twelve days. We observed the tail end of the X-ray burst cooling phase, and find that the X-ray flux is severely depressed relative to its historic value for a three day period directly following the burst. We interpret this intensity dip as the inner accretion disk gradually restoring itself after being perturbed by the burst irradiation. Superimposed on this trend we observed a d interval during which the X-ray flux is sharply lower than the wider trend. This drop in flux could be isolated to the non-thermal components in the energy spectrum, suggesting that it may be caused by an evolving corona. Additionally, we detected a 3.4 keV absorption line at significance in a single s observation while the burst emission was still bright. We tentatively identify the line as a gravitationally redshifted absorption line from burning ashes on the stellar surface, possibly associated with or .
1 Introduction
Type I X-ray bursts arise from thermonuclear shell flashes in the accreted envelope of a neutron star (Lewin et al., 1993; Strohmayer & Bildsten, 2006; Galloway et al., 2020; Galloway & Keek, 2021). It is well established that the observable properties of such X-ray bursts depend intricately on the characteristics of the accretion, with the rate, composition, and precise geometry of the accretion flow all playing a part in shaping the intensity and duration of the X-ray bursts, as well as their recurrence times (Galloway & Keek, 2021). Conversely, the intense radiation field of the X-ray burst can interact with the matter surrounding the neutron star in various ways, which can significantly perturb the accretion flow (see Degenaar et al., 2018, for a review). Such feedback has received increasing attention in recent years, as it allows for the bright burst emission to be used as a probe of accretion processes. For instance, the X-ray burst emission can reflect off the accretion disk (Ballantyne & Strohmayer, 2004), change the intensity and shape of the persistent emission (in ’t Zand et al., 2013; Worpel et al., 2013; Keek et al., 2014), or perturb the corona causing an intensity suppression at high () photon energies (Maccarone & Coppi, 2003; Ji et al., 2014, 2015).
Most studies investigating the interactions between the burst emission and the accretion flow have focused on the brightest phases of the burst. This focus is natural, as physically one would expect the largest perturbation to occur when the burst intensity is highest. A challenge, however, is that the thermal burst emission often outshines the other radiative processes, making it difficult to disentangle which spectral changes are intrinsic to the burst, and which are due to the accretion flow. If the accretion environment is sufficiently perturbed, though, then the timescale on which it relaxes back to its (preburst) equilibrium state may well be longer than the cooling timescale of burst emission. Thus, perhaps we can observe the disk recovery after the bright X-ray burst has faded. In this paper we present the case of IGR J17062–6143 (IGR J17062), as an example of what appears to be precisely this scenario.
First discovered in 2007 Jan/Feb (Churazov et al., 2007), IGR J17062 has been persistently visible with a low X-ray luminosity of (Degenaar et al., 2017; van den Eijnden et al., 2018). Despite its very long outburst history, it was only recently discovered to be a 163 Hz accreting millisecond pulsar (Strohmayer & Keek, 2017) in a 38-minute ultra-compact binary orbit (Strohmayer et al., 2018). Subsequent monitoring of the pulsar revealed that the neutron star is steadily spinning-up, while the binary orbit is rapidly expanding (Bult et al., 2021). IGR J17062 is also one of only a few known systems to show energetic intermediate duration X-ray bursts (in’t Zand et al., 2019), with three such X-ray bursts recorded so far. The first burst was detected in June and observed near its peak intensity with the BAT and XRT telescopes aboard the Swift observatory (Degenaar et al., 2013). These data revealed a significant emission line at keV, as well as absorption features in the Fe-K band (Degenaar et al., 2013), both of which point to the burst emission reflecting off the accretion disk. Further, Degenaar et al. (2013) found that the burst light curve showed a 10-minute episode during which the flux fluctuated by a factor of 3 over a timescale of seconds. Such variability episodes are a particularly rare feature of the most energetic bursts, and may be associated with super-expansion of the stellar photosphere (in’t Zand et al., 2019). In particular, in’t Zand et al. (2011) suggested that such variability episodes may be caused by cloud-like structures above the disk, which intermittently scatter the burst radiation into or out of the observer line of sight.
A second burst was detected in 2015 (Negoro et al., 2015; Iwakiri et al., 2015) and studied in detail by Keek et al. (2017). These authors estimated the source flux during its photospheric radius expansion (PRE) phase and derived a source distance of kpc. From the burst fluence, they further estimated the burst ignition column to be g cm-2, indicating the bursts are powered by the ignition of a thick helium layer deep in the stellar envelope. Finally, they found that at the end of the burst the flux dropped below the cooling trend before returning to the long-term persistent luminosity after about four days, suggesting a disruption of the accretion flow that outlasts the duration of the X-ray burst itself.
On 2020 June 22, MAXI/GSC detected a third X-ray burst from IGR J17062 (Nishida et al., 2020), offering a new opportunity to investigate the impact of these powerful X-ray bursts on the accretion environment. We therefore executed a follow-up monitoring campaign with the Neutron Star Interior Composition Explorer (NICER; Gendreau & Arzoumanian 2017). Our observations began about hours after the MAXI trigger, and continued to follow the source evolution for days. A timing analysis of the pulsar properties during this epoch was previously included in Bult et al. (2021). In this paper we present spectroscopic analysis of these data.
2 Observations and Data Processing
We observed IGR J17062 with NICER between 2020 June 22 and 2020 July 7 for a total unfiltered exposure of . These data are available under ObsIDs , where runs from through , with each ObsID storing all continuous pointings collected over the course of one day. Throughout this paper we will refer to these ObsIDs using just the final two digits. All data were processed using nicerdas version 7a, as released with heasoft version , using the most recent version of the instrument calibration (release ). Following the standard screening criteria, we filtered the data to retain only those epochs collected when the pointing offset was , the bright Earth limb angle was , the dark Earth limb angle was , the rate of reset triggers (undershoots) was ct s-1 det-1, and the instrument was outside of the South Atlantic Anomaly. By default, the pipeline also attempts to reduce the background contamination by filtering on the rate of high energy events (overshoots). In the case of IGR J17062 this overshoot filtering was found to be too conservative, introducing many spurious 1-s gaps into the data (see also Bult et al. 2021). We therefore applied a more relaxed screening approach in which we first smoothed the overshoot rate using 5-second bins to reduce noise, and then retained only those epochs when the absolute overshoot rate was ct s-1 det-1 (default threshold is ), and ct s-1 det-1 (default scale is )111The cor_sax parameter is a measure for the cut-off rigidity of Earth’s magnetic field in units of GeV c-1.. Using these screening criteria, we were left with of good time exposure.
3 Light curve
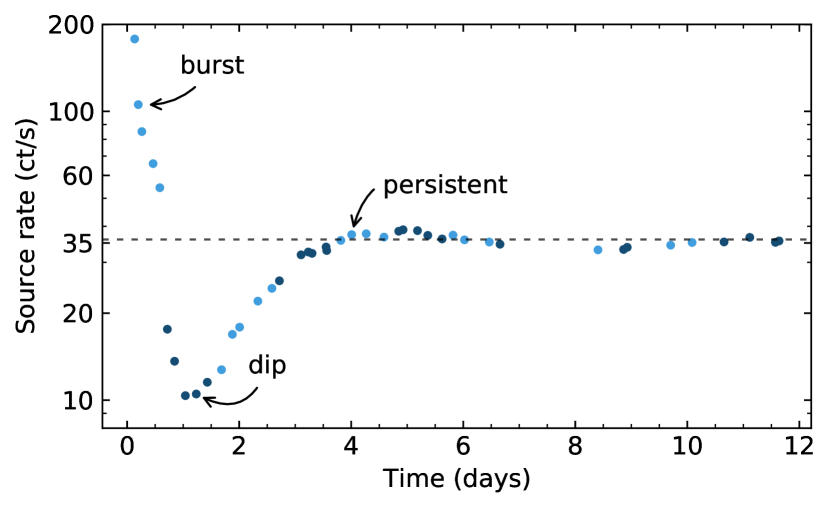
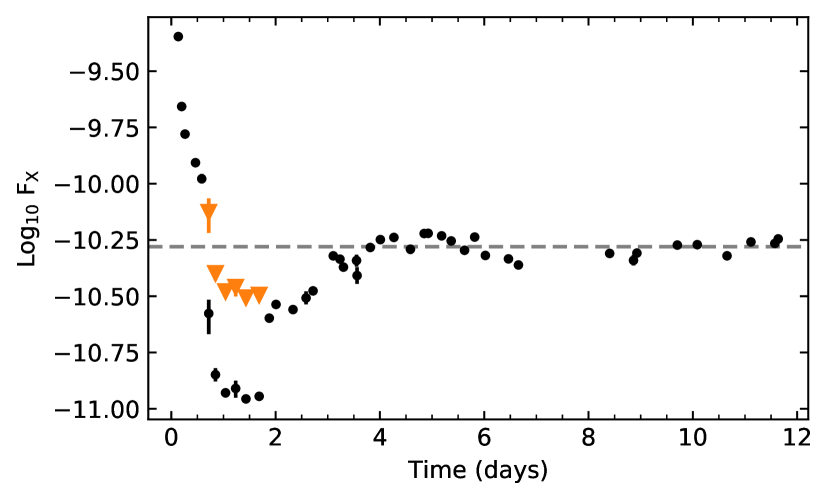
To construct a light curve of our NICER observations, we grouped the data by continuous pointing. Across the 12 ObsIDs included in this analysis, there were such pointings. The good time exposure per pointing ranges between , with the majority of exposures clustered around and . For each pointing we proceeded to extract an energy spectrum and generated an associated background spectrum using the 3C50 background model (Remillard et al., 2021, submitted)222 https://heasarc.gsfc.nasa.gov/docs/nicer/tools/nicer_bkg_est_tools.html . The source is detected above the background level between about , hence, we calculated the background subtracted source rate in this energy band. In Figure 1 we show the resulting light curve, where we expressed all observation times relative to the MAXI burst trigger.
Further observations of IGR J17062 were collected with NICER over a two week period in 2020 August, at which time the mean count rate was found to be (Bult et al., 2021). We adopt this rate as our estimate of the long-term persistent (non-burst) rate. Comparing the present observations with this persistent rate, we see from Figure 1 that the source was initially detected well above the long-term mean intensity, but showed a rapid decay in its count rate. At , this decay evolves into a sharp drop: during a hours data gap between pointings, the source rate decreased from to – well below the persistent rate. Over the following three-day period, we observed the source reach a minimum count rate of about before recovering back to the persistent rate of . From and onward, the observed count rate appears to show a small amplitude oscillation around the long-term mean, however, we caution against over interpreting this trend; it is entirely consistent with gradual intensity variations seen in long-term NICER monitoring of this source (Bult et al., 2021).
Finally, we constructed a source light curve using a 1-s time resolution and searched for periods of rapid variability similar to the episode observed by Degenaar et al. (2013). No such variability features were found. We note, however, that the observations of Degenaar et al. (2013) were collected minutes after the burst ignition, whereas the NICER observations presented here were collected hours later. Hence, we did not sample the same phase of the X-ray burst.
4 Spectroscopy
Turning our attention to the spectral properties of IGR J17062, we considered the energy spectra extracted from each pointing and modeled them using xspec version v12.11 (Arnaud, 1996). In this analysis we described the interstellar absorption using the Tübingen-Boulder model (tbabs; Wilms et al. 2000), fixing the absorption column density to (Bult et al., 2021).
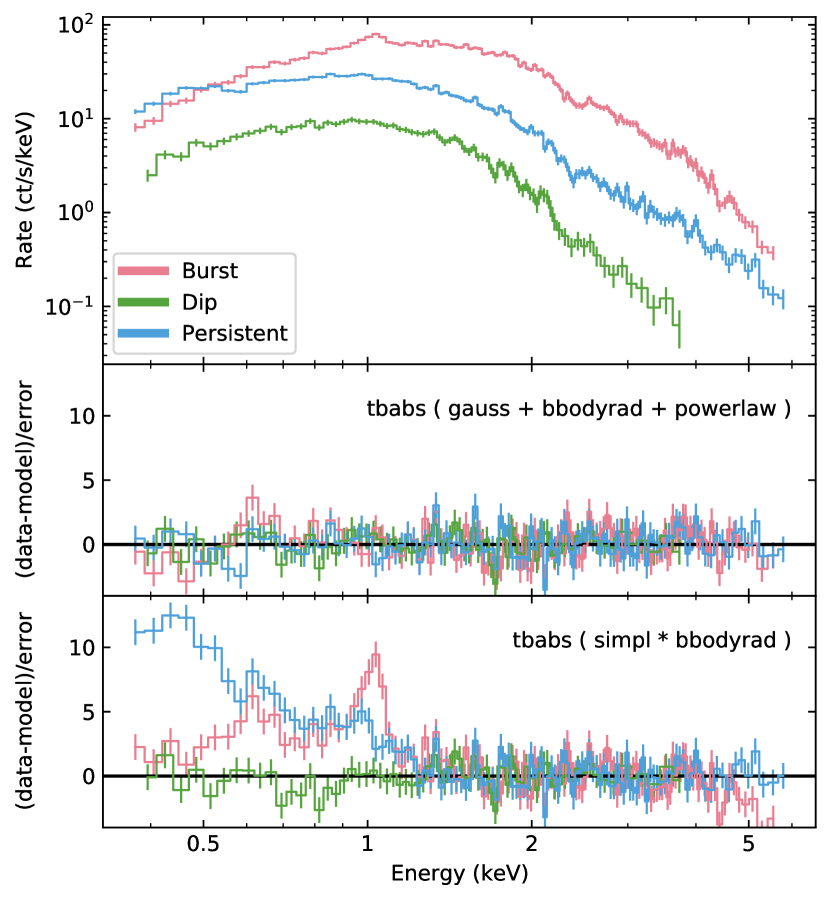
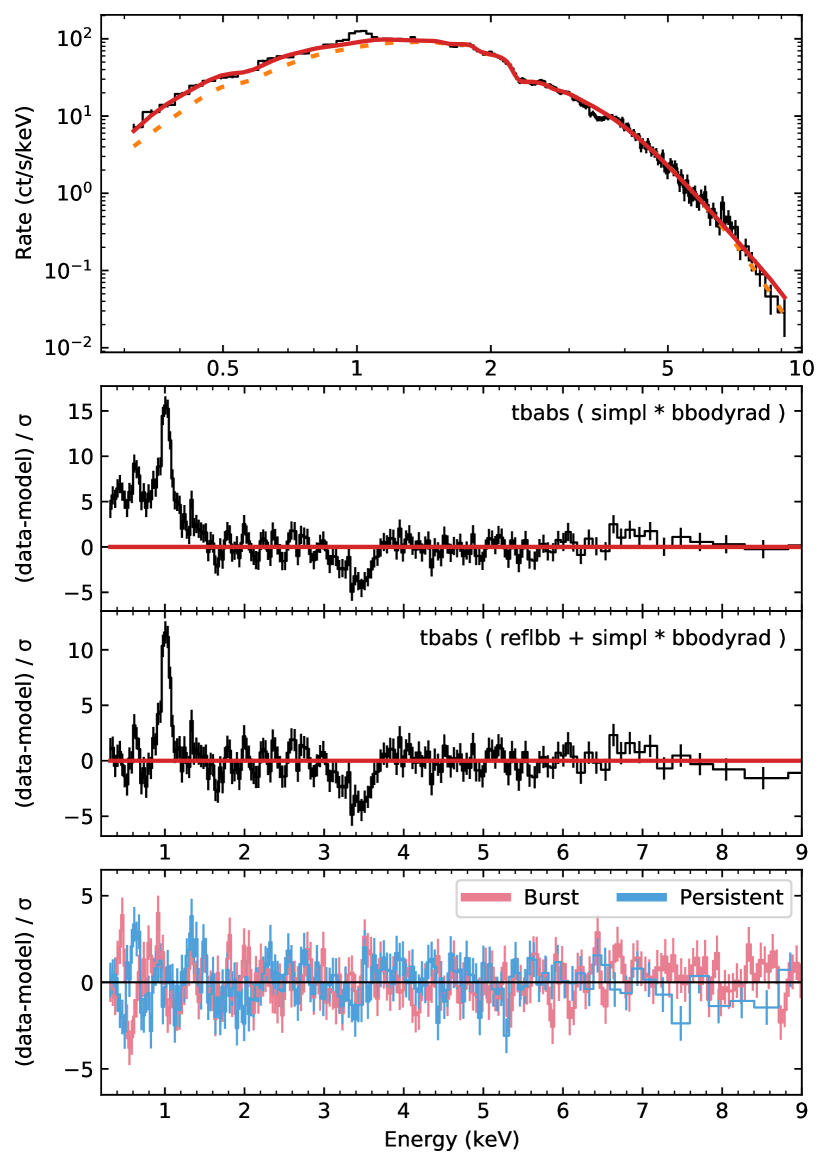
For illustrative purposes, we first show an example spectrum from three distinct phases of the light curve evolution in Figure 2. Specifically, we show: the burst cooling tail (ObsID 01, pointing 2), the minimum of the intensity dip (ObsID 02, pointing 4), and the persistent spectrum after the intensity has recovered (ObsID 05, pointing 2). From this figure it should be clear that the spectral shape evolves through time, with the persistent spectrum being especially more pronounced at the lowest and highest photon energies.
Prior spectroscopic studies of IGR J17062 have consistently found that the X-ray continuum can be well described with a phenomenological model consisting of an absorbed blackbody plus power law (Degenaar et al., 2013, 2017; Keek et al., 2017; van den Eijnden et al., 2018; Bult et al., 2021). The burst spectra are further found to exhibit an emission line observed at (Degenaar et al., 2013; Keek et al., 2017), while the spectra of the persistent emission typically show the same emission line as well as a emission line (Degenaar et al., 2017; van den Eijnden et al., 2018). In Section 4.1 we apply this model to our data.
A more complex, but physically appropriate description of the X-ray emission from IGR J17062 characterizes the spectrum using a blackbody plus Comptonization and a disk reflection component (Degenaar et al., 2017; Keek et al., 2017; van den Eijnden et al., 2018). In Section 4.2, we therefore model the spectra without the power law component, and instead convolve the blackbody component with the simpl Comptonization model (Steiner et al., 2009). We further add a disk reflection component, the specifics of which we discuss in more detail below.
4.1 Phenomenology
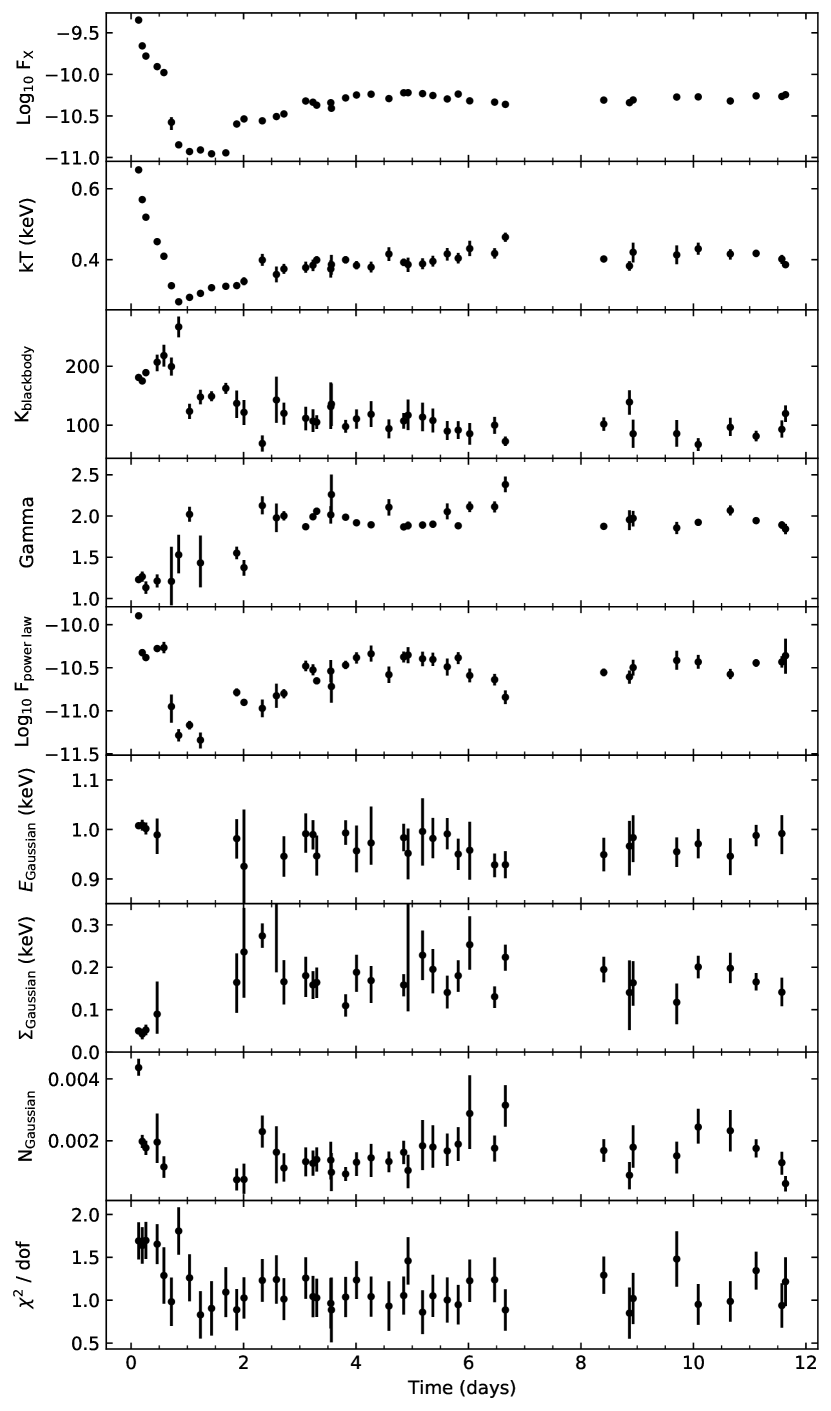
We modeled each of the NICER spectra in the range using the absorbed blackbody plus power law model, with an added Gaussian to model the emission line. This model generally does a very good job at describing the spectra (see middle panel of Figure 2), although the burst dominated data show systematically large reduced (see Figure 3, bottom panel). The first pointing further shows more complex line features, which we investigate separately in section 4.3. Finally, we find that the Gaussian component is not always required to obtain a good fit.
As a formal test for whether or not the Gaussian emission line should be included, we first fit a spectrum without the line. We then generate 500 simulated spectra from this model and calculate the improvement obtained after adding a line to the spectral model. Similarly, we calculate the improvement obtained from the real data. If the of the real data measurement is larger than the simulated realizations, we include the line in our model, and otherwise we leave it out. Using this formalism we find that the line is present in all spectra except for the five pointings of ObsID 02 and the first pointing of ObsID 03.
In Figure 3 we show the best-fit spectral parameters as a function of time along with the fit statistic obtained for each fit. Example residuals are shown in the middle panel of Figure 2. Based on these results, we can divide the evolution of IGR J17062 into three stages: a high flux stage below d; a very low flux stage between d; and a return to the persistent spectral shape after d. Of all spectral parameters, only the blackbody temperature shows a smooth evolution across all three stages: it decays from down to a minimum of , before gradually climbing back to its persistent value of . All other parameters are distinctly different at early and late times. Initially the spectrum is dominated by the thermal burst emission, while showing a low power law photon index and a narrow emission line. During the low flux stage the intensity of the power law drops and softens, while the emission line disappears. Finally, after exiting the low-flux stage, the power law becomes more prominent, the emission returns, and the overall spectral shape recovers its persistent morphology.
The question arises if the temporary non-detection of the line is due to limited sensitivity associated with the lower count rates or if it indicates a physical weakening of the line. To investigate this question, we consider the upper limits on the line normalization, finding them to be comparable to the measured when the line is significantly detected. Additionally, we stacked all data in which the line was not directly observed, which yielded a single energy spectrum with ks exposure. This stacked spectrum still did not show an emission line at line, to a 95% upper limit on the line normalization of . Our upper limit is about times below the typical line strength in persistent emission, hence, the emission line indeed weakens as the source moves through its low intensity phase.
4.2 Disk reflection
For our reflection component, we adopt the photoionized reflection model of Keek et al. (2017). This model is based on the earlier work of Ballantyne & Strohmayer (2004) and describes the reflected emission from a dense helium-rich accretion disk that is illuminated by a blackbody of variable temperature. Specifically, the model assumes a high number density of , and covers blackbody temperatures between . The disk ionization parameter ranges between , where with the flux of the illuminating blackbody continuum and is expressed in units of erg s-1 cm. We will refer to this model component as bbrefl. To account for relativistic broadening, we further convolve the reflection component with the relconv convolution model (Dauser et al., 2013). This model includes a number of parameters describing the viewing geometry of the accretion disk, which are important for shaping any relativistically broadened emission lines included in the spectral model. Because we do not observe an Fe K line, and the line is not accounted for in the reflection model, the model parameters are all poorly constrained. Instead of fitting for these parameters, we simply fix them to reasonable values. Specifically, we fix the emissivity index at , and set the spin parameter to , the latter being derived from the known spin frequency and assuming a stellar mass and stellar radius. Additionally, we set the disk inner radius and inclination at and , respectively (Bult et al., 2021). For the assumed stellar mass and radius, this inner disk radius converts to gravitional radii (, with the stellar mass). The disk outer radius is held fixed at the default value of .
We first estimate the blackbody and Comptonization continuum by fitting the simpl model to the data. If we extrapolate this model to energies below , we typically see an excess of soft emission, although the magnitude of that excess varies at the different stages of the light curve (see bottom panel of Figure 2). To account for this excess, we add the relativistically broadened bbrefl component with its temperature parameter tied to the continuum blackbody, along with a Gaussian as needed. Refitting this model to the whole energy range, we find that the reflection component is significantly detected in the first five pointings, but in all cases the disk ionization is poorly constrained and pegs at , the upper limit of the parameter range. Once the source transitions into the intensity dip, the reflection is no longer required, and the data is adequately described by just the Comptonized blackbody continuum. When the source intensity is rising again (around d), the excess flux at low photon energies returns and the continuum alone can no longer satisfactorily fit the data. Interestingly, though, the bbrefl component is unable to describe the soft excess seen in any of the d spectra, consistently yielding reduced scores of or higher.
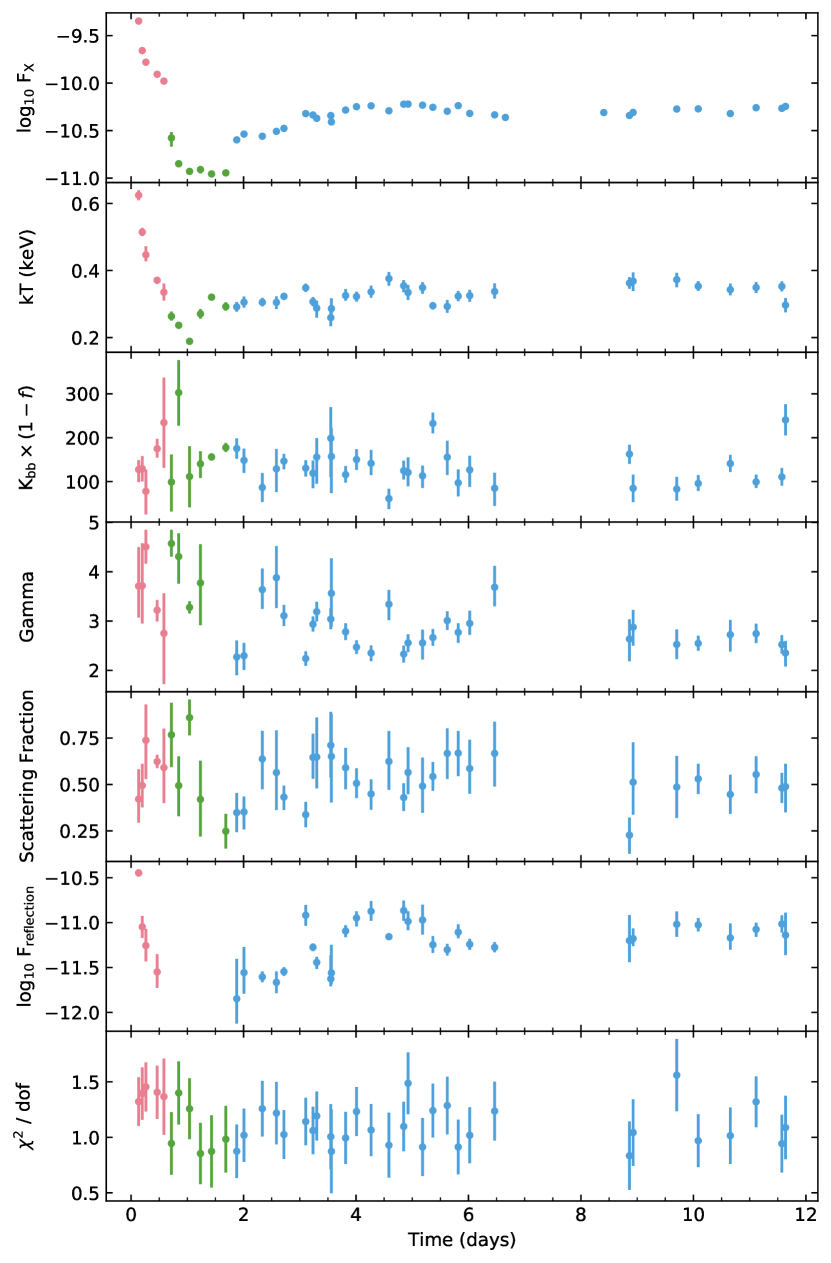
A possible reason that the reflection model works well for the early data and fails for the later data is that the continuum emission illuminating the accretion disk is evolving. Some evidence for this can be found in the phenomenological fits, which show that the early data is dominated by the blackbody, while the later data has a strong power law contribution. In a second approach to the reflection modeling, we therefore replace the bbrefl component with relxillD (Dauser et al., 2016; García et al., 2016) - a reflection model for a dense disk that assumes a power law continuum for the incident emission. As before, we keep the parameters associated with relativistic broadening fixed, and further hold the disk Fe abundance at unity, while setting the number density to its highest value of . Following the same procedure as before, we first fitted the continuum to the high energy data, then we added the reflection component (and a Gaussian as needed), and finally fitted the model to the whole energy range. Applying this approach to all spectra, we find the opposite result as before: the power law reflection model performs poorly for the soft excess seen in the earliest spectra, but gives an excellent description for all spectra at d.
In Figure 4 we show the spectral parameters obtained from the reflection modeling. We combine the bbrefl and relxillD models by showing the parameters of the best-fit model for each spectrum. Hence, the early data shows the blackbody reflection (red), the low flux points do not include either reflection model (green) and the late data shows the power law reflection model (blue).
4.3 Spectral lines
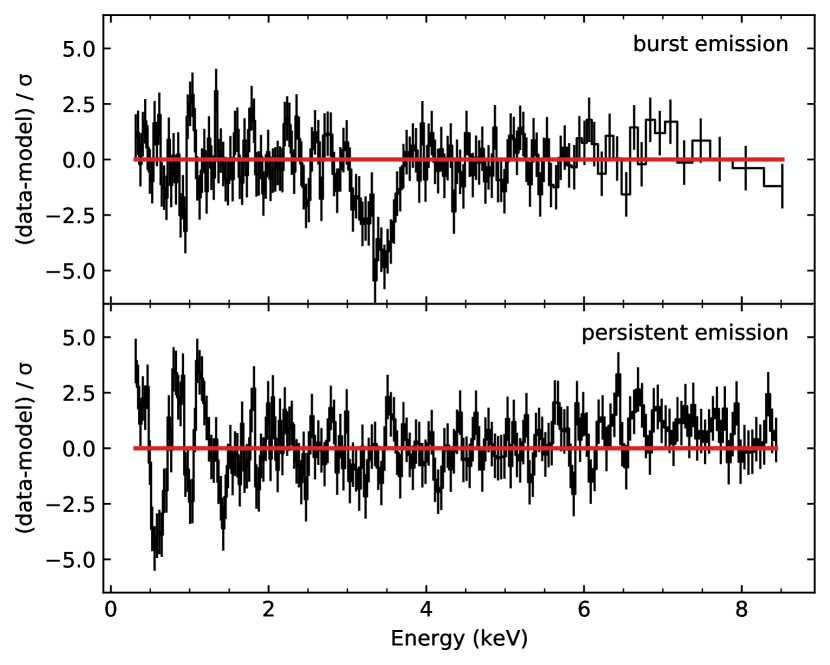
During the first pointing of our data set, IGR J17062 was brightest and showed a number of narrow line features that were not observed at later times. Because of its higher intensity, the source could be significantly detected above the background level between , hence we consider the spectrum in this slightly wider passband. We initially fit the spectrum with the Comptonization model (simpl times blackbody), and then ignored all energy channels where the data showed large residuals with respect to the model, i.e. , . Additionally, we mask the Fe-K region () in case iron line emission is causing a bias in the power law tail.
Including the previously ignored energy channels, we observe prominent spectral lines relative to the continuum. At low energies, we can observe broad soft excess flux and spectral emission features at and . An absorption feature is resolved at , and a weak excess can be seen around (see Figure 5, top and middle panels). None of these line energies coincide with instrumental features.
To account for the broad low energy excess, we mask the energy channels around the spectral lines (, , , ) and add the relativistically broadened bbrefl reflection component to the model. After fitting this model, we again included the line regions, finding that the reflection model cannot account for any of the observed lines (see Figure 5, top and bottom panels).
Of the four line features observed in the spectrum, the emission line is the most prominent. Adding a Gaussian line component to describe this feature improves the fit statistic by , which by far exceeds the distribution obtained from a sample of simulated spectra (see Section 4.1 for details). Additionally, we calculate the simple significance as the line normalization over its uncertainty, finding . The best-fit parameters of the Gaussian line are reported in Table 1. Considering the residuals shown in Figure 5, we note that the profile of the line is noticeably asymmetric. We note that both the line significance and asymmetry are independent of the choice of continuum. Repeating the above analysis using the simpler blackbody plus power-law model yields the same results.
| Line Energy | Width | norm | Eq. Width |
|---|---|---|---|
| (keV) | (keV) | () | (keV) |
The absorption line at is the second most prominent line in spectrum. With a of and a simple significance ratio of , this line is highly significant. The line again appears to be slightly asymmetric, with a shallower wing toward low energy and a steeper wing toward high energy. We repeated this analysis with a simpler blackbody plus power-law model, but again obtained the same significance and line asymmetry.
To verify if a absorption line could be detected at any other time, we first stacked all data in which the burst emission dominated the continuum (i.e. ObsIDs 01 and 02, excluding the first pointing in which the line was already detected). The spectrum of this stacked dataset showed no evidence for absorption at , yielding a upper limit on the absolute line normalization of ct s-1 cm-2. Additionally, we also combined all observations in which the source spectrum had returned to its persistent shape (ObsIDs 05 through 12). Again, the energy spectrum showed no evidence of absorption to an upper limit of ct s-1 cm-2.
To investigate if the absorption line showed any temporal evolution, we divided this observation into three equal duration sub-segments ( exposure each). The absorption line was clearly detected in each individual sub-segment with the same line profile in all spectra. Hence, no line evolution was observed. We also binned the data as a function of intensity by constructing an resolution light curve and sorting the light curve bins into three flux bins of ascending count-rate, each with equal exposure. Extracting spectra from the underlying event data associated with each flux bin, we again clearly resolve the absorption line in all spectra but do not find any evolution in the line profile.
For the two remaining lines, we again use the simulation method to find that the emission line at is significant (), but that the line at is not (). The associated simple significance ratios for these two lines are and , respectively. The detailed component parameters for these lines are reported in Table 1.
4.4 Emission line modeling
High resolution spectroscopy of the persistent emission has shown that the emission region consists of a continuum of narrow lines (Degenaar et al., 2017; van den Eijnden et al., 2018). If a similar continuum of narrow lines is responsible for the emission features observed in the burst spectrum, then that may explain the apparent asymmetry of the line. To investigate this possibility, we attempted to fit the burst spectrum (Figure 5) using the photoionized plasma model pion (Miller et al., 2015; Mehdipour et al., 2016) which is available within spex (Kaastra et al., 1996). Assuming a blackbody continuum illuminating a Compton-thin plasma, we calculated pion model emission spectra on a parameter grid in blackbody temperature, column depth, and ionization, which we then tabulated for use in xspec (see Parker et al. (2019) for further details). In the following, we will refer to this model as pionbb. When fitting to the data, we adopted the reflection model for the continuum (as described in the previous section), and tied the blackbody temperature between the pionbb and continuum blackbody components. Because we did not calculate absorption features in our model spectra, we further excluded the region from the fit. This model performed reasonably well, yielding a best-fit of 183.6 for 138 degrees of freedom for the parameters listed in Table 2. As shown in the top panel of Figure 6, the model captured most of the emission around and simultaneously accounted for the line as well.
We also attempted to fit the emission feature observed in the (non-burst) persistent emission with the pionbb model. We combined all data collected after , i.e. ObsID through , and extracted a spectrum between . We again modelled the continuum emission using the reflection model (adopting the relxillD model as described in Section 4.2), but exchanged the Gaussian line component for the pionbb model. This model did not yield an especially good fit, resulting in a best-fit of for degrees of freedom, mainly due to large residuals at low photon energies (see Figure 6, bottom panel). For comparison, adopting a simple Gaussian line component resulted in best fit of 326. To ensure that the poor fit did was not caused by the slightly different treatment of the disk reflection component, we repeated the pionbb modelling using the phenomenological continuum model as well. For both the burst and persistent spectra we obtain the same outcome: the pionbb model works well for the burst spectrum, but fails for persistent emission.
| Parameter | Value | Scale | Unit |
| Burst spectrum | |||
| Ionization (log ) | erg s cm-2 | ||
| Column density (nH) | cm-2 | ||
| Temperate (kT) | keV | ||
| Flux () | erg s-1 cm-2 | ||
| Persistent spectrum | |||
| Ionization (log ) | erg s cm-2 | ||
| Column density (nH) | cm-2 | ||
| Temperate (kT) | keV | ||
| Flux () | erg s-1 cm-2 | ||
5 Discussion
We have presented a spectroscopic analysis of IGR J17062 in the aftermath of one of its energetic intermediate duration X-ray bursts. We detected a significant absorption line in the source emission when the burst emission was still bright. Further, we have investigated the spectral evolution as the source moves through a dip in overall intensity directly after the burst has cooled. In the following we discuss the implications of these findings.
5.1 The intensity dip
As the X-ray burst emission decays, we find that the source emission drops well below the long-term persistent rate. This intensity dip lasts about three days, starting at d and ending at d, and is further punctuated by two sharp transitions in the intensity. These transitions are already apparent in the light curve (Figure 1), where the count-rate drops sharply at d, and jumps up again at about d. These same transitions are even more pronounced in the evolution of the X-ray flux (Figure 3), where the six pointings collected while the source passes through its lowest intensities appear to be shifted in flux by a constant factor. Indeed, if we increase these six flux measurements by an (ad hoc) factor of , then the resulting light curve becomes a smoothly varying trend (see Figure 7). This suggests that there are two superimposed parts to the intensity dip: firstly there is the wider three day period during which the source drops below the persistent intensity, and secondly there is the narrower day interval during which we are seeing only about of the expected emission.
What could cause this complex evolution in the observed X-ray flux? The evolution of the spectral parameters offer some clues here (Figure 4). As the X-ray burst emission cools, the blackbody temperature evolves smoothly to well below its normal persistent temperature. Given that the blackbody is attributed to the neutron star (van den Eijnden et al., 2018; Hernández Santisteban et al., 2019) its temperature is set by heating associated with the impact of the accretion flow. Hence, our results immediately suggest that the accretion onto the star must be inhibited. That the impact of an X-ray burst could trigger a temporary change in the mass accretion rate is in itself not surprising. There is ample observational evidence from both short and long X-ray bursts that the accretion rate onto the star is enhanced while the X-ray burst is brightly irradiating the disk (in ’t Zand et al., 2013; Worpel et al., 2013, 2015). There are a number of physical mechanisms through which the burst emission could affect the mass flow through the disk (Degenaar et al., 2018): radiation pressure of the burst emission could drive an outflow; the X-ray heating might change the structure of the disk, likely increasing the scale height and altering the density; and Poynting-Robertson drag could remove angular momentum from the disk, allowing it to drain onto the neutron star. Recent numerical simulations of the radiative burst-disk interaction indicate that the latter two effects dominate the disk response to an X-ray burst (Fragile et al., 2018, 2020), causing the inner radius of the disk to move outward as the burst rises to its peak intensity. Following the bright phase of the burst, one might then expect that it takes some time for the disk to replace the lost material, thus temporarily suppressing the amount of matter that reaches the stellar surface. We suggest that this disk-recovery process is causing the wider three day dip in the source flux.
One obvious challenge to this interpretation is that three days is a comparatively long time for a disk recovery process. The simulations of Fragile et al. (2020) indicate the timescale at which the inner disk radius recovers is similar to the decay timescale of the burst, which for IGR J17062 is on the order of hours, rather than days. However, they also find that the disk structure remains perturbed even after the burst has decayed. Hence, the observed day dip might not be associated with the recovery of the disk inner radius, but rather with the relaxation of the disk structure to its preburst equilibrium. It is important to keep in mind, however, that the simulations of Fragile et al. (2020) investigate the disk response to a regular X-ray burst, that is, its duration was on the order seconds. The intermediate duration bursts of IGR J17062 are much more energetic events, so there is some uncertainty as to whether the results of these simulations extrapolate: the longer X-ray bursts observed from IGR J17062 may induce a more pronounced disk response.
If this interpretation is correct, then we would expect that excess mass accreted during the burst is roughly the same as the mass needed to restore the disk. Equivalently, the energy budget of the observed flux reduction should match the expected increase in the persistent flux during the burst. As a consistency test, we therefore adopted the flux evolution with the correction factor applied, and measured the fluence over the day interval of the intensity dip. This fluence is , as compared to the expected from a constant flux of . Dividing the difference in fluence by the duration of the X-ray bursts of IGR J17062 (Keek et al., 2017), we find that the accretion emission must have been inflated by a factor of during the X-ray bursts. While this range is rather broad, it is consistent with the apparent increases in the persistent emission of many bright PRE bursts (in ’t Zand et al., 2013; Worpel et al., 2013).
If the three day dip is indeed caused by a gradual restoration of the inner accretion disk, then, one wonders why this effect is not more commonly observed. Here the special characteristics of IGR J17062 may play an important role in making this recovery phase so pronounced. First, the amount of matter evacuated from the inner disk through enhanced accretion will likely scale with the intensity and duration of the X-ray bursts. As the intermediate duration X-ray bursts of IGR J17062 are among the most energetic helium bursts on record (in’t Zand et al., 2019), their impact on the disk will be more pronounced compared to regular H/He bursts. Second, the ultra-compact nature of IGR J17062 means its accretion disk is comparatively small. Hence, it is plausible that the entire disk is affected by the irradiating burst. Third, in its persistent state, the accretion rate onto the stellar surface is very low (Keek et al., 2017), thus, if a large amount of matter is depleted during the bursts, the subsequent recovery is likely to have a longer timescale than it would have in brighter sources. Fourth, IGR J17062 is a millisecond pulsar that is believed to have an active propeller mechanism (Hernández Santisteban et al., 2019; Bult et al., 2021). The radiation pressure and X-ray heating induced by the burst will likely affect the same region of the disk where the magnetosphere couples to the accretion flow. The net effect this will have on the propeller is difficult to predict, as competing effects might be expected. For instance, the Poynting-Robertson drag removes angular momentum from the flow, which could make it easier for matter to be ejected. On the other hard, if the disk is being disrupted, that might affect the magnetic threading of the disk, potentially reducing the efficiency with which the stellar magnetosphere can exert a torque on the disk. Either way, an impact of the burst on the propeller efficiency seems plausible and might explain why a burst from IGR J17062 elicits a different disk response as compared to other sources.
In interpreting the three day dip, we have assumed that the lowest intensity observations were shifted in flux, but we have not yet addressed what could cause this shift. The obvious interpretation would be that the evolving disk structure is temporarily obscuring the central source. This scenario would fit with the rapid transitions in flux, as well as the apparent constant flux scaling. A problem with this interpretation, though, is that obscuration dips are normally associated with high-inclination sources. The inclination of IGR J17062, on the other hand, is likely about (Bult et al., 2021). More importantly, though, the spectral evolution seen during the flux shift is not consistent with absorption.
Considering the time-resolved spectral evolution, we see that the blackbody parameters evolve smoothly across both discontinuities in flux. Hence, it would appear that the reprocessed emission is the main driver for this effect. Indeed, none of the six pointings that make up the flux-shifted epoch show evidence of a reflection component, or a emission line. These non-detections could indicate a temporary change in the inner disk geometry, e.g. a change in the disk scale height might cause a change in disk anisotropy, or even shadow the outer parts of the disk from the irradiating continuum emission. Considering the intensity of the disk reflection, however, we see that when it is detected, the reflection component consistently makes up about one third of the total X-ray flux. Hence, just removing the reflection from the model cannot fully account for the observed flux shift. The high photon energy tail must be affected also.
Another aspect to consider is that the character of the reflection spectrum appears to be different before and after the flux shift: the early data prefers the blackbody reflection model, whereas the later data prefers the power law reflection model. Simultaneously, the early data has a lower power law photon index than the late data. This suggests that the geometry of the Comptonization medium is different while the burst is bright as compared to the persistent state. Possibly, then, the period of the flux shift is related to the changing corona.
The evolution of a corona under the influence of an X-ray burst is shaped by several competing effects (see Speicher et al., 2020, for a recent investigation). The flood of soft photons from the burst should effectively cool the corona. As the geometry of the corona changes, however, it will intercept a different fraction of the burst emission, modifying the cooling rate. Further, the enhanced disk accretion rate may provide a temporary boost to the coronal heating rate, partially counteracting the radiative cooling.
With these interaction mechanisms in mind, we can speculate how the changing corona might lead to the observed spectral evolution. While the burst is bright, it likely causes the corona to condense into a high density state. This would be consistent with the reduced power-law emission and its lower photon index. As the burst cools to near the persistent intensity, however, it can no longer hold the disk and corona in their perturbed states. As the disk begins to recover, the corona might likewise inflate back into a more extended geometry. Due to the resulting decrease in density, the corona may be efficiently cooled by the latent burst emission, with few hard photons visible to either the disk or the observer. Once the disk has sufficiently relaxed, the density of the corona recovers, allowing for the (re-)emergence of the power-law continuum and the associated disk reflection.
5.2 Emission lines
We observed two spectral emission lines in the burst spectra of IGR J17062. The most prominent of the two is the emission line, which was also observed in the previous bursts, as reported by Degenaar et al. (2013) and Keek et al. (2017). These authors interpreted the line as a feature of the reflection spectrum, possibly associated with Fe-L band transitions or perhaps with Ne x. A similar emission line has also been observed in bright PRE bursts of 4U 182030 (Strohmayer et al., 2019) and SAX J1808.43658 (Bult et al., 2019). As in these previous works, we find that reflection models are not able to account for the observed intensity in the line. This does not rule out a reflection origin, however, as the line strengths depend greatly on the assumed composition of the disk, where even state-of-art reflection models are still imperfect (Ballantyne & Strohmayer, 2004; Madej et al., 2014; Keek et al., 2017).
A emission line is also present in the persistent emission of IGR J17062, however, high-resolution spectroscopy has revealed that this feature is a continuum of several narrow lines (Degenaar et al., 2017; van den Eijnden et al., 2018) rather than a single broad line. While a reflection origin remains plausible, van den Eijnden et al. (2018) suggest that these lines may also be produced by an outflow or through shocks in the accretion column. Presumably, the physical mechanism behind the emission is the same for both the burst and the persistent emission, so we can speculate that the line we measure in this work is also a superposition of several more narrow lines.
We also detected a weaker emission line at in the X-ray burst spectrum. A similar feature has not previously been reported in either the 2012 or 2015 bursts (Degenaar et al., 2013; Keek et al., 2017). van den Eijnden et al. (2018) do report excess emission around these energies in the persistent emission, and attribute this to an enhanced oxygen abundance in the disk. Line emission around has also been observed in other ultra-compact X-ray binaries, notably 4U 0614+091 (Madej et al., 2010), 4U 1543–624 (Madej & Jonker, 2011; Ludlam et al., 2019), although those examples are much more prominent than what we report here. In both cases this line is interpreted as O viii emission associated with the disk reflection spectrum.
In an attempt to quantity the line emission with a physical model, we fit these features with a pion model for the line emission of a photoionized plasma illuminated by a blackbody continuum. This model was able to simultaneously describe both the and emission, with the latter being due to a continuum of narrow line features (as in the persistent emission). The plausible interpretation of this model is that the lines originate in an outflow that is illuminated by the burst emission, although it remains possible that the pion model is simply compensating for some of the deficiencies in the disk reflection models. Either way, the success of this model would suggest that both emission lines share the same origin. Applying the pion model to the persistent (non-burst) emission spectrum, however, we found that it failed to adequately describe the broader feature observed there. Specifically, the best fit to the persistent emission spectrum leaves structural residuals at low photon energies (Figure 6), indicating that the model is not quite able to produce a line as broad as seen in the data. We could attribute this change in model performance to the changing continuum emission, although it may also indicate a structural change in emitting plasma. A more detailed comparison of the emission lines in burst and persistent spectra may shed light on the precise origin or these lines, however such a study is beyond the scope of this work.
5.3 Absorption line
We detected a highly significant absorption line at in the first duration pointing of IGR J17062. The absorption line is observed while the thermal burst emission dominates the spectrum: at the blackbody component accounts for approximately of the continuum emission. Conversely, the depth of the absorption line has a minimum at about of the continuum, exceeding the intensity in the non-burst emission by a factor of . Hence, this line cannot be associated with reprocessing in the disk or corona. Two plausible origins for this line remain: it could be associated with absorption in a burst induced outflow, or it could originate from heavy elements on the stellar surface. Either way, it is likely to be a signature of burning ashes produced in the burst.
| Element | Energy (keV) | 1+z |
|---|---|---|
| S | 2.62 | 0.77 |
| Ar | 3.32 | 0.98 |
| K | 3.70 | 1.09 |
| Ca | 4.11 | 1.21 |
| Sc | 4.53 | 1.33 |
| Ti | 4.97 | 1.46 |
Spectral features in the burst emission have long been sought after, because, in principle, they offer a direct probe of the stellar compactness. A line originating from the stellar surface will be gravitationally redshifted by a factor , which depends on stellar mass and radius as
| (1) |
with and the stellar mass and radius, the observed line energy, and the rest-frame line energy. In practice, however, finding and identifying such features has proven challenging. Early burst studies with Tenma and EXOSAT reported absorption lines at (Waki et al., 1984; Nakamura et al., 1988; Magnier et al., 1989), and at (Waki et al., 1984), however, more sensitive instrumentation has never been able to confirm those detections. Cottam et al. (2002) reported on a set of narrow absorption lines in the stacked XMM-Newton spectra of EXO . These lines, however, were later found to be incompatible with a surface origin (Lin et al., 2010). Using NuSTAR, Barrière et al. (2015) found a narrow absorption line in GRS 1741.92853, although at its significance is marginal. NICER observations of 4U 182030 revealed narrow absorption lines at and (Strohmayer et al., 2019) which were attributed not to the stellar surface, but to a PRE driven wind.
The detection of absorption edges in burst spectra are more robust (in’t Zand & Weinberg, 2010; Kajava et al., 2017), and are attributed to heavy metals dredged up during the PRE phase of the X-ray burst. During the thermonuclear runaway powering the X-ray burst, the nuclear burning chains will seed the stellar envelope with burning ashes that primarily consist of heavy elements with atomic numbers in the range (Schatz et al., 2001; Brown et al., 2002; Woosley et al., 2004). Convective mixing raises these elements to sufficiently shallow depths that they may be ejected in the super Eddington wind generated by the PRE phase of the burst (Weinberg et al., 2006; Yu & Weinberg, 2018). Applying this interpretation to the line observed in IGR J17062, we find a possible identification might be hydrogen-like Ar xviii which has a line energy at (see Table 3). The modest blueshift could be explained if the absorption line is created at a large height above the stellar surface, such that the line shift is mainly a function of the outflow velocity.
The wind interpretation has a number of issues, the first of which is the timing of the absorption line detection. The line is observed only in the first observation, which was collected about three hours after the MAXI/GSC trigger. Although we did not observe the 2020 burst from IGR J17062 during its peak intensity, the large energy budget of these bursts makes it reasonable to assume that all bursts show photospheric radius expansion, and probably even super-expansion (Degenaar et al., 2013; Keek et al., 2017). For the 2015 burst, Keek et al. (2017) estimated that the PRE phase lasted about . Hence, if the 2020 burst followed a comparable evolution, then the PRE phase and its associated wind would have ended well before the first NICER observations were collected. A second issue is that the line is relatively broad. If the absorption line originates in a wind, then the width of the line should be dynamic, suggesting a material velocity of . In contrast, the expected wind velocity is only (Yu & Weinberg, 2018). Finally, if the absorption line has a dynamic origin, then one might expect an evolution in the line profile with time or flux, as was reported by Strohmayer et al. (2019) in the case of 4U 182030, for instance. The absorption line does not show any such evolution.
Alternatively, we might associate the absorption line with burning ashes that remain on the stellar surface. Modeling suggests that the heavy elements created during the burst may linger on the surface (Yu & Weinberg, 2018), where they can imprint on the observed burst emission even after the PRE phase has ended. Given the expected redshift factor of for a canonical neutron star, the line could be associated with the transition of hydrogen-like Sc xxi (see Table 3). A problem with this identification, however, is that IGR J17062 is an ultra-compact binary (Strohmayer et al., 2018), hence the accreting material should be depleted of hydrogen. One would therefore expect the nuclear reaction chain powering the X-ray burst to proceed through a series of alpha captures, which flows through , , and , and does not produce Sc. Possibly, the nuclear reactions could seed the envelope with a small amount of protons, which may then act as catalysts for the production of non-alpha chain nuclei (Weinberg et al., 2006). Even in this case, however, the various isotopes of Sc are not expected to be produced in abundance (Parikh et al., 2008; Cyburt et al., 2016). Instead, or are likely the dominant elements in the burning ashes of a helium burst (Weinberg et al., 2006; Yu & Weinberg, 2018), making the Ca xx or Ti xxii line transitions the more probable identifications for the observed absorption line (see Table 3). Assuming a km neutron star radius, a line identification with these two elements would imply a stellar mass of , or respectively.
General relativistic effects will not only introduce a redshift, but will also shape the observed line profile, introducing a dependence on the stellar spin, the oblateness, and the opening angle between the observer’s line of sight and the stellar rotation axis (Özel & Psaltis, 2003). Together, these effects will cause the observed line to broaden and skew toward an asymmetric profile that favors higher photon energies. Qualitatively, these effects are consistent with the observed absorption line, which has a broadened profile and appears to be slightly skewed toward higher energies. Quantitatively, however, the width of the measured line converts to a full width at half maximum of . Comparing this width to line profiles obtained through ray-tracing simulations (Bauböck et al., 2013; Nättilä & Pihajoki, 2018), the observed line appears to be much broader than expected for a Hz millisecond pulsar.
The width of the absorption line might be reconcilable with both a PRE wind and stellar surface origin if we are not actually observing a single line, but rather a superposition of two or more unresolved lines. The energy resolution of NICER at is about eV, so it is feasible that the absorption feature really consists of two or more closely spaced narrow lines that are blended together. Given that the absorption line was observed late in the cooling tail of the burst, the wind interpretation remains problematic, so we favor the surface origin. A number of questions remain, though. While the modelling of burst reaction chains suggests that either or may be present in the neutron star envelope with high abundances (Weinberg et al., 2006; Yu & Weinberg, 2018), it is not clear how long such elements might linger near the stellar surface. Further, we caution that these works are based on ignition depths that go down to g cm-2. The bursts of IGR J17062 have an ignition depth that is an order of magnitude larger (Keek et al., 2017), introducing some uncertainty as to whether the simulation results extrapolate to these events. Hence, a more targeted theoretical investigation will be needed to identify the origin of these lines with confidence.
6 Conclusions
We have presented a spectroscopic analysis of NICER observations in the aftermath of a bright intermediate duration X-ray burst from IGR J17062. These observations revealed that the flux of IGR J17062 was severely depressed over the three day period following the X-ray burst. We interpreted this flux evolution as an effect of the accretion disk and corona gradually relaxing back to their persistent equilibrium states, after being perturbed by the energetic X-ray burst.
We further detected a weak emission line at and a strong emission line at in the X-ray burst spectrum. We found that a photoionized plasma illuminated by a blackbody continuum is able to simultaneously describe both lines, suggesting they share a common origin. The precise nature of the line emitting plasma remains unclear at this time, however, and could be attributed to an ionized outflow or disk reflection.
Finally, we detected a prominent absorption line centered at . We tentatively attribute this line to burning ashes on the stellar surface, possibly due to or .
References
- Arnaud (1996) Arnaud, K. A. 1996, in Astronomical Society of the Pacific Conference Series, Vol. 101, Astronomical Data Analysis Software and Systems V, ed. G. H. Jacoby & J. Barnes, 17
- Ballantyne & Strohmayer (2004) Ballantyne, D. R., & Strohmayer, T. E. 2004, ApJ, 602, L105
- Barrière et al. (2015) Barrière, N. M., Krivonos, R., Tomsick, J. A., et al. 2015, ApJ, 799, 123
- Bauböck et al. (2013) Bauböck, M., Psaltis, D., & Özel, F. 2013, ApJ, 766, 87
- Brown et al. (2002) Brown, B. A., Clement, R. R., Schatz, H., Volya, A., & Richter, W. A. 2002, Phys. Rev. C, 65, 045802
- Bult et al. (2021) Bult, P., Strohmayer, T. E., Malacaria, C., Ng, M., & Wadiasingh, Z. 2021, ApJ, 912, 120
- Bult et al. (2019) Bult, P., Jaisawal, G. K., Güver, T., et al. 2019, ApJ, 885, L1
- Churazov et al. (2007) Churazov, E., Sunyaev, R., Revnivtsev, M., et al. 2007, A&A, 467, 529
- Cottam et al. (2002) Cottam, J., Paerels, F., & Mendez, M. 2002, Nature, 420, 51
- Cyburt et al. (2016) Cyburt, R. H., Amthor, A. M., Heger, A., et al. 2016, ApJ, 830, 55
- Dauser et al. (2016) Dauser, T., García, J., Walton, D. J., et al. 2016, A&A, 590, A76
- Dauser et al. (2013) Dauser, T., Garcia, J., Wilms, J., et al. 2013, MNRAS, 430, 1694
- Degenaar et al. (2013) Degenaar, N., Miller, J. M., Wijnands, R., Altamirano, D., & Fabian, A. C. 2013, ApJ, 767, L37
- Degenaar et al. (2017) Degenaar, N., Pinto, C., Miller, J. M., et al. 2017, MNRAS, 464, 398
- Degenaar et al. (2018) Degenaar, N., Ballantyne, D. R., Belloni, T., et al. 2018, Space Sci. Rev., 214, 15
- Fragile et al. (2020) Fragile, P. C., Ballantyne, D. R., & Blankenship, A. 2020, Nature Astronomy, 4, 541
- Fragile et al. (2018) Fragile, P. C., Ballantyne, D. R., Maccarone, T. J., & Witry, J. W. L. 2018, ApJ, 867, L28
- Galloway & Keek (2021) Galloway, D. K., & Keek, L. 2021, Astrophysics and Space Science Library, 461, 209
- Galloway et al. (2020) Galloway, D. K., in’t Zand, J., Chenevez, J., et al. 2020, ApJS, 249, 32
- García et al. (2016) García, J. A., Fabian, A. C., Kallman, T. R., et al. 2016, MNRAS, 462, 751
- Gendreau & Arzoumanian (2017) Gendreau, K., & Arzoumanian, Z. 2017, Nature Astronomy, 1, 895
- Hernández Santisteban et al. (2019) Hernández Santisteban, J. V., Cúneo, V., Degenaar, N., et al. 2019, MNRAS, 488, 4596
- in ’t Zand et al. (2013) in ’t Zand, J. J. M., Galloway, D. K., Marshall, H. L., et al. 2013, A&A, 553, A83
- in’t Zand et al. (2011) in’t Zand, J. J. M., Galloway, D. K., & Ballantyne, D. R. 2011, A&A, 525, A111
- in’t Zand et al. (2019) in’t Zand, J. J. M., Kries, M. J. W., Palmer, D. M., & Degenaar, N. 2019, A&A, 621, A53
- in’t Zand & Weinberg (2010) in’t Zand, J. J. M., & Weinberg, N. N. 2010, A&A, 520, A81
- Iwakiri et al. (2015) Iwakiri, W., Keek, L., Serino, M., et al. 2015, The Astronomer’s Telegram, 8253, 1
- Ji et al. (2014) Ji, L., Zhang, S., Chen, Y., et al. 2014, ApJ, 782, 40
- Ji et al. (2015) Ji, L., Zhang, S., Chen, Y., et al. 2015, ApJ, 806, 89
- Kaastra et al. (1996) Kaastra, J. S., Mewe, R., & Nieuwenhuijzen, H. 1996, in UV and X-ray Spectroscopy of Astrophysical and Laboratory Plasmas, 411–414
- Kajava et al. (2017) Kajava, J. J. E., Sánchez-Fernández, C., Kuulkers, E., & Poutanen, J. 2017, A&A, 599, A89
- Keek et al. (2014) Keek, L., Ballantyne, D. R., Kuulkers, E., & Strohmayer, T. E. 2014, ApJ, 797, L23
- Keek et al. (2017) Keek, L., Iwakiri, W., Serino, M., et al. 2017, ApJ, 836, 111
- Lewin et al. (1993) Lewin, W. H. G., van Paradijs, J., & Taam, R. E. 1993, Space Sci. Rev., 62, 223
- Lin et al. (2010) Lin, J., Özel, F., Chakrabarty, D., & Psaltis, D. 2010, ApJ, 723, 1053
- Ludlam et al. (2019) Ludlam, R. M., Shishkovsky, L., Bult, P. M., et al. 2019, ApJ, 883, 39
- Maccarone & Coppi (2003) Maccarone, T. J., & Coppi, P. S. 2003, A&A, 399, 1151
- Madej et al. (2014) Madej, O. K., García, J., Jonker, P. G., et al. 2014, MNRAS, 442, 1157
- Madej & Jonker (2011) Madej, O. K., & Jonker, P. G. 2011, MNRAS, 412, L11
- Madej et al. (2010) Madej, O. K., Jonker, P. G., Fabian, A. C., et al. 2010, MNRAS, 407, L11
- Magnier et al. (1989) Magnier, E., Lewin, W. H. G., van Paradijs, J., et al. 1989, MNRAS, 237, 729
- Mehdipour et al. (2016) Mehdipour, M., Kaastra, J. S., & Kallman, T. 2016, A&A, 596, A65
- Miller et al. (2015) Miller, J. M., Kaastra, J. S., Miller, M. C., et al. 2015, Nature, 526, 542
- Nakamura et al. (1988) Nakamura, N., Inoue, H., & Tanaka, Y. 1988, PASJ, 40, 209
- Nättilä & Pihajoki (2018) Nättilä, J., & Pihajoki, P. 2018, A&A, 615, A50
- Negoro et al. (2015) Negoro, H., Serino, M., Sasaki, R., et al. 2015, The Astronomer’s Telegram, 8241, 1
- Nishida et al. (2020) Nishida, H., Serino, M., Iwakiri, W., et al. 2020, The Astronomer’s Telegram, 13827, 1
- Özel & Psaltis (2003) Özel, F., & Psaltis, D. 2003, ApJ, 582, L31
- Parikh et al. (2008) Parikh, A., José, J., Moreno, F., & Iliadis, C. 2008, ApJS, 178, 110
- Parker et al. (2019) Parker, M. L., Longinotti, A. L., Schartel, N., et al. 2019, MNRAS, 490, 683
- Schatz et al. (2001) Schatz, H., Aprahamian, A., Barnard, V., et al. 2001, Phys. Rev. Lett., 86, 3471
- Speicher et al. (2020) Speicher, J., Ballantyne, D. R., & Malzac, J. 2020, MNRAS, 499, 4479
- Steiner et al. (2009) Steiner, J. F., Narayan, R., McClintock, J. E., & Ebisawa, K. 2009, PASP, 121, 1279
- Strohmayer & Bildsten (2006) Strohmayer, T., & Bildsten, L. 2006, in Compact stellar X-ray sources, ed. W. H. G. Lewin & M. van der Klis, Vol. 39 (Cambridge: Cambridge University Press), 113–156
- Strohmayer & Keek (2017) Strohmayer, T., & Keek, L. 2017, ApJ, 836, L23
- Strohmayer et al. (2018) Strohmayer, T. E., Arzoumanian, Z., Bogdanov, S., et al. 2018, ApJ, 858, L13
- Strohmayer et al. (2019) Strohmayer, T. E., Altamirano, D., Arzoumanian, Z., et al. 2019, ApJ, 878, L27
- van den Eijnden et al. (2018) van den Eijnden, J., Degenaar, N., Pinto, C., et al. 2018, MNRAS, 475, 2027
- Waki et al. (1984) Waki, I., Inoue, H., Koyama, K., et al. 1984, PASJ, 36, 819
- Weinberg et al. (2006) Weinberg, N. N., Bildsten, L., & Schatz, H. 2006, ApJ, 639, 1018
- Wilms et al. (2000) Wilms, J., Allen, A., & McCray, R. 2000, ApJ, 542, 914
- Woosley et al. (2004) Woosley, S. E., Heger, A., Cumming, A., et al. 2004, ApJS, 151, 75
- Worpel et al. (2013) Worpel, H., Galloway, D. K., & Price, D. J. 2013, ApJ, 772, 94
- Worpel et al. (2015) Worpel, H., Galloway, D. K., & Price, D. J. 2015, ApJ, 801, 60
- Yu & Weinberg (2018) Yu, H., & Weinberg, N. N. 2018, ApJ, 863, 53