PandaX-4T Collaboration
Dark Matter Search Results from the PandaX-4T Commissioning Run
Abstract
We report the first dark matter search results using the commissioning data from PandaX-4T. Using a time projection chamber with 3.7-tonne of liquid xenon target and an exposure of 0.63 tonneyear, 1058 candidate events are identified within an approximate nuclear recoil energy window between 5 and 100 keV. No significant excess over background is observed. Our data set a stringent limit to the dark matter-nucleon spin-independent interactions, with a lowest excluded cross section (90% C.L.) of cm2 at a dark matter mass of 40 GeV/.
Like ordinary matter, the mysterious dark matter in the Universe may be composed of fundamental particles Bertone et al. (2005). The hunt for these particles has been intensively carried out globally using many different particle detectors Liu et al. (2017); Conrad and Reimer (2017); Buchmueller et al. (2017); Billard et al. (2021). Dark matter direct detection experiments, typically located deep underground, are particularly sensitive to dark matter within a mass range approximately from GeV/ to 100 TeV/, via the nuclear recoil (NR) of the target nucleus Liu et al. (2017). In recent years, large-scale liquid xenon time projection chambers (TPCs) have spearheaded the detection sensitivity Akerib et al. (2017); Cui et al. (2017); Aprile et al. (2018); Wang et al. (2020a), and three new experiments with multitonne of targets are ongoing to deepen the search Zhang et al. (2019); Mount et al. (2017); Aprile et al. (2020).
The PandaX experiment, located in the China Jinping Underground Laboratory (CJPL) Kang et al. (2010), is dedicated to search for the dark matter particles and to study fundamental properties of neutrinos. PandaX-4T Zhang et al. (2019), with a sensitive target of 3.7 tonne of liquid xenon, is located in the B2 hall of the newly expanded CJPL-II Li et al. (2015). The detector is placed at the center of an ultrapure water shield in a stainless steel tank with a diameter of 10 m and a depth of 13 m. The double-vessel cryostat made out of low-background stainless steel Zhang et al. (2016) contains 5.6 tonne of total liquid xenon, with a 30-l overflow chamber inside the cryostat for adjusting the liquid level Cao et al. (2014). A cryogenic system containing three independent cold heads is constantly delivering cooling power (580 W at maximum) to liquefy xenon Zhao et al. (2021). The xenon is being continuously purified by two hot metal getters manufactured by 111SAES Pure Gas. https://www.entegris.com/shop/en/USD/Products/Gas-Filtration-and-Purification/Gas-Purifiers/c/gaspurifiers, 2021 (accessed November 30, 2021)., through two separate circulation loops with stable flow rates of about 80 and 30 standard-liter-per-minute (slpm), respectively. Purified xenon gas is driven by diaphragm pumps into two heat exchangers located close to the detector. Inside the heat exchangers, purified gas is cooled and liquefied by liquid xenon extracted from the detector.
The sensitive target is a cylindrical dual phase xenon TPC confined by 24 highly reflective polytetrafluoroethylene (PTFE) wall panels, with an opposite-panel distance of 1185 mm (room temperature). The electrical fields in the TPC are defined by, from the bottom to the top, a cathode grid, a gate mesh, and an anode mesh, with a separation of 1185 mm and 10 mm in between. The liquid level is set in between the gate and anode by the top opening of the overflow tube, which is adjustable externally via a motion feedthrough. Under an electrical field, the average gas gap is 3.5 mm from the anode, and the relative distortion between the gate and anode, primarily due to electrostatic attraction, is less than 0.4 mm. A total of 169 and 199 of Hamamatsu R11410-23 three-inch photomultipliers (PMTs) are located at the top and bottom of the TPC, respectively, with grounded screening meshes 6 mm away from the PMT surfaces. During the operation, nine R11410-23 PMTs were turned off due to connection or base problems, and four PMTs were turned off due to excessive noise. The average dark rate for the remaining PMTs is about 100 Hz per channel. The prompt scintillation photons (), and delayed electroluminescence photons (, proportional to the number of ionized electrons extracted into the gaseous region) are measured by the top and bottom PMT arrays. This allows, for a given event, a three-dimensional vertex reconstruction to a subcentimeter precision. The outside wall of the field cage is about 70 mm from the inner cryostat, to leave enough space for the cathode feedthrough. Two rings of Hamamatsu R8520 one-inch PMTs (105 in total) are instrumented in this gap facing upward and downward, respectively, serving as the background veto. The PMT gains are calibrated, once per week, by four external blue light-emitting diodes with photons transmitted into the detector via optical fibers. The average gains of the PMTs are for R11410-23 and for R8520. The PMT pulses are amplified by low-noise linear amplifiers with a gain of 1.5 and 5 for R11410-23 and R8520 PMTs, respectively, and then digitized by the CAEN V1725B digitizers with 0.122 mV per analog-to-digital-convertor(ADC) bit and a sampling rate of samples per second 222see https://www.caen.it/products/v1725/.. The digitizers are operated under the self-trigger mode, so if any pulse is above a predefined threshold corresponding to about 1/3 of a photoelectron (PE), the entire waveform is read out Zheng et al. (2020); Yang et al. (2021). The readout efficiency for a single PE is measured for each channel, with an average value of 96%. The data are read out through optical fibers and directly stored onto the disk. Physical events are reconstructed via an off-line software 333X. Chen , in preparation..
An off-line krypton distillation was carried out on all 5.6 tonne of xenon using a newly constructed distillation tower at CJPL Cui et al. (2021). The detector was then filled, and after basic functionality checks, the water shield was filled with ultrapure water which has electrical resistivity of about 18 MOhmscm and concentration of uranium and thorium less than 0.1 ppt. The commissioning run of PandaX-4T commenced on November 28, 2020 and ended on Aprile 16, 2021, including 95.0 calendar days of stable data taking. In this period, the diaphragms of the circulation pumps were worn out two times, each time causing degradation in electron drifting, but with no trace of radioactive impurity introduced. The cathode and gate voltages were set at several different values to avoid excessive discharges, separating the data into several sets. The liquid level was adjusted between sets 2 and 3. During set 4, the online krypton distillation was kept on with a flow rate of 10 slpm. The detailed run configurations can be found in Table 1.
| Set | 1 | 2 | 3 | 4 | 5 |
| Duration (days) | 1.95 | 13.25 | 5.53 | 35.58 | 36.51 |
| (s) | 800.4 | 939.2 | 833.6 | 1121.5 | 1288.2 |
| (s) | 800 | 810 | 817 | 841 | 841 |
| (kV) | 20 | 18.6 | 18 | 16 | 16 |
| (kV) | 4.9 | 4.9 | 5 | 5 | 5 |
| PDE (%) | 9.00.2 | 9.00.2 | |||
| EEE (%) | 90.25.4 | 92.65.4 | |||
| (PE/) | 3.80.1 | 4.60.1 | |||
The data processing follows a similar procedure as in the previous PandaX analysis Wang et al. (2020a). Hits with amplitudes larger than 20 ADC (2.44 mV) are identified from the waveform of individual channels. Signals are defined as clusters of hits with a tail-to-head gap no greater than 15 samples (60 ns), corresponding to an approximate 104 ns peak-to-peak separation between hits, and a coincidence requirement that at least two different PMTs receive hits. The inefficiency of such clustering gap requirement is validated to be negligible using data-driven approaches. Other unphysical noises are identified by anomalous shapes or charge distribution pattern. Signals are then classified into -like and -like according to number of hits, the charge ratio between the top and bottom arrays, and width of the waveform enclosing cumulative charge (). -like signals are reclustered by taking into account the diffusion effect during the drift. The inefficiency of tagging is verified to be negligible. -like and -like signals within a window of 1 ms are further combined into an event.
Three classes of data quality cuts are developed based on the calibration data (see later) and on our practice in previous generations of PandaX, to remove noise and unphysical events. (i) A set of “waveform cleanliness” cuts is applied to avoid having too much noise or too many single-electron s within an event. (ii) For s, to avoid confusions with single-electron s, the number of peaks in a summed waveform is required to be no more than four, and the top-bottom charge ratio should be consistent with the location of the interaction. Another cut is applied on the charge distribution to suppress abnormal charge caused by PMT after pulsing. (iii) For s, cuts are applied to their waveform shapes, top-bottom charge ratio, the root-mean-square (rms) of the charge distribution on the top PMTs, and the quality of horizontal position reconstruction. An -dependent cut on drift time vs. is made, which is important to suppress the accidental background. Unless otherwise specified, a good event should have only one pair of and .
The position of an event is reconstructed using the charge pattern on the top PMT array (horizontal) and the drift time (vertical) assuming a constant drift velocity. Two independent horizontal reconstruction methods have been developed, the template matching method (TM) and the photon acceptance function method (PAF) Zhang et al. (2021a). Only the first half of the charge in is used in the reconstruction, leading to a better position resolution in comparison to that using the total charge. The position uncertainty in the vertical direction is conservatively estimated to be 3 mm, based on the width of the . In the horizontal plane, the reconstruction uncertainty depends on the charge of , and is estimated to be 8.2 mm (100 PE) and 3.0 mm (1000 PE) based on the comparison between the two methods, cross-checked with the sigma of the radial distribution of the surface events from the PTFE wall.
The uniformity of detector responses is calibrated using internal diffusive sources. To avoid PMT saturations, the bottom-only () is used. The vertical uniformity of , characterized by the electron lifetime , is calibrated using the 164 keV deexcitation peak from 131mXe (produced by neutron irradiation), which is found consistent with that obtained from radon alpha peaks. The average in each run set is summarized in Table 1. The three-dimensional uniformity of and the horizontal uniformity of are calibrated by injecting 83mKr (41.5 keV) into the detector via one of the circulation loops Zhang et al. (2021b). This calibration was carried out twice, at the beginning and completion of the commissioning data taking, with about 100,000 events collected. In the fiducial volume (FV, defined later), the rms variation in and horizontal responses is 19% and 15%, respectively.
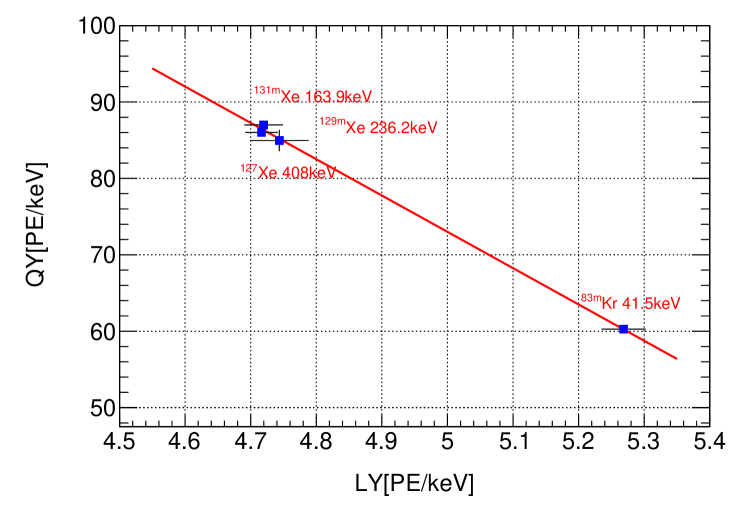
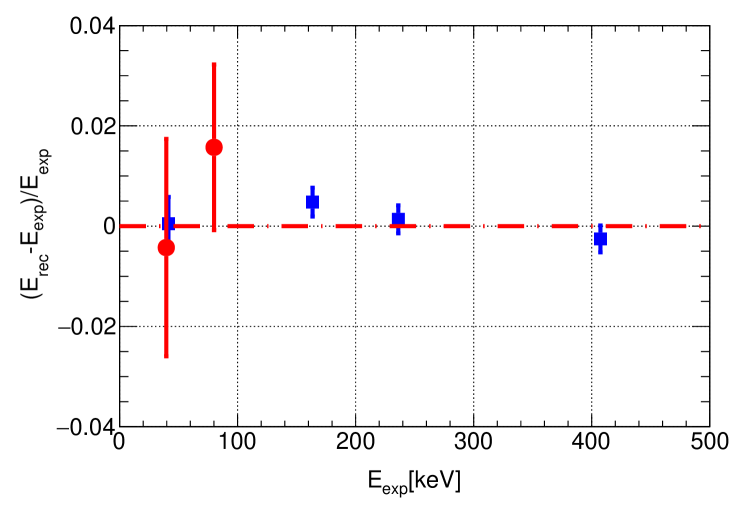
The electron-equivalent energy of a given event can be reconstructed as Szydagis et al. (2011)
| (1) |
in which PDE, EEE, and SEGb are the photon detection efficiency for , electron extraction efficiency, and the single-electron gain using , respectively, and 13.7 eV is the work function in LXe. The value of SEGb is measured by selecting the smallest , with an enlarged 50-sample clustering gap requirement. The rms of the SEGb in the FV is 8%. The PDE and EEE are fitted according to Eq. 1 using the following electron recoil (ER) peaks, 131mXe (164 keV), 129mXe (236 keV), 127Xe (408 keV), and 83mKr (41.5 keV). The PDE, EEE, and SEGb in different datasets are summarized in Table 1.
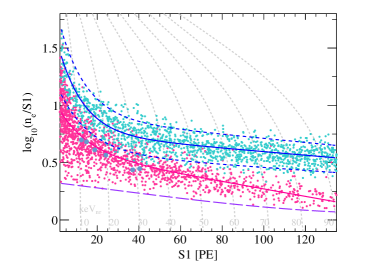
The low energy calibration is carried out after set 5. The ER response is calibrated by injecting 220Rn into the detector. The 220Rn is produced by a foil 228Th source with an expected 220Rn emanation rate of 240 Bq. The 220Rn rate observed in the detector is about 1.7 Bq. In total, 1393 low-energy single-scatter ER events are collected within an range from 2 to 135 PE in the FV. The distribution of the ER calibration events in vs can be found in Fig. 6, where is defined as .
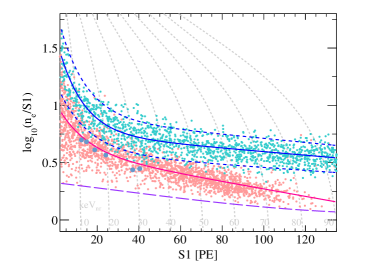
The NR response is calibrated with two different neutron sources. The 241Am-Be source is deployed through three external horizontal tubes outside the inner cryostat at three different heights of the TPC. The deuteron-deuteron (D-D) neutrons are collimated horizontally via a beam pipe intruded into the water tank pointing to the center of the TPC. The distribution of the single-scatter D-D NR events is overlaid in Fig. 6.
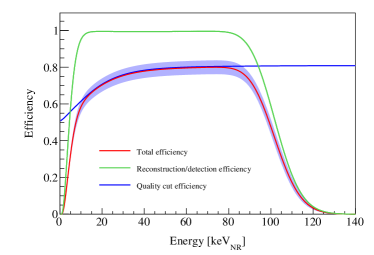
Since the data selection is made in and , the total efficiency as a function of energy includes two major components, the signal reconstruction and detection efficiency, and the data quality cut efficiency. The signal reconstruction and detection efficiency is the ability for the readout and off-line software to correctly identify a true /, including the readout threshold (so-called BLS nonlinearity in Ref. Wang et al. (2020a)), signal clustering efficiency (15-sample), and the / classification efficiency, all determined using data-driven methods. It also takes into account the event loss due to the requirements on number of hits (), and selection ranges of and , determined using the signal model simulation. The efficiency of the data quality cuts is determined using the calibration data by taking the calibration events within the quantiles in Fig. 6, and calculating the ratio of number of events with all cuts applied and that with all-but-this cut for the three classes of cuts described above. The efficiencies separately determined from 220Rn, AmBe, and D-D calibration data are all consistent. The total efficiency vs. nuclear recoil energy is shown in Fig. 12.
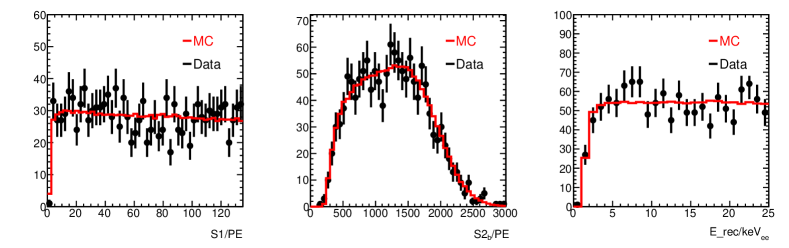
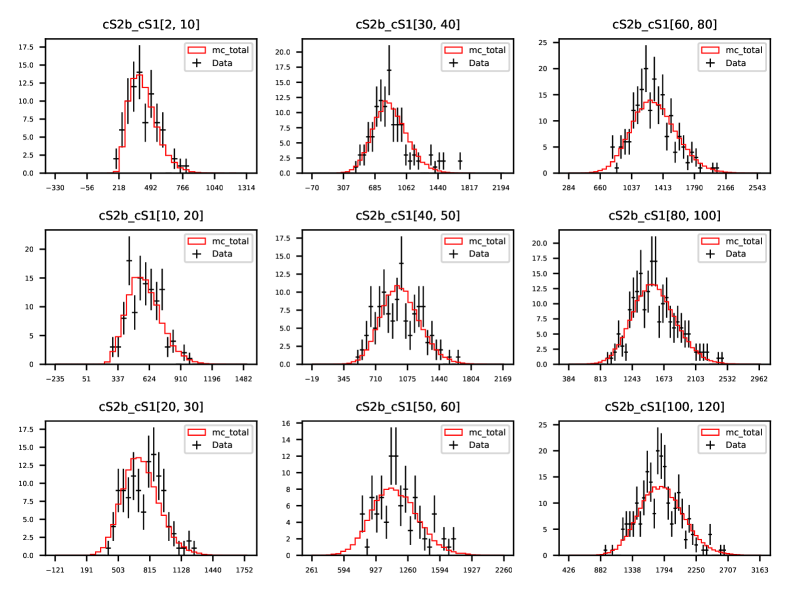
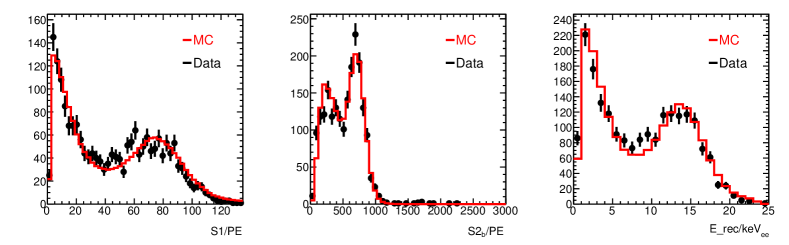
A standard unbinned likelihood function is defined to perform a simultaneous fit of ER and NR response models based on the calibration data (220Rn, 241Am-Be, and D-D) in (, ), with fast detector simulation including the following effects: photon detection, electron drifting, diffusion, extraction and amplification, nonuniformities of and , and detection efficiencies Yan et al. (2021); Aprile et al. (2019). The ER and NR response models follow the standard NEST 2.0 construction Szydagis et al. (2018, 2021), with the light yield, charge yield, and recombination parameters fitted. The likelihood function is minimized via Markov chain Monte Carlo Foreman-Mackey et al. (2013), with fast detector simulation Yan et al. (2021); Aprile et al. (2019) boosted on GPUs. The best fit parameters are consistent with their nominal values in NEST 2.0. The NR models obtained with AmBe or D-D data only are also in good agreement. Binned-log-likelihood goodness-of-fit tests were made, with a resulting -value of 0.38 and 0.78 for the ER and NR calibration data, respectively. For sets 1-3, due to small differences in drift field in comparison to sets 4 and 5, the response model of sets 1-3 is extrapolated from that of sets 4 and 5 in accordance with the field dependence of light and charge yields in NEST 2.0 Szydagis et al. (2018, 2021), from which a less-than-1% difference in the light yield is predicted. The same value of PDE is used for sets 1-3, but SEGb and EEE (scaled from in situ ER peaks) are separately determined.
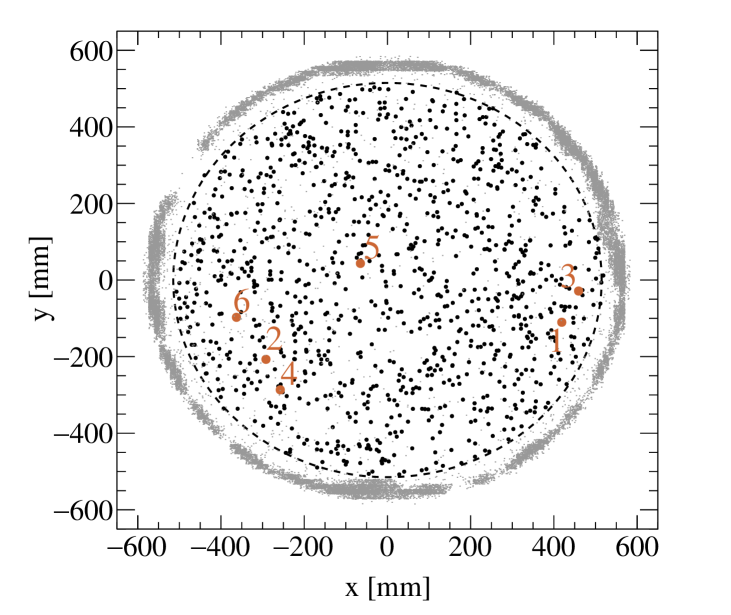
Aside from detector or data acquisition downtime, to eliminate stray electrons due to a previous energetic interaction, candidate events have to be separated by 22 ms from a previous event so that the contamination from leftover pulses can be neglected. This inserts a well-controlled deadtime of approximately 7.3%. Data with abnormal isolated rate, indicating excessive discharges from the electrodes and PMTs, are also removed from the analysis, reducing the live time by about 2.3%. The resulting live time is 86.0-day. The dark matter candidates are selected using the following cut criteria. The ranges of and are and PE, respectively. The veto PMT is required to see no coincidental photons during an . The events are also required to be above the 99.5% NR quantile (see Fig. 6). The FV mass of about 2.67 tonne (with an uncertainty of 1.7%), indicated in Fig. 3(b), is determined based on the expected background distributions to optimize the sensitivity, with the material background from simulation, the internal contamination from data-driven estimate, and neutron background from a combined data-driven (rate) and simulation (vertex distribution) estimate.
The following major background components are considered in the dark matter analysis, with their rates summarized in Table 2.
| Set 1 | Set 2 | Set 3 | Set 4 | Set 5 | Total | Below NR median | Best fit | ||
| Rn | 6.93.8 | 42.823.5 | 22.712.5 | 162.088.9 | 112.161.5 | 346.5190.2 | 1.420.78 | - | |
| Kr | 1.10.7 | 7.74.9 | 3.22.1 | 20.413.1 | 20.913.4 | 53.334.2 | 0.210.13 | - | |
| Material | 0.80.1 | 5.70.7 | 2.40.4 | 15.21.9 | 15.61.9 | 39.75.0 | 0.160.02 | - | |
| Solar | 0.80.2 | 5.41.1 | 2.30.5 | 14.32.9 | 14.62.9 | 37.47.5 | 0.160.03 | - | |
| 136Xe | 0.70.1 | 4.60.9 | 1.90.4 | 11.82.4 | 12.12.4 | 31.16.2 | 0.050.01 | - | |
| Flat ER (data) | 4.02.9 | 54.510.5 | 12.24.9 | 240.521.8 | 180.918.9 | 492.131.2 | 2.060.14 | 509.622.8 | |
| CH3T | 175 | 8811 | 216 | 25824 | 14817 | 53232 | 5.10.3 | 53232 | |
| 127Xe | 0.190.04 | 1.080.25 | 0.960.22 | 3.990.92 | 1.910.44 | 8.131.07 | 0.120.02 | 8.412.08 | |
| Neutron | 0.020.01 | 0.150.08 | 0.070.03 | 0.450.22 | 0.460.23 | 1.150.57 | 0.690.35 | 0.820.41 | |
| 8B | 0.010.01 | 0.050.03 | 0.030.02 | 0.260.13 | 0.290.15 | 0.640.32 | 0.620.31 | 0.610.17 | |
| Surface | 0.010.01 | 0.070.02 | 0.030.01 | 0.180.05 | 0.180.05 | 0.470.13 | 0.420.12 | 0.440.11 | |
| Accidental | 0.040.01 | 0.320.05 | 0.030.01 | 0.990.18 | 1.050.21 | 2.430.47 | 0.800.15 | 2.310.45 | |
| Sum | 216 | 14415 | 348 | 50432 | 33325 | 103745 | 9.80.6 | 105439 | |
| Data | 21 | 148 | 34 | 496 | 359 | 1058 | 6 |
The detector materials have been assayed by the high-purity germanium detector, and the background due to material radioactivity is dominated by the PMTs and the stainless steel vessels Zhang et al. (2019). The energy and position distribution of the high-energy gammas in the data are consistent with expectations from simulation, and the integrated rates above 1 MeV agree within 14%. The expected contribution to background in the dark matter window is events.
The radon background rate is measured in situ using alpha events. The decay of 222Rn is Bq/kg during sets 1, 2, 3, and 5, and Bq/kg during set 4 (increased due to radon emanation from the distillation tower during the online krypton distillation), and that from 220Rn is Bq/kg. The expected low-energy radon background is dominated by 214Pb s (decay lifetime 39 min), which is not equally populated as their ancestors in the TPC as positive ions tend to drift toward and attach to the cathode Ma et al. (2020). Its contribution is determined by taking the difference of the low-energy rates between sets 4 and 5. The overall contribution to the dark matter background is events.
The 85Kr -decay background is estimated based on a correlated emission of - through the metastable state 85mRb (514 keV, 0.43%). Assuming a isotopic concentration of 85Kr Collon et al. (2004), a Kr/Xe ratio of ppt is found. The expected background is events.
ER background due to solar neutrinos is estimated assuming the standard solar model, three-neutrino-flavor oscillation and the standard model anomalous magnetic moment Billard et al. (2014). 136Xe two-neutrino beta decay is computed using the lifetime from Ref. Albert et al. (2014). The backgrounds from radon, krypton, detector materials, solar neutrino and 136Xe are combined into a “flat ER (data)” background in Table 2, independently derived from data within the energy range from 18 to 30 keV, and applied in the final dark matter fit.
Some number of tritium events are identified in the data. The origin is likely due to some leftover tritium from PandaX-II end-of-run calibration Zhou et al. (2021). The event rate is allowed to float independently for each set, with a total fitted events in the FV and an average concentration of mol/mol in xenon. The temporal variation in the data (Table 2), particularly in between sets 4 and 5, indicates that gas circulation through hot getters may slowly reduce its concentration.
Some cosmogenically activated 127Xe is also identified in the data, which decays through electron captures. The background due to -shell captures (5.2 keV) is estimated based on the measured -shell captures in the FV (33.2 keV) and their expected ratio () to be events. Its decay (mean lifetime 52.5 days) is considered set by set in the final fit.
The long-lived progenies of radon attached onto the PTFE surface also contribute to the background, for example, through 210Pb decays. These events have a much suppressed signal, likely due to the loss of electrons on the PTFE surface during the drift. The radial distributions of these events in different bins are obtained using 210Po surface events, tagged by S1s peaking around 30000 PE (5.3 MeV). The expected distribution in and and the rate normalization is obtained using events reconstructed outside the PTFE wall but otherwise within the dark matter selection. The residual background in the FV is events.
The neutron background in the data is estimated using three methods. The first method is described in Ref. Zhang et al. (2019), but with updated radioactivities, selection efficiency and veto efficiency. The second method uses the single-scatter to multiscatter ratio of NR events. The third method follows the procedure in Ref. Wang et al. (2020b), with a predicted ratio between the single-scatter NR and high-energy neutron capture gammas. The residual neutron background in the dark matter data is events.
8B neutrinos from the Sun can make coherent neutrino-nucleus scattering with xenon nucleus Ruppin et al. (2014). This background is estimated to be 0.60.3 events.

The accidental background due to randomly paired and is studied by first identifying isolated and events, with a rate of 9.5 Hz () and 0.0045 Hz () and a standard deviation of 10.5% () and 12.7% (), derived based on rates at different data-taking periods. The isolated s and s are randomly assembled in time, with selection cuts applied afterward. The remaining background in the dark matter sample is events, consistent with that obtained by selecting s and s from the data with a time separation beyond the maximum drift time.
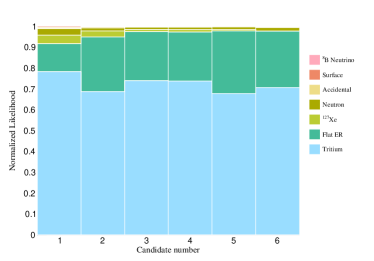
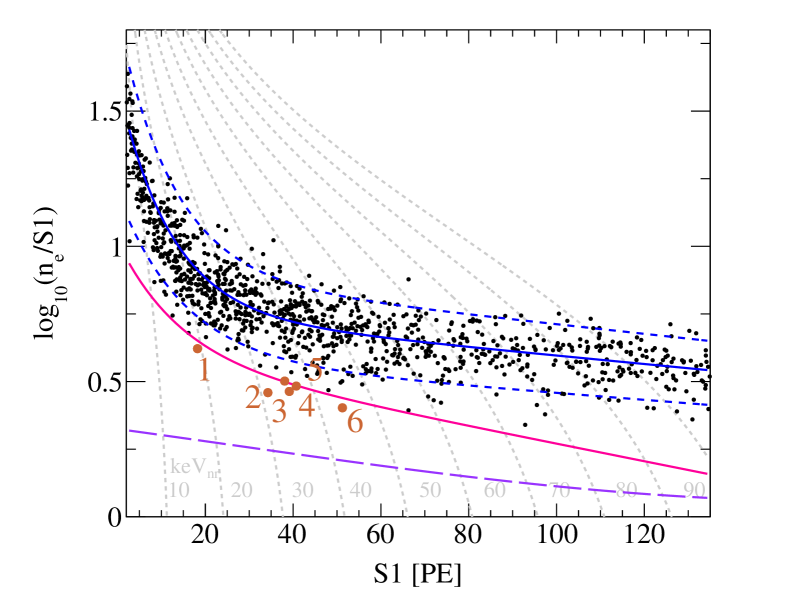
Within the FV and dark matter selection window, 1058 final candidate events are identified. To take into account the difference in EEE and SEGb between sets 1-2 and 3-5, we define ; thereby, the distribution of all events in vs. is shown in Fig. 3(a). Six events are identified below the NR median curve. Candidates are uniformly distributed in the FV, with position distributions in vs. and vs. displayed in Figs. 3(b) and 3(c).
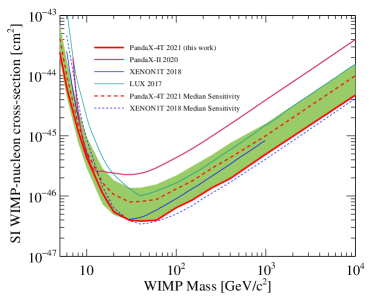
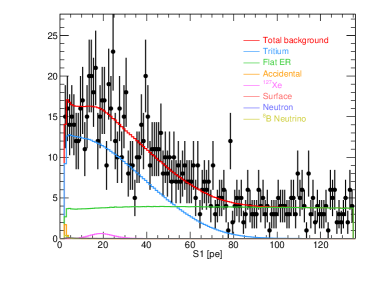
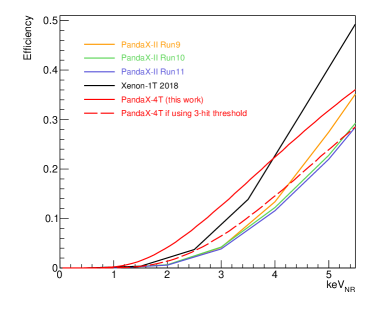
Dark matter signals are searched in our data using a profile likelihood ratio (PLR) approach with a double-sided statistic construction Baxter et al. (2021). At each dark matter mass and its spin-independent (SI) elastic cross section with the nucleon , the NR rate and spectrum of the signal is computed using the recipe in Ref. Baxter et al. (2021). The probability density functions (PDFs) of the background and dark matter signals are both produced in and using the aforementioned response models. A standard unbinned likelihood function is constructed Wang et al. (2020a), with Gaussian penalty terms defined according to the uncertainty of the parameters in the response models and rates of individual background (Table 2). For our background-only fit, the goodness-of-fit -value is 0.71. PLR scans are made on grids of (, ). No clear excess over background is observed. In Fig. 4, the 90% C.L. upper limit of SI cross section from our data is shown, together with sensitivity band obtained from background-only pseudo data, as well as limits from previous experiments Akerib et al. (2017); Aprile et al. (2018); Wang et al. (2020a). Our median sensitivity has improved from the PandaX-II final analysis Wang et al. (2020a) by 2.6 times at of 40 GeV/. Our limit is within the sensitivity band for below 25 GeV/, and goes slightly beyond until about 250 GeV/, indicating a downward fluctuation of the background. The limit is, therefore, conservatively power-constrained to Cowan et al. (2011). In comparison to XENON1T’s final result, for below 20 GeV/, our median sensitivity and exclusion limit are both stronger, which is primarily driven by our higher efficiency below 4 keVnr, attributed to the two-hit coincidence requirement. On the other hand, our median sensitivity is weaker than XENON1T for beyond 20 GeV/, approaching a factor of 2.5 times or so for high-mass dark matter (DM). This is expected from the exposure (0.63 tonne-year vs. 1 tonne-year), efficiency difference at high recoil energy, and our higher background level due to tritium contamination. More information can be found in the supplemental material. Our new limit represents the most stringent constraint to DM-nucleon SI interactions, with the lowest excluded cross section value of cm2 at of 40 GeV/c2.
In summary, we report the dark matter search results using the commissioning data from PandaX-4T, with a live exposure of 0.63 tonneyear. No dark matter candidates are identified above expected background. The strongest upper limit to date is set on the dark matter-nucleon spin-independent interactions, with the lowest excluded value of cm2 at 40 GeV/c2. PandaX-4T is undertaking a tritium removal campaign, after which normal physics data taking will start. The dark matter search sensitivity is expected to improve by another order of magnitude with a 6-tonneyear exposure.
This project is supported in part by a grant from the Ministry of Science and Technology of China (No. 2016YFA0400301), grants from National Science Foundation of China (Nos. 12090060, 12005131, 11905128, 11925502, 11775141), and by Office of Science and Technology, Shanghai Municipal Government (grant No. 18JC1410200). We thank supports from Double First Class Plan of the Shanghai Jiao Tong University. We also thank the sponsorship from the Chinese Academy of Sciences Center for Excellence in Particle Physics (CCEPP), Hongwen Foundation in Hong Kong, and Tencent Foundation in China. Finally, we thank the CJPL administration and the Yalong River Hydropower Development Company Ltd. for indispensable logistical support and other help.
References
- Bertone et al. (2005) G. Bertone, D. Hooper, and J. Silk, Physics Reports 405, 279 (2005).
- Liu et al. (2017) J. Liu, X. Chen, and X. Ji, Nature Phys. 13, 212 (2017).
- Conrad and Reimer (2017) J. Conrad and O. Reimer, Nature Physics 13, 224 (2017).
- Buchmueller et al. (2017) O. Buchmueller, C. Doglioni, and L.-T. Wang, Nature Physics 13, 217 (2017).
- Billard et al. (2021) J. Billard et al., (2021), arXiv:2104.07634 [hep-ex] .
- Akerib et al. (2017) D. Akerib et al. (LUX), Phys. Rev. Lett. 118, 021303 (2017).
- Cui et al. (2017) X. Cui et al. (PandaX), Phys. Rev. Lett. 119, 181302 (2017).
- Aprile et al. (2018) E. Aprile et al. (XENON), Phys. Rev. Lett. 121, 111302 (2018).
- Wang et al. (2020a) Q. Wang et al. (PandaX), Chin. Phys. C 44, 125001 (2020a).
- Zhang et al. (2019) H. Zhang et al. (PandaX), Sci. China Phys. Mech. Astron. 62, 31011 (2019).
- Mount et al. (2017) B. J. Mount et al., (2017), arXiv:1703.09144 [physics.ins-det] .
- Aprile et al. (2020) E. Aprile et al. (XENON), JCAP 11, 031 (2020).
- Kang et al. (2010) K. J. Kang et al., J. Phys. Conf. Ser. 203, 012028 (2010).
- Li et al. (2015) J. Li, X. Ji, W. Haxton, and J. S. Y. Wang, Phys. Procedia 61, 576 (2015).
- Zhang et al. (2016) T. Zhang et al., JINST 11, T09004 (2016).
- Cao et al. (2014) X. Cao et al., Science China Physics, Mechanics & Astronomy 57, 1476 (2014).
- Zhao et al. (2021) L. Zhao et al., JINST 16, T06007 (2021).
- Note (1) SAES Pure Gas. %****␣pandax4t_wimp.bbl␣Line␣200␣****https://www.entegris.com/shop/en/USD/Products/Gas-Filtration-and-Purification/Gas-Purifiers/c/gaspurifiers, 2021 (accessed November 30, 2021).
- Note (2) See https://www.caen.it/products/v1725/.
- Zheng et al. (2020) Q. Zheng et al., JINST 15, T12006 (2020).
- Yang et al. (2021) J. Yang et al., (2021), arXiv:2108.03433 [physics.ins-det] .
- Note (3) X. Chen , in preparation.
- Cui et al. (2021) X. Cui et al., JINST 16, P07046 (2021).
- Zhang et al. (2021a) D. Zhang et al., (2021a), arXiv:2106.08380 [physics.ins-det] .
- Zhang et al. (2021b) D. Zhang et al., (2021b), arXiv:2102.02490 [nucl-ex] .
- Szydagis et al. (2011) M. Szydagis et al., JINST 6, P10002 (2011).
- Yan et al. (2021) B. Yan et al. (PandaX), Chin. Phys. C 45, 075001 (2021).
- Aprile et al. (2019) E. Aprile et al. (XENON), Phys. Rev. D 99, 112009 (2019).
- Szydagis et al. (2018) M. Szydagis et al., “Noble Element Simulation Technique v2.0, https://doi.org/10.5281/zenodo.1314669,” (2018).
- Szydagis et al. (2021) M. Szydagis et al., Instruments 5, 13 (2021).
- Foreman-Mackey et al. (2013) D. Foreman-Mackey, D. W. Hogg, D. Lang, and J. Goodman, PASP 125, 306 (2013).
- Ma et al. (2020) W. Ma et al., JINST 15, P12038 (2020).
- Collon et al. (2004) P. Collon, W. Kutschera, and Z.-T. Lu, Ann. Rev. Nucl. Part. Sci. 54, 39 (2004).
- Billard et al. (2014) J. Billard, L. Strigari, and E. Figueroa-Feliciano, Phys. Rev. D 89, 023524 (2014).
- Albert et al. (2014) J. B. Albert et al. (EXO-200), Phys. Rev. C 89, 015502 (2014).
- Zhou et al. (2021) X. Zhou et al. (PandaX), Chin. Phys. Lett. 38, 011301 (2021).
- Wang et al. (2020b) Q. Wang et al. (PandaX), Sci. China Phys. Mech. Astron. 63, 231011 (2020b).
- Ruppin et al. (2014) F. Ruppin, J. Billard, E. Figueroa-Feliciano, and L. Strigari, Phys. Rev. D 90, 083510 (2014).
- Baxter et al. (2021) D. Baxter et al., Eur. Phys. J. C 81, 907 (2021).
- Cowan et al. (2011) G. Cowan, K. Cranmer, E. Gross, and O. Vitells, (2011), arXiv:1105.3166 [physics.data-an] .
I Appendix