Jarvis for Aeroengine Analytics: A Speech Enhanced Virtual Reality Demonstrator Based on Mining Knowledge Databases
Abstract
In this paper, we present a Virtual Reality (VR) based environment where the engineer interacts with incoming data from a fleet of aeroengines. This data takes the form of 3D computer-aided design (CAD) engine models coupled with characteristic plots for the subsystems of each engine. Both the plots and models can be interacted with and manipulated using speech or gestural input. The characteristic data is ported to a knowledge-based system underpinned by a knowledge-graph storing complex domain knowledge. This permits the system to respond to queries about the current state and health of each aeroengine asset. Responses to these questions require some degree of analysis, which is handled by a semantic knowledge representation layer managing information on aeroengine subsystems. This paper represents a significant step forward for aeroengine analysis in a bespoke VR environment and brings us a step closer to a Jarvis-like system for aeroengine analytics.
1 INTRODUCTION
Our work presented in this paper has been inspired by the popular culture, specifically by well-known science-fiction novels and movie franchises. In these movies, the protagonists, are seen visualizing data, drawing inference and making decisions based on interactions with the some sort of artificial intelligence (AI) assistant, such as Jarvis. The ability to query such an assistant—particularly for quantitative insights—is appealing and can potentially reduce engineering-hours with the promise of more efficient and analytically-grounded decisions.
In this paper we develop a bespoke 3D interface-based [2] immersive virtual reality environment, where the engineer interacts with incoming data from a fleet of aeroengines [3]. This data is ported to a knowledge-based system underpinned by a knowledge graph that stores complex turbomachinery-specific domain knowledge. This system is capable of responding to queries such as, “What is the pressure ratio of the intermediate pressure compressor for Engine A?” or, “Where is the engine with the highest average efficiency of fleet B currently?,” or, “Compute the average pressure ratio after 100 hours of flying time for component C in Engine D”. Responses to these questions not only involve access to data but also require some degree of analysis. Our knowledge-based system is able to handle such queries. Further, a degree of flexibility is embedded that permits the user to construct queries from a broader lexicon. The key idea is that we have leverage over more contemporary deep-learning based systems, because our subject matter is very specific and the number of topics limited.
The knowledge-based system described here provides a semantic knowledge representation layer for capturing information. This knowledge is used for dynamic hinting during design and visualization. The representation mechanism uses a triple-set representation (subject-predicate-object) using the RDF (Resource Description Framework) language [4]. A set of triples creates a (directed) knowledge graph, where subject and object are nodes and predicate describes an edge. In such a graph, automatic reasoning is used to infer new knowledge that is derived from existing knowledge, or to verify the aptness of the knowledge base. Knowledge in the knowledge graph can be accessed using an SQL-like language called SPARQL [5]. Voice-to-SPARQL translation is a very complex task. However, owing to the fact that the system has a very limited scope, we can provide an interface based on a set of interaction templates. This approach is more reliable than a generic voice recognition system while still allowing a natural way of interaction from the user’s point of view. There have been some prior attempts to utilize voice-operated interfaces, or particular parts of it, such as speech recognition, natural language processing (NLP) or speech synthesis in the aerospace domain, see, for instance, [6, 7, 8, 9, 10].
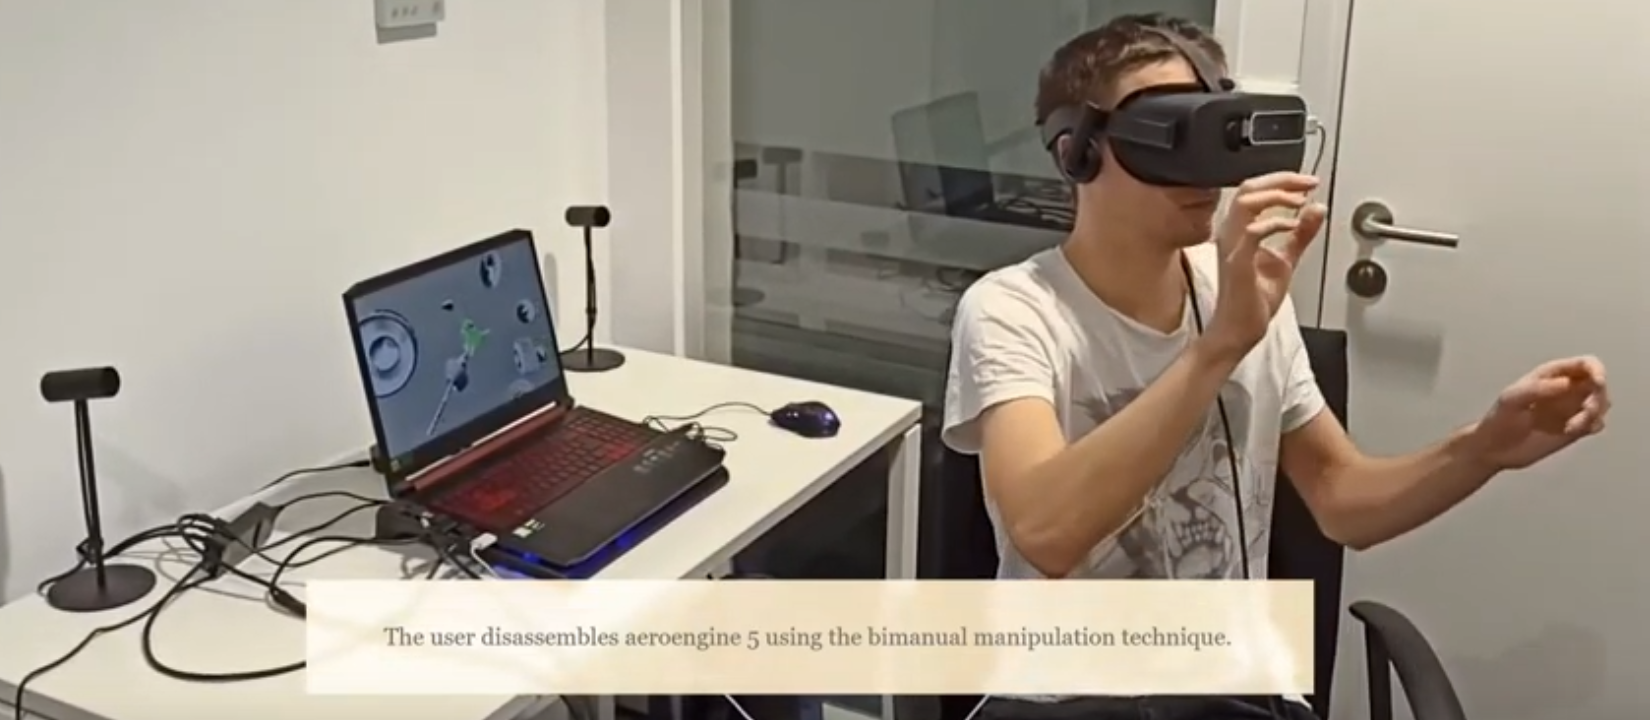
This paper represents one of the first forays of aeroengine analysis in a bespoke VR environment and brings us a step closer to a voice-operated assistant for aeroengine analytics. A description of an earlier, non-voice operated version of this system is provided in Tadeja et al. [3, 11]. The snapshot from the video-clip222https://youtu.be/TmjmRD8YJYI showcasing our work, as seen in Fig. 1, is available online [1].
2 VIRTUAL REALITY FOR AERONAUTICS AND ASTRONAUTICS
Some of the earliest examples of how to exploit 3D interfaces within the aerospace domain can be traced back to Hale [12] and Mizell [13]. In both cases, the authors lay the groundwork for research concerning the utility of applying VR in design.
García-Hernandez et al. [14] identify three related areas in which the usage of VR holds the most promise: (i) the extraction of information from coupling multiple 2D data into 3D-like structures; (ii) visualization of perplexed, non-planar graphs (for a survey of graph visualization techniques see Herman et al. [15]); and (iii) the 3D version of the parallel coordinates plots (PCP) [16]. Examples of VR-based immersive parallel coordinates plots (IPCP) used to visualize datasets from aerodynamic design case studies can be found in Tadeja et al. [17] and Tadeja et al. [18]. Further, García-Hernandez et al. [14] recognize a number of areas of VR which currently are, or have the potential, to be successfully exploited, including spacecraft optimal path analysis [19]; exoplanet research [20]; mission planning; launch/abort decision making [21], space debris, asteroid and near earth object (NEO) orbit analysis [22]; citizen science [23] in aerospace; and spacecraft design optimization [24] as well as aerodynamic design [25]. Other, not listed, include collaborative environments [26, 27]; haptic systems [28, 29]; aerospace simulation [30]; planetary exploration [31]; and management of aerospace telemetry and sensor data [31, 32, 33].
In particular, the latter application area is closely related to what we are trying to achieve with the help of our immersive system for aeroengine analytics in VR. For instance, Wright et al. [31] propose the idea of interlinking CAD models with sensor and telemetry data where a change in such a data stream would lead to an appropriate change in the CAD visualization as well. Both Russell et al. [32] and Lecakes et al. [33] present approaches for using VR environments for system diagnosis and health management for rocket engine tests.
3 SYSTEM ARCHITECTURE
In this section we present and discuss the overall system architecture of the Jarvis system by decomposing a function model using using FAST (Function Analysis Systems Technique) [34] and by analyzing signals between the main function structures. We also present a brief task analysis to distill the main tasks of the user interacting with the system.
3.1 Function Model
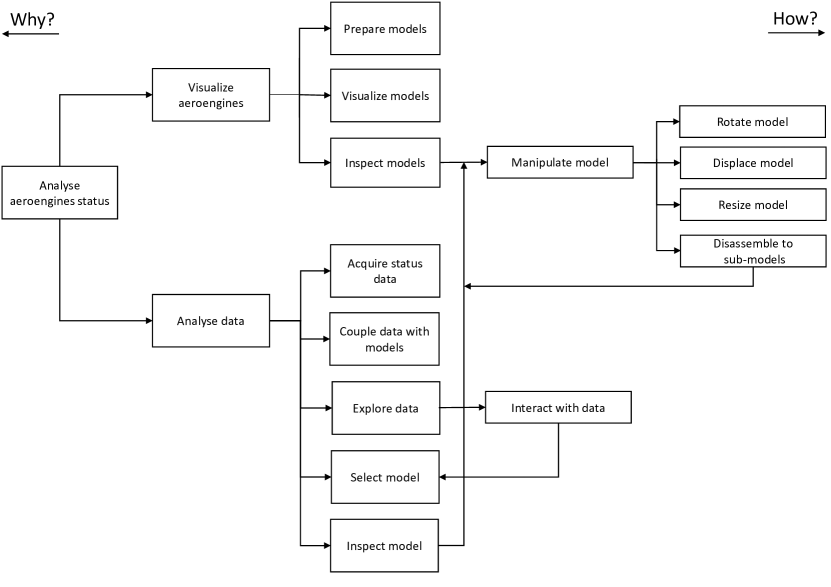
Fig. 2 shows a FAST-diagram decomposing the main functions of the Jarvis system. The FAST-diagram should be read from left-to-right going top-to-bottom. We use the FAST analysis to carry out a brief task analysis later in this section. The FAST-analysis is carried out at the functional level to avoid design fixation and does not make any explicit reference to solutions (function carriers).
3.2 System Model
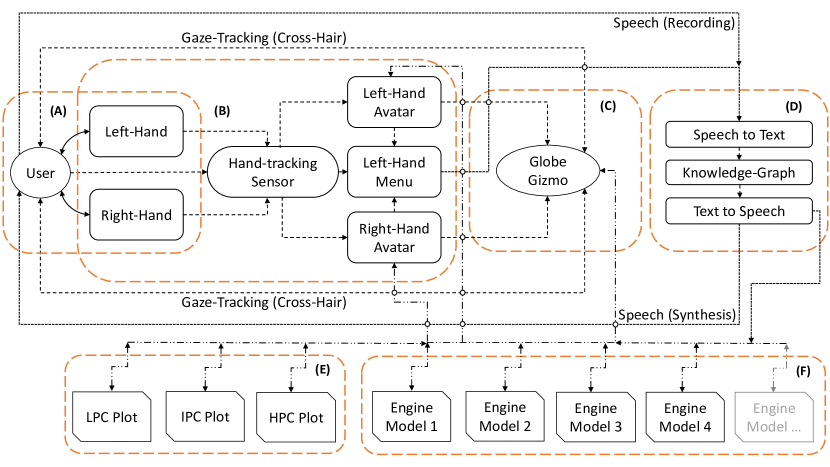
We study our Jarvis system model by analyzing signal flow. Here we pinpoint, list, analyze, and discuss all the uni- and bi-directional signals sent and received by the key components of our system. The signals flowing between various VR elements are shown in Fig. 3. The six key components are the following:
-
(A)
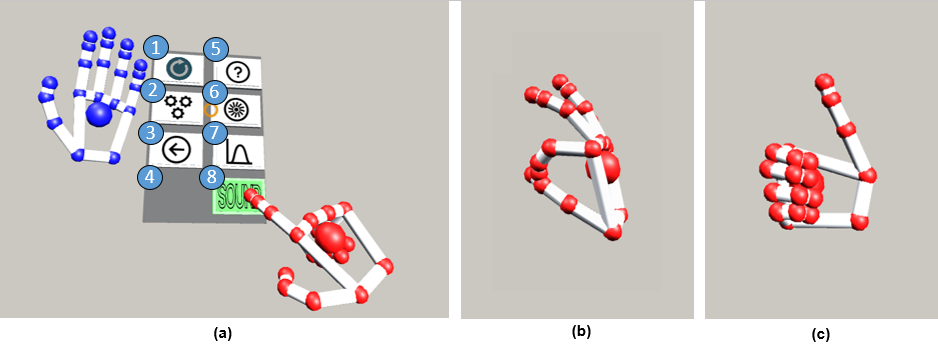
The user: The user interacts with the system using a range of paired methods. These are: (1) gaze-tracing & ray-tracing; (2) hand-tracking & gesture-recognition; and finally, (3) speech-recognition & speech-synthesis. All these pairs exhibit bi-directional signal flow as shown in Fig. 3. To approximate gaze-tracking we use a cross-hair placed at a fixed distance from the user’s gaze (see Fig. 4). From the center of the cross-hair we continuously extend rays invisible to the user. Whenever the cross-hair circles over an interactive object, the system recognizes this situation and the object is highlighted—indicating to the user that it can be interacted with. Direct manipulation of the objects is achievable with the user’s hands. The gestural input is facilitated with hand-tracking that communicates in real-time with the virtual hand representations, which are in turn signaling the hand’s current position and gesticulation to the user (see Fig. 7). This mechanism is discussed in more detail in the description of the hand-tracking component (item B). Finally, speech-recognition and speech-synthesis are supported via a microphone and speakers integrated in the headset and a range of external resources. This mechanism will also be described in more detail in the description of the speech component (item D).
-
(B)
The hand-tracking bundle: To interact with the Jarvis system the user is required to maintain their hands within the Leap Motion [36] hand-tracking sensor’s field of view. This tracking state is signaled to the user using the virtual representation of the user’s hands—the hands avatars (see Fig. 5 and Fig. 6(a)). The hand avatars with the visualized joints will instantaneously follow and emulate the user’s hand gestures, hence, the hand-tracking bundle is in a constant signal loop with the user. An articulated gesture will immediately influence the currently selected interactive object, allowing the user to release the handle over an object, or select and manipulate another object. Object selection and deselection is signaled to the user by manipulating the highlight state of objects.
-
(C)
The globe gizmo: The globe gizmo consist of three components: (1) the simplified globe model [37]; (2) a number of interactive 3D models of the airplanes [38] circling around the globe on predefined trajectories; and (3) the movement selector for the gizmo (a red sphere placed in a fixed position above the gizmo). All these elements can be seen in Fig. 5. Both the movement selector and the airplane models are interactive and respond to the user’s gaze tracking. Airplane models can be selected and highlighted in response to user actions over (E) the compressors characteristics, (F) the engine 3D models, or in response to (D) the user’s voice commands.
-
(D)
The speech bundle: The user interacts with the speech-bundle by pressing a button on the left-hand pop-up menu (see Fig. 7). Next, once the user has formulated a query and spoken it, the acoustic signal is decoded into text and fed to the the knowledge graph. The outcome of a query processed within the knowledge-graph is signaled to the user using a text-to-speech service. If appropriate, this outcome may also be signaled using an automatic selection of an appropriate (F) aeroengine model, as well as (C) an airplane model on the globe gizmo, and/or (E) a marker on one of the compressors characteristics. Further, if the speech-to-text translation fails this event is also signaled to the user with a voice message.
-
(E)
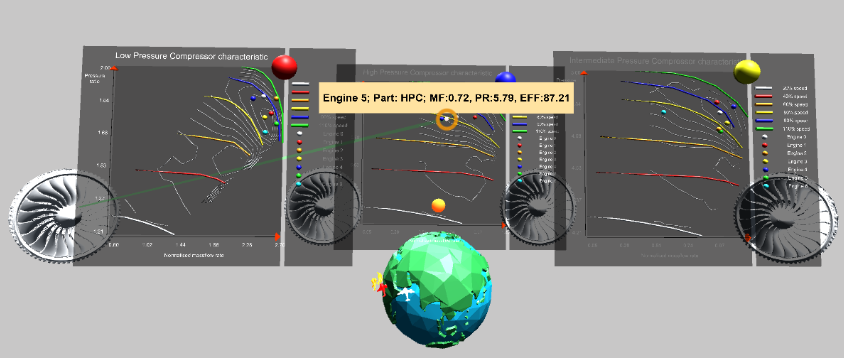
The compressors characteristics plots: The compressor characteristics plots are constructed using three elements: (1) interactive movement selectors in the form of large spherical markers in the top-right corner; (2) color-coded static contour lines representing constant speed lines; and (3) interactive small spherical markers representing operating points for each engine. All these elements can be seen in Fig. 4.
-
(F)
The engine 3D models: The aeroengine 3D CAD models [39] (see Subsection 4.3.1) are highlighted in response to the user’s gaze to signal to the user that they can be interacted with. Once selected, they switch their color for a couple of seconds to inform the user that they have been selected (see Fig. 6). Such signaling can also take place in the system’s response to a (D) voice command issued by the user after (B) pressing the appropriate button on the left-hand pop-up menu (see Fig. 7(a)) or upon selection through the (C) globe gizmo. In response to (B) hand-tracking, bi-manual manipulation carried out by the user over an engine model which results in in a change in either a model’s position, shape, or rotation [3] is immediately visible.
3.3 Task Analysis
Using the FAST-diagram as a base, we distill two key user tasks:
T1—Visualize aeroengines: The system should simultaneously visualize an array of aeroengine 3D models (see Subsection 4.3.1) together with their accompanying data.
T2—Analyze data: The system should support and aid the user in effective and efficient analysis of the performance data associated with the given components of the aeroengines. Here we focus on the LPC, IPC, and HPC components (see Subsection 4.3.1).
These two tasks—T1 and T2—can be split into a series of sub-tasks as the data pertaining to each aeroengine is coupled with the 3D models of the individuals engines (see Subsection 4.3.1). For instance, in the case of one particular aeroengine, its IPC sub-component has been damaged, which is also reflected in the associated graph. To see such connections the user has to inspect both the data and the models in either order. With this in mind, we list the following additional sub-tasks:
T3—Explore performance data: As each of the aeroengine 3D models is associated with performance characteristics of the selected engine parts (see Subsection 4.3.2) the system should support the user in an effective exploration of such data. Here we are focusing on the LPC, IPC, and HPC parts (see Subsection 4.3.1) coupled with the compressors characteristics plots (see Subsection 4.3.2).
T4—Select aeroengine model: The system should allow the user to easily select the desired aeroengine from an array of CAD aeroengines 3D models (see Subsection 4.3.1).
T5—Inspect aeroengine model: The system should support the user in efficient inspection of a given aeroengine 3D model (see Subsection 4.3.1).
T6—Manipulate aeroengine model: The system should support a form of manipulation of the individual CAD models. This, in turn, should aid the user in fulfilling the tasks T3, T4, and T5.
4 APPARATUS & VISUALIZATION FRAMEWORK
4.1 System Structure
The visualization framework used to support the Jarvis system was first developed to explore and assess the feasibility of using digital twins of aeroengines embedded in a VR environment [3]. Details of the development and verification of this system, as well as the results of a qualitative user study with domain experts, can be found in Tadeja et al. [3]. Here, we discuss how this framework has been extended and updated with additional features. Those extensions allow the user to interact with the objects and the system itself in a novel voice-based manner. We have also switched the initial point of the user’s focus to a globe-like interactive gizmo that allows the user to track the trajectory of the individual airplanes in real-time (see Fig. 5).
4.2 Hardware
The Jarvis VR system was developed and tested on a computer setup consisting of NVIDIA GeForce GTX 1060 GPU coupled with the Oculus Rift head-mounted display (HMD) used to facilitate the VR environment. The hand-tracking was achieved using a Leap Motion sensor [36] attached to the front of the headset.
4.3 Visualization
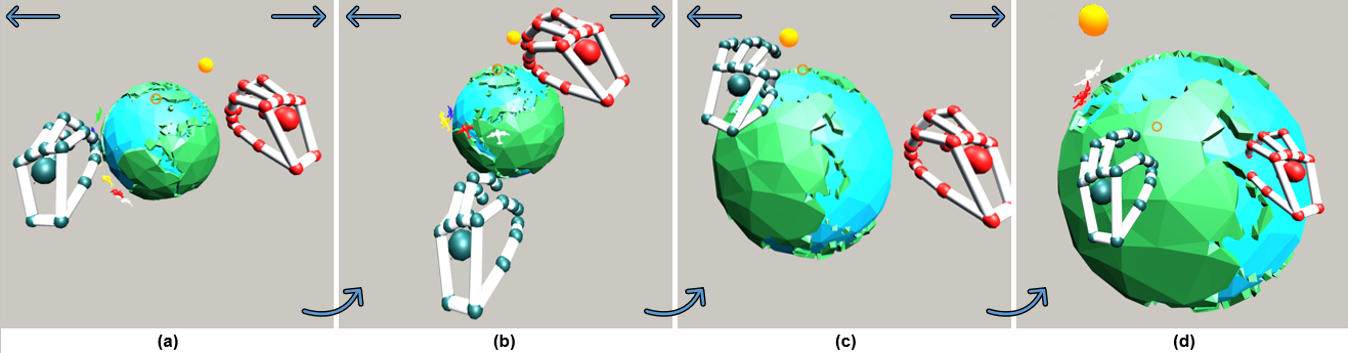
The visualization was developed using the Unity engine [40] and is based on the VR system for digital twinning, details of which can be found in Tadeja et al. [3]. This system was updated and extended with a range of new features and visualization components. It now includes a speech-based interface and the globe-based interactive gizmo (see Fig. 5) that can be used to track the current geoposition of a fleet of aeroengines around the world.
4.3.1 Aeroengines Models
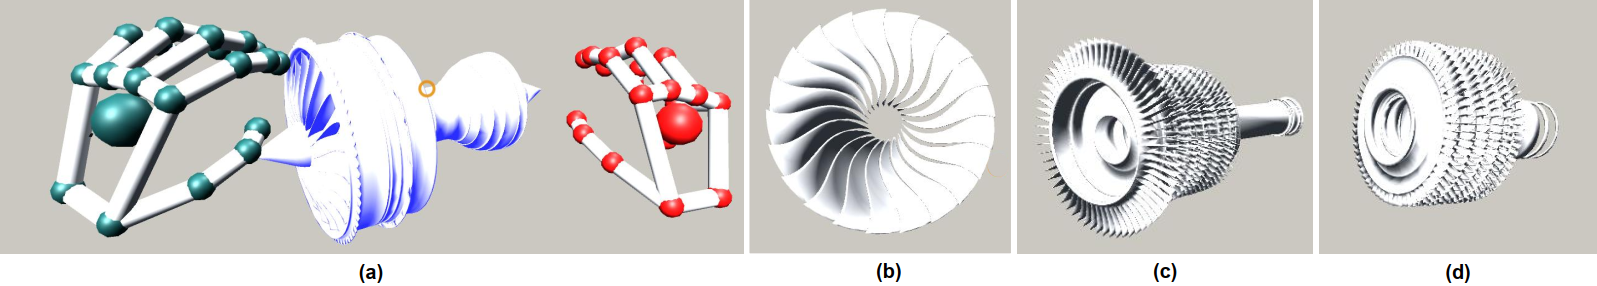
Each of the aeroengine CAD models [39] can be disassembled into these eleven, non-separable sub-parts: (a) casing; (b) low pressure compressor (LPC); (c) intermediate pressure compressor (IPC); (d) high pressure compressor (HPC); (e) low pressure turbine, shaft and nozzle; (f) fan; (g) nose cone; (h) high pressure shaft; (i) intermediate pressure shaft; (j) intermediate pressure turbine; and (k) combustor and high pressure turbine.
4.3.2 Compressors Characteristics Plots
Compressor characteristics are standard plots within the turbomachinery community for assessing the performance of a compressor. The horizontal axis of these plots typically shows a non-dimensionalized massflow rate (or flow function), while the vertical axis shows the pressure ratio. Data is typically shown at multiple speed lines, corresponding to different compressor shaft speeds. Iso-contours of efficiency are also plotted, which, in conjunction with the pressure ratio and non-dimensionalized massflow rate, offer a global perspective of a compressor’s performance.
5 MULTIMODAL INTERFACE
The system combines three interaction modalities: 1) gaze-tracking; 2) hand-tracked gestures; and 3) speech recognition.
5.1 Head- and Gaze-Tracking
Head-tracking is provided by the Oculus Rift HMD [41]. As Oculus does not support built-in gaze-tracking capabilities, we approximate the user’s current gaze location by placing a cross-hair in the center of the user’s field of view at a fixed distance from the user (see Fig. 4). Whenever the cross-hair passes over an interactive object, the object is automatically highlighted to signal its interactive status. This part of the system is based on the Unity VR Free Sample Pack [42].
5.2 Hand-Tracking and Gesture Recognition
The hand-tracking and gesture recognition processing is achieved with the help of the Leap Motion sensor and its software development kit (SDK) [36]. The range of gestures recognized by our system is reported in Tadeja et al. [3] and consists of (i) a pinch gesture; (ii) a double-pinch gesture; (iii) a left-hand palm-up gesture; and (iv) a thumbs-up gesture. These gestures enable the user to: (a) pull the engine apart using their hands; (b) decrease or increase the sizes of the whole engine or its individual sub-components; and (c) rotate the whole engine or any of its sub-components [3]. The same manipulation techniques can be applied to the compressors characteristics plots (see Fig. 4) as well as the globe gizmo (see Fig. 5). However, these two elements cannot be pulled apart. An example of a user manipulating and disassembling an aeroengine model can be seen in Fig. 6. The details of this bimanual manipulation techniques of the 3D models is available in Tadeja et al. [3].
5.3 Voice Recognition and Information Capture
The voice interface is based on the observation that our subject matter is very specific and the number of topics that can be mentioned while the user interacts with the system is limited. There is therefore no need to use a very large vocabulary speech recognition system, which would raise many challenges related to grammatical decomposition, understanding of concepts and their relation to the knowledge base, etc. Instead, we provide a set of specific queries that can be used to interact with the system. During the operation of Jarvis we only match the user’s voice query with prepared patterns that are stored in the system.
Having first used a voice-to-text service to decode the user’s spoken query to text, we use then use the Rasa NLU (Natural Language Understanding) module of Rasa [43], an open source set of Python libraries for building human-machine conversational interfaces. Rasa is based on machine learning models. Therefore, in the beginning, we prepared an appropriate sample of possible user queries from potential users, which was used to bootstrap the system by training an appropriate model. As can be seen in the excerpt (see Listing 1), the sample file consists of several groups starting with ## intent:[NAME]. Each of these groups represents different types of user queries. We provide a list of sample sentences for each intent. There is a possibility to put placeholders in the queries in the form [VALUE](NAME), where NAME is the name of the placeholder and VALUE is one of the possible values. Training the model on such a file is only done once. It is carried out offline before the system is used for the first time. Thereafter the trained model is used to parse a given sentence and extract information about the intent name and the identified placeholder’s values is returned by Rasa NLU module.
The voice interface workflow is as follows:
-
1.
The user selects the “speak” button in the VR interface. This is done only for the prototype. In the final version, the microphone will be constantly monitored and commands will be recognized on-the-fly.
-
2.
The audio signal is captured using a microphone.
-
3.
The issued voice command is decoded into text using the
SpeechRecognition333https://pypi.org/project/SpeechRecognition Python library coupled with the speech-to-text service offered by the Google Cloud Speech API. -
4.
The recognized user command is transmitted the knowledge graph server over simple JSON-RPC interface over HTTP. The entire speech bundle (voice recognition and the knowledge graph) is implemented as a separate HTTP server to facilitate remote work of multiple users in the system. The entire knowledge base is therefore located in one place accessible via, for example, a local network.
-
5.
The speech bundle server processes the command (using RASA NLU, as described above, and the knowledge graph, as described in Sect. 6) and prepares a system response. Sample commands sent to the speech bundle server and system responses (based on the knowledge graph prepared for the demo use case) are presented in Listing 2.
-
6.
The system response is transmitted via a JSON-RPC interface. It consists of three elements: engineID and subsystem indicate which part of the visualization should be presented to the user, while message is communicated to the user using a text-to-speech service. Text-to-speech is performed using the eSpeak Speech Synthesizer444http://espeak.sourceforge.net/ used under version 3 of the GNU General Public License.
6 Knowledge Graph
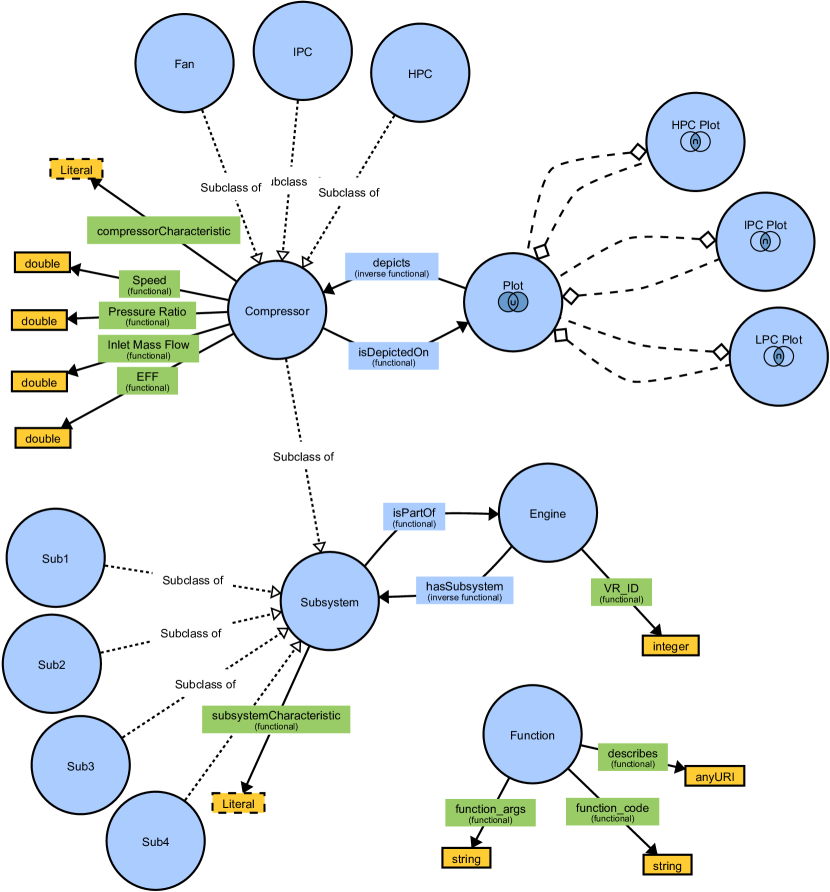
Domain knowledge, such as the characteristics of the aeroengine models, is stored in a knowledge-based system. We used the RDF (Resource Description Framework) language [4] as the knowledge representation mechanism. We chose this approach as it is a standardized formalism that is easy to link with other knowledge bases [44], which can be useful for further project development. For example, for integration with an external engine’s specifications. In RDF each statement is represented as the Subject-Predicate-Object triplet (for sample RDF triples, see Tab. 1). We use IRIs (Internationalized Resource Identifiers) to allow for unambiguous identification of resources. A triplet’s Object can be also be represented as a literal, such as string, number or date.
| Subject | Predicate | Object |
|---|---|---|
| Subsystem | isPartOf | Engine |
| IPC | isSubclassOf | Compressor |
| Compressor | isDepictedOn | Plot |
| Compressor | PressureRatio | double |
| Compressor | Speed | double |
| Engine | VR_ID | integer |
A set of triplets form a directed knowledge graph where Subject and Object are nodes while Predicate describes an edge. We use automatic reasoning on this graph to either infer new knowledge based on existing knowledge, or to verify the correctness of the knowledge base. Both avenues are possible thanks to the use of a meta-layer describing the graph (e.g., restrictions on concepts and relations), specified in a knowledge representation language, such as RDFS (Resource Description Framework Schema) or OWL (Web Ontology Language) [44]. The structure of the graph can be divided into two parts: TBox (terminology: concepts and relations definition) and ABox (assertions: statements about specific instances). In our aeroengine case, a statement Compressor isDepictedOn Plot is part of the TBox, while HPC_of_Engine_3 isDepictedOn Plot_4 belongs to the ABox. The TBox for the discussed system is shown in Fig. 8.
We extract knowledge from the knowledge graph using the SQL-like language SPARQL (SPARQL Protocol and RDF Query Language) [5]. Listing 3 presents a SPARQL query template for a intent:get_value set of user commands (see Listing 1). We prepared such SPARQL query templates for all intent/command types.
An important task is to insert precise values into placeholders. Since these values are extracted by RASA NLU from automatically generated text from the speech signal, these values may be incorrectly recognized and therefore not match values in the knowledge graph. We solve this problem by replacing these values with the closest available values in the knowledge graph before constructing a query against the knowledge graph.
The steps making up the speech bundle server flow are as follows:
-
1.
The server receives the command as text from the speech-to-text service.
-
2.
The command is processed by the RASA NLU model. Intent type and values for placeholders are returned.
-
3.
Values are cleared: (a) for numbers the text string is parsed to extract the numbers; (b) for enums, the closest value is selected from a hard-coded set; (c) for other text strings, the closest value is extracted from the knowledge graph.
-
4.
The final query is prepared using a template for the identified command type with placeholders replaced with cleared values. This query is then processed against the knowledge graph.
-
5.
The system formats the response for the user. This respoonse is closely linked to the values returned by the query (see Listing 3): engineID is ?ID, subsystem is ?subs, and message is created using a template for a specific command type, involving, for example, ?val.
The knowledge graph server not only allows the user to submit queries (using ask as an endpoint). There are in addition three further JSON-RPC endpoints that can be accessed to manipulate the knowledge graph. In our current prototype, they are utilized to initialize the knowledge base. In the future, they can also be used to manipulate the knowledge graph on-the-fly. By using these methods, the knowledge graph server can be treated as a black box, which can be fully operated by means of appropriate queries without any need for low-level manipulation of knowledge graph files or a codebase:
-
•
add_engine provides the possibility to add information about new aeroengines (IDs, subsystems and their characteristics) to the knowledge graph. This endpoint is currently used to fill the knowledge graph when the system starts. However, it can also be used in a dynamic adaptation of the system to accommodate introducing new aeroengines on-the-fly to the Jarvis system.
- •
-
•
update_values allows changing specific values of the selected aeroengine during the system’s operation. Other values are recalculated if necessary according to the defined update methods.
7 DISCUSSION
Our prior work [3] explored the deploying a VR environment for design and digital twinning in aeronautics. This paper has presented an extended system, which we call Jarvis—a speech-enhanced VR demonstrator based on mining knowledge databases. In comparison to prior work [3] the system has been extended to incorporate a knowledge graph that supports voice queries from the user and which serves to amplify users abilities by allowing the use of voice interaction in conjunction with bimanual interaction.
As demonstrated in prior work [3], the gestures recognized by our system are sufficient to support the key tasks identified in the task analysis (see Subsection 3.3): 1) visualize aeroengines; 2) analyze data; 3) explore performance data; 4) select aeroengine model; 5) inspect aeroengine model; and 6) manipulate aeroengine model.
While tasks 5) and 6) above are largely unaffected by the new voice interface, tasks 1)–4) are enhanced by voice interaction. For example, tasks 3) and 4) rely on the selection of appropriate data, for example, to select and take apart models with poor conditions in order to identify potential physical damage.
Such advanced features require the system to not only recognize the user’s speech but to also infer further information based on the context in which the command was issued. This in turn is possible using the knowledge-based solution in the Jarvis system. Interaction data and information on the current state of each of the compressors in each turboengine is captured in a knowledge-based system underpinned by a knowledge graph storing complex domain knowledge (see Subsection 6). This enables the Jarvis system to handle complex voice queries, such as “what is the pressure ratio of the intermediate pressure compressor for Engine 5” or “calculate the average pressure ratio after 80 hours of flying time for HPC in Engine 3.” The Jarvis system not only provides sufficient and precise answers to such queries but also allows a certain level of flexibility as the user can construct queries from a broader lexicon. This is possible because the context in which the user and the system are operating is concise and to some extent very strict, since the number of questions that domain-expert users may ask in a given context is limited. In the future, the voice functionality could be extended with other, non-engineering commands, such as “Recall/Hide the globe gizmo.”
A voice-operated system which proof-of-concept we are presenting here naturally has some limitations imposed by both hardware and software alike. These limitations can be categorized in three groups: (1) gaze- and eye-tracking; (2) gesture-tracking and gesture recognition; and (3) speech-to-text processing.
Regarding limitation 1), the Oculus Rift [41] VR headset does not provide built-in gaze-tracking or eye-tracking capabilities. Hence, we developed an approximation of a gaze-tracking feature by placing a cross-hair at a constant distance in front of the user’s face (see Fig. 4). Using integrated eye-tracking hardware would most likely be more accurate and robust than our solution and consequently increase the level of fidelity of the Jarvis system. We anticipate this limitation will be alleviated with updated VR headsets in the near future.
Regarding limitation 2), among the gestures recognized by our system (see Fig. 7) the most frequently used gestures are the single and double pinch gesture [3]. Some studies suggest that replacing a pinch gesture with a grasp gesture may yield a better user experience in some circumstances [45]. We leave such an investigation for the Jarvis system as future work.
Regarding limitation 3), speech-to-text processing occurs in discrete 60-second chunks instead of as a continuous process. The implementation is based on the conversation services provided by Google Cloud555https://cloud.google.com/speech-to-text. The free resources used by our system impose these limitations in length and size on the converted speech and this limitation can potentially be limited by licensing a bespoke solution.
8 CONCLUSIONS
In this paper we have presented the design and implementation of the Jarvis system—a state-of-the-art speech-enhanced VR demonstrator based on mining knowledge databases. This work represents one of the first attempts at aeroengine analysis in a bespoke voice-enabled VR environment and hopefully brings us a step closer to a real-life version of the J.A.R.V.I.S. from the movies for aeroengine analytics.
The Jarvis system is equipped with a new bimanually operated globe gizmo (see Fig. 5) that allows the user to efficiently and swiftly select the appropriate turboengine 3D CAD models [39] of interest. Further, this gizmo, if coupled with streamed GPS and other telemetry data, can provide the user with a broader view of the entire fleet of airplanes, including meta-information such as their current position and operational status.
We enhanced the Jarvis system with a robust and flexible subsystem that allows domain experts to issue voice commands while working within the VR environment. To achieve this goal, the system not only has to be able to recognize the user’s speech. It also has to perform an analysis to gain an understanding of the information incorporated in the command and the situational context. This analysis allows the system to automatically infer further knowledge and act accordingly (see Subsection 5.3). This functionality is bestowed by the knowledge-based subsystem, which is in turn facilitated by a knowledge graph (see Fig. 8) that stores complex domain knowledge. Thanks to this solution the Jarvis system is well-equipped to promptly answer a number of sensible context-aware queries.
ACKNOWLEDGEMENTS
This work was supported by studentships from the Engineering and Physical Sciences Research Council (EPSRC-1788814), the Cambridge European & Trinity Hall Scholarship, and the Cambridge Philosophical Society Research Studentship. In addition, the work of Yupu Lu was supported in part by the Tsinghua Academic Fund for Undergraduate Overseas Studies and the Fund from Tsien Excellence in Engineering Program. This work was supported by Wave 1 of The UKRI Strategic Priorities Fund under the EPSRC Grant EP/T001569/1, particularly the “Digital Twinning in Aeronautics” theme within that grant & The Alan Turing Institute’.
The authors would also like to thank Kacper Łodziński for his work on the Python code responsible for data exchange with the speech-to-text services offered by the Google Cloud API, and to Przemysław Stachura for his help with the software debugging.
References
- [1] Video clip showcasing the Jarvis interface. https://www.youtube.com/watch?v=TmjmRD8YJYI.
- [2] Sutherland, I. E., 1968. “A Head-mounted Three Dimensional Display”. AFIPS ’68 (Fall, part I) Proceedings of the December 9-11, 1968, fall joint computer conference, part I, pp. 757–764, DOI:10.1145/1476589.1476686.
- [3] Tadeja, S. K., Lu, Y., Seshadri, P., and Kristensson, P. O., 2020. “Digital Twin Assessments in Virtual Reality: An Explorational Study with Aeroengines”. In Proceedings of 41st IEEE Aerospace Conference.
- [4] Schreiber, G., and Raimond, Y., 2014. RDF 1.1 primer. W3C working group note, W3C, June. https://www.w3.org/TR/rdf11-primer/.
- [5] Harris, S., and Seaborne, A., 2013. SPARQL 1.1 query language. W3C recommendation, W3C, March. https://www.w3.org/TR/sparql11-query/.
- [6] Hartley, C. S., and Pulliam, R., 1988. “Use of heads-up displays, speech recognition, and speech synthesis in controlling a remotely piloted space vehicle”. IEEE Aerospace and Electronic Systems Magazine, 3(7), pp. 18–26.
- [7] Barry, T., Solz, T., Reising, J., and Williamson, D., 1994. “The simultaneous use of three machine speech recognition systems to increase recognition accuracy”. In Proceedings of National Aerospace and Electronics Conference (NAECON’94), pp. 667–671 vol.2.
- [8] Evans, J. R., Tjoland, W. A., and Allred, L. G., 2000. “Achieving a hands-free computer interface using voice recognition and speech synthesis [for windows-based ate]”. IEEE Aerospace and Electronic Systems Magazine, 15(1), pp. 14–16.
- [9] Kavitha S, Veena S, and Kumaraswamy, R., 2015. “Development of automatic speech recognition system for voice activated ground control system”. In 2015 International Conference on Trends in Automation, Communications and Computing Technology (I-TACT-15), pp. 1–5.
- [10] Helmke, H., Ohneiser, O., Mühlhausen, T., and Wies, M., 2016. “Reducing controller workload with automatic speech recognition”. In 2016 IEEE/AIAA 35th Digital Avionics Systems Conference (DASC), pp. 1–10.
- [11] Tadeja, S. K., Seshadri, P., and Kristensson, P., 2020. “AeroVR: An Immersive Visualization System for Aerospace Design and Digital Twinning in VR”. The Aeronautical Journal, 124(1280), Oct., pp. 1615–1635.
- [12] Hale, J. P., 1994. “Applied virtual reality in aerospace design”. In Proceedings of WESCON ’94, pp. 378–383.
- [13] Mizell, D. W., 1994. “Virtual reality and augmented reality in aircraft design and manufacturing”. In Proceedings of WESCON ’94, pp. 91–.
- [14] García-Hernández, R. J., Anthes, C., Wiedemann, M., and Kranzlmüller, D., 2016. “Perspectives for using virtual reality to extend visual data mining in information visualization”. In 2016 IEEE Aerospace Conference, pp. 1–11.
- [15] Herman, I., Melancon, G., and Marshall, M. S., 2000. “Graph visualization and navigation in information visualization: A survey”. IEEE Transactions on Visualization and Computer Graphics, 6(1), pp. 24–43.
- [16] Inselberg, A., and Dimsdale, B., 1990. “Parallel coordinates: a tool for visualizing multi-dimensional geometry”. In Proceedings of the First IEEE Conference on Visualization: Visualization ‘90, pp. 361–378.
- [17] Tadeja, S. K., Kipouros, T., and Kristensson, P. O., 2019. “Exploring Parallel Coordinates in Virtual Reality”. In Extended Abstracts of the 2019 CHI Conference on Human Factors in Computing Systems (CHI’19).
- [18] Tadeja, S. K., Kipouros, T., and Kristensson, P. O., 2020. “IPCP: Immersive Parallel Coordinates Plots for Engineering Design Processes”. In Proceedings of AIAA SciTech Forum and Exposition.
- [19] Museth, K., Barr, A., and Lo, M. W., 2001. “Semi-immersive space mission design and visualization: case study of the "terrestrial planet finder" mission”. In Proceedings Visualization, 2001. VIS ’01., pp. 501–599.
- [20] Schneider, J., Dedieu, C., Le Sidaner, P., Savalle, R., and Zolotukhin, I., 2011. “Defining and cataloging exoplanets: the exoplanet.eu database”. A&A, 532, p. A79.
- [21] Lin, J., Keogh, E., Lonardi, S., Lankford, J. P., and Nystrom, D. M., 2004. “Visually mining and monitoring massive time series”. In Proceedings of the Tenth ACM SIGKDD International Conference on Knowledge Discovery and Data Mining, KDD ’04, ACM, p. 460–469.
- [22] Anz-Meador, P., 2015. “A review of space environment implications of cubesat traffic, 2003-2014”. In Orbital Debris Quarterly News, Vol. 19, pp. 4–6.
- [23] Bonney, R., Cooper, C. B., Dickinson, J., Kelling, S., Phillips, T., Rosenberg, K. V., and Shirk, J., 2009. “Citizen Science: A Developing Tool for Expanding Science Knowledge and Scientific Literacy”. BioScience, 59(11), 12, pp. 977–984.
- [24] Stump, G. M., Yukish, M., Simpson, T. W., and O’Hara, J. J., 2004. “Trade space exploration of satellite datasets using a design by shopping paradigm”. In 2004 IEEE Aerospace Conference Proceedings (IEEE Cat. No.04TH8720), Vol. 6, pp. 3885–3895 Vol.6.
- [25] Jeong, S., Chiba, K., and Obayashi, S., 2005. “Data Mining for Aerodynamic Design Space”. In 23rd AIAA Applied Aerodynamics Conference. American Institute of Aeronautics and Astronautics.
- [26] Roberts, D. J., Garcia, A. S., Dodiya, J., Wolff, R., Fairchild, A. J., and Fernando, T., 2015. “Collaborative telepresence workspaces for space operation and science”. In 2015 IEEE Virtual Reality (VR), pp. 275–276.
- [27] Clergeaud, D., Guillaume, F., and Guitton, P., 2016. “3D collaborative interaction for aerospace industry”. In 2016 IEEE 3rd VR International Workshop on Collaborative Virtual Environments (3DCVE), pp. 13–15.
- [28] Savall, J., Borro, D., Gil, J. J., and Matey, L., 2002. “Description of a haptic system for virtual maintainability in aeronautics”. In IEEE/RSJ International Conference on Intelligent Robots and Systems, Vol. 3, pp. 2887–2892 vol.3.
- [29] Sagardia, M., Hertkorn, K., Hulin, T., Wolff, R., Hummell, J., Dodiya, J., and Gerndt, A., 2013. “An interactive virtual reality system for on-orbit servicing”. In 2013 IEEE Virtual Reality (VR), pp. 1–1.
- [30] Stone, R. J., Panfilov, P. B., and Shukshunov, V. E., 2011. “Evolution of aerospace simulation: From immersive Virtual Reality to serious games”. In Proceedings of 5th International Conference on Recent Advances in Space Technologies - RAST2011, pp. 655–662.
- [31] Wright, J., Hartman, F., and Cooper, B., 2001. “Immersive environment technologies for planetary exploration”. In Proceedings IEEE Virtual Reality 2001, pp. 183–190.
- [32] Russell, M., Lecakes, G. D., Mandayam, S., Morris, J. A., Turowski, M., and Schmalzel, J. L., 2009. “Acquisition, interfacing and analysis of sensor measurements in a VR environment for integrated systems health management in rocket engine tests”. In 2009 IEEE Sensors Applications Symposium, pp. 128–131.
- [33] Lecakes, G. D., Russell, M., Mandayam, S., Morris, J. A., and Schmalzel, J. L., 2009. “Visualization of multiple sensor measurements in a VR environment for integrated systems health management in rocket engine tests”. In 2009 IEEE Sensors Applications Symposium, pp. 132–136.
- [34] Shefelbine, S., Clarkson, J., Farmer, R., and Eason, S., 2002. Good Design Practice for Medical Devices and Equipment - Requirements Capture. University of Cambridge Engineering Design Centre and University of Cambridge Institute for Manufacturing.
- [35] Tadeja, S. K., Lu, Y., Rydlewicz, W., Bubas, T., Rydlewicz, M., and Kristensson, P. O. PhotoTwinVR: An Immersive System for Manipulation, Inspection and Dimension Measurements of the 3D Photogrammetric Models of Real-Life Structures in Virtual Reality. https://arxiv.org/abs/1911.09958.
- [36] Leap Motion, Last accessed: March 2019. Leap motion. https://www.leapmotion.com/.
- [37] In Your Face Games, Last accessed: May 2020. Stylized Earth. https://assetstore.unity.com/packages/3d/environments/landscapes/stylized-earth-94673.
- [38] VIS-Games, Last accessed: May 2020. Cartoon Airplane. https://assetstore.unity.com/packages/3d/vehicles/air/cartoon-airplane-4310.
- [39] Heyns, M., https://grabcad.com/michael.heyns, Last accessed: September 2019. Trent 1000 high bypass turbofan, https://grabcad.com/library/trent-1000-high-bypass-turbofan. GrabCAD https://grabcad.com.
- [40] Unity Game Engine, Last accessed: Oct 2019. Unity. https://unity.com/.
- [41] Oculus VR, Last accessed: Nov 2018. Oculus Rift, Oculus Quest, Oculus Go. https://www.oculus.com.
- [42] Unity3D Game Engine, Last accessed: Nov 2018. Unity VR Samples pack. https://assetstore.unity.com/packages/essentials/tutorial-projects/vr-samples-51519.
- [43] Bocklisch, T., Faulkner, J., Pawlowski, N., and Nichol, A., 2017. Rasa: Open source language understanding and dialogue management.
- [44] Hogan, A., Blomqvist, E., Cochez, M., d’Amato, C., de Melo, G., Gutierrez, C., Gayo, J. E. L., Kirrane, S., Neumaier, S., Polleres, A., Navigli, R., Ngomo, A.-C. N., Rashid, S. M., Rula, A., Schmelzeisen, L., Sequeda, J., Staab, S., and Zimmermann, A., 2020. Knowledge graphs.
- [45] Jude, A., Poor, G. M., and Guinness, D., 2016. “Grasp, Grab or Pinch? Identifying User Preference for In-Air Gestural Manipulation”. In ACM Proceedings of the 2016 Symposium on Spatial User Interaction, pp. 219–219.