Darcy-Reynolds forces during intrusion into granular-fluid beds
Abstract
We experimentally study intrusion into fluid-saturated granular beds by a free-falling sphere, varying particle size and fluid viscosity. We test our results against Darcy-Reynolds theory, where the deceleration of the sphere is controlled by Reynolds dilatancy and the Darcy flow resistance. We find the observed intruder dynamics are consistent with Darcy-Reynolds theory for varied particle size. We also find that our experimental results for varied viscosity are consistent with Darcy-Reynolds theory, but only for a limited range of the viscosity. For large viscosities, observed forces begin to decrease with increasing viscosity, in contrast with the theoretical prediction.
I Introduction
Intrusion or impact into a granular-fluid mixtures is a common process with relevance in, e.g., bio-inspired locomotion problems [1, 2] or shock absorption applications [3]. Each of the constituent phases of this system (granular flows or fluid flows) is already challenging enough to describe, and the combination is even more difficult. There has been extensive recent work on steady-state rheology of granular fluid mixtures, including generalizations of inertial rheology descriptions for granular flows [4, 5, 6, 7] as well as rheological studies of shear-thickening behavior [8, 9, 10]. Steady state analyses of granular and suspension flows often assume a weak coupling between the dynamics of both phases or only mild gradients (space or time) in the flow rate or the local stress. These analysis therefore offer few handles to understand more complex flow situations such as intrusion, which inherently involves compaction or dilation and propagation phenomena [11, 12, 13, 14]. Thus, in addition to the utility of describing the impact or intrusion process for practical applications, intrusion is a useful benchmark to probe the limits of existing theories and uncover new physics. This has been recognized by a diverse and expanding set of works on intrusion [15, 12, 16, 17]. In particular, understanding how relevant data during an impact (e.g., crater size [18, 19], or peak forces [15, 20]) depends on system parameters (e.g., intruder speed, intruder size, or grain stiffness) often yields significant insight about underlying physics, especially inherently transient processes that by definition cannot be captured by steady-state descriptions.
A notable example of such a process was recently highlighted by Jerome et al. [21]. When intrusion occurs into a granular bed in which the packing fraction is compacted above a critical volume fraction (due to, e.g., external vibrations [22, 23] or aging from other mechanisms [24, 25]), there is an initial transient where the bed dilates, due to Reynolds dilatancy [26]. Generally, the bed will be saturated in some fluid (e.g., air or water), and the fluid will be sucked into the expanding pore structure. For sufficiently small particles and a sufficiently viscous fluid, Darcy pressure [27] begins to play an increasingly dominant role during the granular bed expansion. Jerome et al. [21] formulated a basic theory that combined these two effects, called Darcy-Reynolds theory (DRT), to describe the dynamics of spheres impacting granular beds that were fully immersed in a fluid. The authors showed explicitly that DRT could explain the dependence on of the force response during intrusion into fluid-saturated granular beds.
Although the -dependence of the impact response was confirmed to agree with DRT [21], several other parameters like viscosity of the interstitial fluid or the particle diameter play a crucial role in this theory, but the scaling behavior for these parameters was tested only for a few cases. If tested and confirmed, this would provide a framework that could be used for, e.g., prediction of robotic locomotion behavior [28] or tunable granular-fluid mixtures. One particular example motivating this study is the use of a ferrofluid as the viscous fluid. Ferrofluids [29] consist of nanometer-sized iron particles coated in a surfactant suspendend in a simple fluid (e.g., alcohol or a petroleum-based fluid). Ferrofluids behave approximately as viscous fluids, but with a viscosity that depends on the applied magnetic field. Thus, the viscosity can be changed in situ during some deformation of the material to achieve desired results. Since Darcy-Reynolds pressure increase with increasing , this could provide a way to externally tune the flow behavior of granular-fluid mixtures.
Here, we demonstrate how DRT predicts scaling laws for intrusion into fluid-grain mixtures as a function of particle size and fluid viscosity. We then experimentally test these scaling laws with impact experiments by dropping spheres from a height into fluid-saturated granular beds with varying particle size and fluid viscosity ; see Fig. 1(a). In both cases, we find results that are consistent with DRT over a range of parameter values. We observe some change to the phenomenology for large ; we show that this can be explained using DRT. However, we also observe a qualitative discrepancy for the predicted behavior for large which cannot be reconciled with DRT. Increasing should lead to increasing Darcy-Reynolds forces. Instead, we observe that for large , increasing leads to decreasing forces during impact. Viscosity is controlled by adding glycerol to water as well as by using a ferrofluid and tuning the viscosity with an external applied magnetic field; both methods yield similar results. Our results demonstrate that Darcy-Reynolds theory as formulated describes variation in over a wide range but breaks down for large viscosities, at least for the particles and fluids studied here. However, the overall agreement between the glycerol-water mixtures and the ferrofluid suggest that ferrofluids could be used to construct tunable complex fluids, where the applied magnetic field controls the viscosity and hence impact hardness.
II Darcy-Reynolds Theory
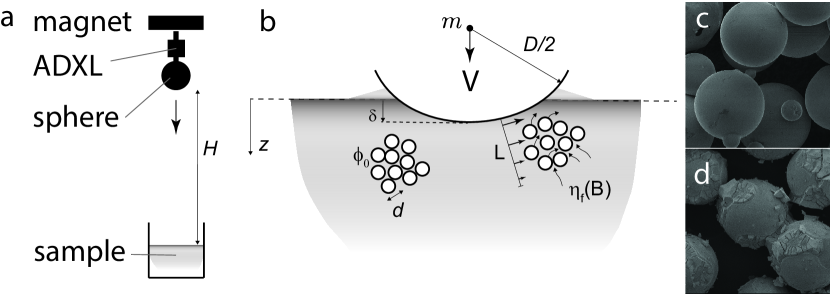
We first reproduce the derivation of Darcy-Reynolds theory that appears in the main text and the Supplemental Material of Jerome et al. [21]. The key idea is that intrusion of an object requires shear in the particulate phase. Such shear gives rise to frictional stress as set by some effective friction coefficient. Additionally, when a packing is denser than its “critical state” solid fraction —i.e. the density it would have during steady-state shear—then the material will dilate when sheared until asymptotically approaching , a process known as Reynolds dilatancy. This induces fluid flow into the expanding pores. Under certain conditions the pore fluid pressure can locally reach values much larger than any other local pressure scale, such as gravity, in which case dominates the dynamics. The key hurdle is then to find an expression for for the situation sketched in Fig. 1(b).
It is reasonable to assume that the rate of dilation is linearly proportional to the shear rate [30]. Thus, the first assumption of this theory is that the dilation obeys a simple differential equation,
| (1) |
To approximate the magnitude of , we take finite differences, i.e., . We assume that the strain needed over which dilation happens is [30, 31, 32], and , with , yielding . If , then . We use this approximation later to confirm that our comparison between theory and experiments is reasonable.
As previously stated, when the granular phase dilates, fluid from elsewhere in the material must fill this volume opened up via dilation. If the particle diameter is small, then the Darcy flow resistance of the fluid through the pore structure is dominant. The Darcy law states that
| (2) |
where is the permeability, is the fluid viscosity, and is the pore pressure. Assuming that the particle and fluid phases are both incompressible, i.e., and , then taking the divergence of Eq. (2) yields , assuming that spatial dependence in can be neglected (i.e., ). Combining with Eq. (1) yields
| (3) |
This equation represents a local constitutive law, which can then be extended to impact of a sphere into a saturated granular bed, with initial volume fraction , using several more assumptions. During impact, there is a shearlike deformation that occurs beneath the intruder. The first important assumption is that this shear deformation occurs over a length scale , which is proportional to the square root of the instantaneous contact area between the intruder and the fluid-grain mixture. In this picture, then sets the pressure scale for a frictional intrusion-resisting force. This represents a qualitative difference between Darcy-Reynolds theory and recent theories that have been proposed to describe impact into dense suspensions, where propogating dynamically jammed fronts play a crucial role [12, 16, 14, 33]. Something like Darcy-Reynolds theory likely describes why these these dynamically jammed fronts remain solidified, due to very small (e.g., cornstach) particles with very low associated permeability. However, the theories describing each of these two systems cannot be directly applied to the other; we discuss further at the end of the Discussion section.
II.1 The role of shear length scale
Assuming that the shear length scale is set by the square root of the contact area between the ball and the material, the shear rate is , where is the speed of the intruder. The pore-pressure effects also act over length scale , so . Thus, Eq. (3) becomes
| (4) |
which sets the characteristic pressure on the sphere by the material. Assuming that Darcy-Reynolds pressure dominate all other forces, and that the intruder predominantly feels a frictional slowing down force, the equation of motion can be written as
| (5) |
where is the sphere mass, is the penetration depth (, ), and is an effective friction coefficient. The effective mass density can be defined as , where is the sphere diameter.
II.2 Testable predictions from Darcy-Reynolds Theory
If the Darcy-Reynolds pressure is very large, then the penetration depth of the sphere is small, i.e., (this is observed experimentally for small grains). In this case, by a small-angle approximation. Combining, one obtains
| (6) |
where . After integrating in time, Eq. (6) yields a dimensionless equation of motion
| (7) |
where , , and
| (8) |
The initial conditions are given by and , where is the initial velocity at impact. This means that the dimensionless velocity at impact is , since and at initial impact.
Numerically solving Eq. (6) yields a deceleration-versus-time curve that rises, peaks at characteristic time set by , and decreases. Such a curve can be seen in the Supplemental Material of Ref. [21] as well as in comparison to our experimental data in Fig. 2(b) (dashed line). The peak dimensionless acceleration is therefore
| (9) |
This equation predicts, for example, a peak force scaling via , which can be explicitly tested.
The derivation of Eq. (9) contains several assumptions. The breakdown of the validity of these assumptions leads to measurably different scaling behaviors. One assumption discussed by Jerome is that can be strain rate dependent, shifting the solidification response during impact. Other deviations are possible; for example, in the case that the Darcy-Reynolds pressure is not sufficiently large to preserve throughout the impact, then Eq. (6) onward must be reevaluated. In the case where the Darcy-Reynolds pressure is dominant but still small enough that the penetration depth becomes similar to or larger than , the contact area is simply proportional to the intruder cross sectional area, meaning that , not . This means that Eq. (6) becomes
| (10) |
Thus, in this limit, the force on the impacting sphere is proportional to its speed, suggesting . Note that this linear dependence on velocity is reminiscent of Stokes drag, although the physical mechanism is different.
Equation (10) predicts exponential decay in the velocity and acceleration, specifically
| (11) |
where . However, we note that during the initial stages of penetration, would still be valid, so we expect a buildup of the force before exponential decay takes over as the intruder passes through different scaling regimes.
The equations in this section contain specific predictions about the dynamics, which are testable via experiments, as we show below. We note that there are other assumptions in these equations which may not always be valid, such as the assumption that is a constant that is independent of any system parameter. It is also reasonable to consider that the pore-pressure effects act over the particle scale , giving and hence additional scaling dynamics that we did not explore in detail. These and other assumptions may be responsible for deviations from these predictions, as we discuss below.
III Experimental Methods
To test the predictions from the previous section, we perform experiments of spherical intruders dropped into fluid-saturated granular beds. Since the dependence on was already confirmed in Ref. [21], we vary other parameters, especially , , and . We also vary and , but over more modest range. We use five distinct sets of glass beads (Mo-Sci), with ranges of (1) 53-75, (2) 75-106, (3) 180-212, (4) 300-425, and (5) 600-850 in units of m,.
III.1 Details of the fluids
We vary in two ways. First, we add glycerol to water in various concentrations, using data from [34] to estimate the viscosity of the resulting mixture. By volume glycerol was diluted with water in 25% increments and then converted to mPas for data analysis. Using these increments we achieve viscosity of 1 mPas (water), 2.4 mPas (25% glycerol), 7.9 mPas (50% glycerol), 24 mPas (75% glycerol), and 1412 mPas (100%). All viscosity experimental data was collected in an ambient temperature between 21.7-24.4 oC, minimizing the impact of viscosity variance due to temperature variance.
(a) (b) (c)
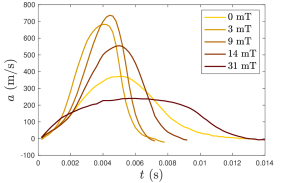
Second, we use Ferrotec EFH1 Ferrofluid to conduct similar test to the glycerol, where we adjust the viscosity with an external magnetic field. The ferrofluid has a base viscosity of 6 mPas [35], and we increase the viscosity by adding an external magnetic field using arrays of permanent magnets as well as a large solenoid for smaller adjustments. We measure the magnetic field using a Hall probe, and we verify that it is fairly constant over the volume where the impact will take place (less than 50% variation). Magnetic readings were taken from edge to edge in the container to ensure symmetric magnetic forces on each side of the impact zone. We characterize the profile by a single number, , corresponding to the magnetic field at the point where the impact will take place. We take data for mT (no field), 3 mT, 9 mT, 14 mT, and 31 mT. Based on [36], we estimate that viscosity will increase by roughly two orders of magnitude over this range of . We return to this point below in Sec. IV, when we describe results from impacts into ferrofluid-saturated beds. We used SEM to identify the interaction between the beads and ferrofluid, as shown in Fig. 1(d). After drying the silica beads and ferrofluid mixture SEM images show that the silica beads are covered in ferrofluid particles. Importantly, there are characteristic fluid contact marks left where the ferrofluid collected at the contact points while drying. The ferrofluid appears to have maintained fluid like properties depositing the nanometer sized iron oxide particles as it dried which suggests that the ferrofluid retains its fluid-like properties also on a scale much smaller than . There are also no large cohesive-looking ferrofluid particle agglomerations present that would interfere with direct solid-solid silica bead contacts.
III.2 Sample Preparation
Samples are prepared by filling a 8x8 cm acrylic container with an open top with the relevant fluid to a level of roughly 10 cm. We then slowly add particles of given size until the particle packing level is at approximately the same height as the fluid. By weighing both the fluid and the grains as they are poured, we can estimate the volume ratio and thus packing fraction of the suspension. We observe for all samples with the exception the largest beads ( to m), where is observed. We assume that , which is corroborated by the fact that we observe a strong solidification during impact, consistent with the results for in Ref. [21].
Our sample preparation protocol depends on the fluid used. For water-based suspensions, we stir the suspension after impact and let it settle. For the more viscous samples stirring is challenging to do without introducing bubbles. After each impact the material furthest from the impact is moved to fill the impact crater and we wait for it to settle. Because the more viscous samples did not settle when completely stirred, settling experiments were done on to ensure that does not change significantly from run to run via the application of the protocol. Visual inspection shows that did not change in any significant manner until after many hours to days of settling. Because all the viscosity impact data was collected in less than four hours we minimize the risk of changing due to settling. We further verify that is not playing a role in our measurements by the fact that there is no significant change in the small fluid layer at the top of the sample. We also perform multiple sets of experiments with the same sample, and we find that our measurements are repeatable.
III.3 Generating impacts
Steel spheres are fixed to the end of threaded rods and dropped from various heights by releasing them using an electromagnet. Impact velocities are inferred by , where is the gravitational acceleration; we also confirm these velocities using high-speed video for selected cases. We measure the acceleration using an onboard accelerometer (Sparkfun with ADXL377). We vary and by adding mass or using different diameter steel spheres. A sketch of the setup is shown in Fig. 1(a).
IV Experimental Results
IV.1 Phenomenology
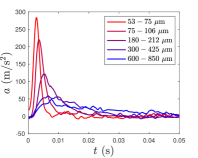
Figure 2(a) shows for five impacts, one for each range of , all with impact velocity m/s. These curves clearly demonstrate that, consistent with the Darcy-Reynolds picture, smaller leads to more sharply peaked deceleration profiles with larger values of . Figure 2(b) shows , where , plotted as a function of for each of the five curves shown in Fig. 2(a). For the three smallest particle size ranges ( – 75 m, – 106 m, and – 212 m), the Darcy-Reynolds pressure is sufficiently large that is satisfied during the bulk of the trajectory, meaning that Eq. (9) is valid. The rescaled experimental results for the samller agree well with a numerical solution of Eq. (7), which is shown as a black dashed line.
To rescale the experimental data in Fig. 2(b), we need to set for each curve. Several parameters in are not directly measurable or known a priori, but a suitable collapse (at least for small ) is found by setting . The packing fraction differential is of order 10-2, meaning that the product is of order . Above, we estimated , meaning that the effective friction coefficient . While this value appears very high for a friction coefficient, we note that it is not a simple friction coefficient and that a previous study on granular intrusion found a value of approximately 35 for a similar parameter [37]. Additionally, we note that the assumptions leading up to Eq. (4) may affect the value of . In any case, the quantities are within reasonable physical bounds, and assuming yields good agreement between the experimental trajectories and the theoretical prediction of Eq. (9) for small .
In contrast, for the two largest particle sizes, the Darcy-Reynolds pressure is much smaller, meaning that the sphere is able to penetrate more deeply into the material. In this case, is not satisfied, so it is not surprising from the theoretical prediction that arises from solving Eq. (7) numerically that the experimental results do not match the Jerome predictions. This argument can be made quantitative by estimating the penetration depth at peak deceleration in the following way. By assuming that the average deceleration between and the time corresponding to the peak deceleration is equal to half of the peak value (corresponding to approximating the rise in deceleration as linear), then . We can then use as a dimensionless measure of how far the sphere has penetrated relative to its own diameter at . For the smallest particles, with – 75 m, we find typical values of , meaning that is a reasonable approximation. For the largest particles, with – 850 m, we find typical values of or larger.
The data for – 850 m in particular appears to be better described by a sharp rise followed by quasi-exponential decay, consistent with Eq. (11). Figure 2(c) shows acceleration versus time for three impacts into beds with – 850 m and with initial velocities , 1.5, and 2 m/s; the data for is the same curve shown in panel (a). Note that the axes are rescaled using , as defined in conjunction with Eq. (11), as well as the impact velocity on the horizontal axis. The solid black line shows the theoretical prediction from Eq. (11). Note that the values used in the rescaling here are fully determined by the collapse in panel (b), using , leaving no free parameters.
(a) (b) (c)
IV.2 Scaling results for and
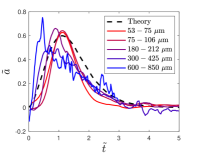
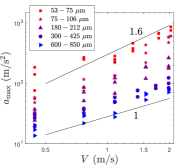
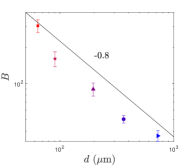
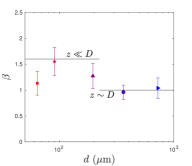
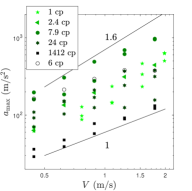
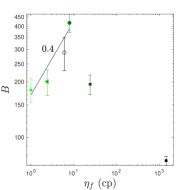
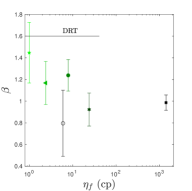
Figure 3(a) shows versus for all five particle sizes. Equation (9) shows that DRT predicts , under several assumptions, including . Experimental results are more consistent with this prediction for smaller (red squares, green stars, and black triangles) and larger where these assumptions are valid. For large (e.g., blue circles and magenta triangles), we observe , as predicted by Eq. (11) and consistent with the collapse in Fig. 2(c). Figure 3(b) and (c) show the result of fits to the -versus- data in Fig. 3(a) of the form (error bars represent 95% confidence intervals). We find good agreement with the prediction from Eq. 9 that . The best fit for the exponent is consistently smaller than the prediction of from Eq. (9), even for small where we would expect it to be valid. However, we note that the low value of for the smallest particles seems to be caused by outliers at low ; the large- data appears very consistent with . Overall, appears to be highly consistent with the data at small . For larger , where the Darcy-Reynolds pressure is smaller and we expect Eq. (11) to be applicable, we find as expected. Overall, our data for varied agree well with the predictions of Darcy-Reynolds theory.
(a) (b)
IV.3 Viscosity dependence
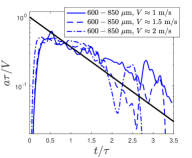
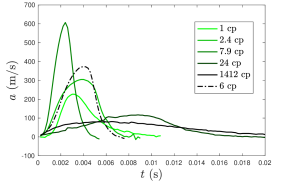
Turning now to the impact behavior for varied , Fig. 4 shows results for impacts at varying and with constant particle size -106 m. Fig. 4(a) shows typical acceleration curves with similar but with varied . The solid curves represent water-glycerol mixtures, and the dash-dotted curve (6 cp) represents the ferrofluid with no applied magnetic field. These curves appear qualitatively similar to those in Fig. 2. However, in contrast with the predictions of DRT, the peak value shows non-monotonic behavior as is increased: increases with up to cp but then decreases dramatically as is further increased. This decrease in is qualitatively inconsistent with DRT.
As stated in Sec. I, one motivation of these experiments was to move toward tunable particle-fluid mixtures. In particular, if the viscous fluid were replaced with a ferrofluid, then the particle-fluid mixture could be strengthened in situ by applying an external magnetic field. Our results for glycerol-water mixtures, shown in Fig. 4(a), suggest that this may not be the case. Figure 4(b) shows that the breakdown of thickening at higher viscosities reproduces when the viscous fluid is no longer glycerol-water mixtures but is instead replaced by a ferrofluid. The initial viscosity of the ferrofluid is cp, which is just below the value of cp where we expect to see the largest values of for the range of we study here. Therefore, we expect that as the applied magnetic field is increased, we should see a slight increase in followed by a decline. Figure 4(b) shows five curves of with similar m/s with five different magnetic field strengths, , 3, 9, 14, and 31 mT. We again find that increases with (which we vary indirectly through ) and then begins to decrease. Importantly, we find this result consistently for all values of . Figure 5(a) shows data for versus . The data for cp (water), marked with green stars, are the same data shown with deep red stars in Fig. 3. Figure 5(b) and (c) show results of best fits to these data in the form . We again find that best fits for tend to be slightly smaller than the prediction of from Eq. (9). The best fits for increase in a way that is consistent with the prediction of from Eq. (9) for 1 cp (water), 2.4 cp (25% glycerol), 6 cp (zero-field ferrofluid) and 7.9 cp (50% glycerol). However, for larger values of , we observe that begins to decrease, consistent with Fig. 4.
(a) (b) (c)
V Discussion
Here we have followed Jerome et al. [21] to derive equations describing the dynamics of a sphere impacting a fluid-saturated granular bed, where the granular phase is compacted above the critical volume fraction such that it dilates under shear. The dilation (Reynolds) caused by the impact forces fluid to flow into the expanding pore structure, and the resulting Darcy pressure dominates the force on the intruder. We have expanded on the derivation from Ref. [21] to include the case where the sphere penetration depth becomes similar to or larger than its diameter.
The predictions from this theory were experimentally confirmed by Jerome et al. [21] with regard to the dependence on . Here, we performed additional experiments to test the theory’s predictions on other parameters, specifically impact velocity , particle size , and fluid viscosity . Our experimental results confirm the predictions of DRT for variation in over more than an order of magnitude. For small , DRT as formulated in Ref. [21] works well. For larger , a key approximation () for the context of impact dynamics is no longer applicable, so the equation of motion describing the impacting sphere’s dynamics must be modified. However, with this modification, DRT still captures the observed behavior over a large range of . When we vary , we observe good agreement with DRT for between 1 and 10 cp, specifically that . However, for cp, we observe that forces generated during impact begin to decrease as is further increased. We validate this result with two methods: varying by adding glycerol to water as well as by using a ferrofluid with an externally applied magnetic field. Both approaches show that the forces generated during impact begin to decrease with increasing at cp. This is qualitatively inconsistent with DRT, suggesting that a new theory is required. One possibility is that the frictional behavior of the grain-grain contacts changes drastically with a very viscous fluid (recall, a constant effective friction coefficient was assumed for all and ). For large , grains may not be able to squeeze out the fluid to make frictional, solid-solid contact. A similar mechanism is often invoked to explain shear thickening behavior in dense suspensions [9].
Finally, as pointed out in [21], the pore-pressure effects from DRT could help explain the dramatic response of impact into shear-thickening suspensions. Shear-thickening suspensions differ from saturated granular beds, in that the particles are not making solid-solid contact in the absence of driving. However, in these systems, decreases as stress is applied, causing dilation and thereby inducing a large Darcy pressure that solidifies the material. We emphasize that there are some key differences between the system discussed here and impact into dense suspensions, such as the fact that propagation phenomena play a key role in the impact response of shear-thickening suspensions but are not considered in DRT. However, DRT likely plays an important role in impact behavior into shear-thickening suspensions, primarily by holding together the dynamic solidlike region often observed in shear-thickening impact experiments.
VI Acknowledgements
We acknowledge funding from the Office of Naval Research under Grant No. N0001419WX01519 and by the Office of Naval Research Global Visiting Scientist Program VSP 19-7-001. We thank Drago Grbovic for taking SEM images.
References
- Nordstrom et al. [2015] K. N. Nordstrom, D. S. Dorsch, W. Losert, and A. G. Winter, Microstructural view of burrowing with a bioinspired digging robot, Phys. Rev. E 92, 042204 (2015).
- Kudrolli and Ramirez [2019] A. Kudrolli and B. Ramirez, Burrowing dynamics of aquatic worms in soft sediments, PNAS 116, 25569 (2019).
- Gürgen et al. [2017] S. Gürgen, M. C. Kuşhan, and W. Li, Shear thickening fluids in protective applications: a review, Prog. Polym. Sci. 75, 48 (2017).
- Boyer et al. [2011] F. Boyer, E. Guazzelli, and O. Pouliquen, Unifying suspension and granular rheology, Phys. Rev. Lett. 107, 188301 (2011).
- Trulsson et al. [2012] M. Trulsson, B. Andreotti, and P. Claudin, Transition from the viscous to inertial regime in dense suspensions, Phys. Rev. Lett. 109, 118305 (2012).
- Guazzelli and Pouliquen [2018] E. Guazzelli and O. Pouliquen, Rheology of dense granular suspensions, J. Fluid Mech. 852, P1 (2018).
- Pähtz et al. [2019] T. Pähtz, O. Durán, D. N. de Klerk, I. Govender, and M. Trulsson, Local rheology relation with variable yield stress ratio across dry, wet, dense, and dilute granular flows, Phys. Rev. Lett. 123, 048001 (2019).
- Brown and Jaeger [2014] E. Brown and H. M. Jaeger, Shear thickening in concentrated suspensions: phenomenology, mechanisms and relations to jamming, Reports on Progress in Physics 77, 046602 (2014).
- Wyart and Cates [2014] M. Wyart and M. E. Cates, Discontinuous shear thickening without inertia in dense non-brownian suspensions, Phys. Rev. Lett. 112, 098302 (2014).
- Seto et al. [2013] R. Seto, R. Mari, J. F. Morris, and M. M. Denn, Discontinuous shear thickening of frictional hard-sphere suspensions, Phys. Rev. Lett. 111, 218301 (2013).
- Umbanhowar and Goldman [2010] P. Umbanhowar and D. I. Goldman, Granular impact and the critical packing state, Phys. Rev. E 82, 010301 (2010).
- Waitukaitis and Jaeger [2012] S. R. Waitukaitis and H. M. Jaeger, Impact-activated solidification of dense suspensions via dynamic jamming fronts, Nature 487, 205 (2012).
- Clark et al. [2015] A. H. Clark, A. J. Petersen, L. Kondic, and R. P. Behringer, Nonlinear force propagation during granular impact, Phys. Rev. Lett. 114, 144502 (2015).
- Han et al. [2016] E. Han, I. R. Peters, and H. M. Jaeger, High-speed ultrasound imaging in dense suspensions reveals impact-activated solidification due to dynamic shear jamming, Nature communications 7, 1 (2016).
- Goldman and Umbanhowar [2008] D. I. Goldman and P. Umbanhowar, Scaling and dynamics of sphere and disk impact into granular media, Phys. Rev. E 77, 021308 (2008).
- Peters and Jaeger [2014] I. R. Peters and H. M. Jaeger, Quasi-2d dynamic jamming in cornstarch suspensions: visualization and force measurements, Soft Matter 10, 6564 (2014).
- Van Der Meer [2017] D. Van Der Meer, Impact on granular beds, Annu. rev. of fluid mech. 49, 463 (2017).
- Walsh et al. [2003] A. M. Walsh, K. E. Holloway, P. Habdas, and J. R. de Bruyn, Morphology and scaling of impact craters in granular media, Phys. Rev. Lett. 91, 104301 (2003).
- Uehara et al. [2003] J. S. Uehara, M. A. Ambroso, R. P. Ojha, and D. J. Durian, Low-speed impact craters in loose granular media, Phys. Rev. Lett. 90, 194301 (2003).
- Krizou and Clark [2020] N. Krizou and A. H. Clark, Power-law scaling of early-stage forces during granular impact, Phys. Rev. Lett. 124, 178002 (2020).
- Jerome et al. [2016] J. J. S. Jerome, N. Vandenberghe, and Y. Forterre, Unifying impacts in granular matter from quicksand to cornstarch, Phys. Rev. Lett. 117, 098003 (2016).
- Nowak et al. [1997] E. R. Nowak, J. B. Knight, M. L. Povinelli, H. M. Jaeger, and S. R. Nagel, Reversibility and irreversibility in the packing of vibrated granular material, Powder technol. 94, 79 (1997).
- Pugnaloni et al. [2008] L. A. Pugnaloni, M. Mizrahi, C. M. Carlevaro, and F. Vericat, Nonmonotonic reversible branch in four model granular beds subjected to vertical vibration, Phys. Rev. E 78, 051305 (2008).
- Gago and Boettcher [2020] P. A. Gago and S. Boettcher, Universal features of annealing and aging in compaction of granular piles, PNAS 117, 33072 (2020).
- Allen and Kudrolli [2018] B. Allen and A. Kudrolli, Granular bed consolidation, creep, and armoring under subcritical fluid flow, Phys. Rev. Fluids 3, 074305 (2018).
- Reynolds [1885] O. Reynolds, LVII. On the dilatancy of media composed of rigid particles in contact. With experimental illustrations, The London, Edinburgh, and Dublin Philosophical Magazine and Journal of Science 20, 469 (1885), https://doi.org/10.1080/14786448508627791 .
- Darcy [2012] H. Darcy, Les fontaines publiques de dijon ed 1856 (Hachette Livre-Bnf, 2012).
- Agarwal et al. [2021] S. Agarwal, A. Karsai, D. I. Goldman, and K. Kamrin, Surprising simplicity in the modeling of dynamic granular intrusion, Science Advances 7, eabe0631 (2021).
- Raj et al. [1995] K. Raj, B. Moskowitz, and R. Casciari, Advances in ferrofluid technology, Journal of magnetism and magnetic materials 149, 174 (1995).
- Sakaie et al. [2008] K. Sakaie, D. Fenistein, T. J. Carroll, M. van Hecke, and P. Umbanhowar, Mr imaging of reynolds dilatancy in the bulk of smooth granular flows, EPL 84, 38001 (2008).
- Kabla and Senden [2009] A. J. Kabla and T. J. Senden, Dilatancy in slow granular flows, Phys. Rev. Lett. 102, 228301 (2009).
- Vasisht and Del Gado [2020] V. V. Vasisht and E. Del Gado, Computational study of transient shear banding in soft jammed solids, Phys. Rev. E 102, 012603 (2020).
- Brassard et al. [2021] M.-A. Brassard, N. Causley, N. Krizou, J. A. Dijksman, and A. H. Clark, Viscous-like forces control the impact response of dense suspensions, J. Fluid Mech. XXX (2021).
- Segur and Oberstar [1951] J. B. Segur and H. E. Oberstar, Viscosity of glycerol and its aqueous solutions, Industrial & Engineering Chemistry 43, 2117 (1951), https://doi.org/10.1021/ie50501a040 .
- fer [2018] Efh series audio ferrofluidtype: Efh1 (2018).
- Patel et al. [2003] R. Patel, R. Upadhyay, and R. Mehta, Viscosity measurements of a ferrofluid: comparison with various hydrodynamic equations, Journal of colloid and interface science 263, 661 (2003).
- Brzinski et al. [2013] T. A. Brzinski, P. Mayor, and D. J. Durian, Depth-dependent resistance of granular media to vertical penetration, Phys. Rev. Lett. 111, 168002 (2013).