An ACA Survey of [C I] –, CO =4–3, and Dust Continuum in Nearby U/LIRGs
Abstract
We present the results of surveying [C I] –, 12CO =4–3, and 630 m dust continuum emission for 36 nearby ultra/luminous infrared galaxies (U/LIRGs) using the Band 8 receiver mounted on the Atacama Compact Array (ACA) of the Atacama Large Millimeter/submillimeter Array. We describe the survey, observations, data reduction, and results; the main results are as follows. (i) We confirmed that [C I] – has a linear relationship with both the 12CO =4–3 and 630 m continuum. (ii) In NGC 6052 and NGC 7679, 12CO =4–3 was detected but [C I] – was not detected with a [C I] –/ 12CO =4–3 ratio of . Two possible scenarios of weak [C I] – emission are C0-poor/CO-rich environments or an environment with an extremely large [C I] – missing flux. (iii) There is no clear evidence showing that galaxy mergers, AGNs, and dust temperatures control the ratios of [C I] –/ 12CO =4–3 and . (iv) We compare our nearby U/LIRGs with high-z galaxies, such as galaxies on the star formation main sequence (MS) at z and submillimeter galaxies (SMGs) at . We found that the mean value for the [C I] –/ 12CO =4–3 ratio of U/LIRGs is similar to that of SMGs but smaller than that of galaxies on the MS.
1 Introduction
The molecular hydrogen gas mass () of galaxies is a fundamental observable quantity that is directly linked to galaxy evolution. As cold H2 does not radiate strong emission, astronomers use carbon monoxide (CO111We use the term “CO” to infer 12C16O throughout this paper.) as a tracer of the extragalactic cold molecular gas mass (e.g., Bolatto et al., 2013). The =1–0 ground rotational transition of CO (hereafter CO (1–0)) has low excitation energy and the emission falls in the transparent atmospheric window (at a frequency of 115 GHz and a wavelength of 2.6 mm). For high-z galaxies, the observed frequency of low- CO lines is shifted out of the main high-transparency atmospheric window (i.e., GHz) and we cannot use powerful telescopes – such as the Atacama Large Millimeter/submillimeter Array (ALMA) – to observe low- CO lines until the lowest frequency band of ALMA (band 1) becomes available in the near future. Therefore, detecting low- CO lines requires long integration radio observation, even for bright objects (e.g., Carilli & Walter, 2013). We thus need to develop alternative methods to measure , which can be observed at a higher frequency (shorter wavelength) than CO (1–0) emission.
One possible method is to observe the mid- and high- CO lines (4) (e.g., Solomon & Vanden Bout, 2005; Carilli & Walter, 2013). For example, CO (4–3) line emits at a frequency of 460 GHz (corresponding to a wavelength of 650 m). However, higher- CO lines are sensitive to highly excited gases (i.e., warm and dense) that would occupy a minor fraction of the total molecular mass. The assumption of the line ratios, that is, CO (4–3)/CO (1–0), makes non-negligible systematic errors to measure the bulk of the molecular gas using higher- CO lines (e.g., Carilli & Walter, 2013). Therefore, astronomers have developed various alternative methods.
One proposed method is to use the lower forbidden fine structure line of atomic carbon – i.e., [C I] –, hereafter referred to as [C I] (1–0) – which emits at a frequency of 492 GHz (corresponding to a wavelength of 609 m). For example, [C I] observations in Galactic clouds have shown that [C I] distributions coincide with those of CO (Ojha et al., 2001; Oka et al., 2001; Ikeda et al., 2002; Kramer et al., 2008; Burton et al., 2015; Izumi et al., 2020a), suggesting that [C I] (1–0) luminosity can trace the bulk of molecular gas. Besides, Israel & Baas (2001, 2002, 2003) reported bright [C I] emission at the center of nearby galaxies. Papadopoulos et al. (2004) proposed that [C I] is superior to CO for measuring , especially in the UV intense diffuse region ( cm-3) and/or metal-poor environments due to the dissociation of CO. Subsequently, Papadopoulos & Greve (2004) applied the [C I] method for two Ultra/ infrared luminous galaxies: U/LIRGs – Arp 220 and NGC 1614 – and demonstrated that the molecular gas mass inferred from [C I] (1–0) luminosity is consistent with that from CO observations. Many studies have investigated the [C I] properties of galaxies using the data obtained by the Herschel Space Observatory (e.g., Israel et al., 2015; Kamenetzky et al., 2016; Jiao et al., 2017, 2019; Crocker et al., 2019). Theoretical modeling suggests that [C I] is a better tracer of than CO (1–0) in several environments, such as metal-poor environments or those with a high-cosmic rays, and active galactic nuclei (AGNs) (e.g., Bisbas et al., 2015; Papadopoulos et al., 2018; Clark et al., 2019). More recently, high-frequency receivers (e.g., Band 8 and 10 receivers) on ALMA have also enabled investigation of the spatial distribution of atomic carbon in nearby galaxies (e.g., Krips et al., 2016; Cicone et al., 2018; Izumi et al., 2018; Miyamoto et al., 2018; Salak et al., 2019; Izumi et al., 2020b; Saito et al., 2020). In addition, [C I] measurements of bright high-z galaxies, such as gravitational lensing galaxies and submillimeter galaxies (SMGs) (e.g., Walter et al., 2011; Alaghband-Zadeh et al., 2013; Bothwell et al., 2017; Yang et al., 2017; Andreani et al., 2018; Cañameras et al., 2018; Harrington et al., 2018; Tadaki et al., 2018; Dannerbauer et al., 2019; Jin et al., 2019; Cortzen et al., 2020), and galaxies on main sequence (MS; e.g., Popping et al. 2017; Talia et al. 2018; Valentino et al. 2018; Bourne et al. 2019; Valentino et al. 2020; Lee et al. 2021) are increasingly available.
The other proposed method uses the submillimeter dust continuum emission (Eales et al., 2012; Magdis et al., 2012; Scoville et al., 2014). Scoville et al. (2016) derived the same empirical calibration constant from 350 GHz (m) continuum flux to the interstellar medium (ISM) mass among local star-forming galaxies, molecular clouds of the Milky Way, and high-redshift SMGs; this suggests that the Rayleigh-Jeans tail of the dust emission can be used as an accurate and very efficient probe of the ISM in galaxies.
Before applying these new methods to measure in high-z galaxies, it is necessary to investigate the experimental relationship between CO, [C I], and the dust continuum in well-studied nearby galaxies. For example, Michiyama et al. (2020) discovered a [C I]-faint CO-bright gas-rich galaxy (NGC 6052), implying a large galaxy-to-galaxy variation with respect to the [C I]/ CO ratio and the importance of a systematic comparison between CO and [C I]. Here, we expand the analysis of Michiyama et al. (2020) by a survey of [C I] (1–0), CO (4–3), and dust continuum in U/LIRGs, using the Band 8 receiver mounted on the Atacama Compact (Morita) Array (ACA). This project can improve the sensitivity and resolution of legacy Herschel results in terms of the higher sensitivity and the higher resolution (i.e., Hershel’s beam is and the sensitivity is mJy whereas ACA’s beam is and the sensitivity is mJy).
In Section 2, we describe the survey design, supplemental data, observation, data reduction and data analysis. In Section 3, we summarize the results of the survey. In Section 4, we investigate the correlation between [C I] (1–0), CO (4–3), and the dust continuum. In addition, the details of [C I]-faint CO-bright gas-rich galaxy, NGC 7679, are explained. We investigated whether AGNs, mergers, and dust temperatures control the ratio of [C I]/CO. Finally, we compare our nearby U/LIRGs and high-z galaxies ( galaxies on MS and SMGs). Section 5 provides a summary of the study. We use the cosmological parameters for a CDM, , , and (Planck Collaboration et al., 2016).
2 Survey
2.1 Sample Selection
The ACA Band 8 U/LIRG survey was designed to observe [C I] (1–0), CO (4–3), and dust continuum emission for nearby ultraluminous infrared galaxies (ULIRGs: ) and luminous infrared galaxies (LIRGs: ), where the is the total infrared luminosity integrated from 8-1000 m. We observed 36222We observed 39 U/LIRGs, however, we do not investigate UGC 02338, IRAS 05442+1732, and NGC 7771. In the case of UGC 02338 and IRAS 05442+1732, the target information were wrong due to artificial mistake. For NGC 7771, the final images were uncertain due to technical issues and it was considered as QA2 fail from observatory. U/LIRGs. We selected 12 ULIRGs333NGC 6240 satisfies our criteria but was not observed due to duplication issue. from the IRAS Revised Bright Galaxy Sample (Sanders et al., 2003), whose declinations were below 20 degrees and exhibited no strong atmospheric absorption around [C I] (1–0) or CO (4–3). We selected 24 LIRGs, from which CO (1–0) was detected in literature by cross-matching the CO (1–0) samples compiled by Kamenetzky et al. (2016) and the references therein. The list of targets is listed in Table A.1.
2.2 Supplemental data
Several galaxies were observed using the Spectral and
Photometric Imaging Receiver Fourier Transform Spectrometer
(SPIRE/FTS) mounted on the Herschel Space Observatory (Kamenetzky et al., 2016; Lu et al., 2017), which provides the total [C I] (1–0) and CO (4–3) flux.
The galaxy-integrated global properties such as SFR, dust mass (), dust temperature (), and were estimated based on continuum spectrum fitting (SED fitting) by Shangguan et al. (2019)444 and is estimated with the same method explained in Shangguan et al. (2019) in private communication..
The CO (1–0) velocity integrated flux obtained by single dish telescopes was compiled by Kamenetzky et al. (2016), which corresponds to a 45″aperture after aperture correction.
The supplemental information is summarized in Table A.2
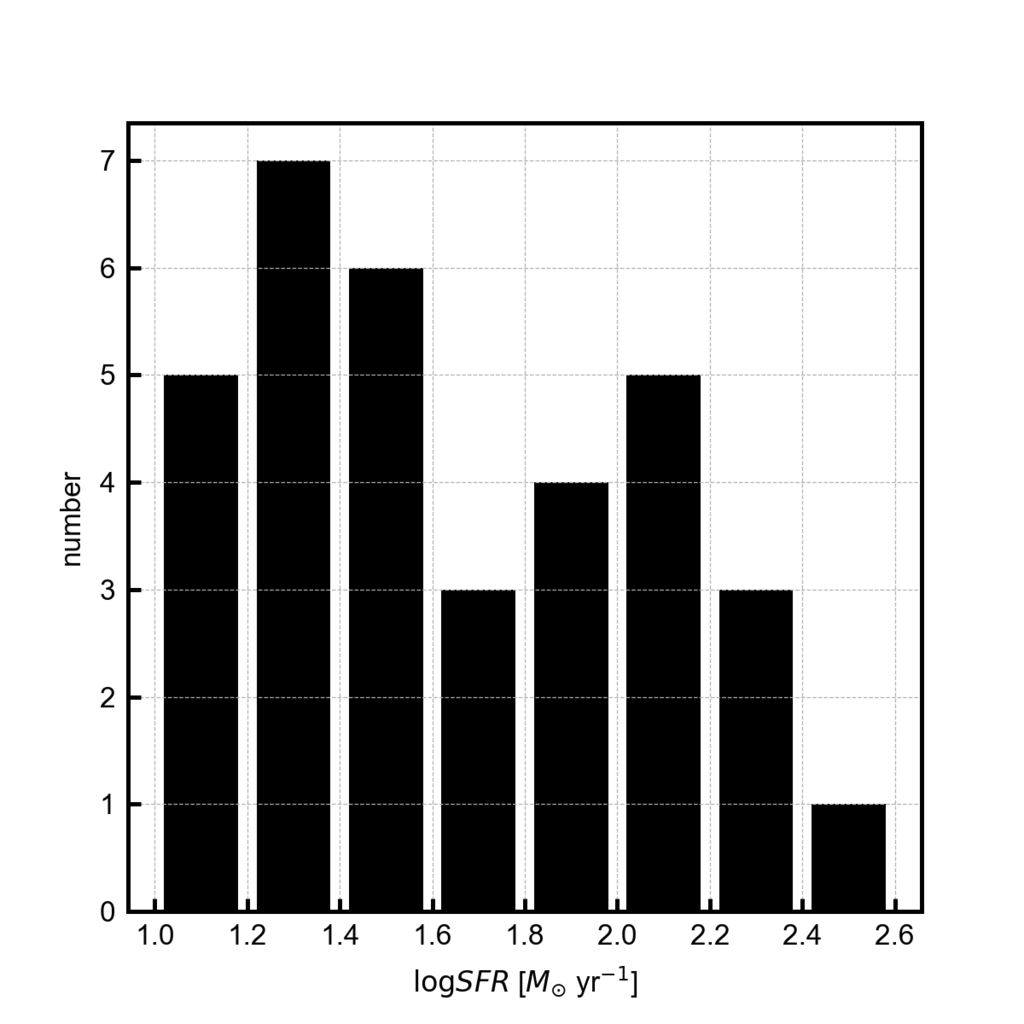
A histogram of the SFRs of the sample sources is presented in Figure 1.
2.3 Observation
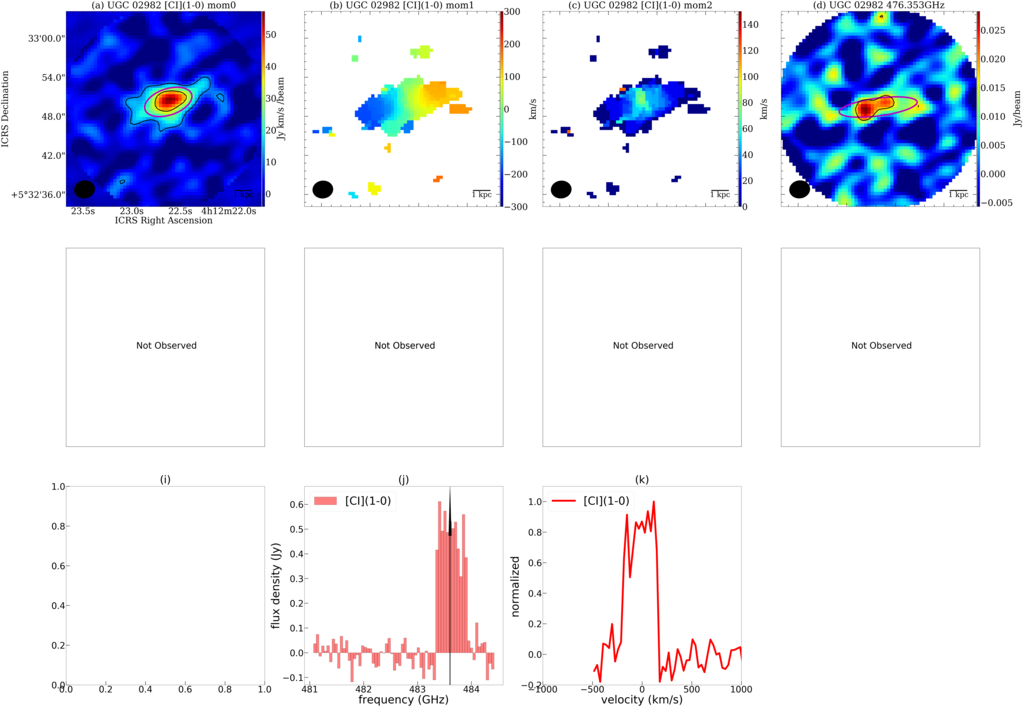
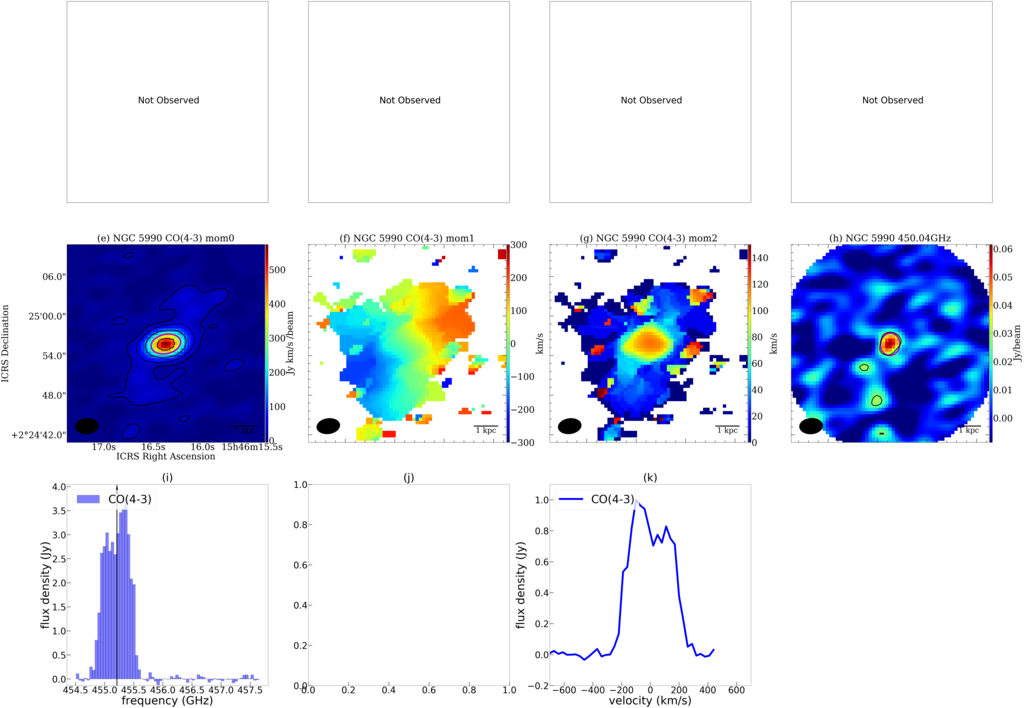
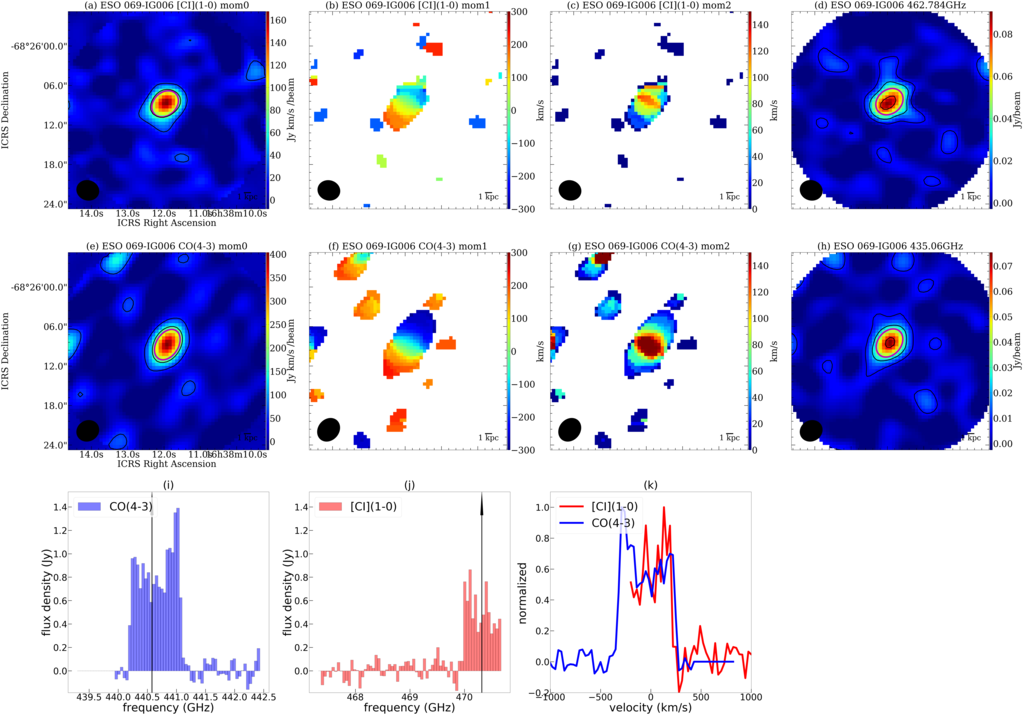
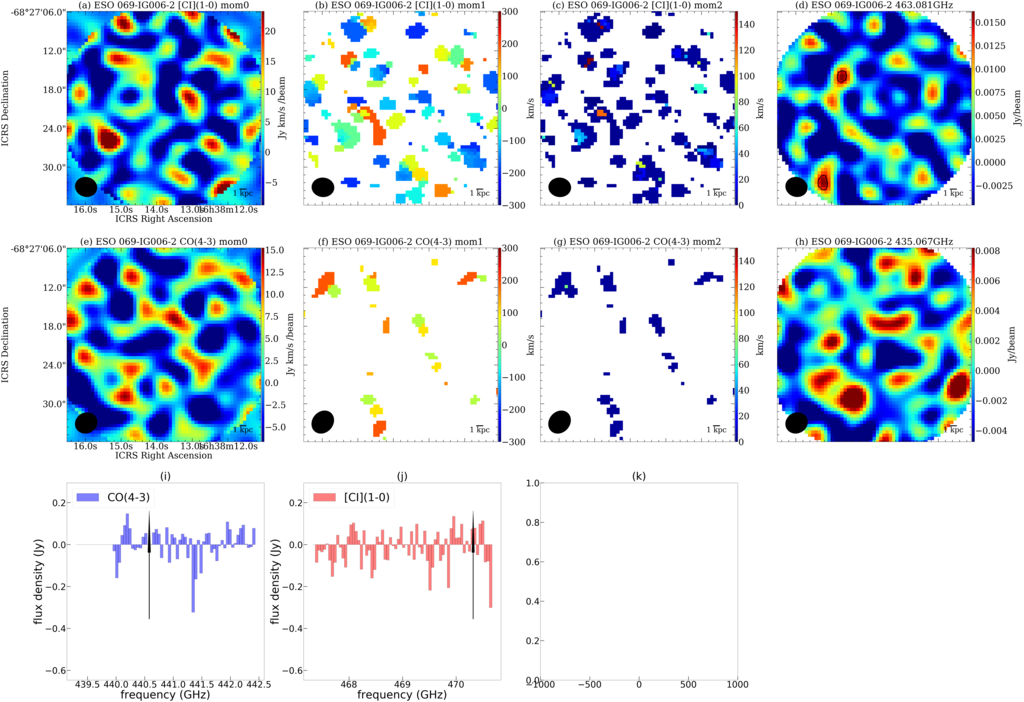
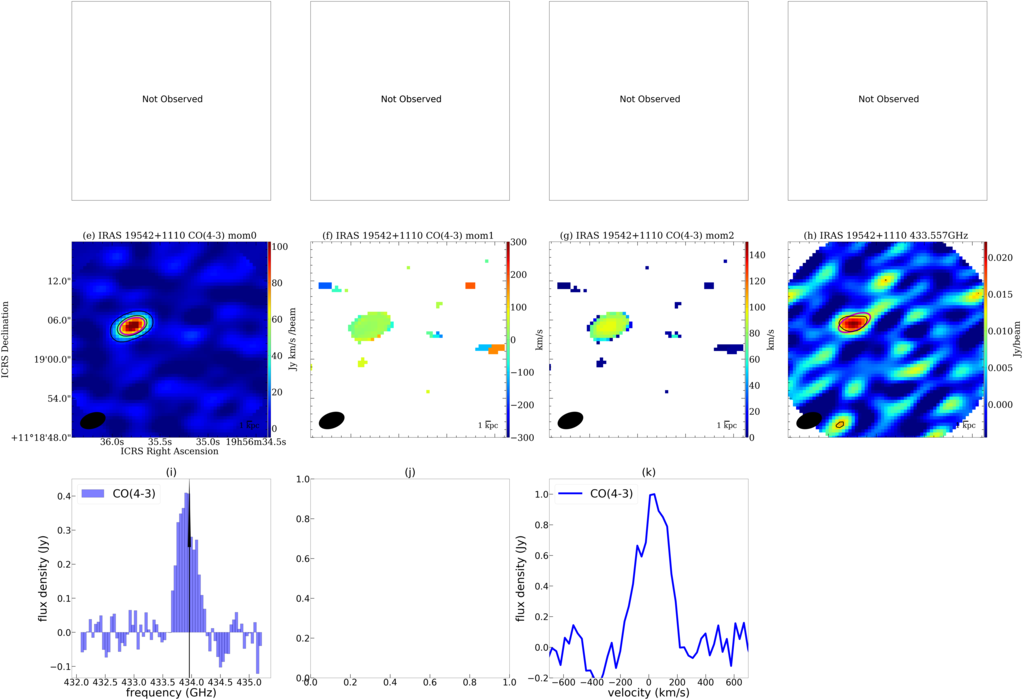
Single pointing mode ACA observations were performed during the cycle 6 season (ALMA project ID: 2018.1.00994.S, PI: T.Michiyama). For NGC 232, IRAS F10565+2448, and ESO 069-IG006, the fainter pairs of the interacting system were also observed. Among the 36 U/LIRGs, only CO (4–3) observations were completed in NGC 5990 and IRAS 19542+1110 and only [C I] (1–0) observations were completed in UGC 02982. The details – e.g., date, typical system temperature, and the number of antennas – are summarized in Table A.3, which are based on QA0 reports provided by the ALMA observatory. The detailed information in each observation run is shown in the weblog provided by the ALMA observatory.
Most important are the small field of view (FoV) and small maximum recovery scale (MRS) because the observation was a single-point snapshot (5 min integration) without a total power array. The FoV is defined as:
| (1) |
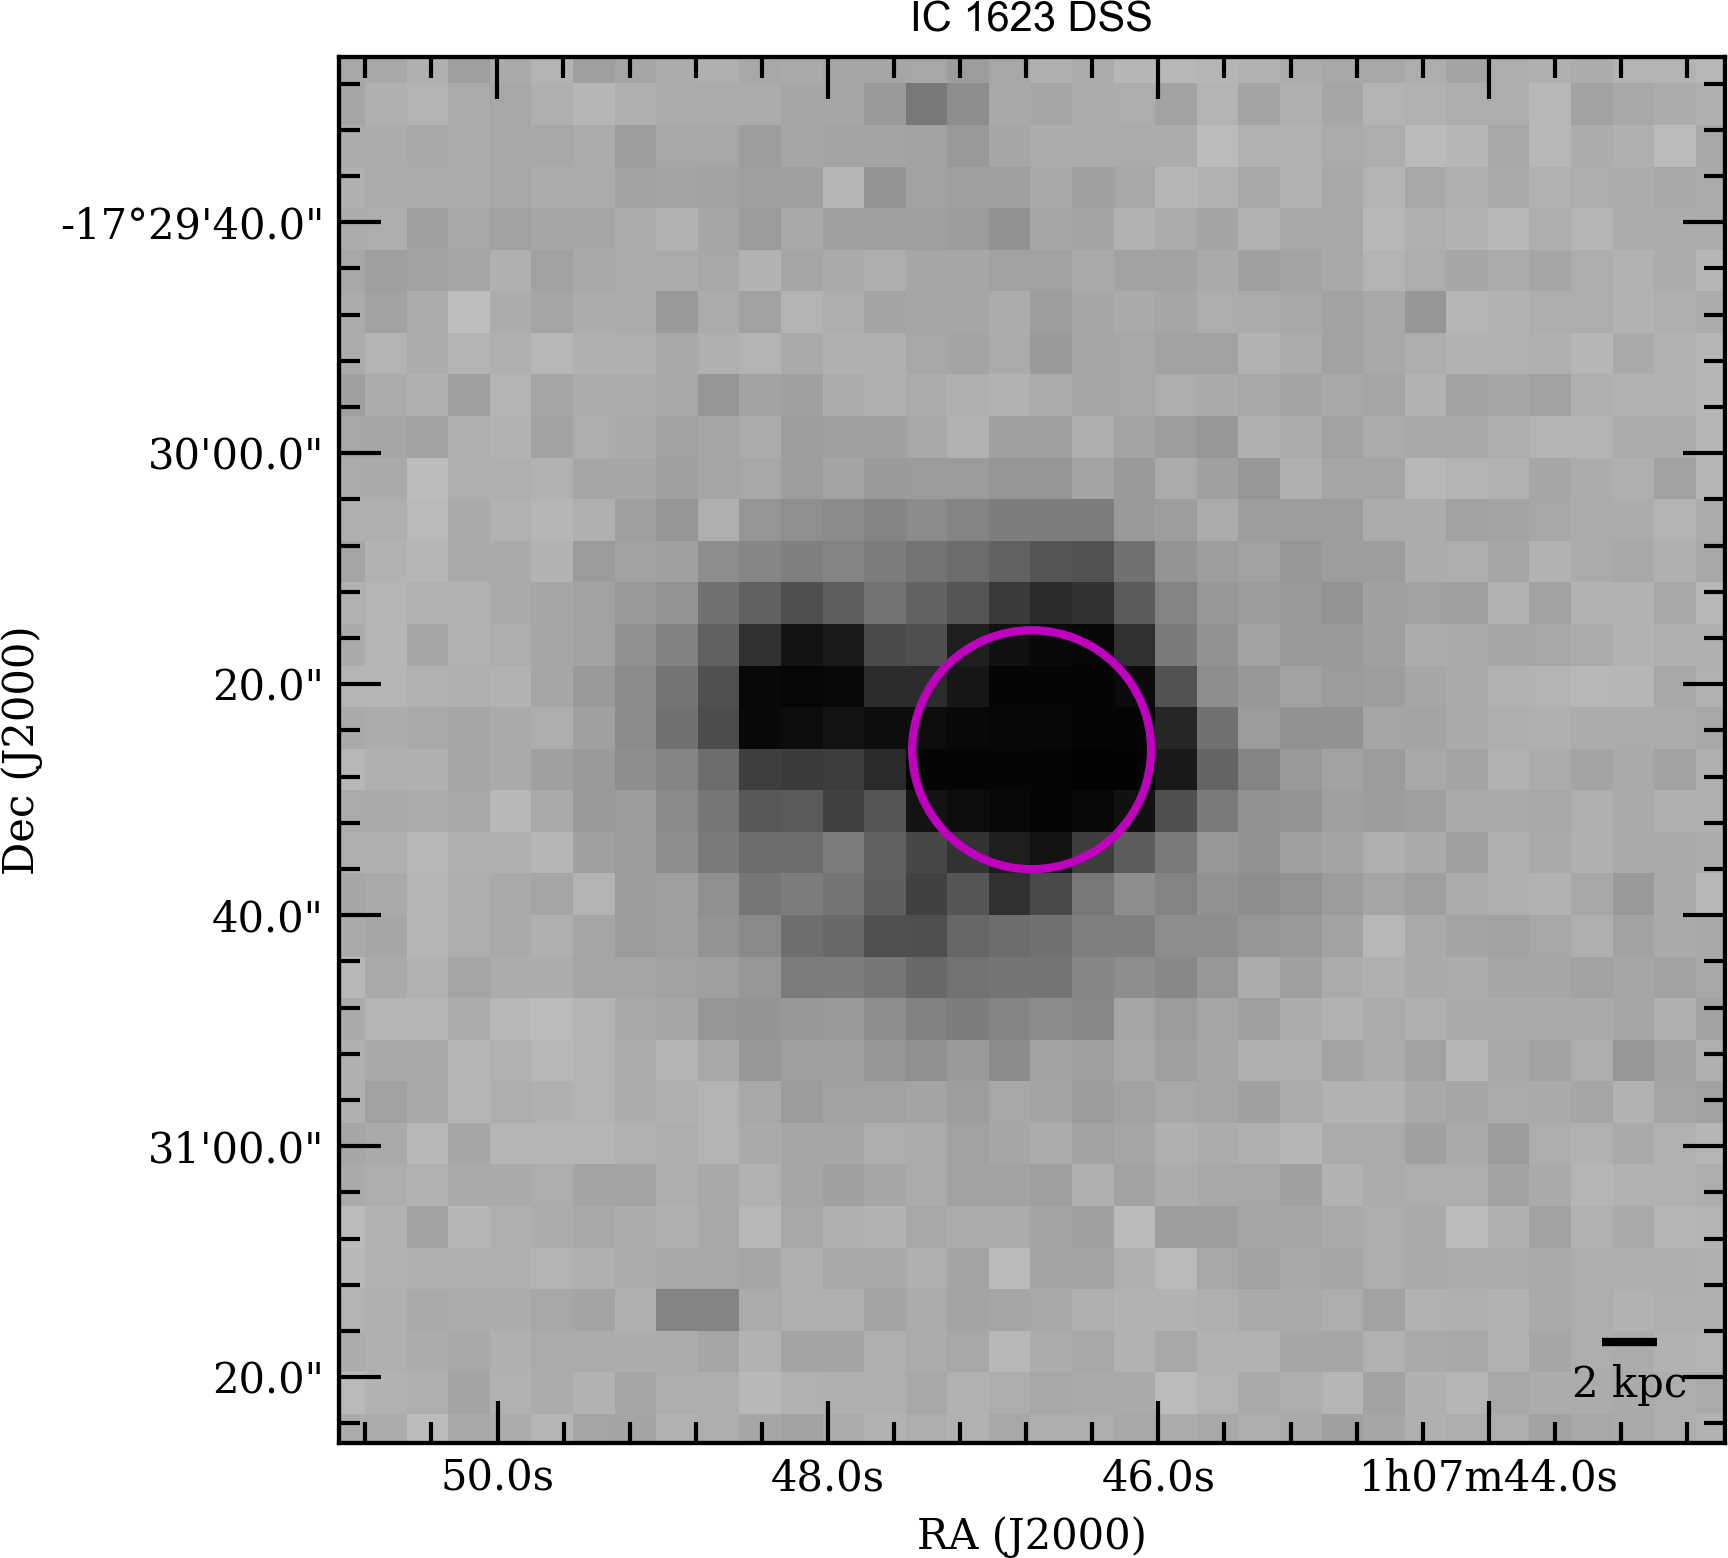
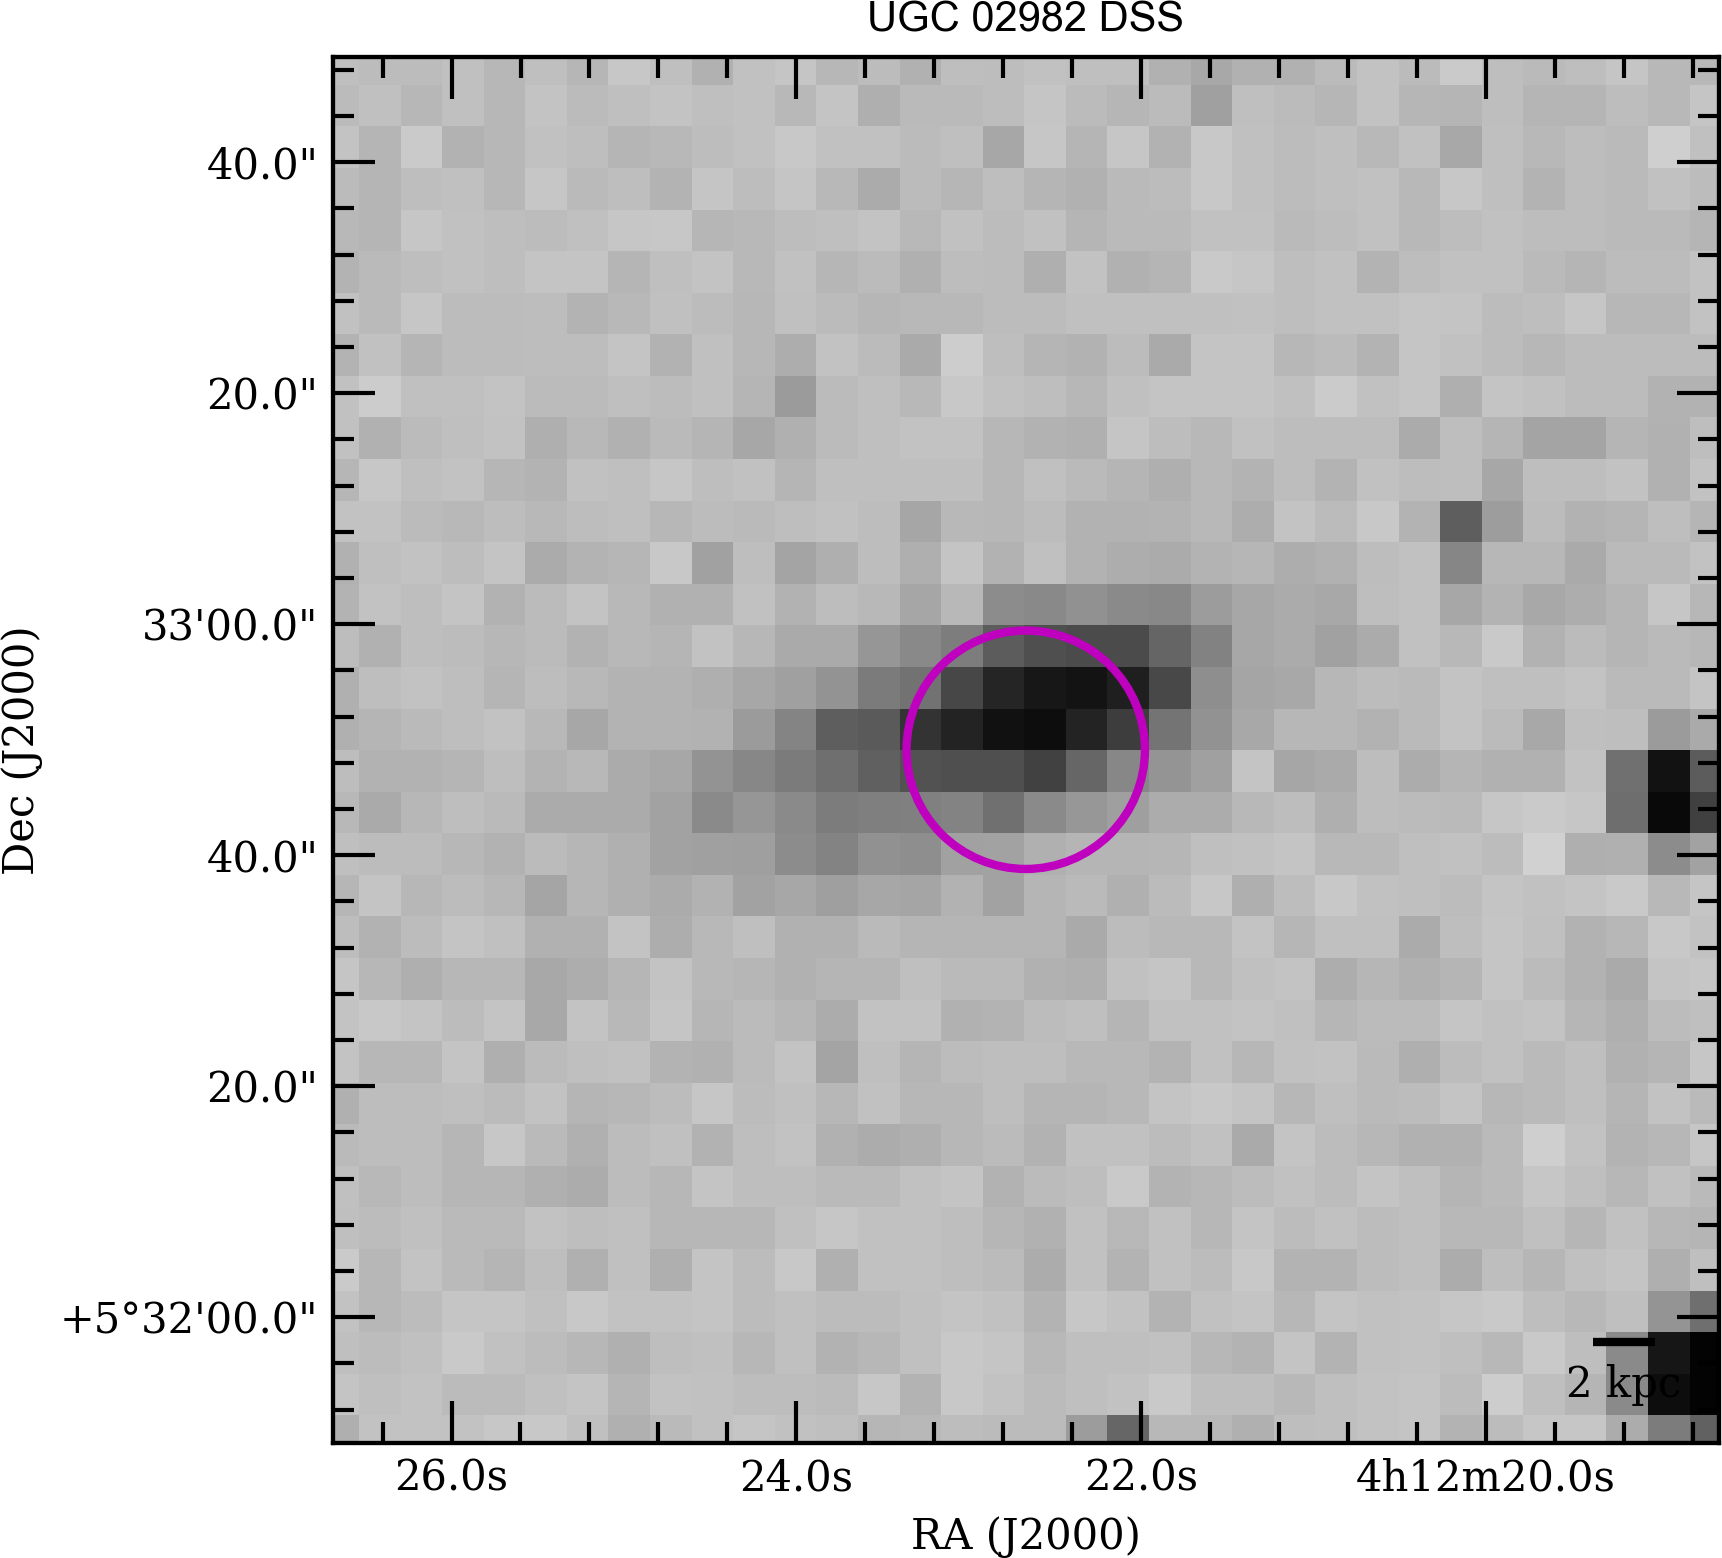
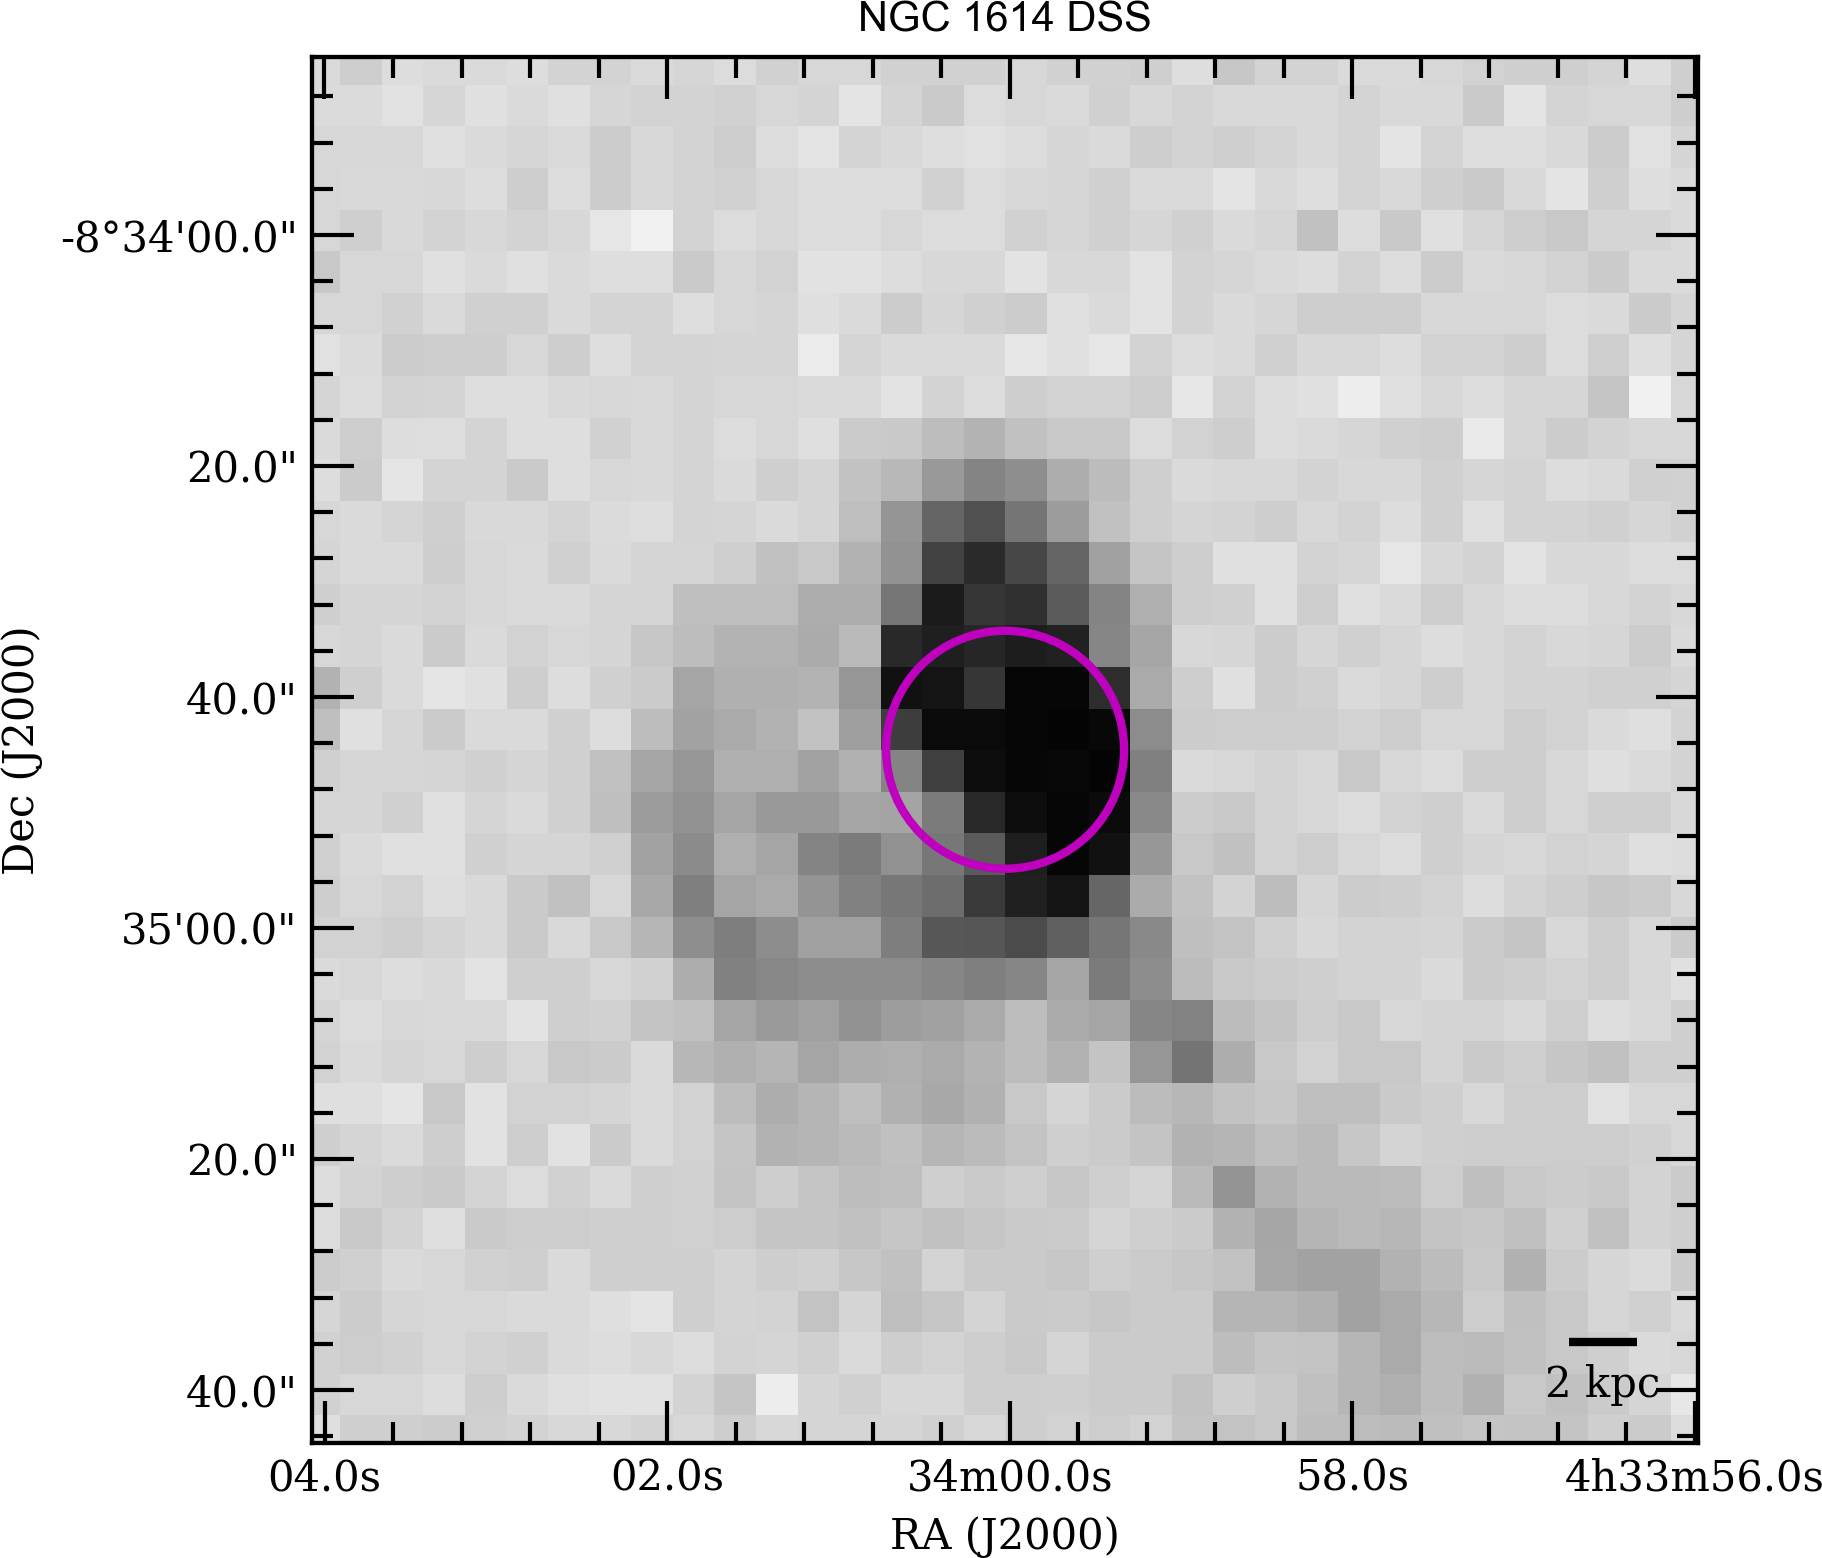
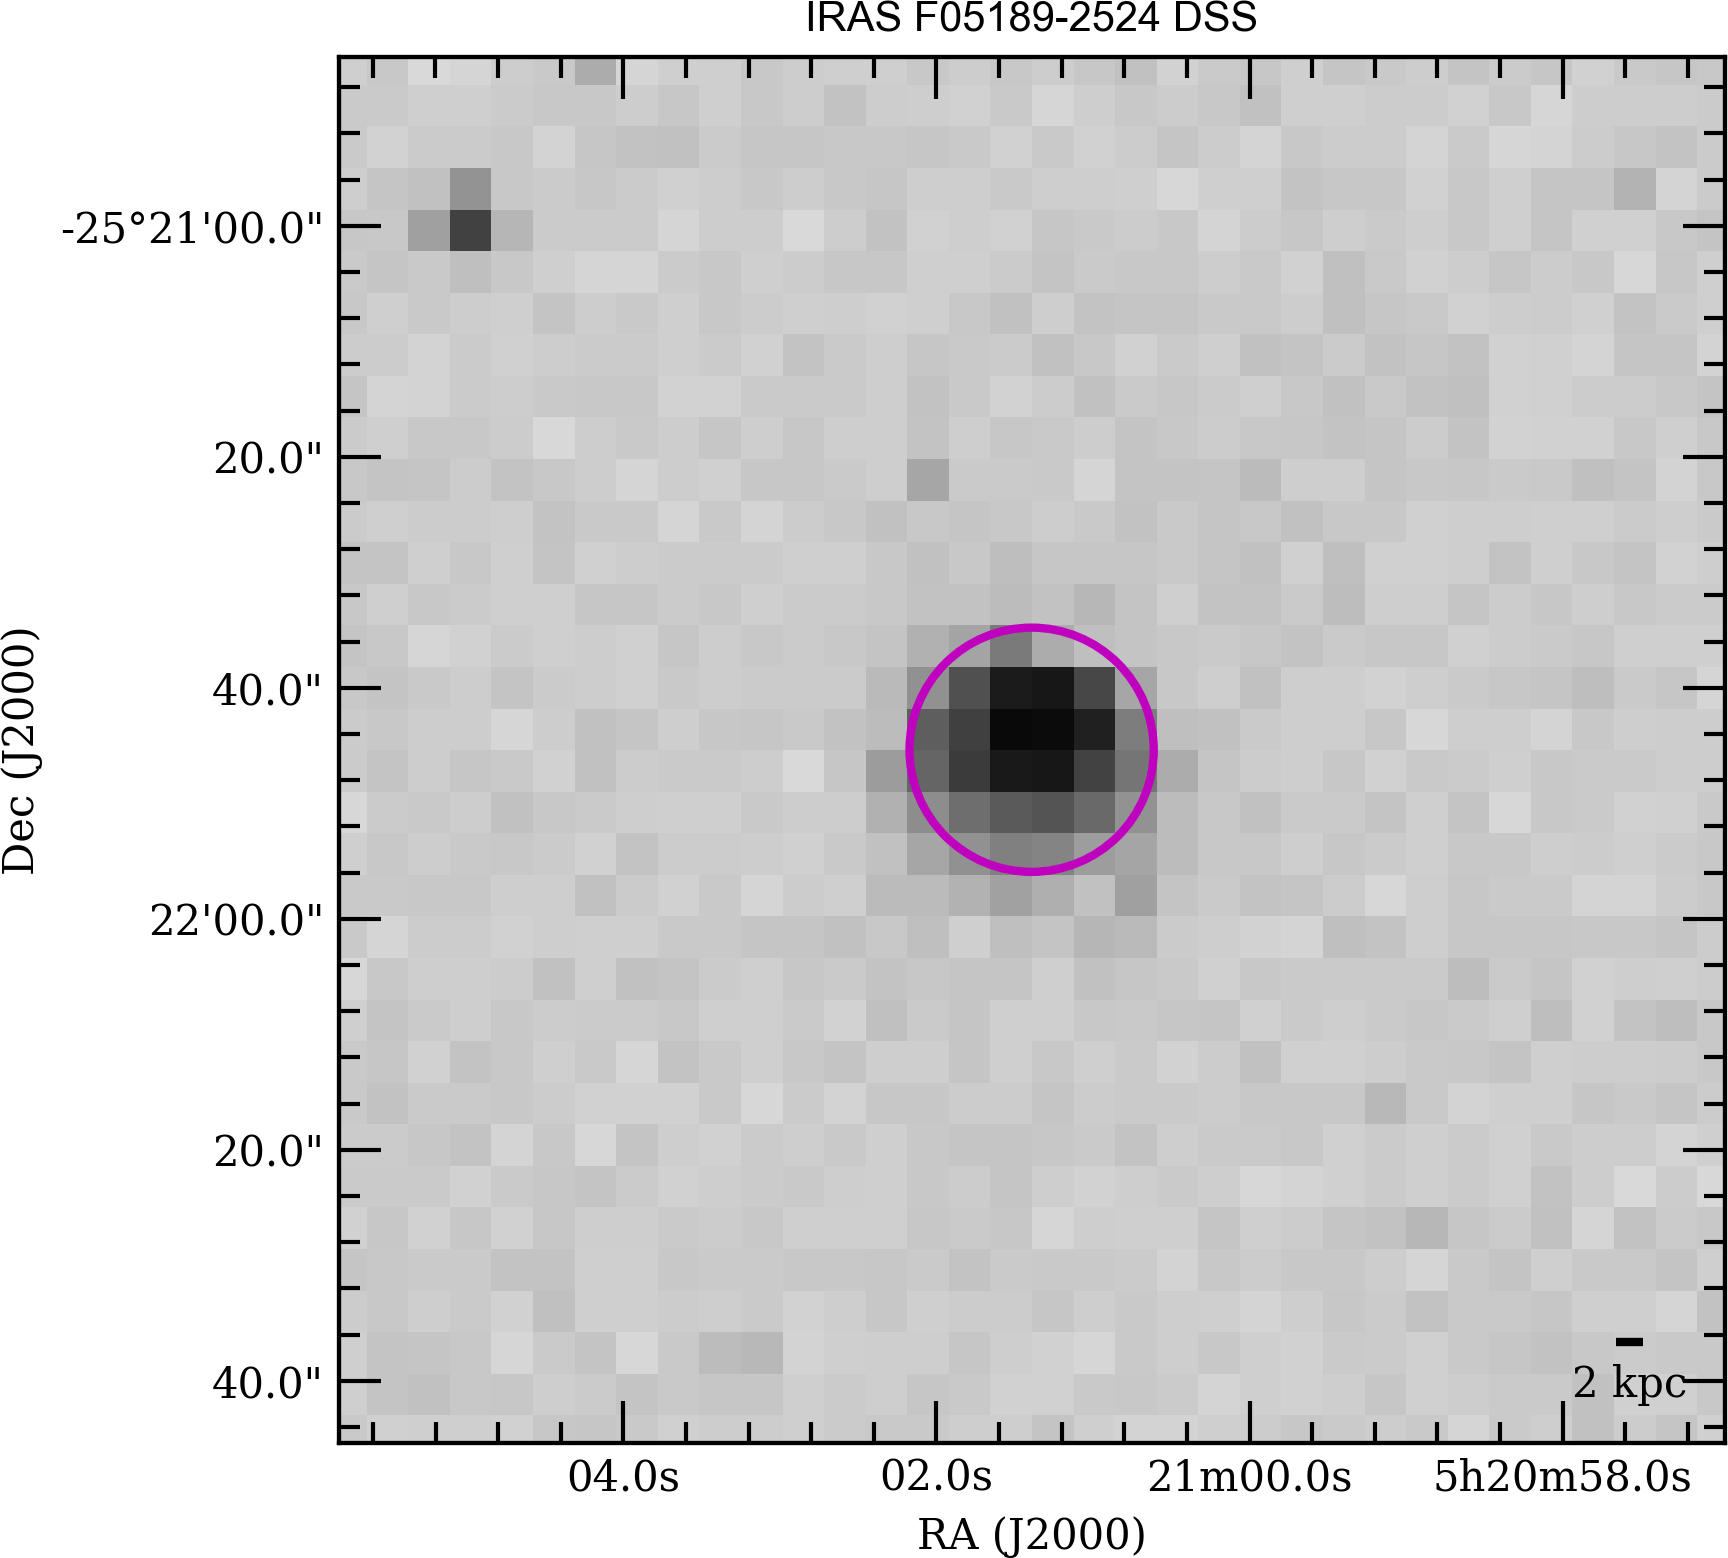
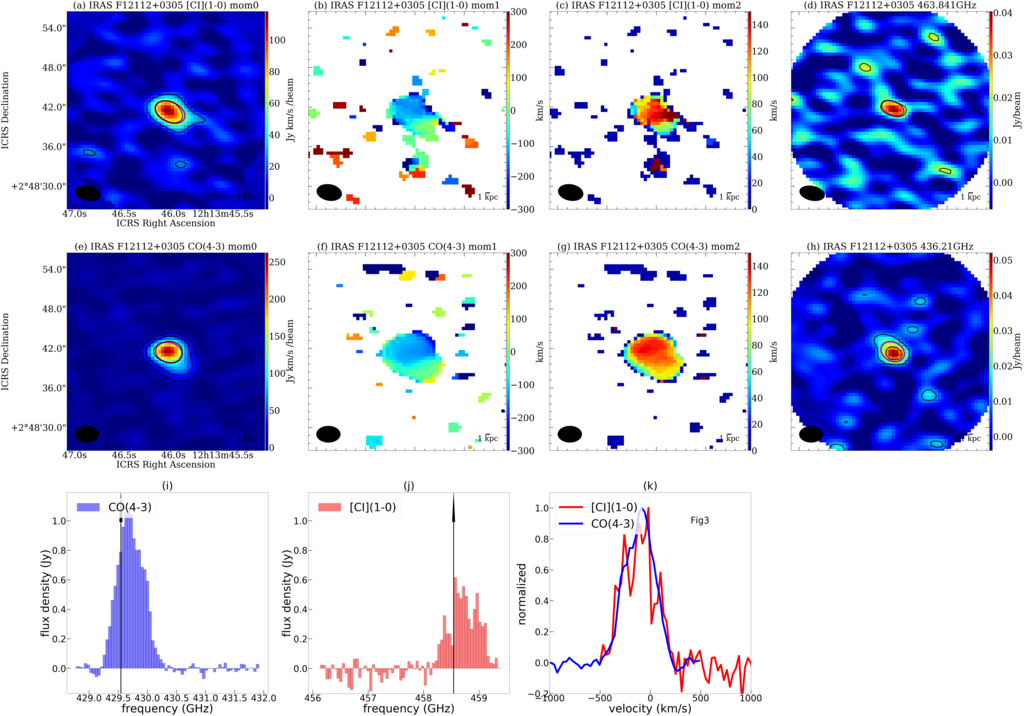
where is the observed wavelength and m is the antenna aperture. For example, the FoV are 201 at 480 GHz. For the nearest galaxy NGC 7552 and the most distant galaxy IRAS F12112+0305, 201 corresponds to 2.2 kpc and 29 kpc, respectively. The FoVs are shown in Figure A1.1. The typical baseline coverage is 8–47 m, which corresponds to an MRS of –, Table A.3). To estimate the possible recovered flux (RF) as a function of the source size, we used the task in CASA. The RF was 50 % when we assumed a 2D gaussian distribution with the FWHM=7″. If the FWHM is , the recovered flux is ; this means that our observation may not recover the total flux in the case of an extended gas and dust structure.
2.4 Data Reduction and Imaging
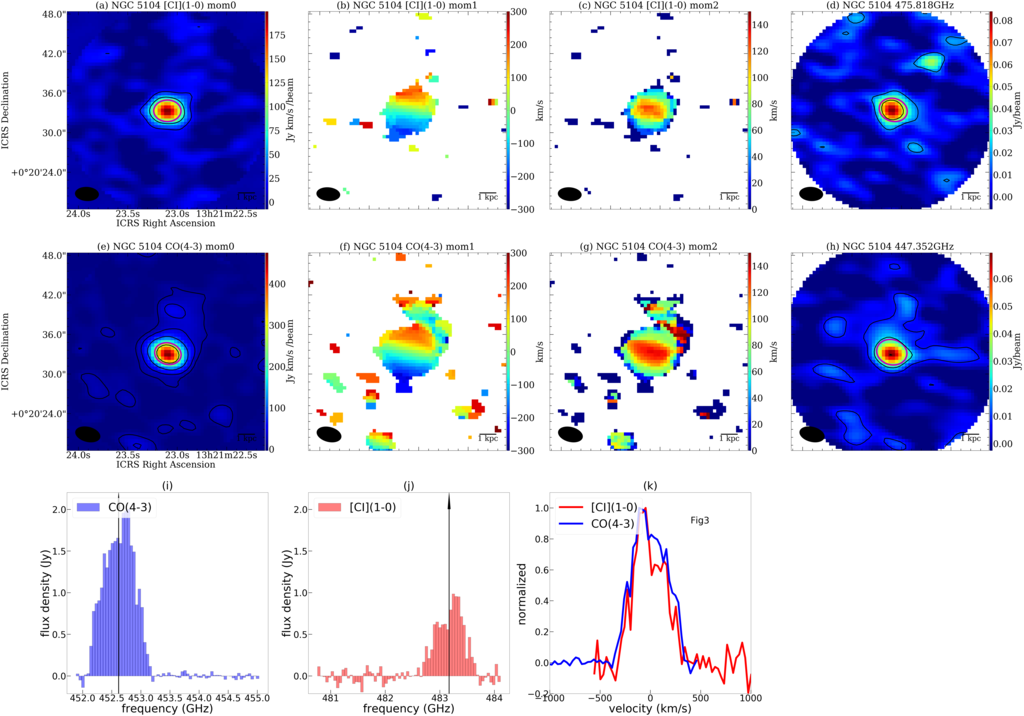
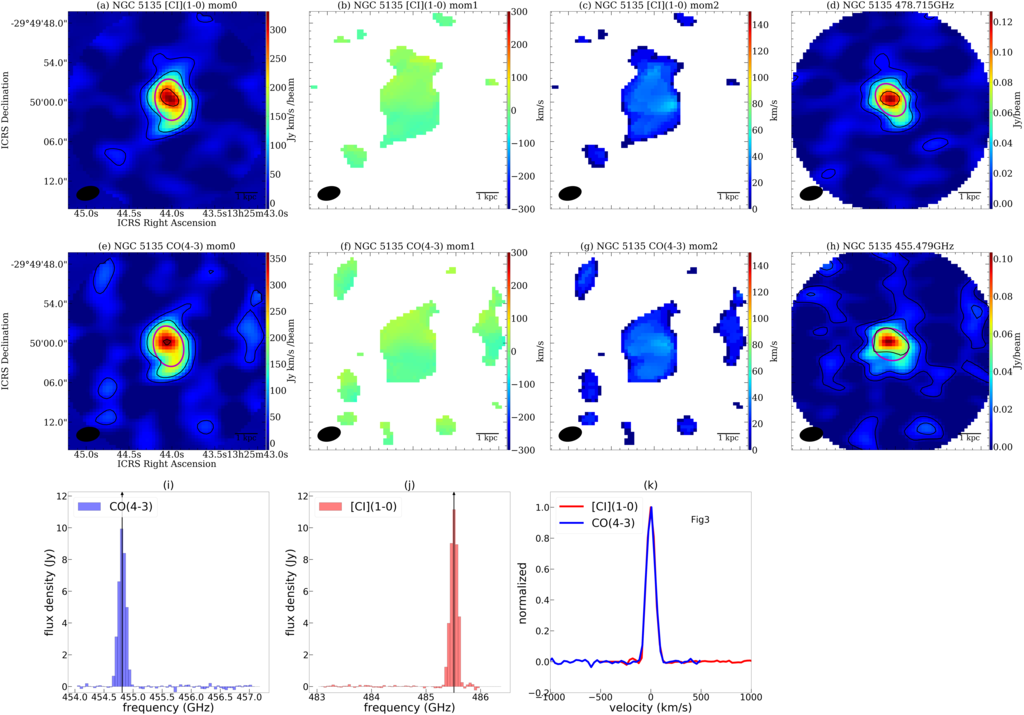
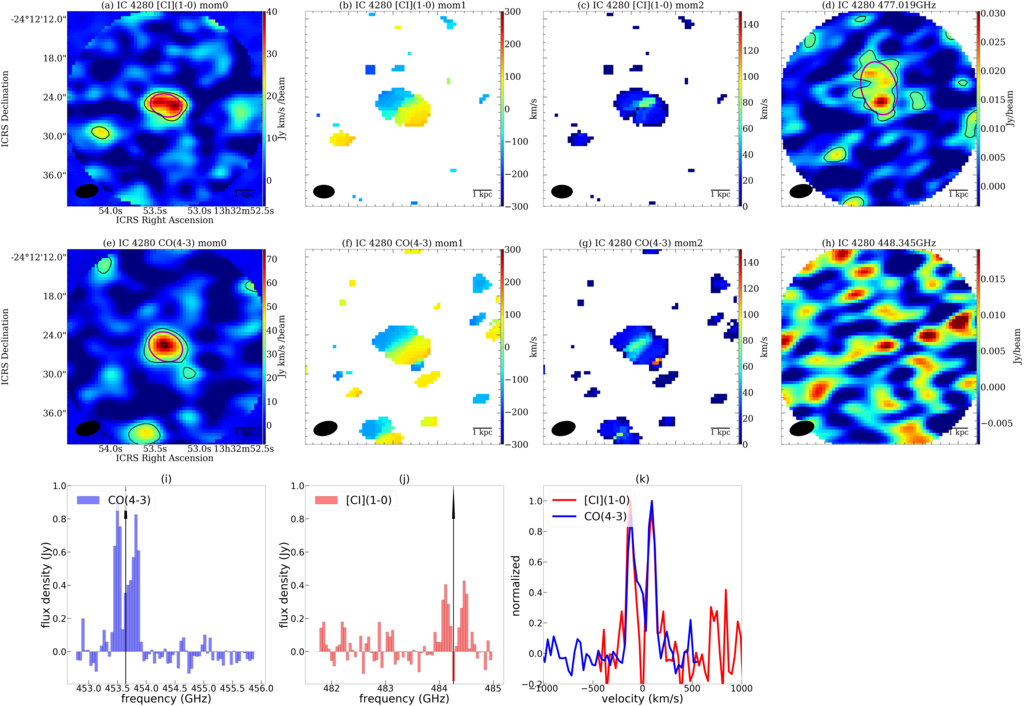
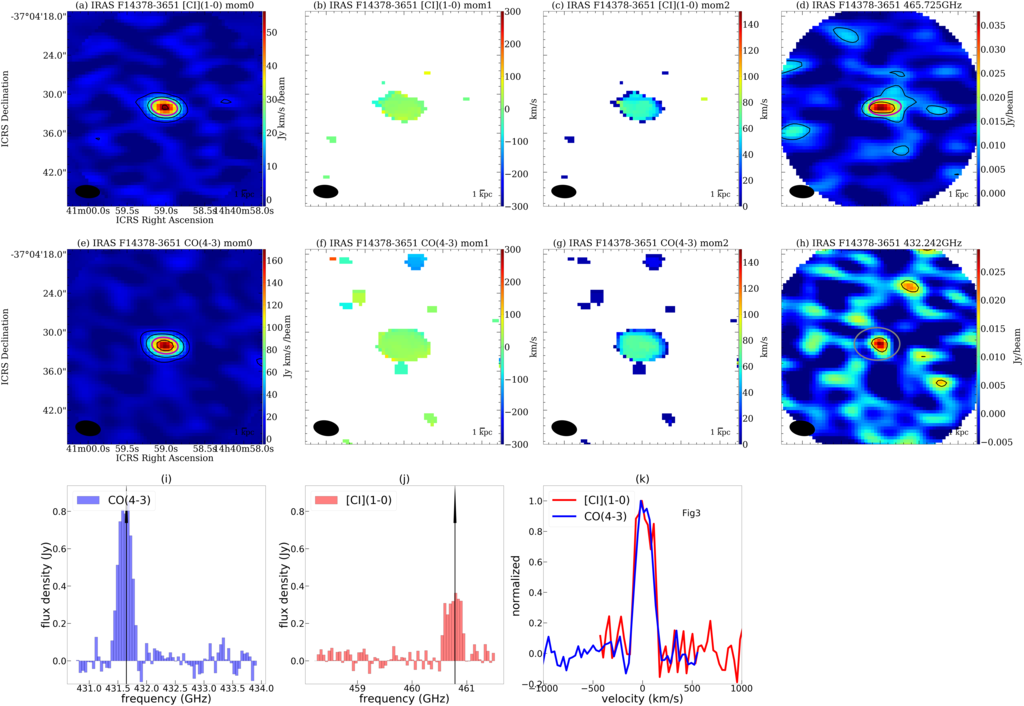
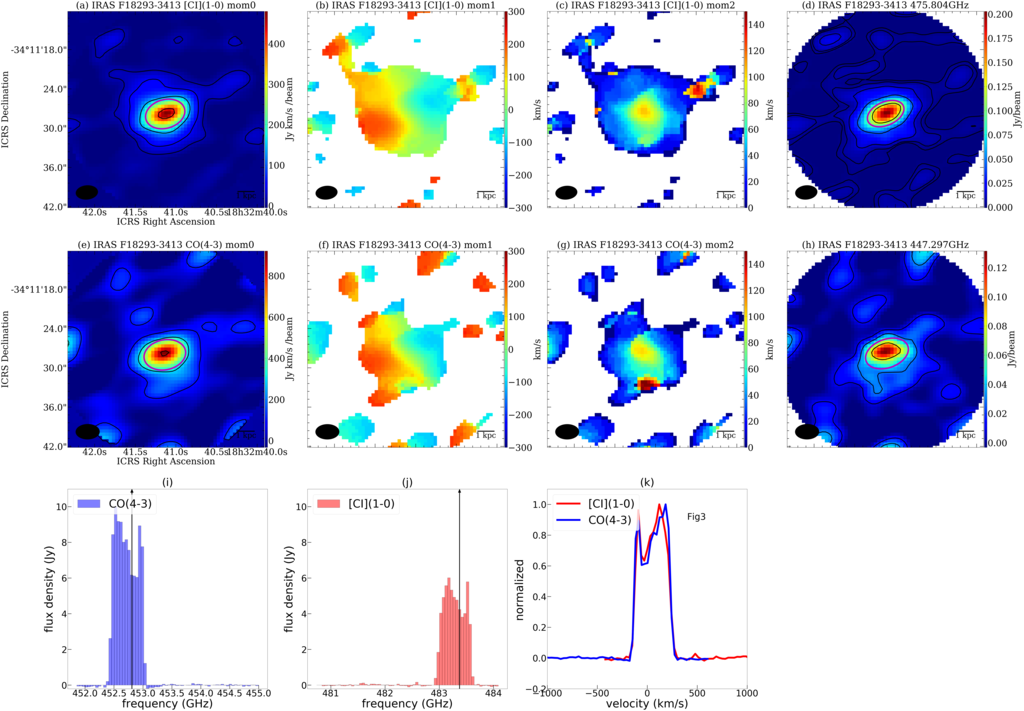
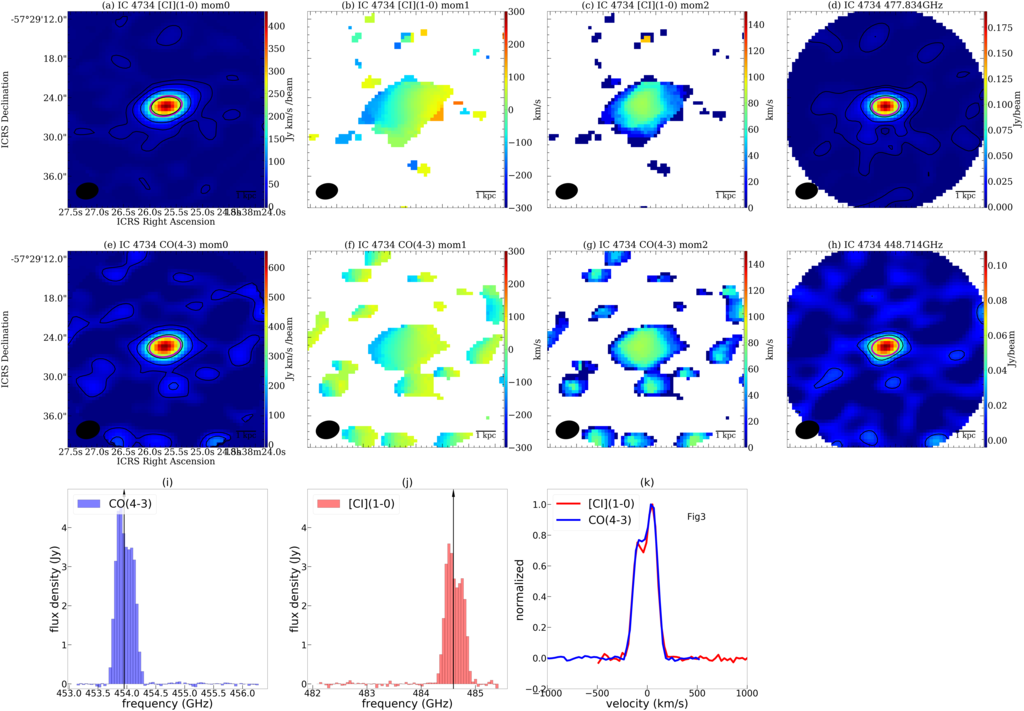
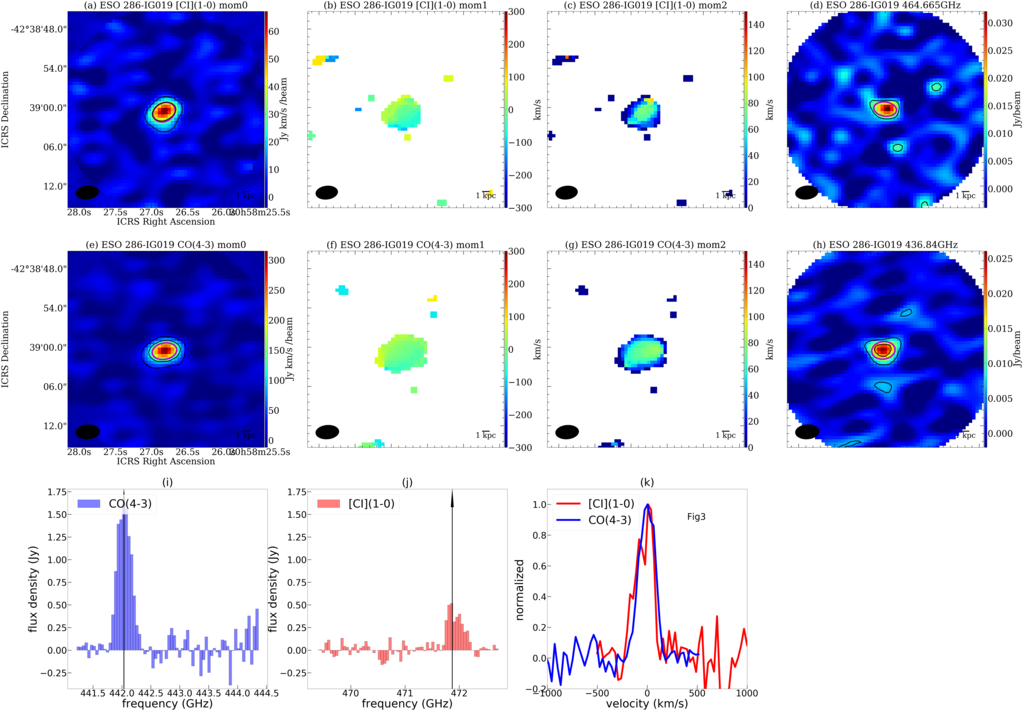
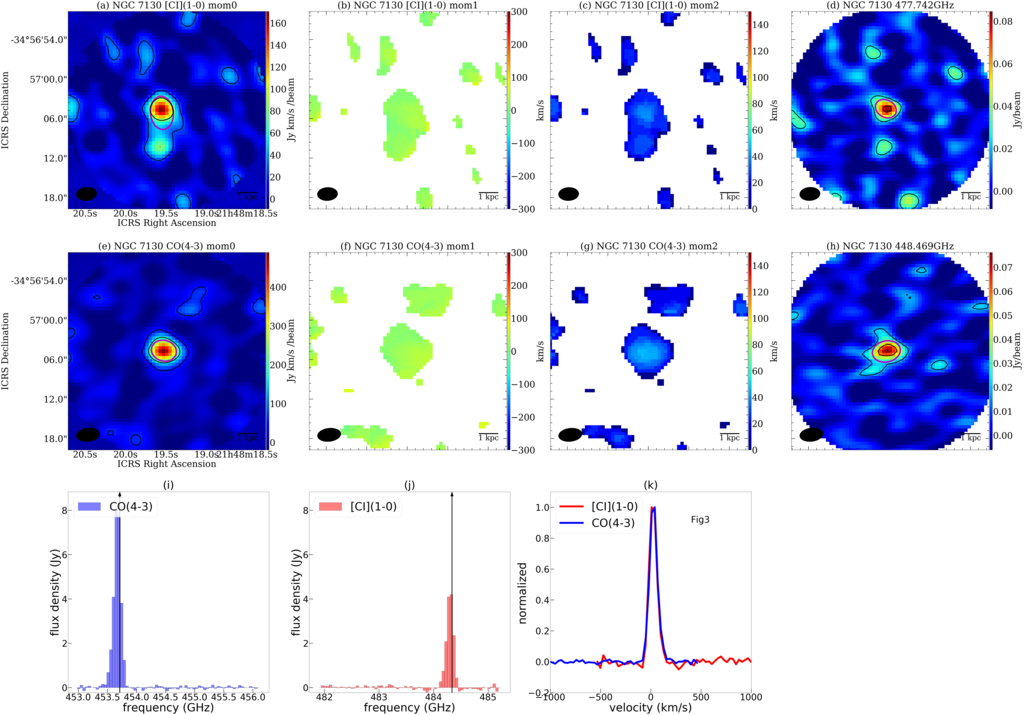
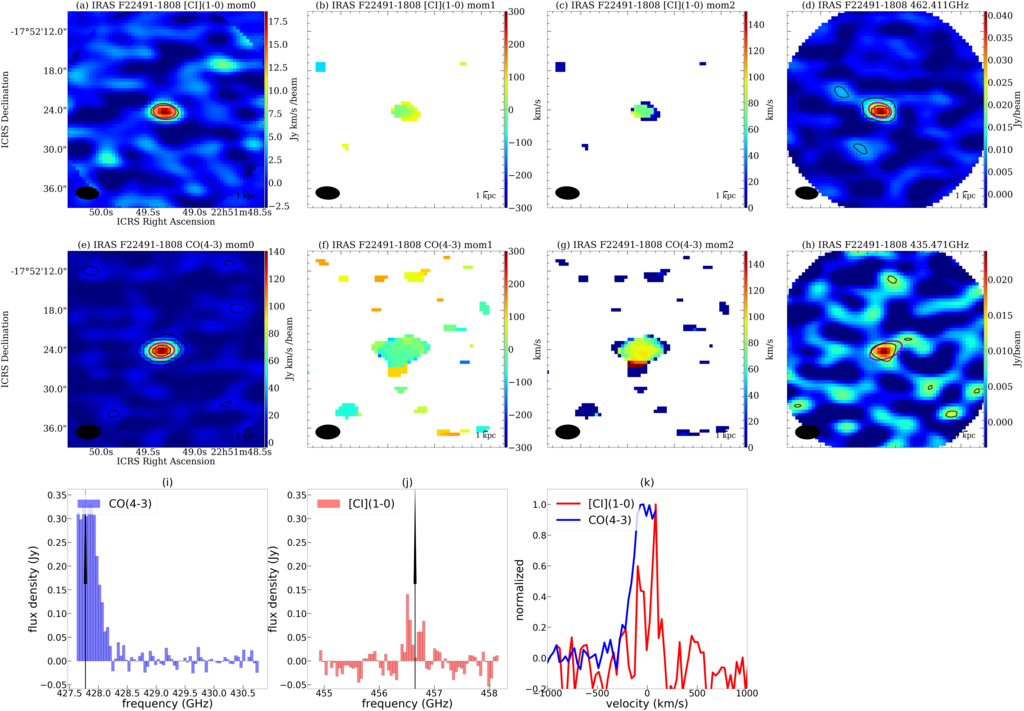
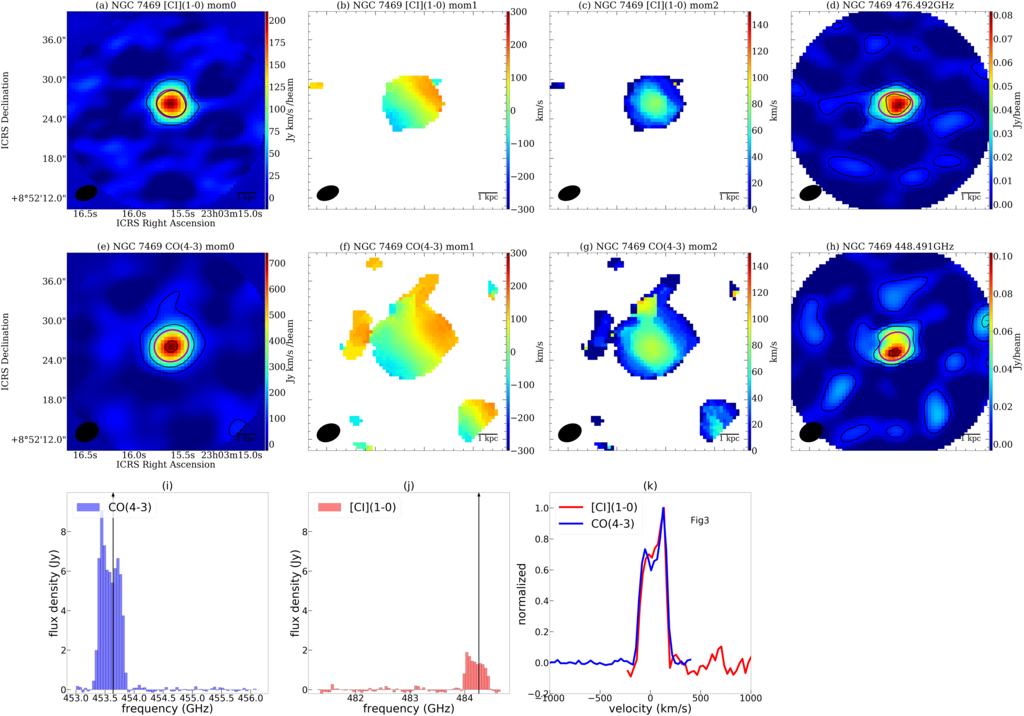
The calibrated visibility data were obtained by running the standard pipeline calibration scripts provided by ALMA using (McMullin et al., 2007). We used the various versions which are specified in each observation. The imaging processes were conducted by in (version 5.4.0-70) with a velocity resolution of 30 km s-1 for line emission, a cell size of 05, an image size of 80 pixels, and Briggs weighting with a robust parameter of 0.5. Clean masks for each channel were manually selected. The continuum was subtracted in the domain using in the task after manually inspecting the emission-free frequencies. Table A.4 summarizes the parameters of the reduced data (i.e., the synthesized beam, sensitivity, and the integrated velocity ranges). The sensitivity was calculated as the rms value of the residual image after the task. The velocity range for the moment maps was manually selected by checking the datacube. The velocity integrated intensity map (mom0), velocity field map (mom1), velocity dispersion map (mom2), and continuum maps, and the spatially integrated spectrum are shown in Figure A2.1.
3 Results
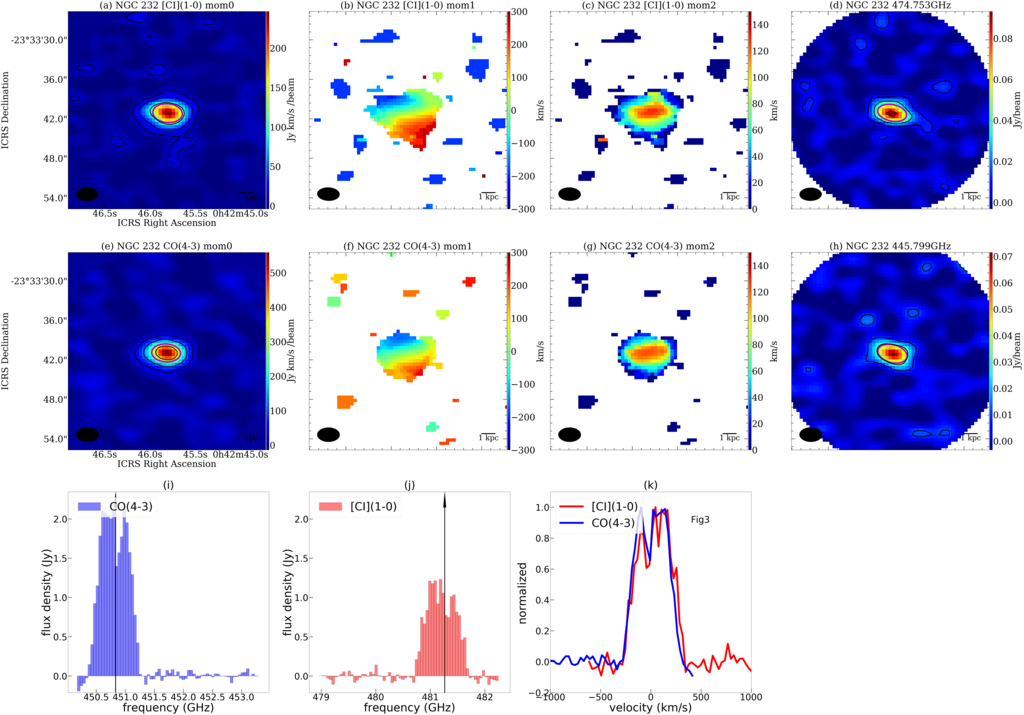
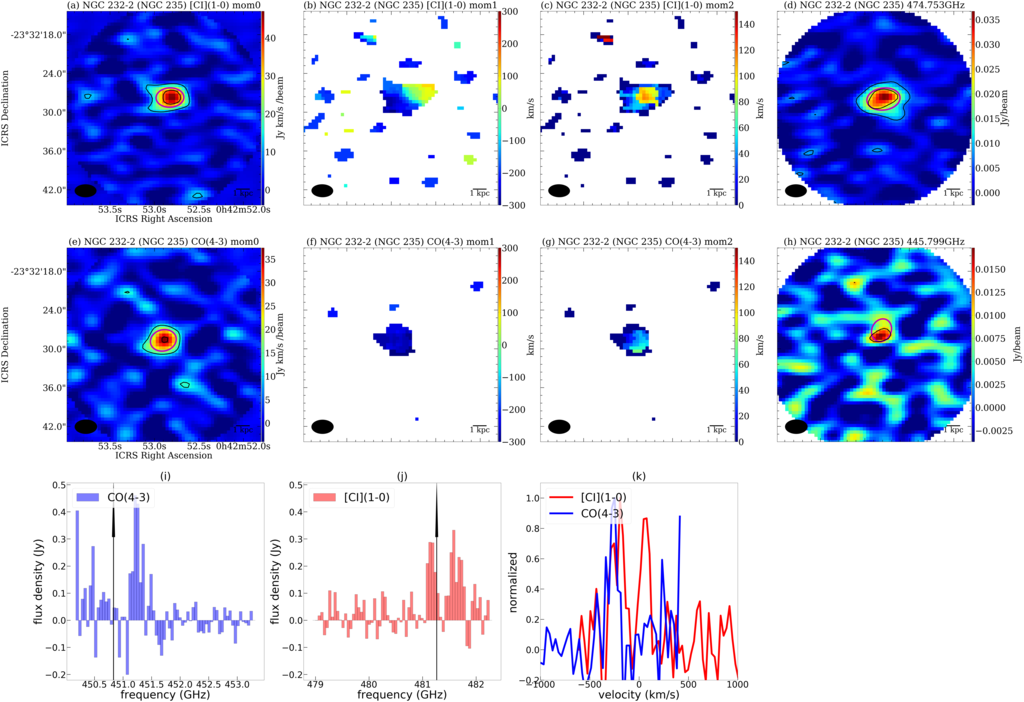
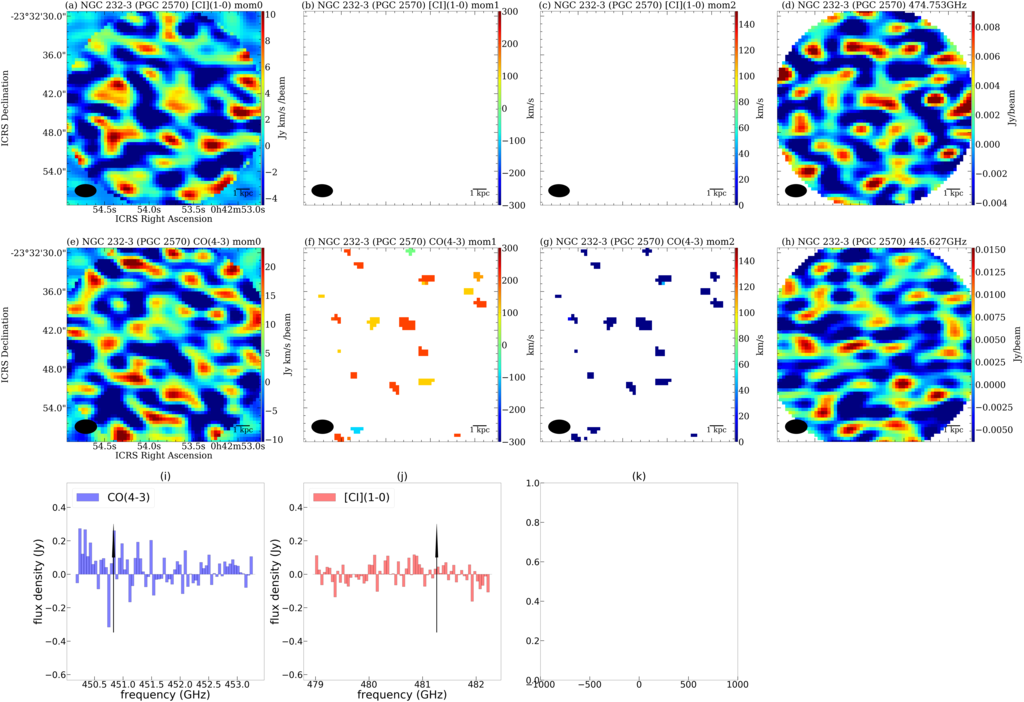
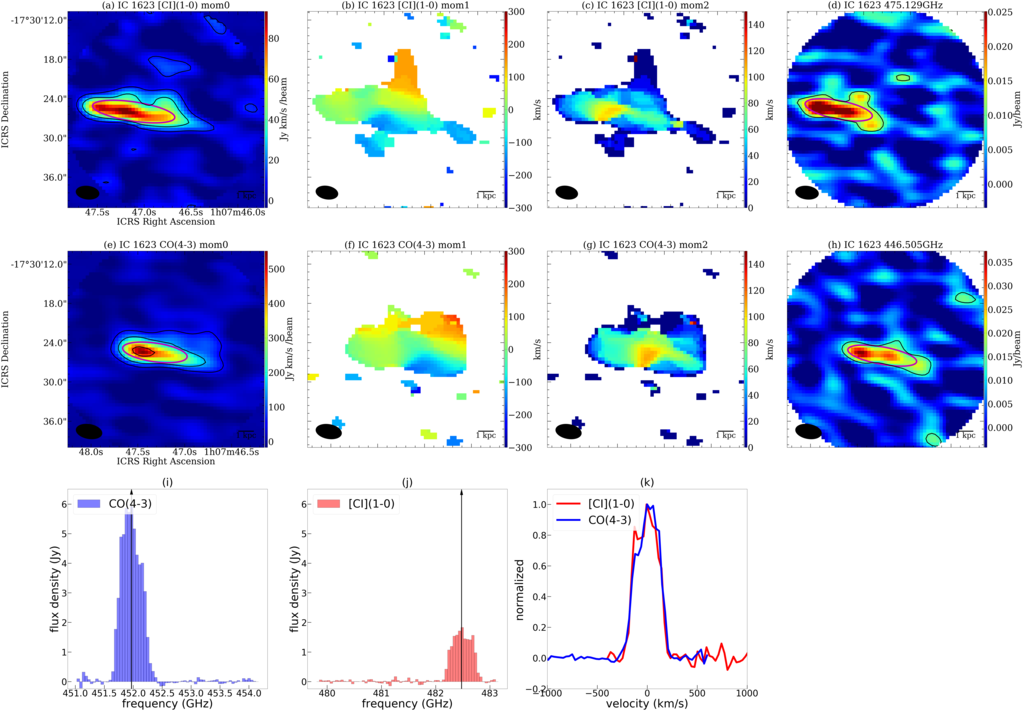
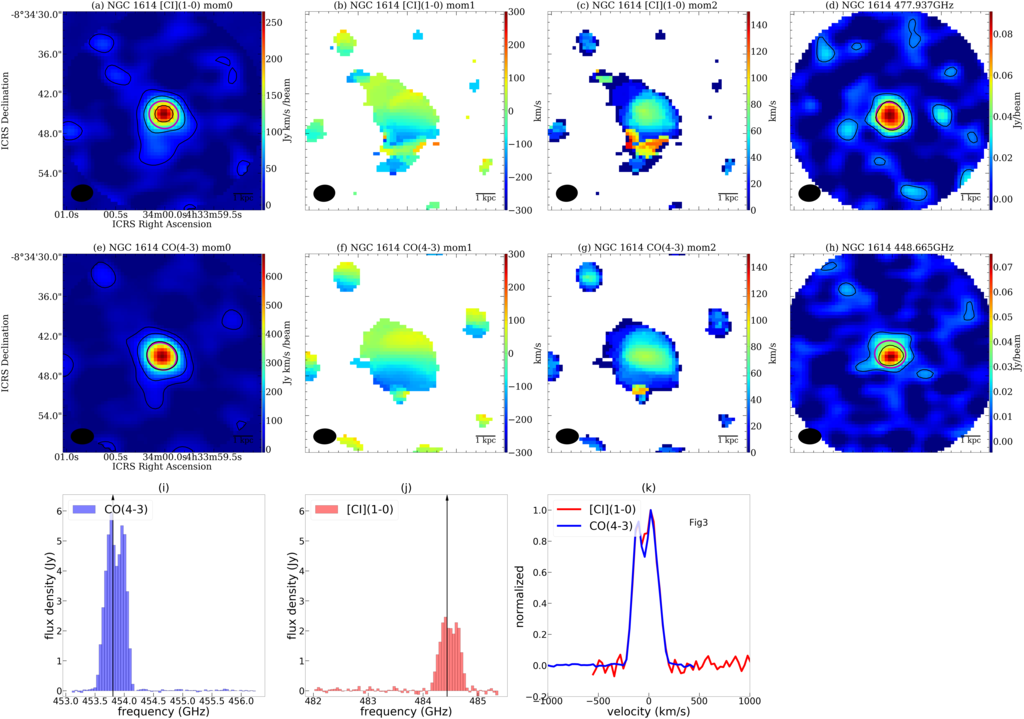
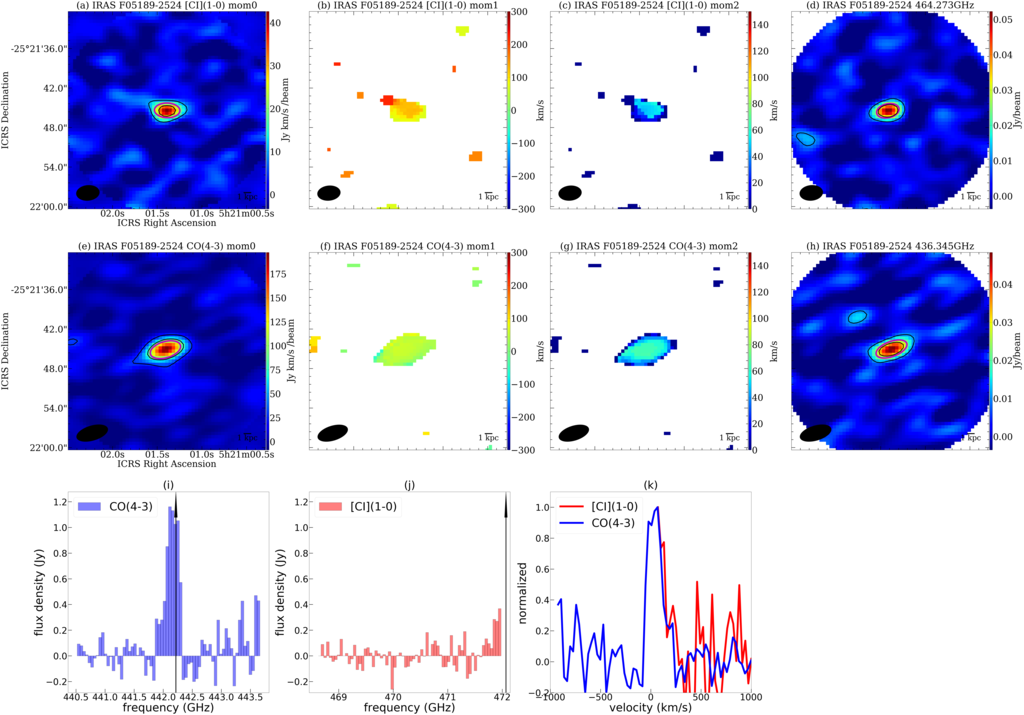
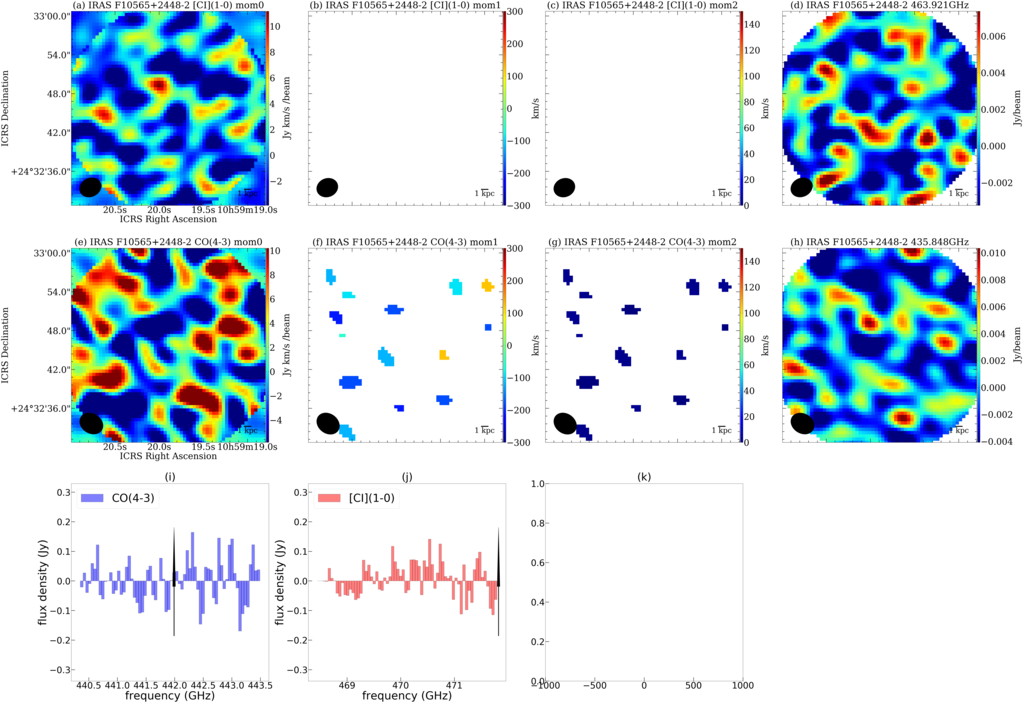
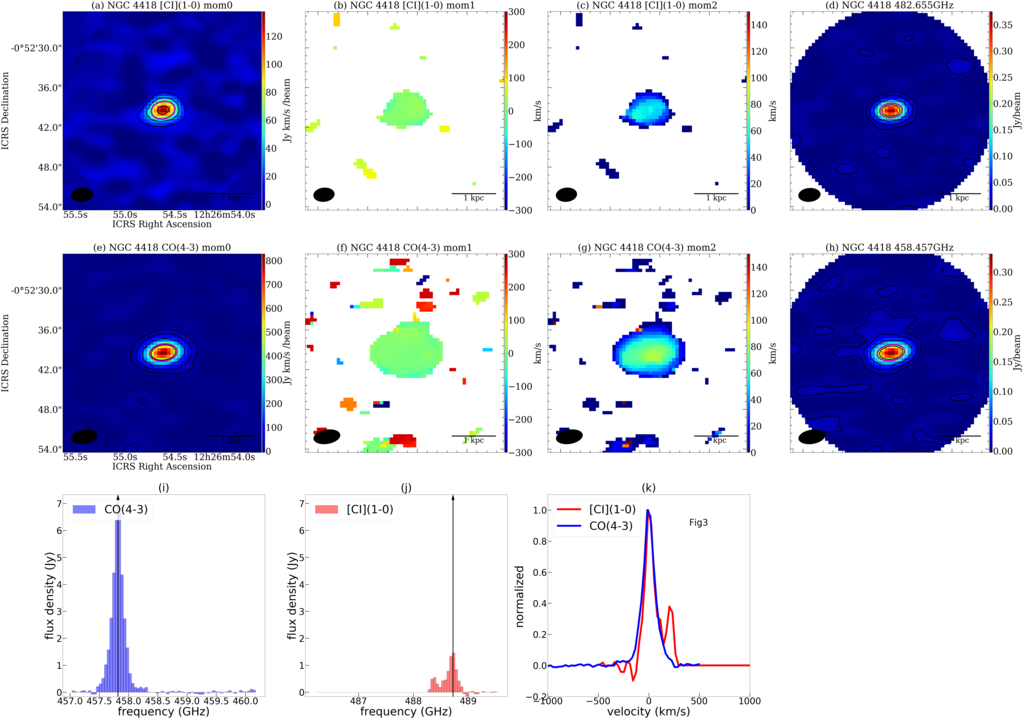
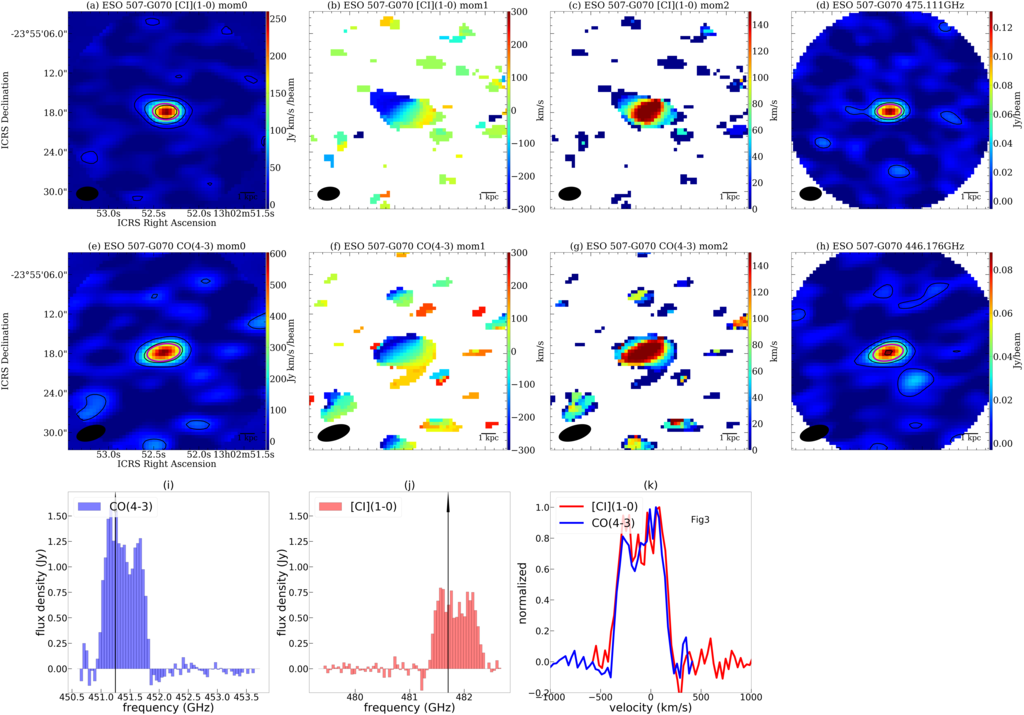
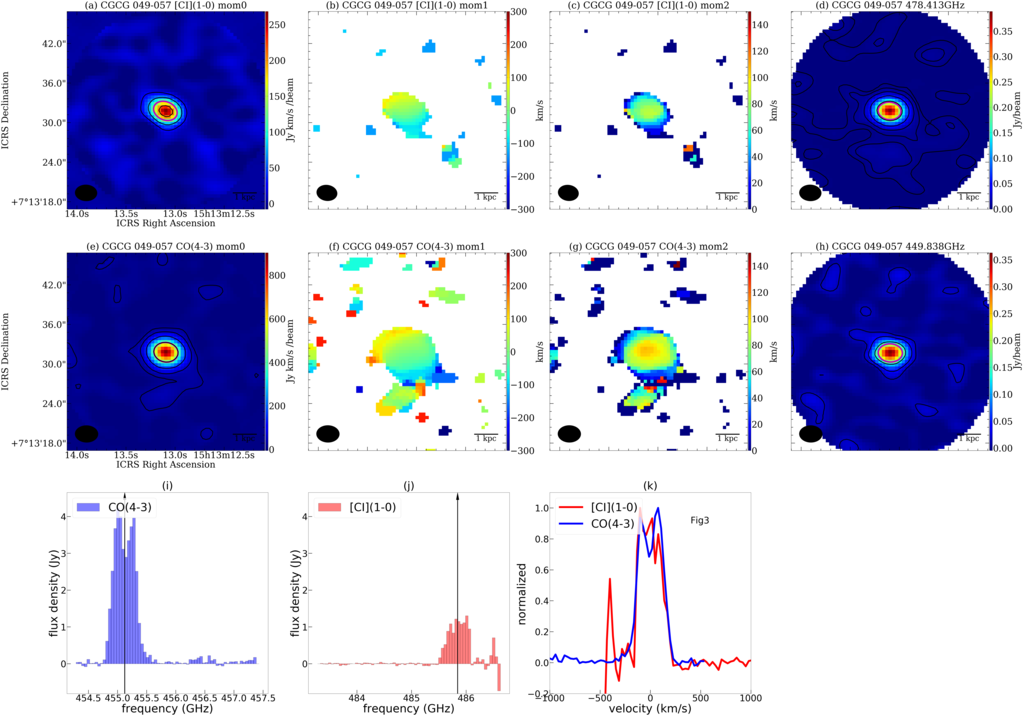
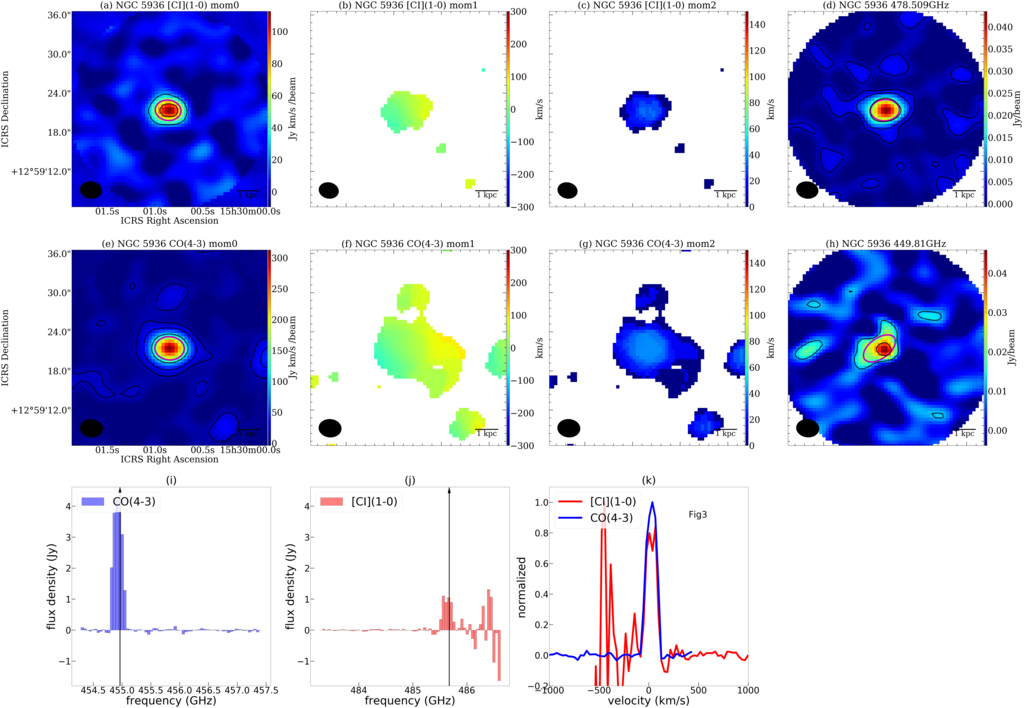
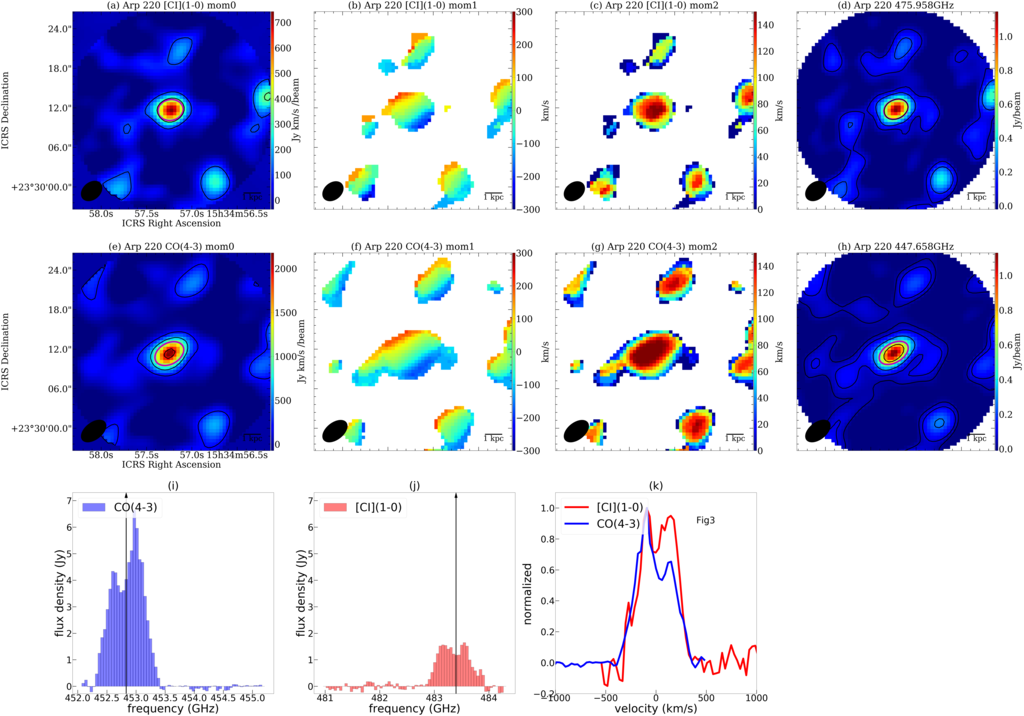
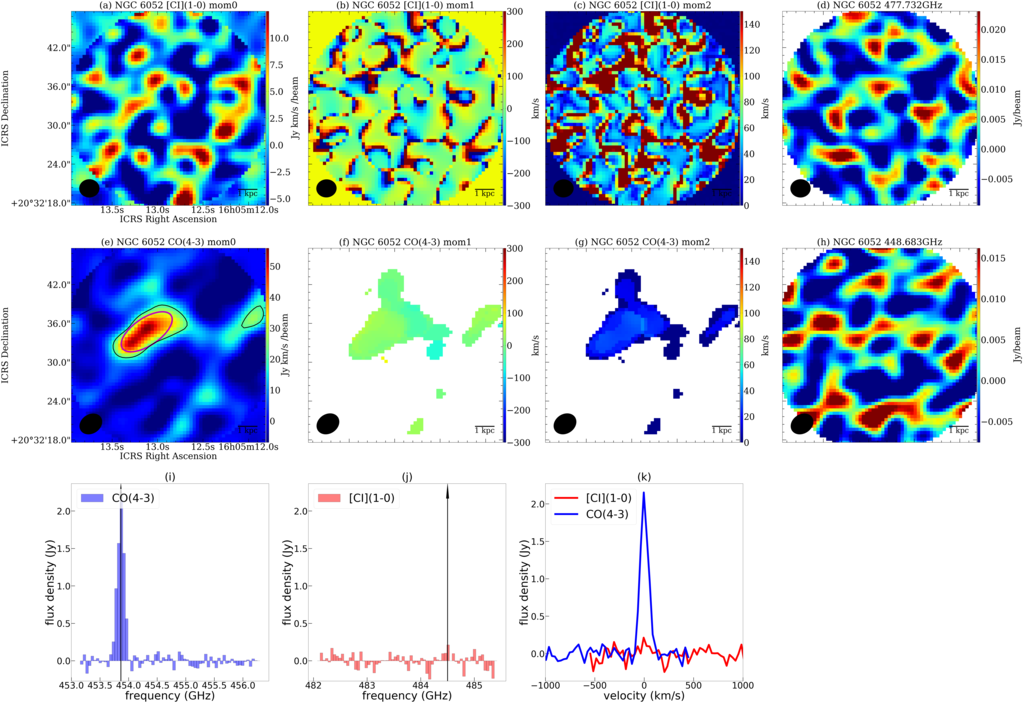
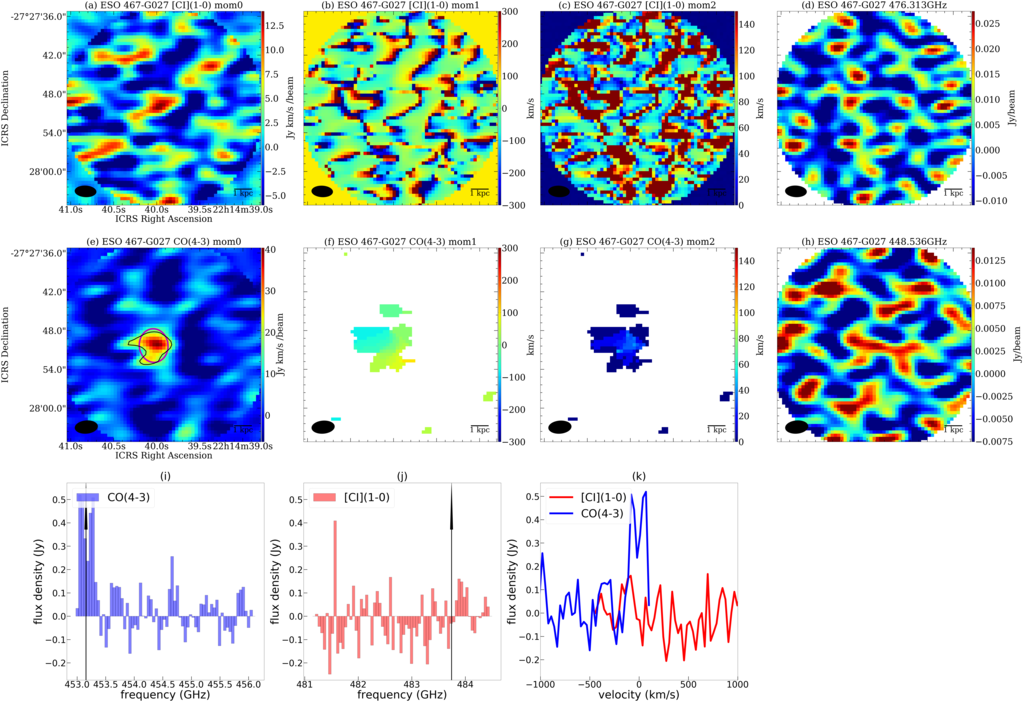
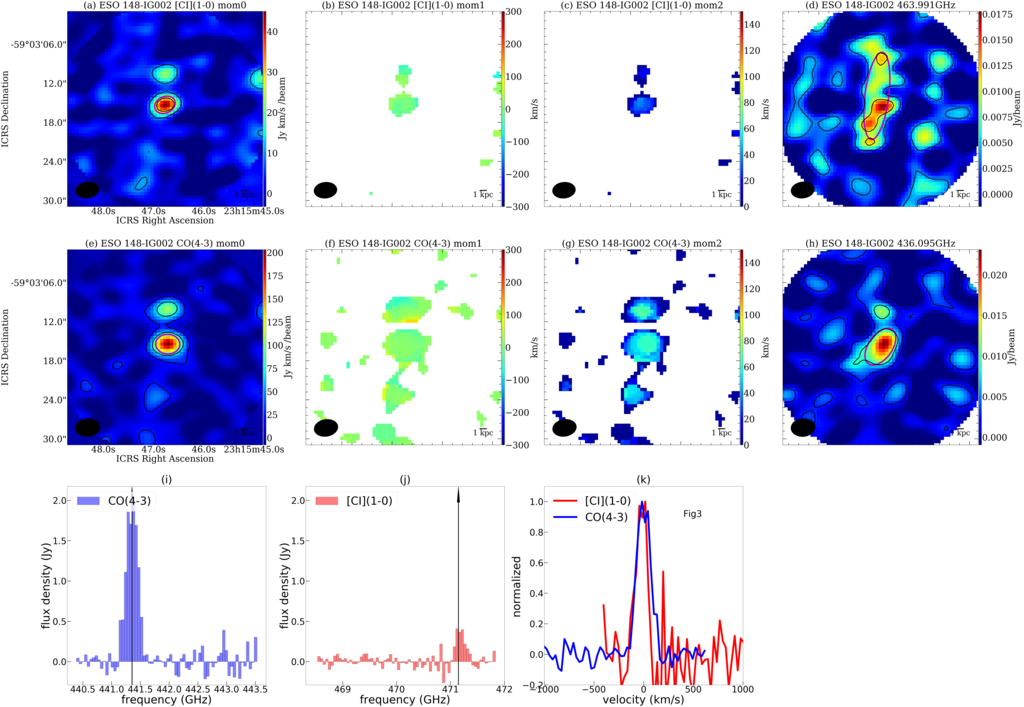
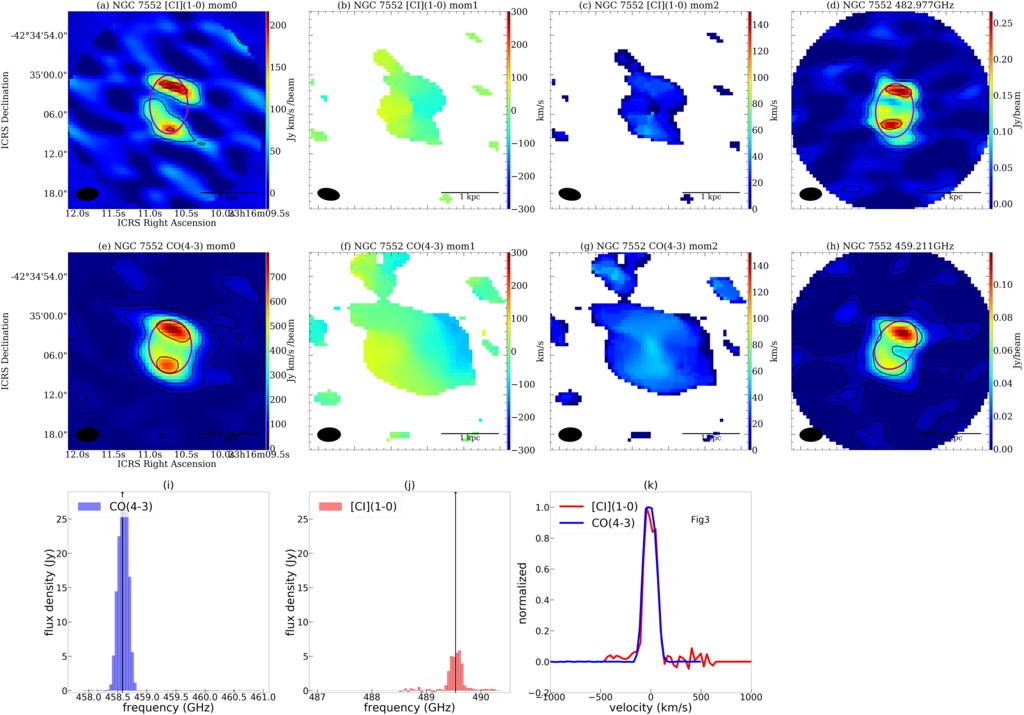
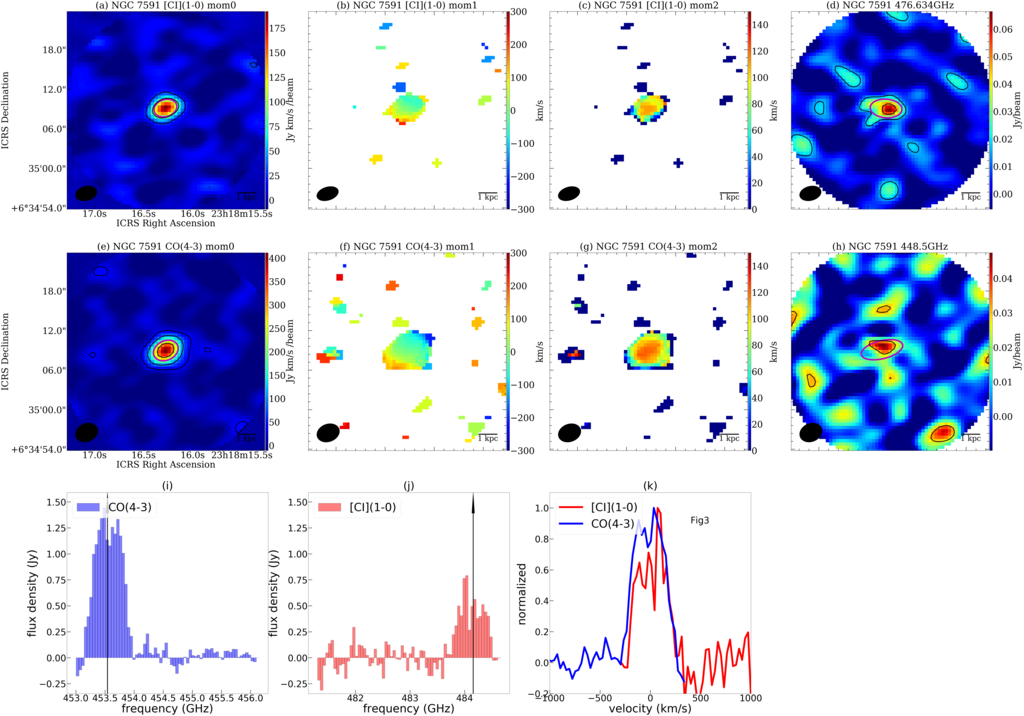
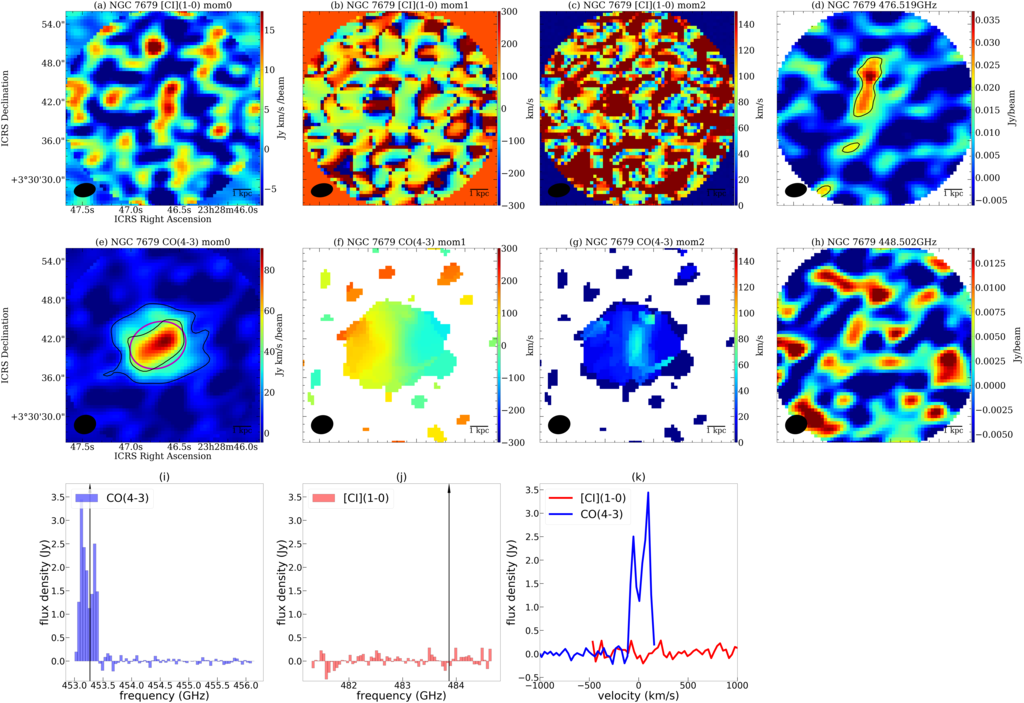
We detected CO (4–3) emission from 36 out of 39 observed galaxies, [C I] (1–0) from 32 out of 38 galaxies, and continuum emission from 35 out of 41 galaxies. CO (4–3) emission was not detected in NGC 232-3, IRAS F10565+2448-2, and ESO 069-IG006-2, which are fainter galaxy pairs. In the case of NGC 6052, NGC 7679, and ESO 467-G027, [C I] (1–0) and continuum emission were not detected while the CO (4–3) emission line was detected. The details are mentioned in Michiyama et al. (2020) for NGC 6052 and Section 4.1 for NGC 7679. ESO 467-G027 also shows weak [C I] (1–0) but the spatial and velocity distribution of the CO (4–3) line is uncertain (Figure A2.1) owing to the observation condition. Therefore, we used it just as a candidate for [C I]-faint galaxies. More sensitive observations are needed to investigate ESO 467-G027 in detail. In the case of IC 4280, both CO (4–3) and [C I] (1–0) were detected but continuum emission were not.
3.1 Flux
The total velocity integrated line flux ( in Jy km s-1), based on [C I] (1–0) and CO (4–3) moment 0 maps, is derived by using the“” task in , which identifies the source automatically, conducts 2D Gaussian fitting, and calculates the total flux and the statistical errors (). The task was used on the moment 0 map before primary beam correction. To estimate the correction factor due to the primary beam response, we also measured the flux (by the task in ) using the map before/after primary beam correction with the same aperture (1.5 larger than the FWHM size derived from the task). The ratio between the two flux is used as a primary beam correction factor of total flux. The continuum flux density is also derived from the “” task in the same manner. A summary of the line flux and continuum flux density is presented in Table A.5 and A.6. The full width at half maximum (FWHM) was derived from a single Gaussian fitting of the spectrum shown in Figure A2.1. The errors in Table A.5 are calculated by:
| (2) |
for lines and
| (3) |
for continuum emission. A factor of 0.3 indicates a systematic error for absolute flux calibrations. The absolute flux accuracy is expected to be 10 % for Band 8 by ALMA main array observations555https://almascience.nao.ac.jp/documents-and-tools/cycle6/alma-proposers-guide. However, the actual performance of the flux calibration has not been explored for the ACA standalone mode in Band 8 by the ALMA observatory. We adopt a conservative systematic error value of 30 %. When the does not work correctly due to side lobes, we manually selected the aperture (e.g., NGC 5990, ESO 148-IG002, IRAS 09022-3615, IRAS F14378-3651, ESO 148-IG002); the details are explained in Section A.3.
In the case of non-detection, the upper limit of the integrated line flux can be derived from
| (4) |
for lines and
| (5) |
for continuum emission, where is the RMS level of the channel map, is the velocity resolution, , is the the number of pixels for the source size, and is the number of pixels for the synthesized beam. The equations are from Hainline et al. (2004). If CO (4–3) is detected and [C I] (1–0) is not, we assume that and of [C I] (1–0) are the same as CO (4–3), where and are calculated based on the FWHM value of the velocity width and source size measured in Table A.5. If both CO (4–3) and [C I] (1–0) are not detected, we assume that the FWHM of line width is 150 km s-1 and . However, these upper limits were not included in the discussion section. We note that some [C I] (1–0) emission is on the edge of the spectral window because of the incorrect redshift entered in observation requests in some galaxies (e.g., IRAS F05189-2524). In this case, we assume the same line profile as CO (4–3) to calculate the total [C I] (1–0) flux.
3.2 Missing Flux
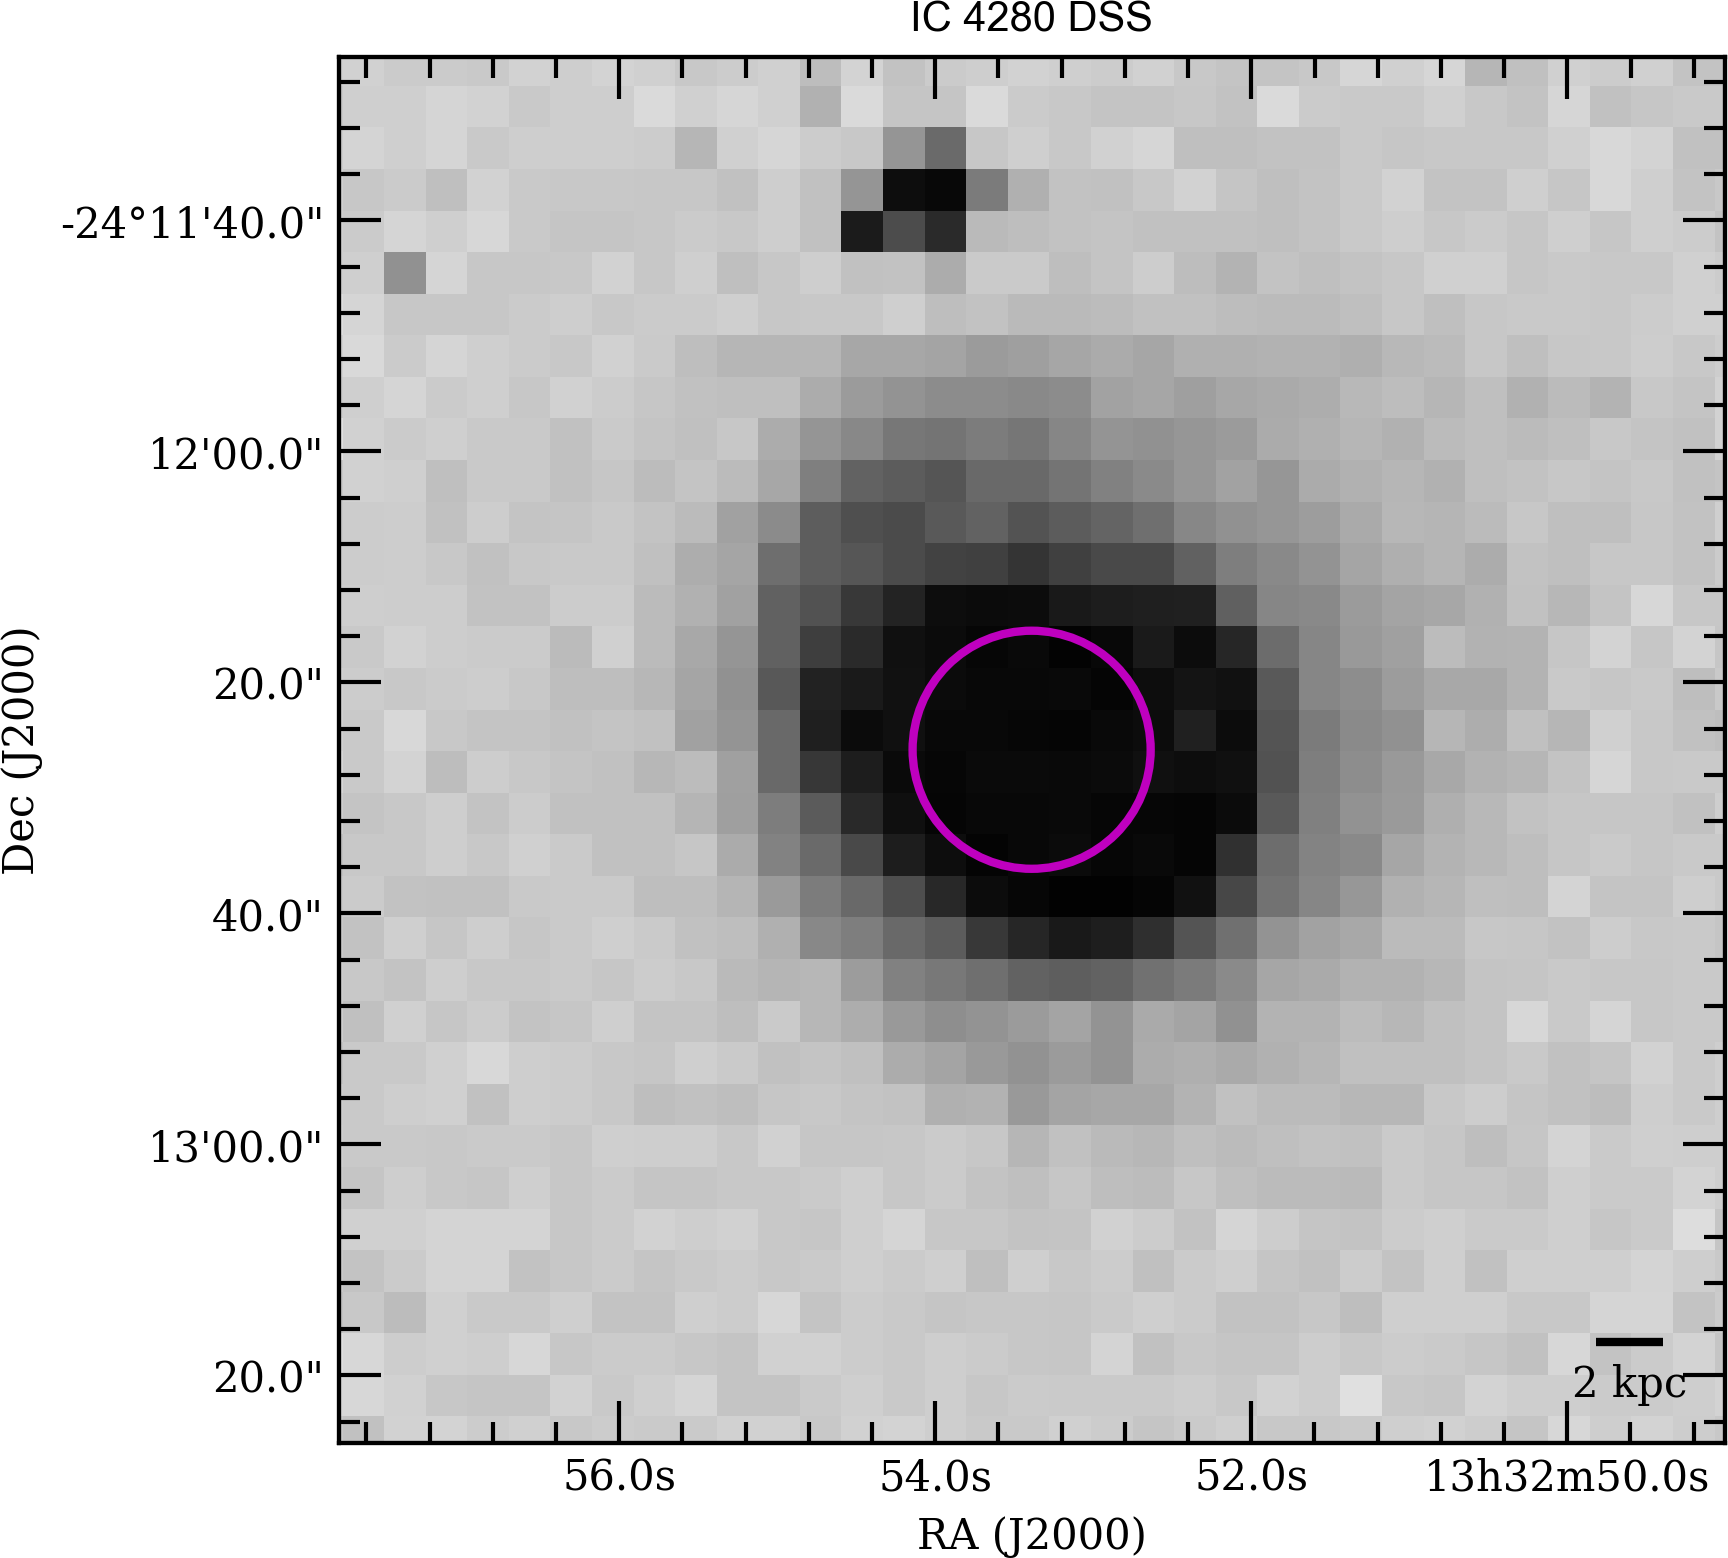
As explained in Section 2.3, the ACA single-point observation without the total power array may not cover the total flux. In Table A.5, the SPIRE/FTS velocity integrated [C I] (1–0) and CO (4–3) fluxes from Kamenetzky et al. (2016) are listed if accessible. The typical ACA RF is approximately and for [C I] (1–0) and CO (4–3), respectively. The CO (4-3) and [C I] (1–0) lines are close enough in frequency that they are both observed with similar uv-coverage, tracing similar spatial scales in the sample galaxies. Therefore, we argue that the resultant line ratios between CO (4-3) and [C I] (1–0) provided here are a reasonable representation of the line ratios, despite the missing flux of order 30-40%. The extrapolated total dust continuum flux densities are listed in Table A.6, whenever the dust mass was estimated in Shangguan et al. (2019)666Dust continuum fluxes are provided by Jinyi Shangguan in private communication.. We found that the typically RF for continuum emission was 46 % and 52 %, for the 609 and 650 m continuum flux density, respectively. The RF for individual galaxies is derived from the ratio between the continuum flux density by the ACA and continuum spectrum fitting. The typical RF suggests that almost half of the continuum flux density comes outside the FoV or from a structure that is larger than MRS. We note that the SPIRE beam is 455 at the CO (4–3) transition but the ACA FoV is 235 (shown as magenta circles in Figure A1.1). Therefore, a large missing flux might be observed, especially, for galaxies with small luminosity distances (e.g., Mpc). The individual notes for galaxies that have a large missing flux (e.g., IC 4280) are given in Section A.3.
3.3 Luminosity
The luminosities for the lines are measured using
| (6) |
and
| (7) |
where is the rest frequency of the line emission in GHz, is the redshift, is the luminosity distance in Mpc, and is sky (observed) frequency in GHz (Solomon & Vanden Bout, 2005). We used to calculate the molecular gas mass (Section A.4) and for the photodissociation region (PDR) modeling (Section 4.3).
The ACA continuum flux density at the rest frames of 609 m and 650 m ( and ) are converted to the 630 m specific luminosity based on a formulation in Scoville et al. (2016),
| (8) |
where is in Jy and is the average of the red-shifted sky frequency777The red-shifted sky frequencies are labeled in Figure A2.1(d) and (h).. If either or were detected, we used the flux density and frequency of the detected signal. We assume the dust temperature of K for simple analyses. is the correction for departure in the rest frame of the Planck function from Rayleigh–Jeans given by
| (9) |
The derived luminosities are listed in Table A.7. The ratios among the derived luminosities are listed in Table A.8.
3.4 Molecular gas mass
We supplementally estimated from CO (1–0), [C I] (1–0), CO (4–3), and the continuum, respectively (See detail in Section A.4 and Table A.9). We assumed a simple luminosity-to- conversion factor. We note that the main purpose of this study is not to investigate the effect of the systematic uncertainties introduced by the various assumptions when estimating .
4 Discussion
Figure 2 shows the relationship between [C I] (1–0), CO (4–3), and 630 m continuum luminosities. The linear regression lines (gray lines) for detected galaxies were calculated using the Python package of linmix developed by Kelly (2007). Minimum, maximum, average, median, and standard errors of the , , and in our targets are shown in Table 4. The correlations are naturally explained because , , and could be used to measure MH2 (Section A.4). The scatter for the correlations could reflect the systematic uncertainties introduced by the various assumptions when measuring . Figure 2 (a) shows that the upper limits for the non-detections, i.e., in NGC 6052 and for NGC 7679 is times smaller than the typical ratio of 0.34 (see Section 4.1 in detail). In Section 4.2, we further investigate a diverse range of galaxies in terms of and .
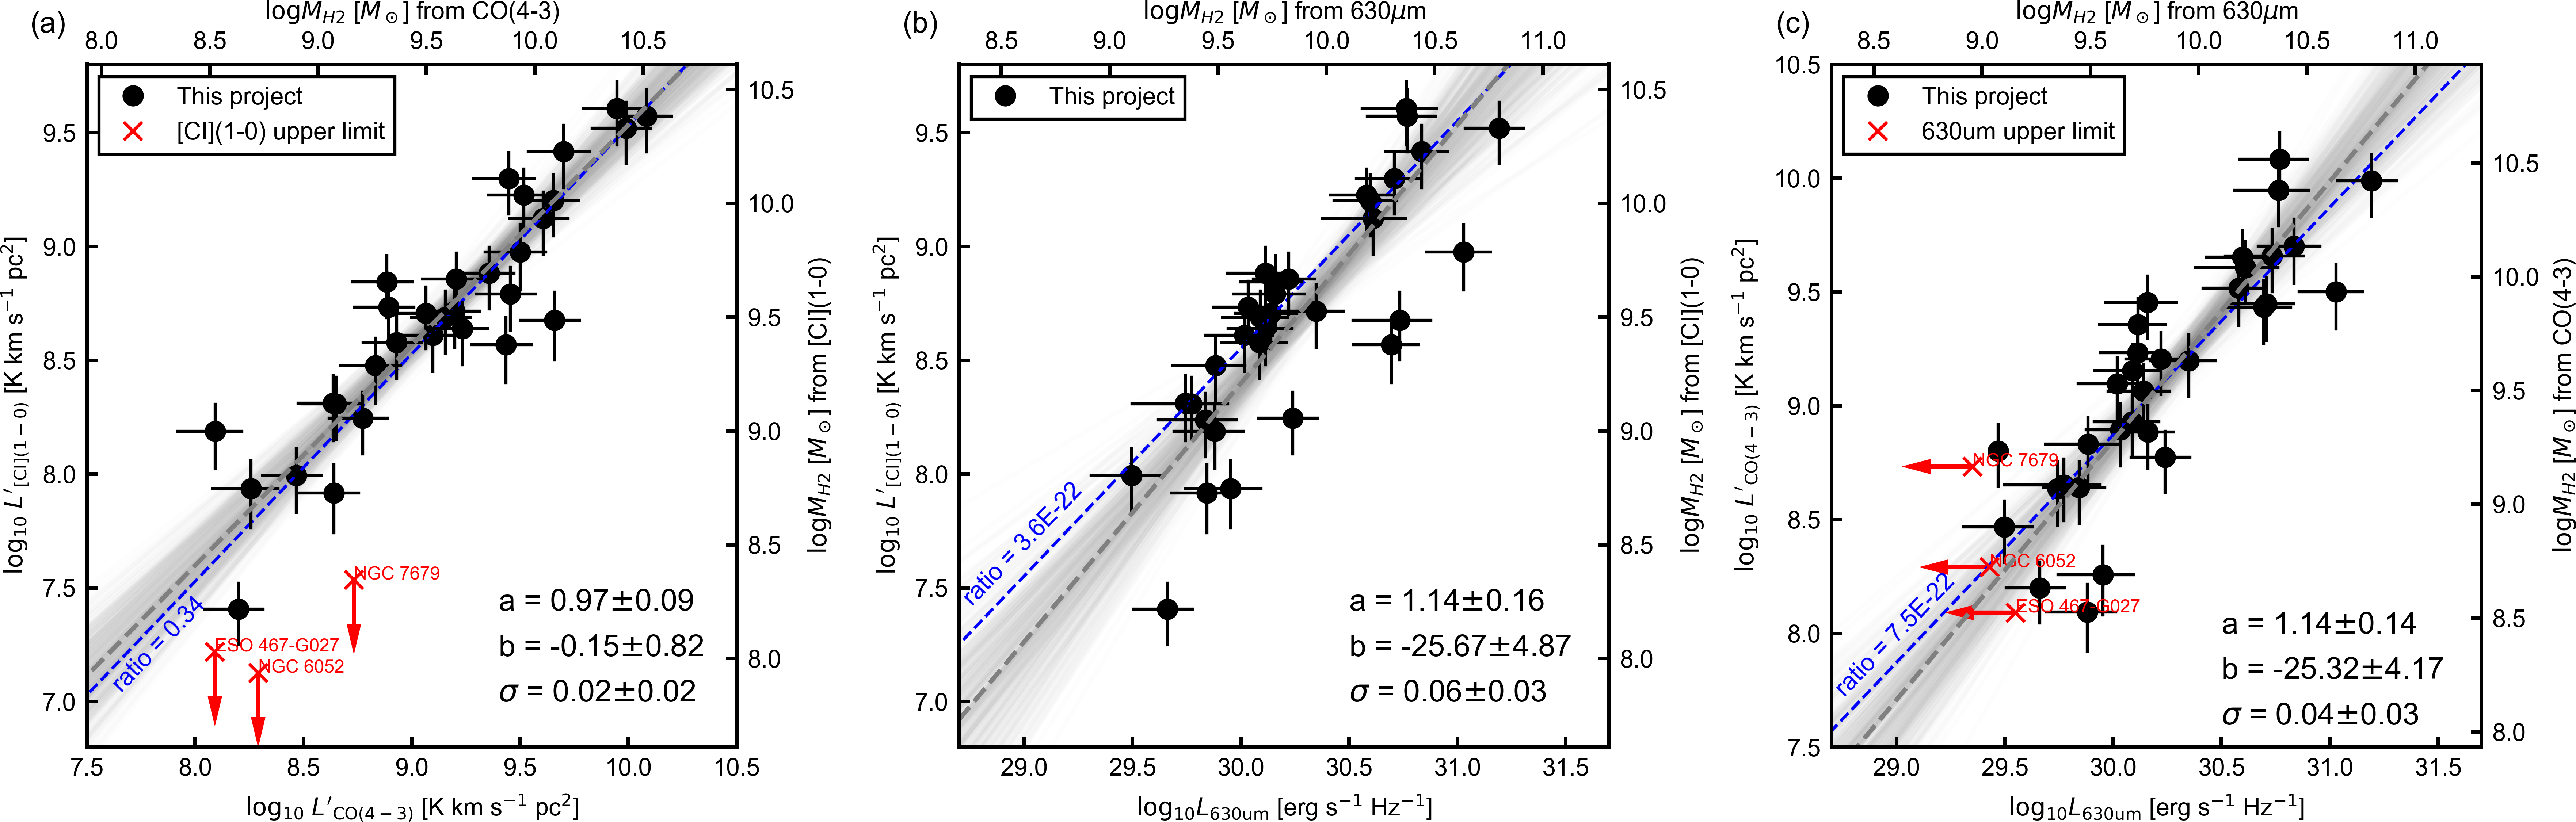
| min,max | ave | med | SE | ||
|---|---|---|---|---|---|
| 0.1,1.5 | 0.5 | 0.4 | 0.05 | 31 | |
| 0.2,1.1 | 0.4 | 0.4 | 0.05 | 20 | |
| 0.6,7 | 3.3 | 3.6 | 0.3 | 32 | |
| 1.3,37 | 9.8 | 7.7 | 1.6 | 27 | |
| 1.6,21 | 9.1 | 8.1 | 0.9 | 32 | |
| 4.9,63 | 31 | 26 | 3.0 | 32 |
Note. — the minimum (min), maximum (max), average (ave), median (med), and standard error (SE=SD/, where SD is the standard deviation and is the sample size) of each combination of the ratios. Non-detection cases are included in the median calculation; however, the other statistics are calculated without non-detection cases. indicates the peak flux density (in the unit of Jy) calculated by Gaussian spectrum line fitting (Figure A2.1). The units of , , , and , are , , , and Jy, respectively.
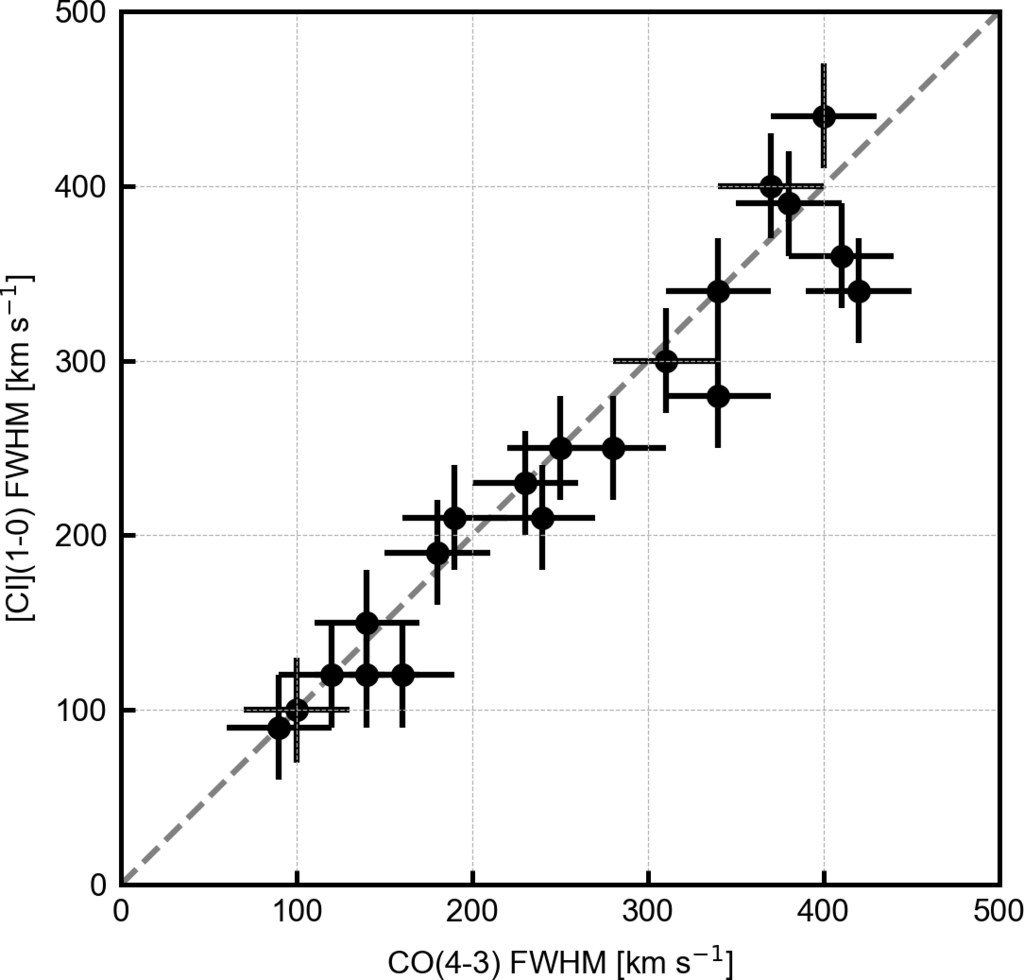
Figure 3 shows the FWHM of the [C I] (1–0) and CO (4–3) line profiles. In most case, the line shapes of [C I] (1–0) and CO (4–3) lines and mom1 and mom2 maps appear similar (Figure A2.1), implying that the kinematical properties of the [C I] (1–0) and CO (4–3) are the same for molecular gas distributions at the kpc scale. We manually selected galaxies used in Figure 3, which can be well fitted by single Gaussian components (i.e., the used spectra are marked in Figure A2.1.) For example, we do not include NGC 232-2 (NGC 235) because the S/N of the spectrum is low. We also avoid double peak emission, because a single Gaussian fitting may not work well (e.g., IC4280). However, this manual selection did not impact the results of this study.
4.1 [C I] non-detection
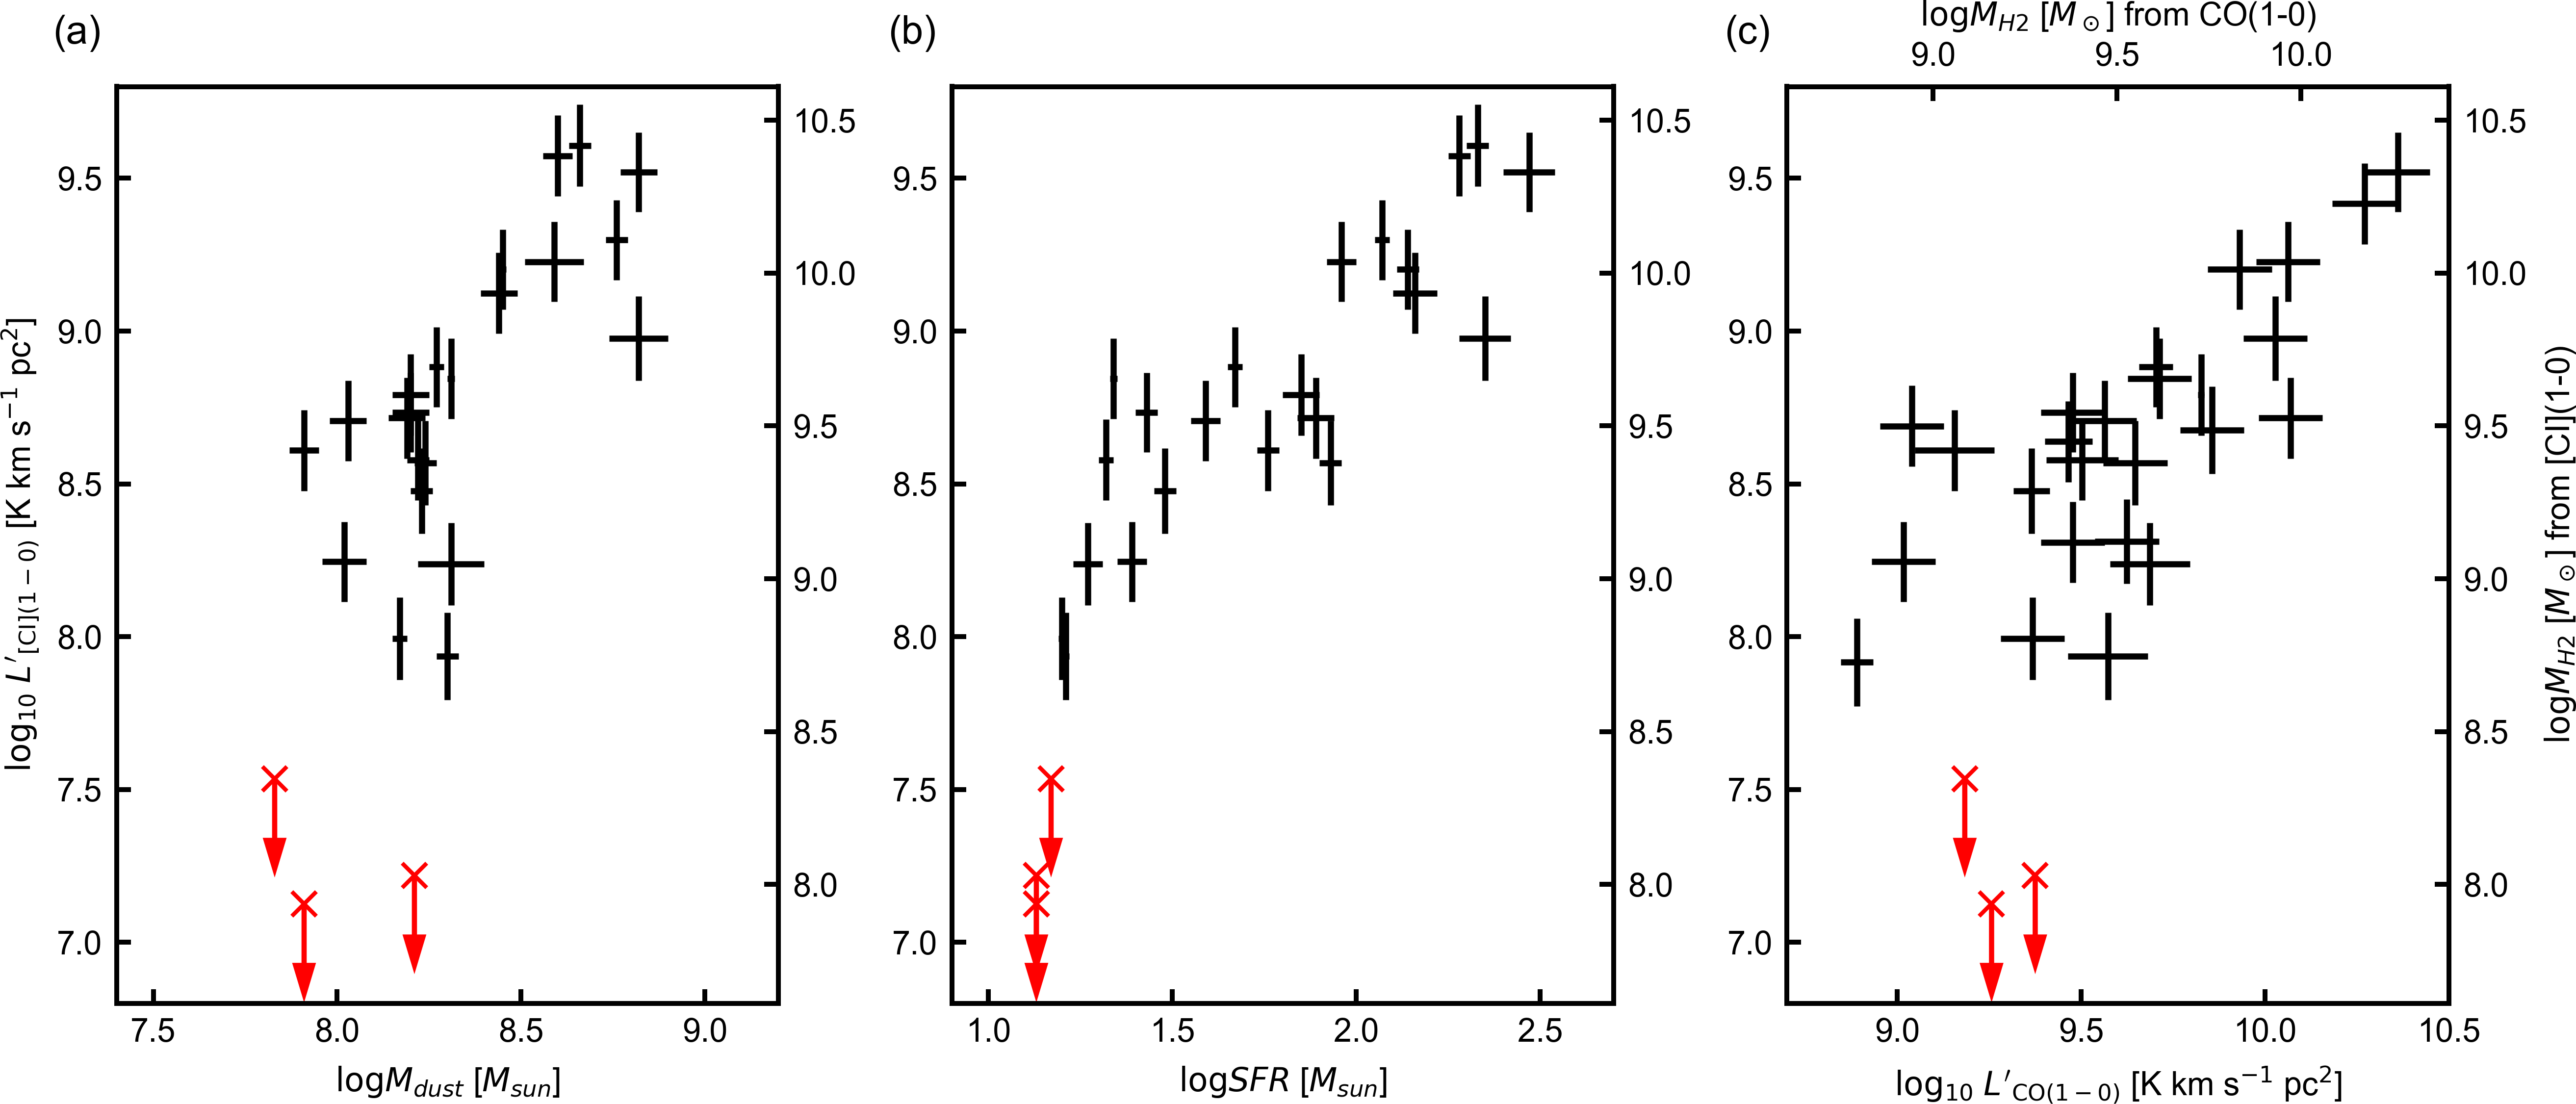
ALMA/ACA recently identified a galaxy, NGC 6052 (Michiyama et al., 2020), which may be a counterexample to the recent concept of the ubiquitous [C I]/CO distribution during the cloud lifetime and the C0-rich/CO-poor region due to the CO dissociation process, proposed by e.g., Papadopoulos et al. (2004, 2018). During this survey, we further discovered the [CI] non-detection case of gas-rich type 2 AGN, NGC 7679. Figure 4 shows that the upper limits of [C I] are small when we compare the global properties of galaxies, i.e., , SFR, and , demonstrating that NGC 6052 and NGC 7679 are candidates for the [C I]-dark galaxies. Two possible scenarios of weak [C I] (1–0) emission are C0-poor/CO-rich environments or an environment with an extremely large [C I] (1–0) missing flux. A direct comparison of [C I] and CO in the same uv-plane is necessary to distinguish between these two scenarios.
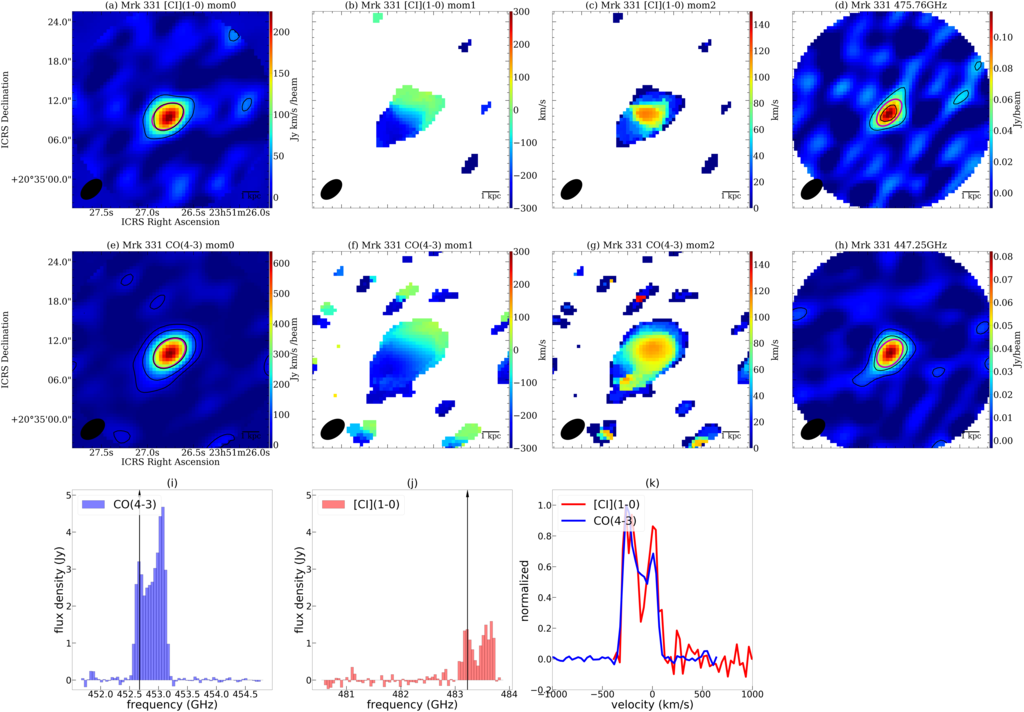
If the C0-poor/CO-rich scenario is true, we may be able to use the [C I]-deficit to identify young starbursts (suggested in NGC 6052; Michiyama et al. 2020). Young starbursts are also observed in NGC 7679 as well. For example, Gu et al. (2001) detected clear higher-order Balmer absorption lines implying the presence of active star-forming regions in the central region. By modeling the spectrum, they found that young ( Myr) and intermediate ( Myr) stellar age populations are dominant in the nuclear region of NGC 7679. In addition, Gu et al. (2001) compared the UV spectra of NGC 7679 and NGC 5135. Among our samples, NGC 7679 showed the smallest of , and NGC 5135 has the largest of . Gu et al. (2001) demonstrated that the stellar wind absorption line, such as the P-Cygni profile of C IV1550, is more significant in NGC 7679 than that in NGC 5135; this also suggests the younger stellar population in NGC 7679 than NGC 5135 while both galaxies host type 2 AGNs. The nuclear starburst activity in NGC 7679 may be related to the tidal interaction with NGC 7682 (with a separation of kpc). The keywords “galaxy interaction” and “young starburst” are common among NGC 7679 and NGC 6052 (Michiyama et al., 2020), whose [C I] (1–0) was not detected in our survey. The “[CI]-deficit” would be a hint to understand the timescale triggered by a galaxy interaction.
If an extremely large [C I] (1–0) missing flux scenario is true (i.e., of [C I] (1–0) flux is resolved out / outside the FoV). This implies that [C I] is not associated with the compact molecular gas, which is a direct material for star formation. In this case, [C I] emission may be associated with atomic hydrogen (H I) rather than with the molecular (H2) phase. If the spatial structure is completely different between CO and [C I], the comparison with dust distributions traced by the Band 8 continuum and HI high-resolution map – which are accessible by cm telescopes (e.g., Very Large Telescope) – are important for comprehensively understanding the different gas phases traced by CO/C I/H I and dust.
4.2 What controls [CI] luminosities in galaxies?
In this section, we attempt to determine the cause of the variation in and . In particular, we investigate the effects of galaxy merger activities, AGN, and dust temperature. In this section, we conclude that observed [C I] luminosities are not correlated with the inferred mergers/AGNs and . The details are as follows.
4.2.1 Galaxy merger
Galaxy mergers are one possible event that affects [C I]/CO ratio. For example, Michiyama et al. (2020) show that the small [C I]/CO line ratio in NGC 6052 is possibly due to the dense gas compressed at the collision front. In addition, the other [C I] non-detected galaxy, NGC 7679, also shows a young starburst, possibly triggered by a galaxy interaction (see details in Section 4.1). Therefore, a small [C I]/CO ratio may be common in merging galaxies. We apply the selection criteria of merging galaxies used in Shangguan et al. (2019) and used a t-test between the merger and non-merger groups (Figure 5a). There was no significant difference in the mean values of and between merger and non-merger groups, suggesting that a merger process may not be a significant for controlling the [C I]/CO ratio. In the case of NGC 6052 and NGC 7679, we may see a very rare phase (e.g., very young starburst) during the merger process.
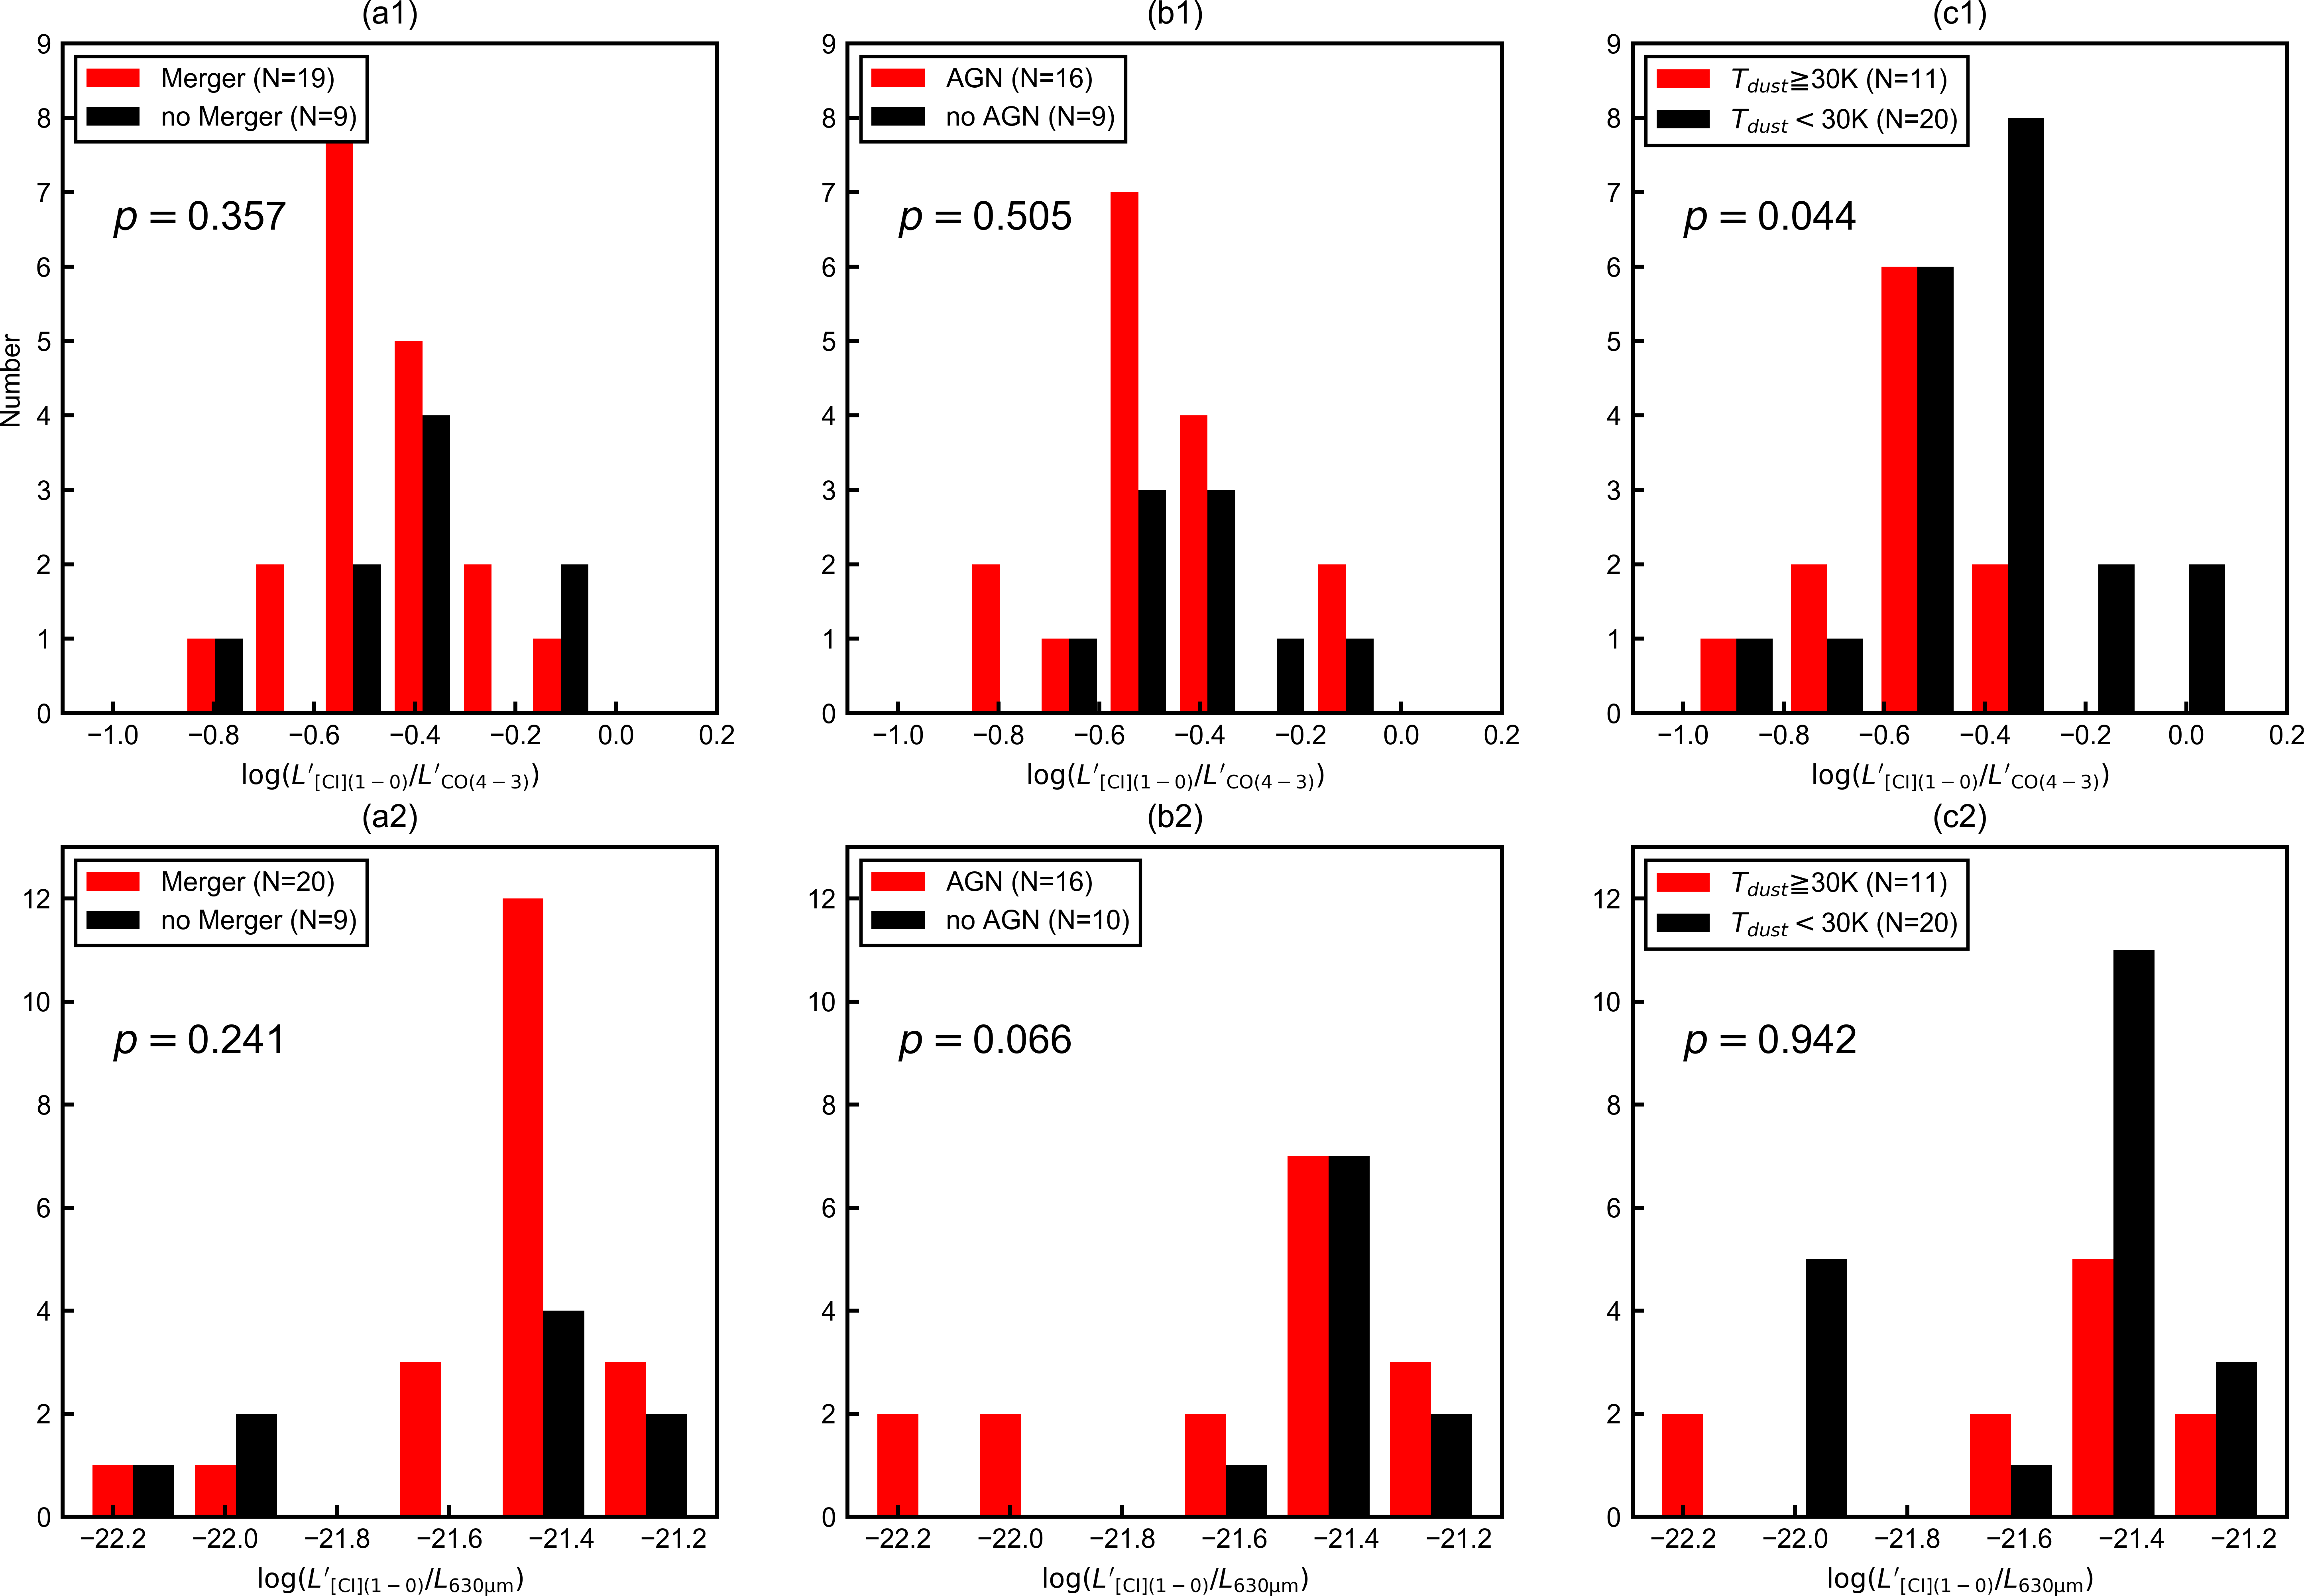
4.2.2 AGN
AGN is a possible event that affects the [C I]/CO ratio. For example, Meijerink & Spaans (2005) and Meijerink et al. (2007) demonstrated that the abundance of atomic carbon relative to CO will increase due to CO dissociation in X-ray dominated regions (XDRs), where strong X-rays from the central AGN control the chemical and physical properties of the ambient gas. In addition, Izumi et al. (2020b) have investigated the [C I] and CO distribution around the AGN of NGC 7469 with pc resolution and found that the [C I] (1–0)/12CO (2–1) ratio was 20 times higher around the AGN than the starburst ring outside; this indicates that [C I] enhancement can be used to identify dust-obscured AGNs. They believed that an elevated C0/CO ratio (as expected in the XDR models) is required to explain the [C I]-enhancement.
We applied the AGN selection criteria used by Shangguan et al. (2019) to identify AGNs among our observed nearby U/LIRGs. We used a t-test to determine if there was a significant difference ( or not) between the mean values ( and ) of the AGN and non-AGN groups (Figure 5b). There is no significant difference between the AGNs and non-AGN for and . We note that our ACA spatial resolution is kpc. To understand the AGN properties, we need to achieve a higher resolution, as in Izumi et al. (2020b). For example, is for NGC 7469 in our survey, which is below the average value of observed galaxies. This suggests that AGN enhances the [C I]/CO ratio on a small scale ( pc), but AGN cannot control the ratio in star-forming regions outside (kpc). A higher spatial resolution is necessary to understand the [C I] properties of AGNs.
4.2.3 Dust temperature
As explained in equation (• ‣ A.4), the conversion from continuum flux density to depends on the assumption of the dust temperature (i.e., in equation 9 depends on dust temperature). For example, assuming K, the value of is approximately 1.1 times higher than that assuming K in equation (• ‣ A.4). Therefore, the line-to-continuum ratio may depend on the dust temperature. Figure 5(c2) shows that there is no evidence that the dust temperature controls the ratios of , suggesting that the dust temperature (i.e., conversion from 630 m to 850 m) is not the main systematic error in equation (• ‣ A.4).
Conversely, Figure 5(c1) suggests a negative relationship (i.e., lower may indicate higher , ). This indicates that the excitation of [C I] and/or CO may be related to dust temperature. For example, a positive correlation is seen between and CO or [C I] excitation conditions in spatially resolved studies in very nearby galaxies (i.e., Mpc, Koda et al. 2020; Jiao et al. 2019), and a positive correlation was observed between and the [C I] excitation temperatures that is estimated based on [C I] (2–1)/[C I] (1–0) ratio (Jiao et al., 2019). However, the range of and the number of samples are limited in our analysis and a further complete survey, including multi-[C I] and CO transitions by ALMA, is necessary to understand the CO and [C I] excitation condition.
4.3 Comparison with high-z galaxies
The secondary aim of this study was to compare our nearby U/LIRGs with high-z galaxies. In the previous sections, we investigated the uncertainty of the usage of Band 8 information, that is, [C I] (1–0), CO (4–3), and the dust continuum as a tracer of bulk of the galaxies. However, the most important reason for using Band 8 measurements is that we can directly compare nearby and high-z galaxies.
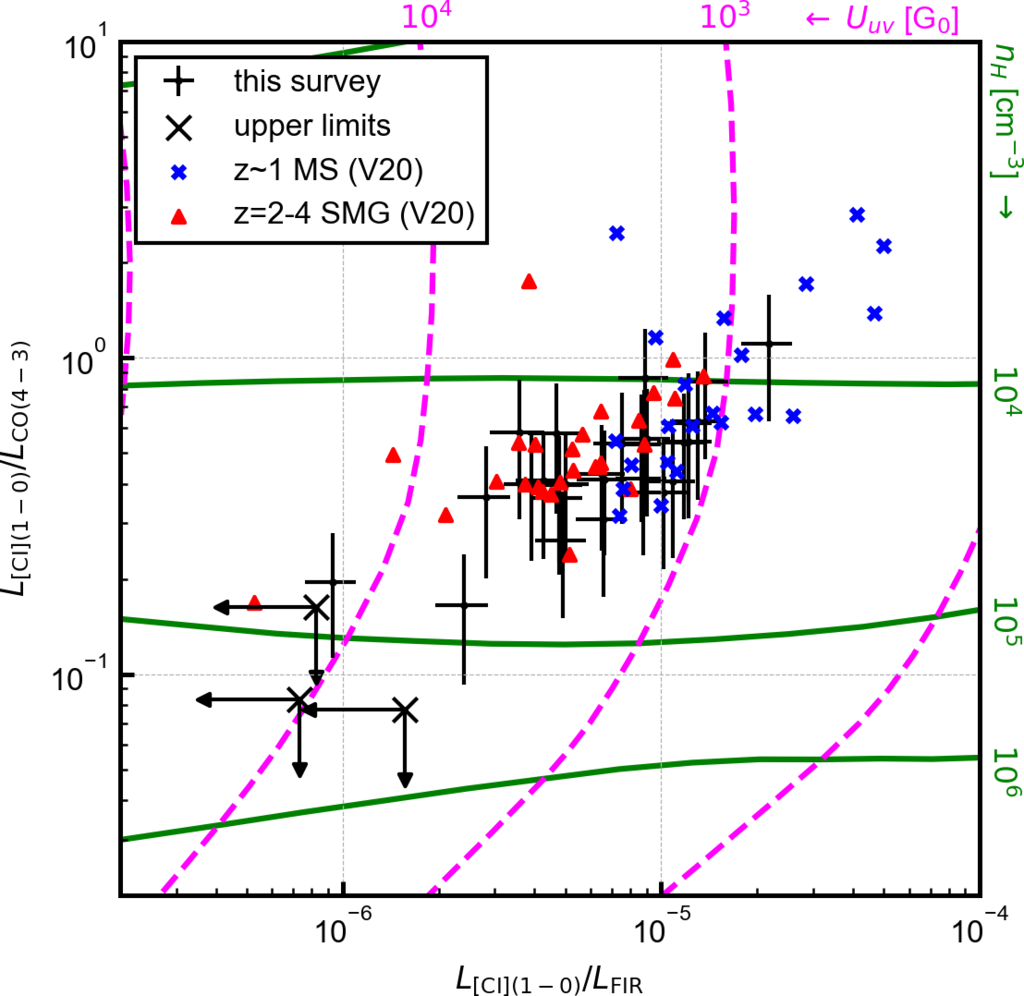
Using the high-z [C I] (1–0) sample compiled by Valentino et al. (2018, 2020), we investigated the properties of high-z and nearby galaxies in this section. We compared three groups: 29 nearby U/LIRGs from our survey, 22 galaxies on the main sequence at ( MS), and 27 galaxies at who are categorized as SMGs ( SMGs) from Valentino et al. (2018, 2020).
We compared the nearby U/LIRGs, MS, and SMGs on the plane of and . The physical parameters of the PDR can be constrained in this plane (Alaghband-Zadeh et al., 2013; Bothwell et al., 2017; Valentino et al., 2018, 2020). We used the Photodissociation Region Toolbox (PDRT888http://dustem.astro.umd.edu/pdrt/; Kaufman et al. 1999, 2006; Pound & Wolfire 2008). This enabled us to investigate the density of H nuclei ( in units of cm-3) and incident far-ultraviolet (FUV) radiation field (), assuming the plane-parallel PDR model. The corresponds to photons at 6 eV 13.6 eV in the unit of the average interstellar radiation field in the vicinity of the Sun (). The model provides the line intensities for each combination of and by self-consistently solving for radiation transfer, thermal balance, and chemical processes.
Figure 6 shows versus for nearby U/LIRGs, MS, and SMGs. For nearby U/LIRGs, we use from SED fitting (AGN contribution is subtracted) and assume that the typical ACA recovered [C I] flux is when we calculate . The tracks for constant and are indicated by the green solid and magenta dashed lines, respectively. According to a plane-parallel PDR geometry, the smaller [C I] (1–0)/CO (4–3) ratio indicates the denser PDR because UV radiation cannot penetrate deeply into the molecular medium. For example, the small line ratio (e.g., ) means high density ( cm-3). The small is indicative of a high . We found that the [C I] (1–0) weak galaxies such as NGC 6052 and NGC 7679 (e.g., ) are rare, including the high-z galaxies (see also Israel & Baas 2002; Israel et al. 2015).
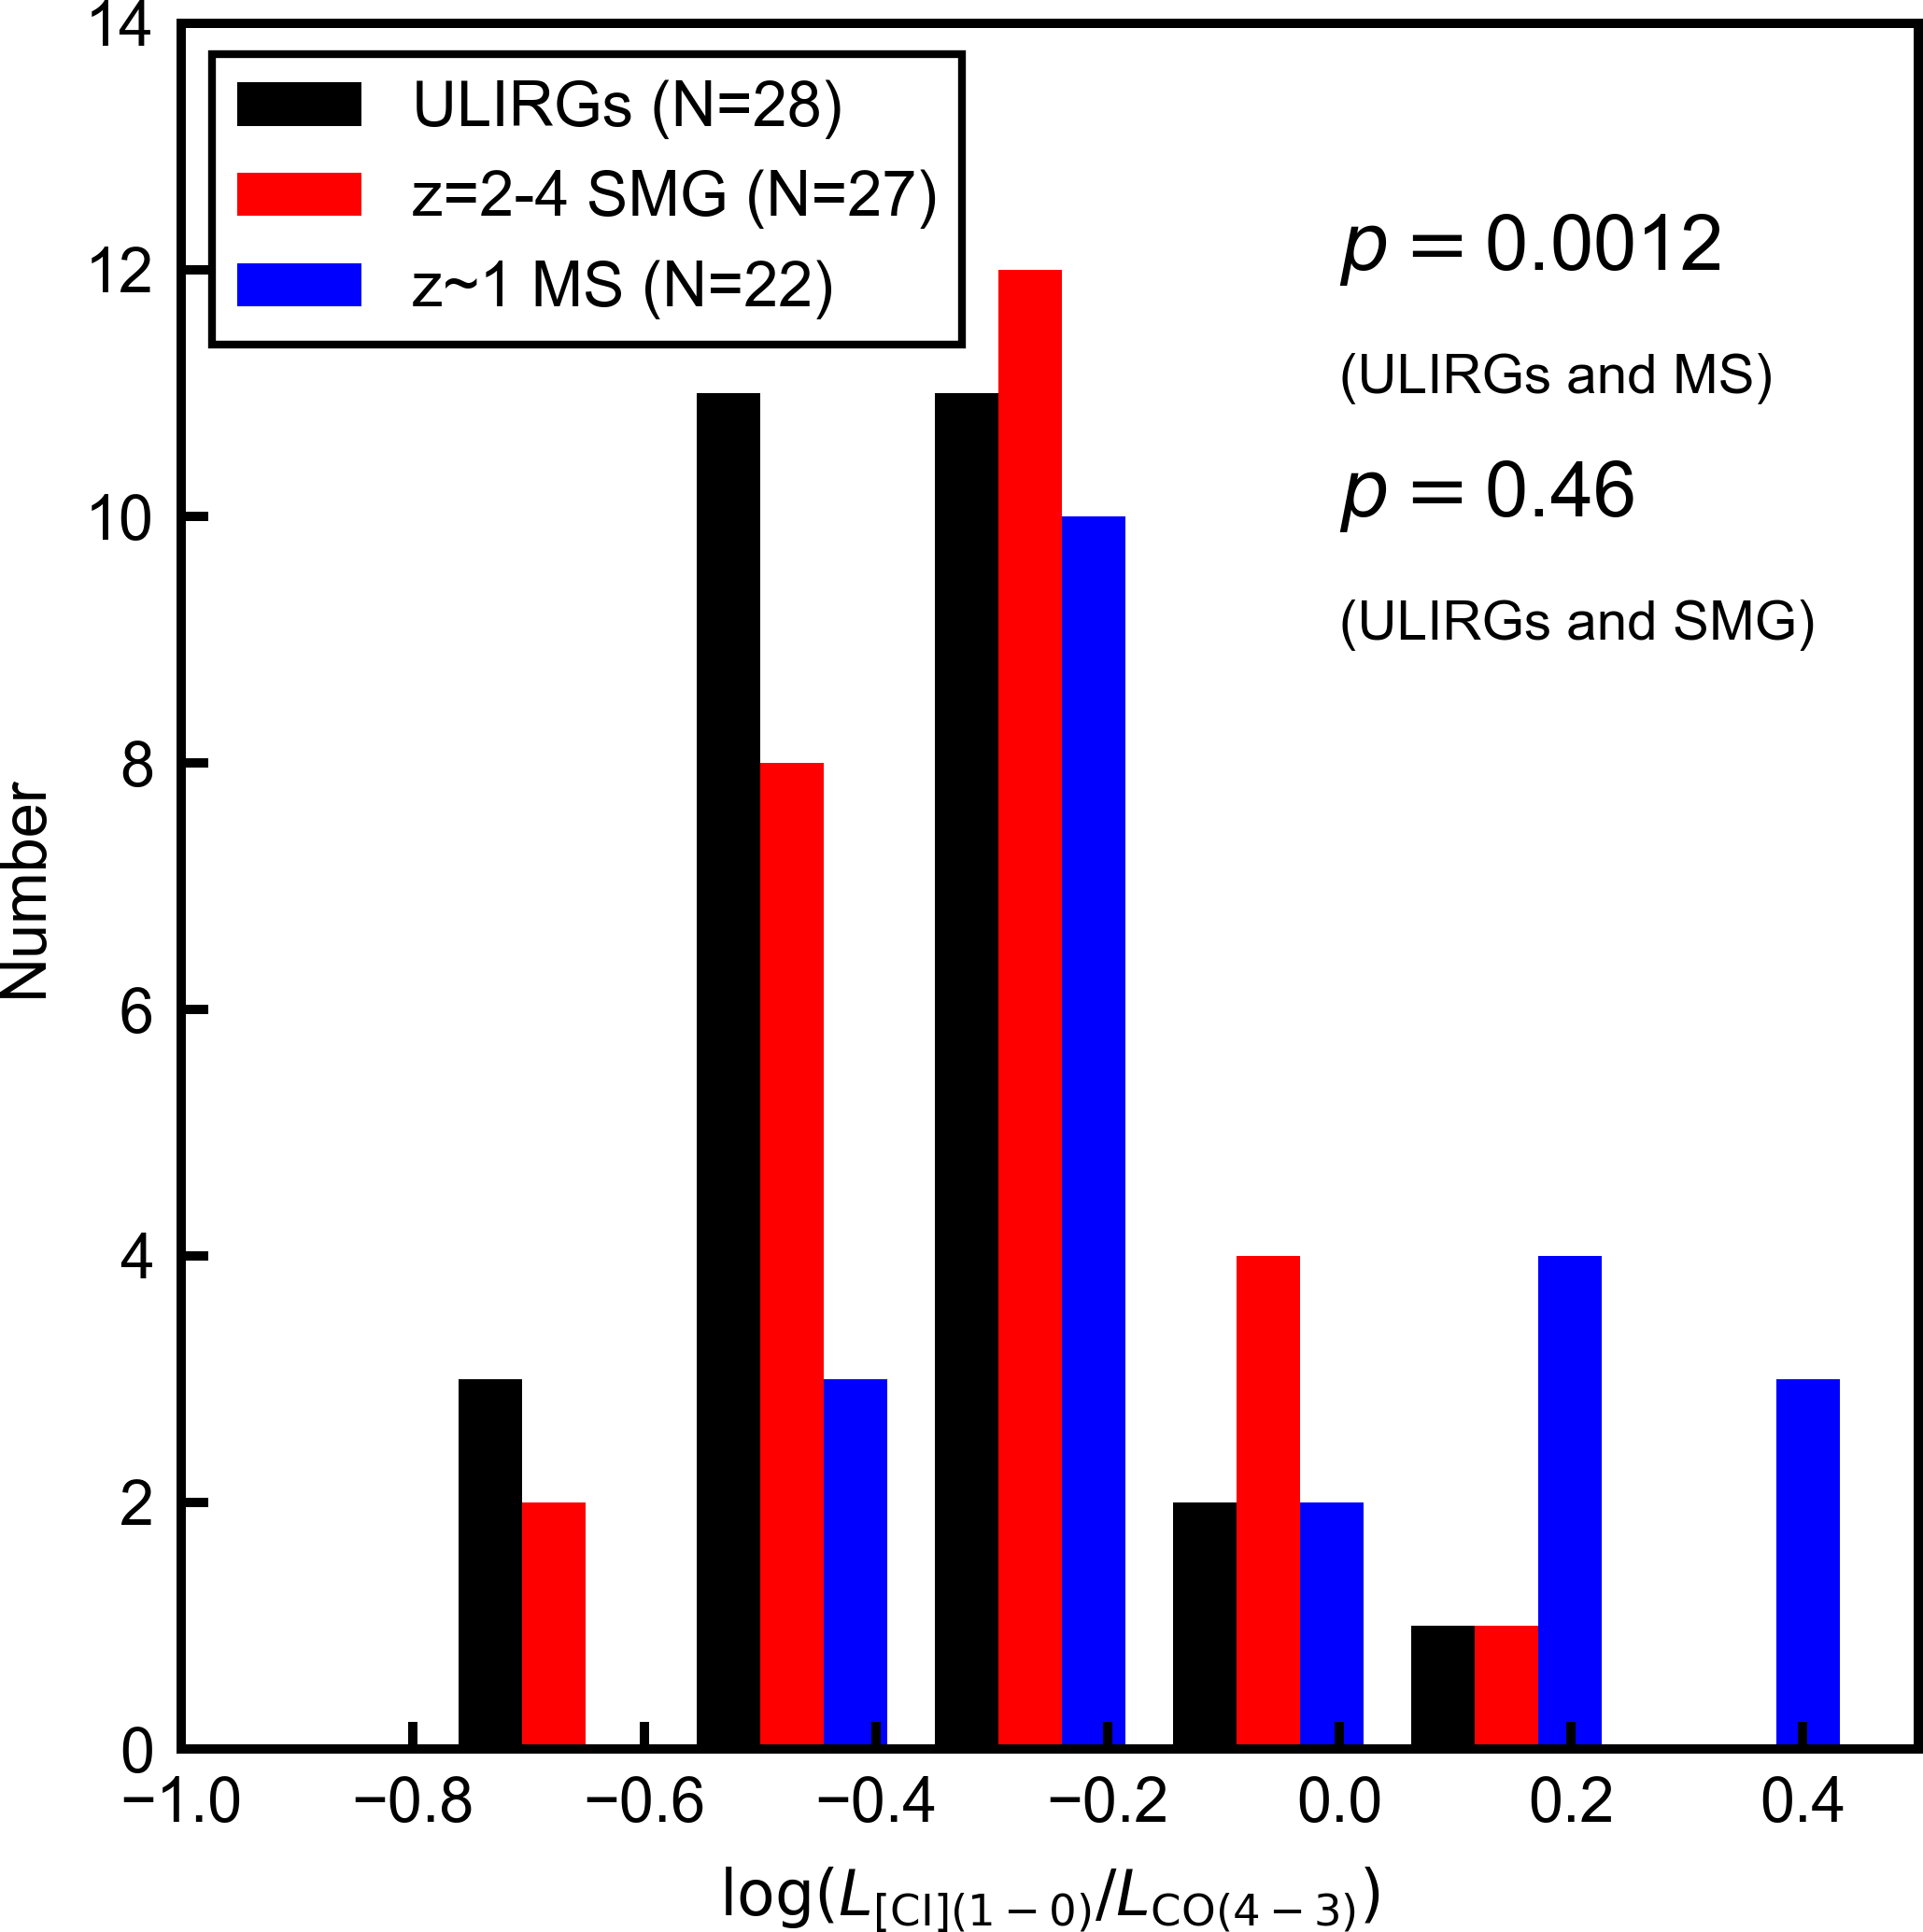
We used a t-test to determine if there is a significant difference among nearby U/LIRGs, MS, and SMGs in terms of . Figure 7 demonstrates that the distribution of in nearby U/LIRGs is the same as SMGs but is significantly different from MS. For example, the median value of is 0.42, 0.47, and 0.66 for nearby U/LIRGs, SMG, and MS, respectively. This means that the typical density is approximately 1.5 times larger in U/LIRGs and SMGs than in MS galaxies. We note that this suggestion, as shown in Figure 7(a), does not strongly depend on the missing flux issue of our ACA survey.
5 Summary
We present our recent ACA band 8 observations of [C I] (1–0), CO (4–3), and dust continuum emission in 36 nearby U/LIRGs. The main results are as follows.
-
•
Correlations were confirmed among , , and . However, there was variation in the ratios among the three observables. For example, the range of [C I] (1–0)/CO (4–3) luminosity ratio is (0.1-1.1) , including the [C I] (1–0) non-detection case for a ratio of (i.e., NGC 6052 and NGC 7679).
-
•
The observed [C I] luminosities did not correlate with inferred , or AGN/merger morphology.
-
•
As a case study for specific targets, we compare two AGN host galaxies; i.e., NGC 7679, which exhibits the smallest , and NGC 5135, which exhibits the largest . We found that the evidence of young starburst activity was more robust in NGC 7679 than in NGC 5135 and star formation activities in NGC 7679 may be related to the tidal interaction with the pair galaxy besides.
-
•
We compare our nearby U/LIRGs and high-z galaxies, such as galaxies on MS and SMGs. The mean value of the [C I] (1–0)/CO(4–3) ratio of U/LIRGs is similar to that of SMGs but smaller than that of galaxies on MS. This possibly indicates a higher hydrogen density in U/LIRGs and SMGs than MS when we assume a simple photodissociation model.
References
- Alaghband-Zadeh et al. (2013) Alaghband-Zadeh, S., Chapman, S. C., Swinbank, A. M., et al. 2013, MNRAS, 435, 1493, doi: 10.1093/mnras/stt1390
- Andreani et al. (2018) Andreani, P., Retana-Montenegro, E., Zhang, Z.-Y., et al. 2018, A&A, 615, A142, doi: 10.1051/0004-6361/201732560
- Bisbas et al. (2015) Bisbas, T. G., Papadopoulos, P. P., & Viti, S. 2015, ApJ, 803, 37, doi: 10.1088/0004-637X/803/1/37
- Bolatto et al. (2013) Bolatto, A. D., Wolfire, M., & Leroy, A. K. 2013, ARA&A, 51, 207, doi: 10.1146/annurev-astro-082812-140944
- Bothwell et al. (2017) Bothwell, M. S., Aguirre, J. E., Aravena, M., et al. 2017, MNRAS, 466, 2825, doi: 10.1093/mnras/stw3270
- Bourne et al. (2019) Bourne, N., Dunlop, J. S., Simpson, J. M., et al. 2019, MNRAS, 482, 3135, doi: 10.1093/mnras/sty2773
- Burton et al. (2015) Burton, M. G., Ashley, M. C. B., Braiding, C., et al. 2015, ApJ, 811, 13, doi: 10.1088/0004-637X/811/1/13
- Cañameras et al. (2018) Cañameras, R., Yang, C., Nesvadba, N. P. H., et al. 2018, A&A, 620, A61, doi: 10.1051/0004-6361/201833625
- Carilli & Walter (2013) Carilli, C. L., & Walter, F. 2013, ARA&A, 51, 105, doi: 10.1146/annurev-astro-082812-140953
- Casey et al. (2014) Casey, C. M., Narayanan, D., & Cooray, A. 2014, Phys. Rep., 541, 45, doi: 10.1016/j.physrep.2014.02.009
- Cicone et al. (2018) Cicone, C., Severgnini, P., Papadopoulos, P. P., et al. 2018, ApJ, 863, 143, doi: 10.3847/1538-4357/aad32a
- Clark et al. (2019) Clark, P. C., Glover, S. C. O., Ragan, S. E., & Duarte-Cabral, A. 2019, MNRAS, 486, 4622, doi: 10.1093/mnras/stz1119
- Cortzen et al. (2020) Cortzen, I., Magdis, G. E., Valentino, F., et al. 2020, A&A, 634, L14, doi: 10.1051/0004-6361/201937217
- Crocker et al. (2019) Crocker, A. F., Pellegrini, E., Smith, J. D. T., et al. 2019, ApJ, 887, 105, doi: 10.3847/1538-4357/ab4196
- Dannerbauer et al. (2019) Dannerbauer, H., Harrington, K., Díaz-Sánchez, A., et al. 2019, AJ, 158, 34, doi: 10.3847/1538-3881/aaf50b
- Dunne et al. (2021) Dunne, L., Maddox, S. J., Vlahakis, C., & Gomez, H. L. 2021, MNRAS, 501, 2573, doi: 10.1093/mnras/staa3526
- Eales et al. (2012) Eales, S., Smith, M. W. L., Auld, R., et al. 2012, ApJ, 761, 168, doi: 10.1088/0004-637X/761/2/168
- Espada et al. (2018) Espada, D., Martin, S., Verley, S., et al. 2018, ApJ, 866, 77, doi: 10.3847/1538-4357/aae07e
- Fixsen et al. (1999) Fixsen, D. J., Bennett, C. L., & Mather, J. C. 1999, ApJ, 526, 207, doi: 10.1086/307962
- González-Alfonso et al. (2012) González-Alfonso, E., Fischer, J., Graciá-Carpio, J., et al. 2012, A&A, 541, A4, doi: 10.1051/0004-6361/201118029
- Gu et al. (2001) Gu, Q. S., Huang, J. H., de Diego, J. A., et al. 2001, A&A, 374, 932, doi: 10.1051/0004-6361:20010806
- Habing (1968) Habing, H. J. 1968, Bull. Astron. Inst. Netherlands, 19, 421
- Hainline et al. (2004) Hainline, L. J., Scoville, N. Z., Yun, M. S., et al. 2004, ApJ, 609, 61, doi: 10.1086/420920
- Harrington et al. (2018) Harrington, K. C., Yun, M. S., Magnelli, B., et al. 2018, MNRAS, 474, 3866, doi: 10.1093/mnras/stx3043
- Ikeda et al. (2002) Ikeda, M., Oka, T., Tatematsu, K., Sekimoto, Y., & Yamamoto, S. 2002, ApJS, 139, 467, doi: 10.1086/338761
- Israel (2020) Israel, F. P. 2020, A&A, 635, A131, doi: 10.1051/0004-6361/201834198
- Israel & Baas (2001) Israel, F. P., & Baas, F. 2001, A&A, 371, 433, doi: 10.1051/0004-6361:20010354
- Israel & Baas (2002) —. 2002, A&A, 383, 82, doi: 10.1051/0004-6361:20011736
- Israel & Baas (2003) —. 2003, A&A, 404, 495, doi: 10.1051/0004-6361:20030479
- Israel et al. (2015) Israel, F. P., Rosenberg, M. J. F., & van der Werf, P. 2015, A&A, 578, A95, doi: 10.1051/0004-6361/201425175
- Izumi et al. (2020a) Izumi, N., Fukui, Y., Tachihara, K., et al. 2020a, arXiv e-prints, arXiv:2012.01330. https://arxiv.org/abs/2012.01330
- Izumi et al. (2018) Izumi, T., Wada, K., Fukushige, R., Hamamura, S., & Kohno, K. 2018, ApJ, 867, 48, doi: 10.3847/1538-4357/aae20b
- Izumi et al. (2020b) Izumi, T., Nguyen, D. D., Imanishi, M., et al. 2020b, arXiv e-prints, arXiv:2006.09406. https://arxiv.org/abs/2006.09406
- Jiao et al. (2017) Jiao, Q., Zhao, Y., Zhu, M., et al. 2017, The Astrophysical Journal, 840, L18, doi: 10.3847/2041-8213/aa6f0f
- Jiao et al. (2019) Jiao, Q., Zhao, Y., Lu, N., et al. 2019, ApJ, 880, 133, doi: 10.3847/1538-4357/ab29ed
- Jin et al. (2019) Jin, S., Daddi, E., Magdis, G. E., et al. 2019, ApJ, 887, 144, doi: 10.3847/1538-4357/ab55d6
- Kamenetzky et al. (2016) Kamenetzky, J., Rangwala, N., Glenn, J., Maloney, P. R., & Conley, A. 2016, The Astrophysical Journal, 829, 93, doi: 10.3847/0004-637x/829/2/93
- Kaufman et al. (2006) Kaufman, M. J., Wolfire, M. G., & Hollenbach, D. J. 2006, ApJ, 644, 283, doi: 10.1086/503596
- Kaufman et al. (1999) Kaufman, M. J., Wolfire, M. G., Hollenbach, D. J., & Luhman, M. L. 1999, ApJ, 527, 795, doi: 10.1086/308102
- Kelly (2007) Kelly, B. C. 2007, ApJ, 665, 1489, doi: 10.1086/519947
- Koda et al. (2020) Koda, J., Sawada, T., Sakamoto, K., et al. 2020, ApJ, 890, L10, doi: 10.3847/2041-8213/ab70b7
- Kramer et al. (2008) Kramer, C., Cubick, M., Röllig, M., et al. 2008, A&A, 477, 547, doi: 10.1051/0004-6361:20077815
- Krips et al. (2016) Krips, M., Martín, S., Sakamoto, K., et al. 2016, A&A, 592, L3, doi: 10.1051/0004-6361/201628882
- Larson et al. (2016) Larson, K. L., Sanders, D. B., Barnes, J. E., et al. 2016, ApJ, 825, 128, doi: 10.3847/0004-637X/825/2/128
- Lee et al. (2021) Lee, M. M., Tanaka, I., Iono, D., et al. 2021, arXiv e-prints, arXiv:2101.04691. https://arxiv.org/abs/2101.04691
- Lu et al. (2017) Lu, N., Zhao, Y., Díaz-Santos, T., et al. 2017 (IOP Publishing), 1, doi: 10.3847/1538-4365/aa6476
- Magdis et al. (2012) Magdis, G. E., Daddi, E., Béthermin, M., et al. 2012, ApJ, 760, 6, doi: 10.1088/0004-637X/760/1/6
- McMullin et al. (2007) McMullin, J. P., Waters, B., Schiebel, D., Young, W., & Golap, K. 2007, Astronomical Society of the Pacific Conference Series, Vol. 376, CASA Architecture and Applications, ed. R. A. Shaw, F. Hill, & D. J. Bell, 127
- Meijerink & Spaans (2005) Meijerink, R., & Spaans, M. 2005, A&A, 436, 397, doi: 10.1051/0004-6361:20042398
- Meijerink et al. (2007) Meijerink, R., Spaans, M., & Israel, F. P. 2007, A&A, 461, 793, doi: 10.1051/0004-6361:20066130
- Michiyama et al. (2020) Michiyama, T., Ueda, J., Tadaki, K.-i., et al. 2020, arXiv e-prints, arXiv:2006.10059. https://arxiv.org/abs/2006.10059
- Miyamoto et al. (2018) Miyamoto, Y., Seta, M., Nakai, N., et al. 2018, PASJ, 70, L1, doi: 10.1093/pasj/psy016
- Ojha et al. (2001) Ojha, R., Stark, A. A., Hsieh, H. H., et al. 2001, ApJ, 548, 253, doi: 10.1086/318693
- Oka et al. (2001) Oka, T., Yamamoto, S., Iwata, M., et al. 2001, ApJ, 558, 176, doi: 10.1086/321536
- Papadopoulos et al. (2018) Papadopoulos, P. P., Bisbas, T. G., & Zhang, Z.-Y. 2018, MNRAS, 478, 1716, doi: 10.1093/mnras/sty1077
- Papadopoulos & Greve (2004) Papadopoulos, P. P., & Greve, T. R. 2004, ApJ, 615, L29, doi: 10.1086/426059
- Papadopoulos et al. (2004) Papadopoulos, P. P., Thi, W. F., & Viti, S. 2004, MNRAS, 351, 147, doi: 10.1111/j.1365-2966.2004.07762.x
- Planck Collaboration et al. (2016) Planck Collaboration, Ade, P. A. R., Aghanim, N., et al. 2016, A&A, 594, A13, doi: 10.1051/0004-6361/201525830
- Popping et al. (2017) Popping, G., Decarli, R., Man, A. W. S., et al. 2017, A&A, 602, A11, doi: 10.1051/0004-6361/201730391
- Pound & Wolfire (2008) Pound, M. W., & Wolfire, M. G. 2008, Astronomical Society of the Pacific Conference Series, Vol. 394, The Photo Dissociation Region Toolbox, ed. R. W. Argyle, P. S. Bunclark, & J. R. Lewis, 654
- Rose et al. (2018) Rose, M., Tadhunter, C., Ramos Almeida, C., et al. 2018, MNRAS, 474, 128, doi: 10.1093/mnras/stx2590
- Saito et al. (2020) Saito, T., Michiyama, T., Liu, D., et al. 2020, MNRAS, 497, 3591, doi: 10.1093/mnras/staa2086
- Salak et al. (2019) Salak, D., Nakai, N., Seta, M., & Miyamoto, Y. 2019, ApJ, 887, 143, doi: 10.3847/1538-4357/ab55dc
- Sanders et al. (2003) Sanders, D. B., Mazzarella, J. M., Kim, D. C., Surace, J. A., & Soifer, B. T. 2003, AJ, 126, 1607, doi: 10.1086/376841
- Scoville et al. (2014) Scoville, N., Aussel, H., Sheth, K., et al. 2014, ApJ, 783, 84, doi: 10.1088/0004-637X/783/2/84
- Scoville et al. (2016) Scoville, N., Sheth, K., Aussel, H., et al. 2016, ApJ, 820, 83, doi: 10.3847/0004-637X/820/2/83
- Shangguan et al. (2019) Shangguan, J., Ho, L. C., Li, R., et al. 2019, ApJ, 870, 104, doi: 10.3847/1538-4357/aaf21a
- Solomon & Vanden Bout (2005) Solomon, P. M., & Vanden Bout, P. A. 2005, ARA&A, 43, 677, doi: 10.1146/annurev.astro.43.051804.102221
- Tadaki et al. (2018) Tadaki, K., Iono, D., Yun, M. S., et al. 2018, Nature, 560, 613, doi: 10.1038/s41586-018-0443-1
- Talia et al. (2018) Talia, M., Pozzi, F., Vallini, L., et al. 2018, MNRAS, 476, 3956, doi: 10.1093/mnras/sty481
- Valentino et al. (2018) Valentino, F., Magdis, G. E., Daddi, E., et al. 2018, ApJ, 869, 27, doi: 10.3847/1538-4357/aaeb88
- Valentino et al. (2020) —. 2020, ApJ, 890, 24, doi: 10.3847/1538-4357/ab6603
- Veilleux et al. (2013) Veilleux, S., Meléndez, M., Sturm, E., et al. 2013, ApJ, 776, 27, doi: 10.1088/0004-637X/776/1/27
- Walter et al. (2011) Walter, F., Weiß, A., Downes, D., Decarli, R., & Henkel, C. 2011, ApJ, 730, 18, doi: 10.1088/0004-637X/730/1/18
- Weiß et al. (2005) Weiß, A., Walter, F., & Scoville, N. Z. 2005, A&A, 438, 533, doi: 10.1051/0004-6361:20052667
- Yang et al. (2017) Yang, C., Omont, A., Beelen, A., et al. 2017, A&A, 608, A144, doi: 10.1051/0004-6361/201731391
Appendix A Appendix
A.1 Figures

A.2 Tables
| Target Name | coodinates (ICRS) | redshift | CO (4–3) sky | [CI] (1–0) sky | |||
|---|---|---|---|---|---|---|---|
| hmsdms | Mpc | kpc | km s-1 | GHz | GHz | ||
| NGC 232 | 00h42m45.8s -23d33m40.7s | 0.0226 | 102 | 0.47 | 6637 | 450.8 | 481.3 |
| NGC 232-2 (NGC 235) | 00h42m52.9s -23d32m29.4s | ||||||
| NGC 232-3 (PGC 2570) | 00h42m53.8s -23d32m44.3s | ||||||
| IC 1623 | 01h07m46.8s -17d30m25.7s | 0.0201 | 90 | 0.42 | 5898 | 452.0 | 482.5 |
| UGC 02982 | 04h12m22.7s +05d32m49.1s | 0.0177 | 79 | 0.37 | 5213 | 453.0 | 483.6 |
| NGC 1614 | 04h34m00.0s -08d34m44.6s | 0.0159 | 71 | 0.34 | 4703 | 453.8 | 484.4 |
| IRAS F05189-2524 | 05h21m01.4s -25d21m45.4s | 0.0426 | 194 | 0.87 | 12239 | 442.2 | 472.1 |
| IRAS 09022-3615 | 09h04m12.7s -36d27m00.8s | 0.0596 | 276 | 1.19 | 16874 | 435.1 | 464.5 |
| IRAS F09111-1007 | 09h13m36.4s -10d19m29.6s | 0.0541 | 249 | 1.09 | 15397 | 437.4 | 466.9 |
| NGC 3110 | 10h04m02.1s -06d28m29.1s | 0.0169 | 76 | 0.35 | 4970 | 453.4 | 484.0 |
| IRAS F10565+2448 | 10h59m18.1s +24d32m34.5s | 0.0431 | 197 | 0.88 | 12387 | 442.0 | 471.8 |
| IRAS F10565+2448-2 | 10h59m19.9s +24d32m45.7s | ||||||
| IRAS F12112+0305 | 12h13m46.1s +02d48m41.5s | 0.0733 | 342 | 1.44 | 20478 | 429.5 | 458.5 |
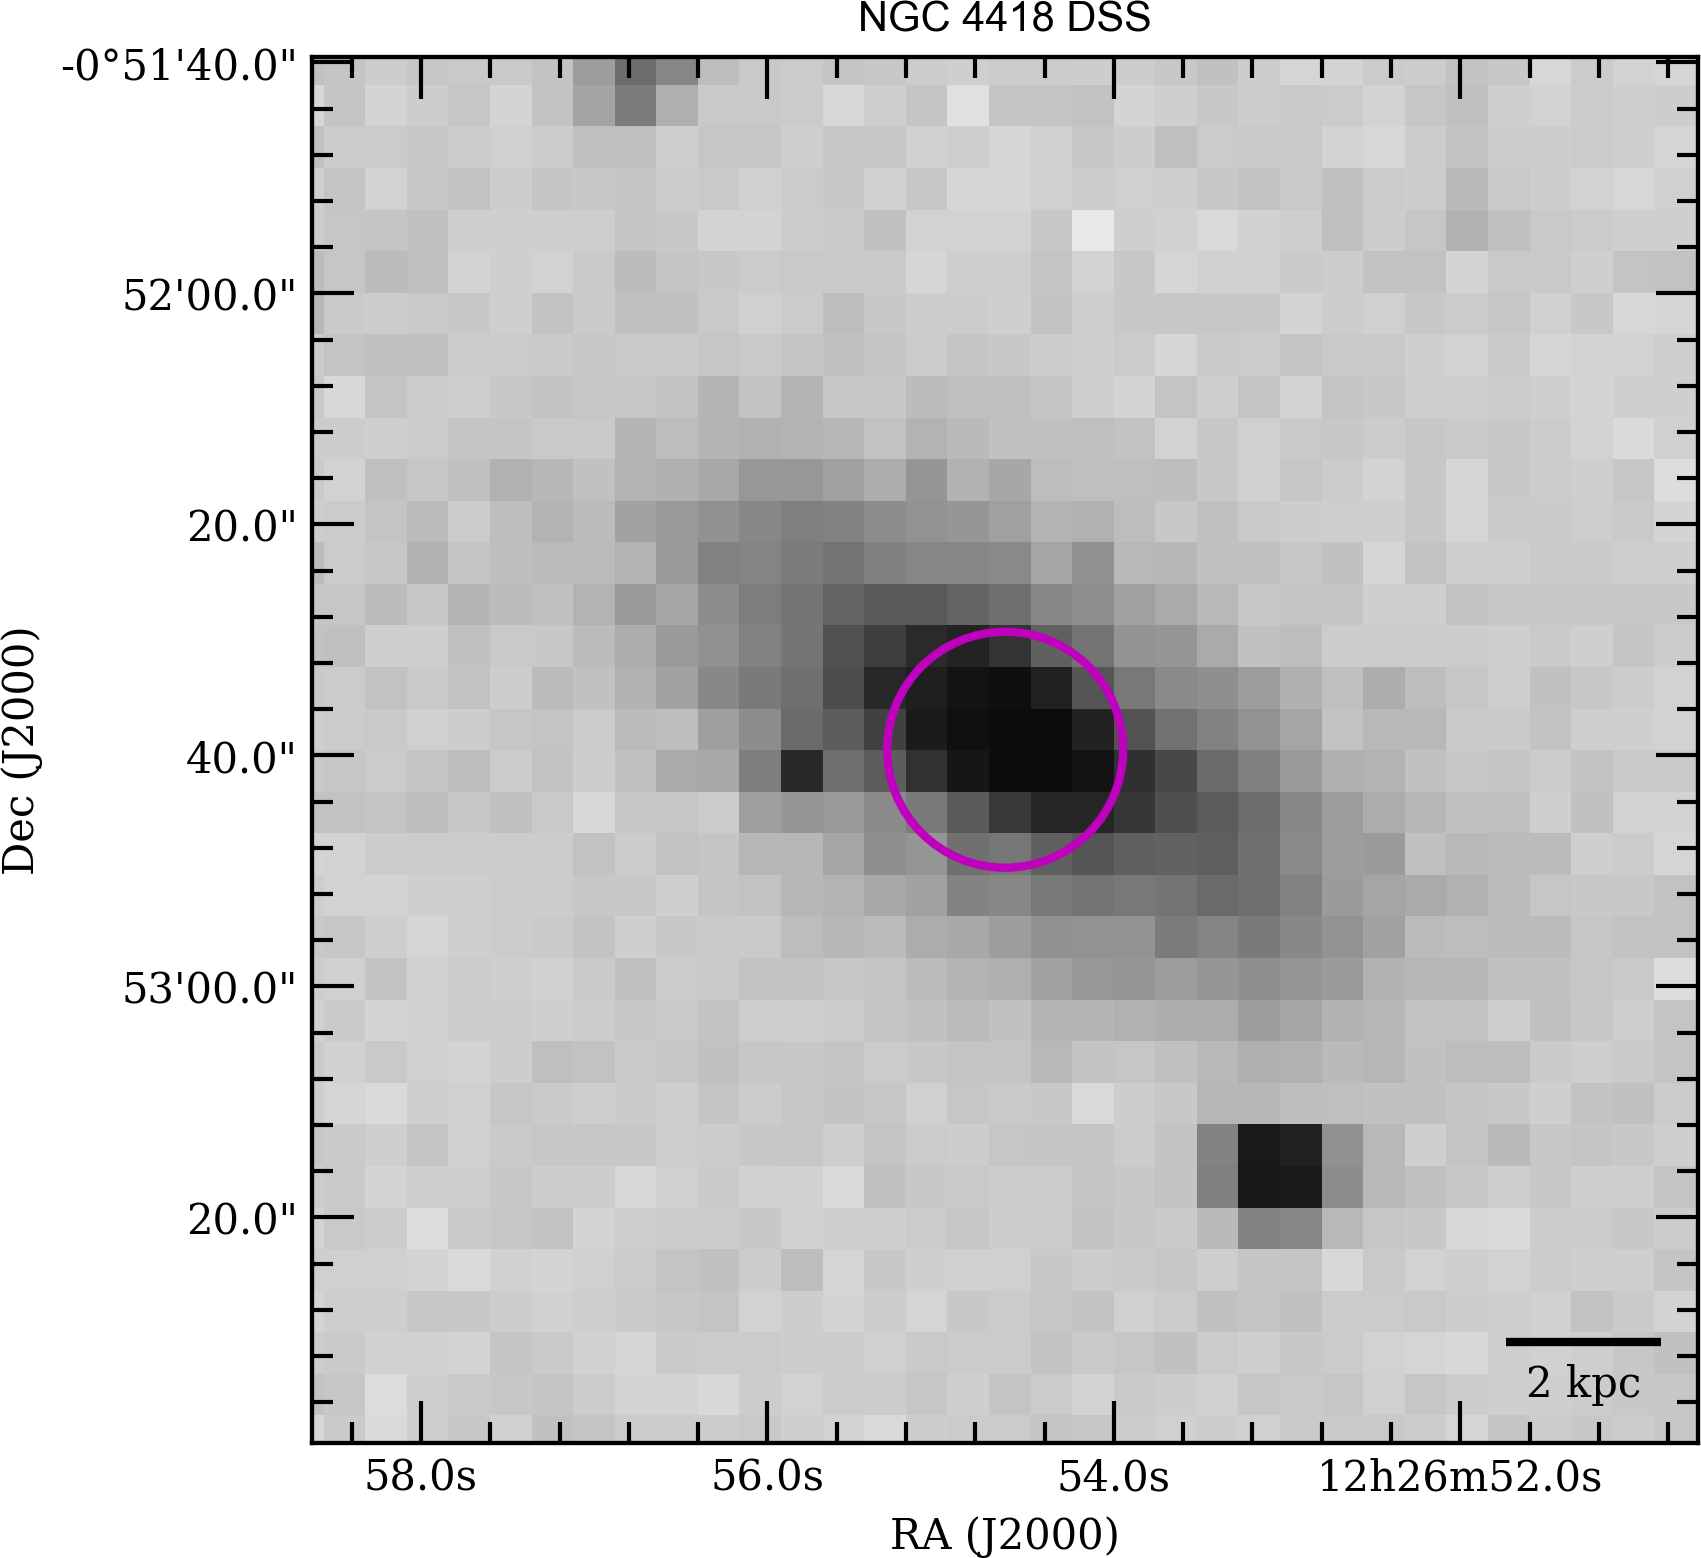
| NGC 4418 | 12h26m54.6s -00d52m39.5s | 0.007 | 32 | 0.15 | 2094 | 457.7 | 488.6 |
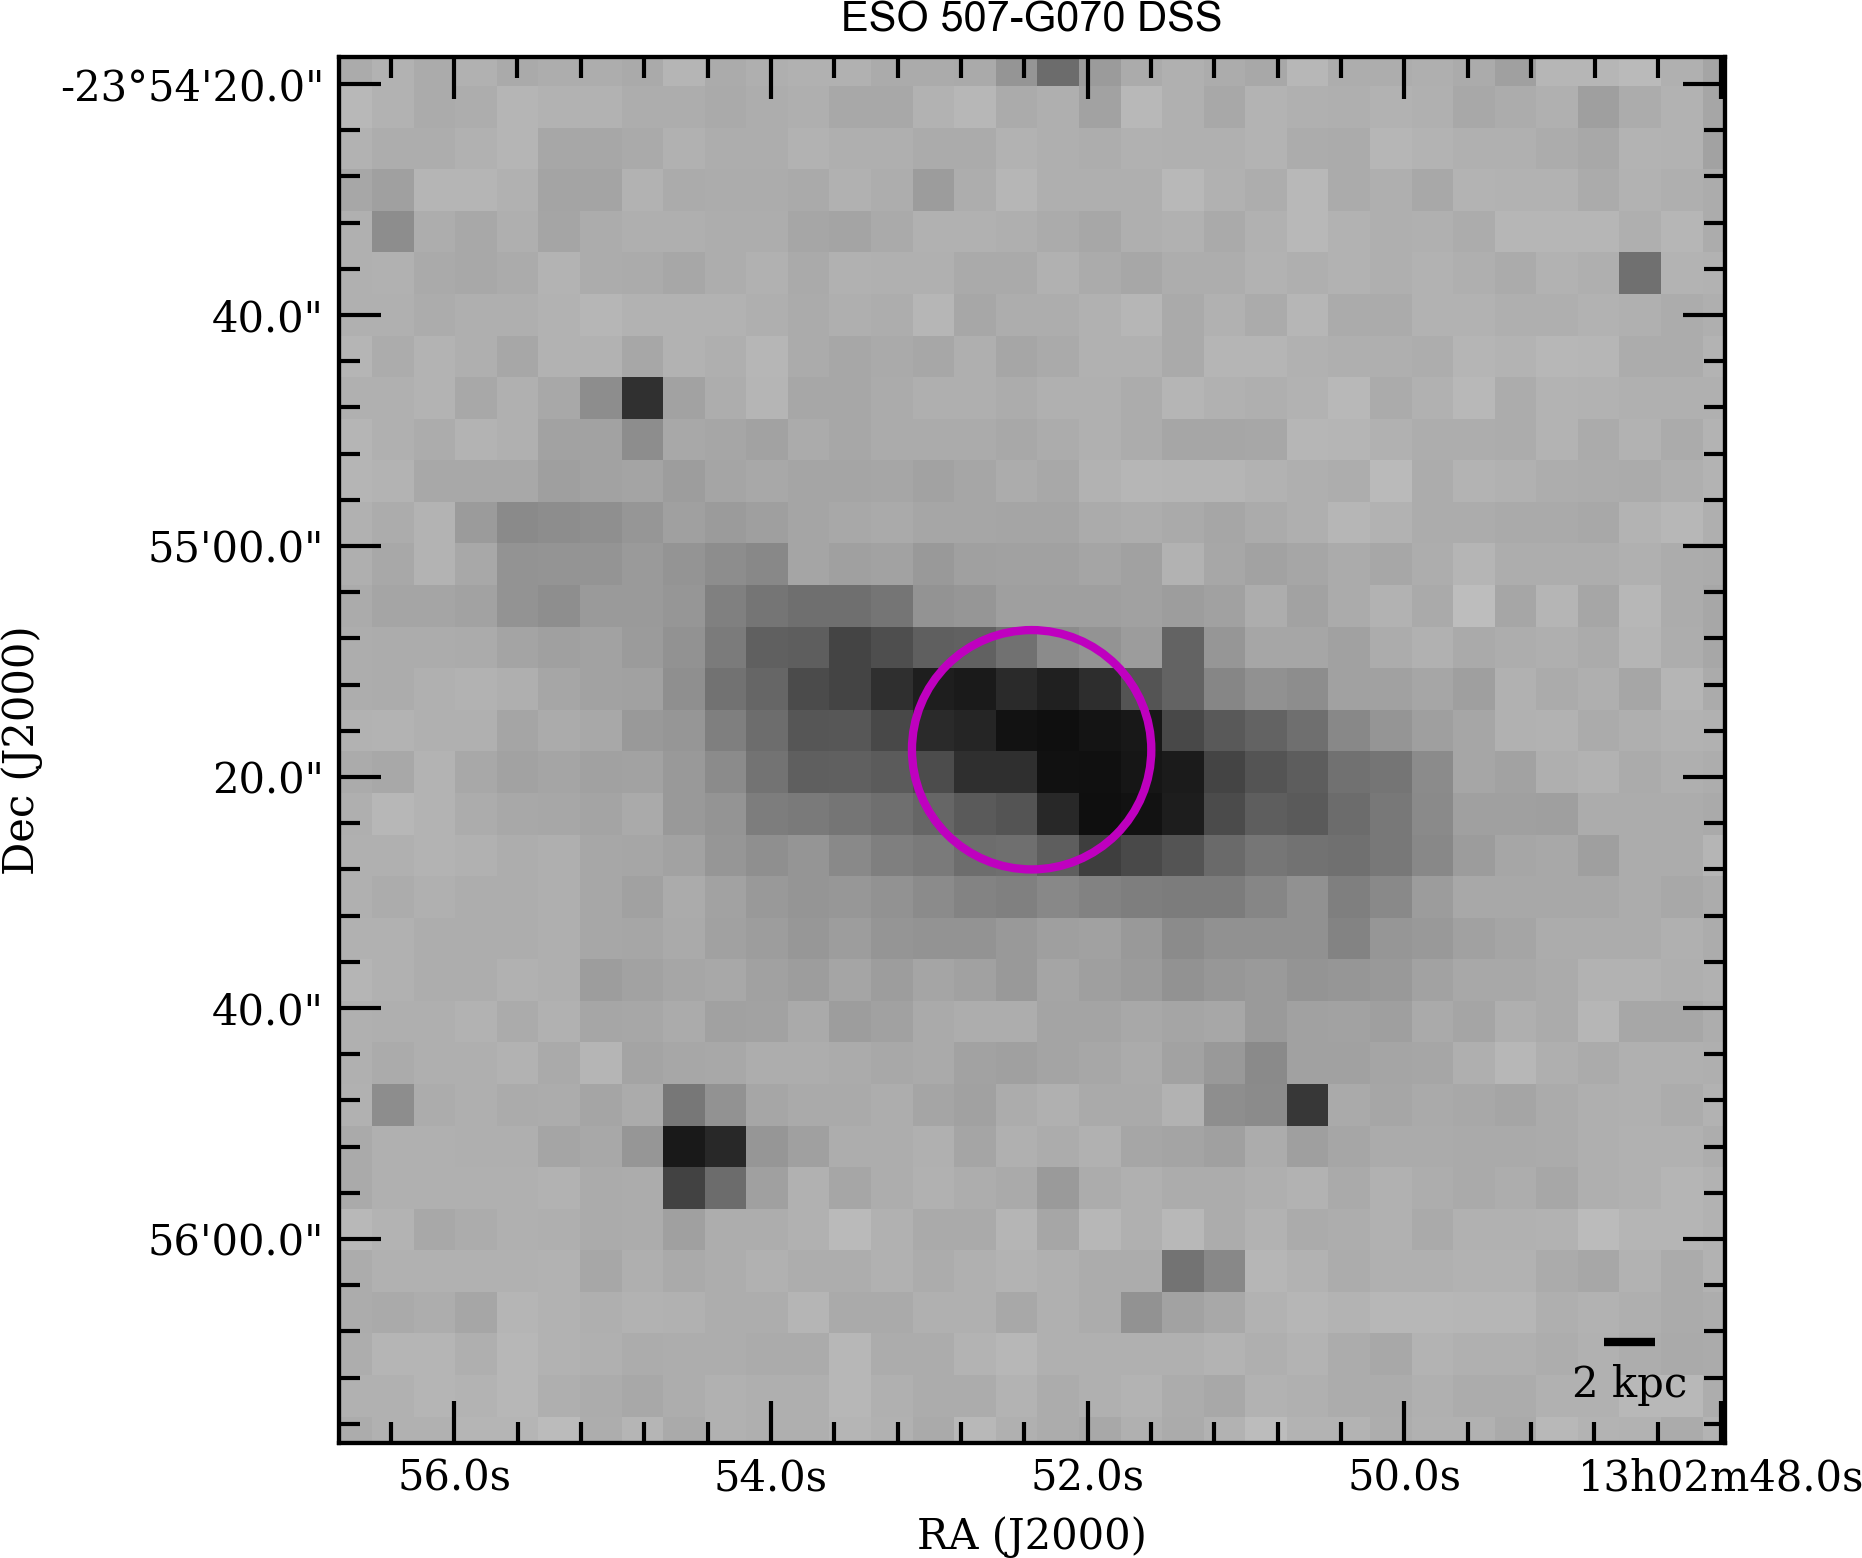
| ESO 507-G070 | 13h02m52.4s -23d55m17.7s | 0.0217 | 98 | 0.45 | 6368 | 451.2 | 481.7 |
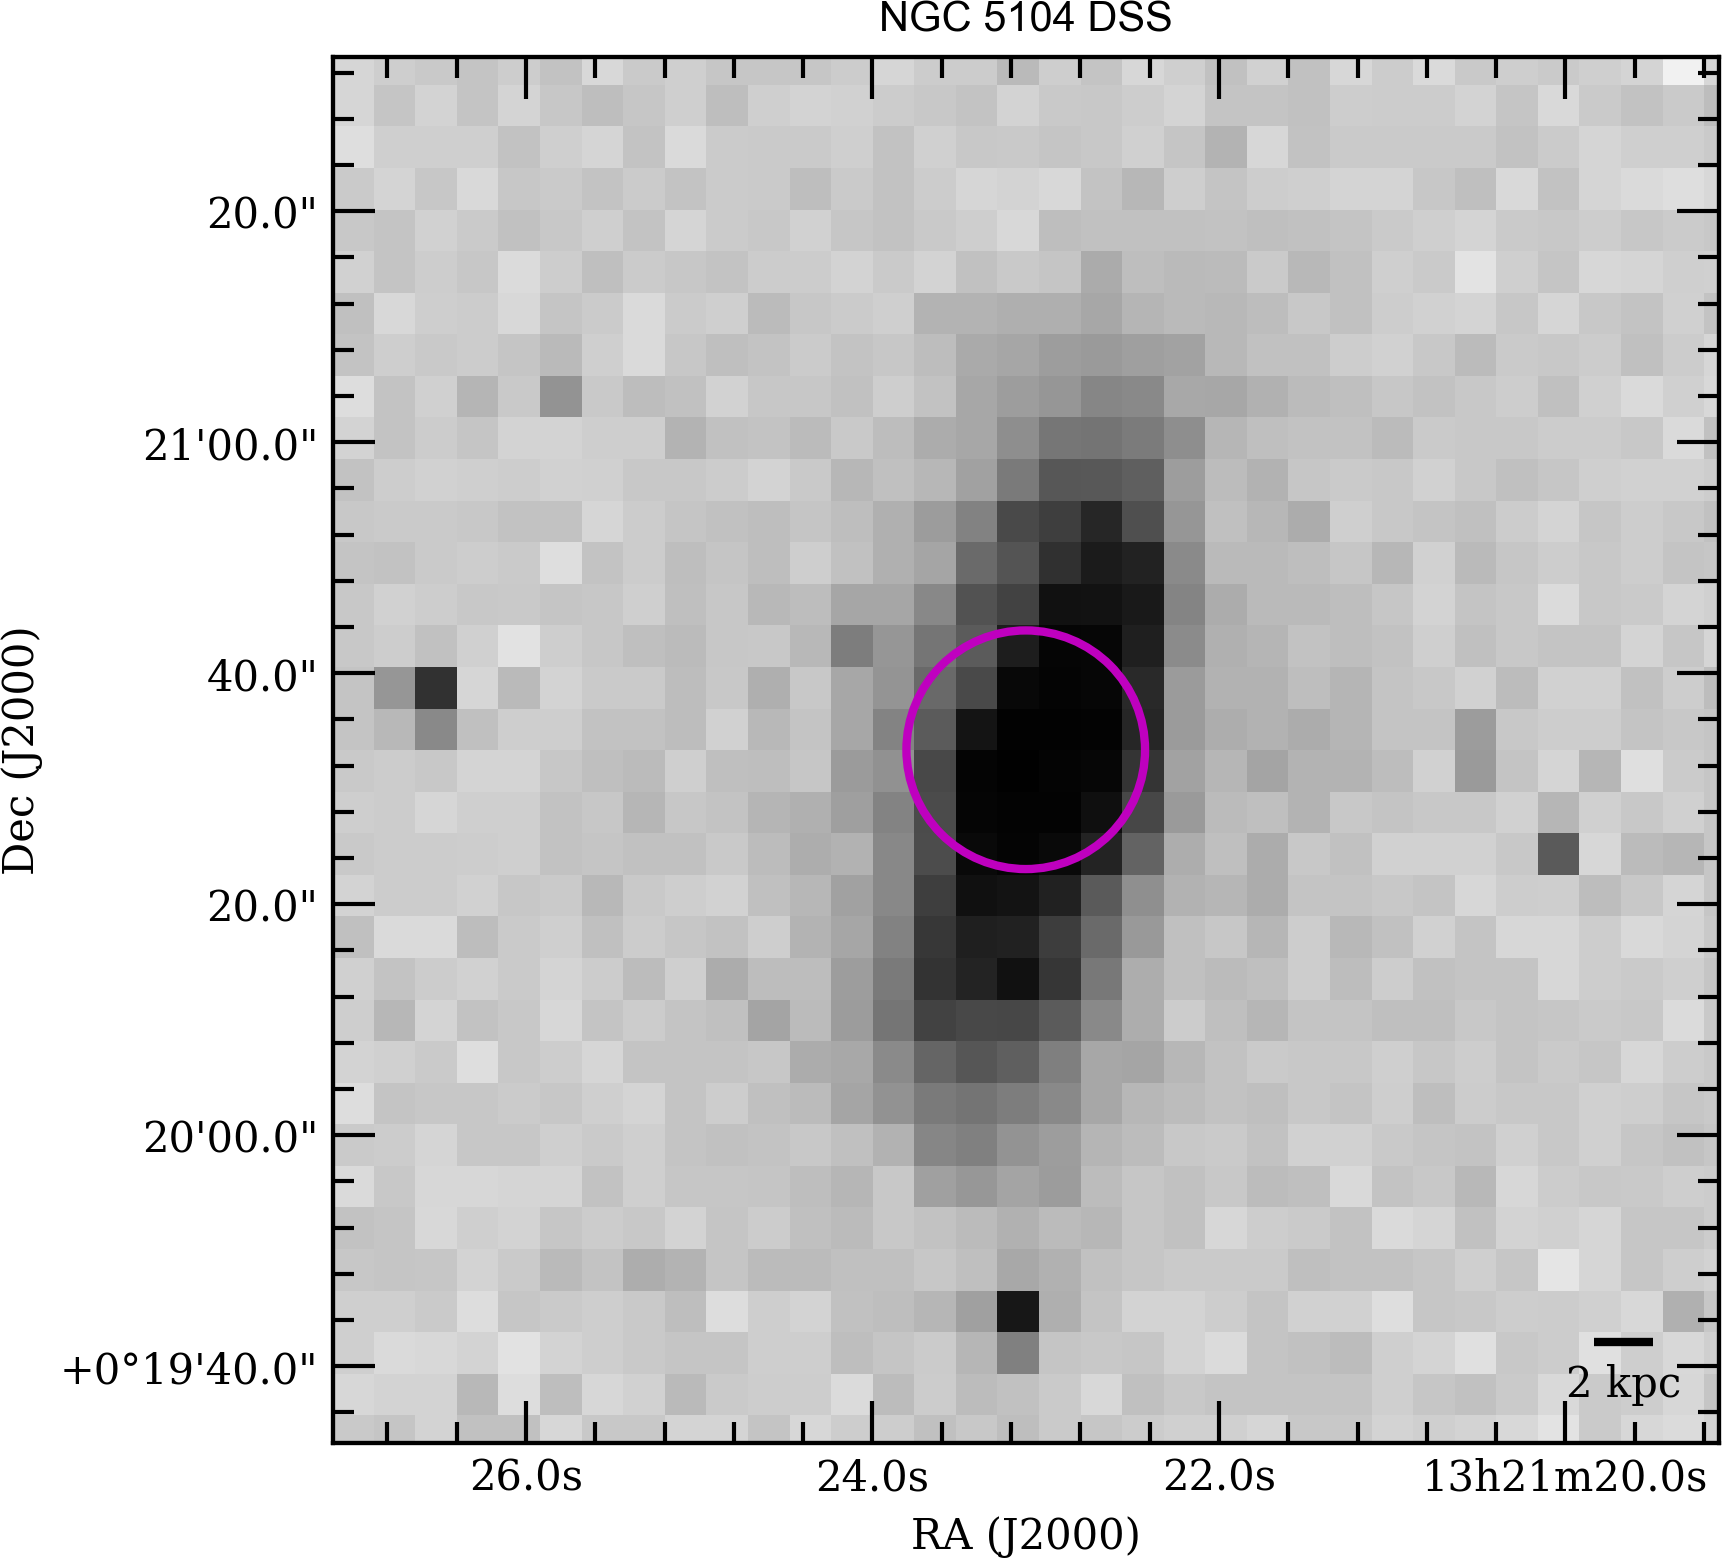
| NGC 5104 | 13h21m23.1s +00d20m33.4s | 0.0186 | 83 | 0.39 | 5476 | 452.6 | 483.2 |
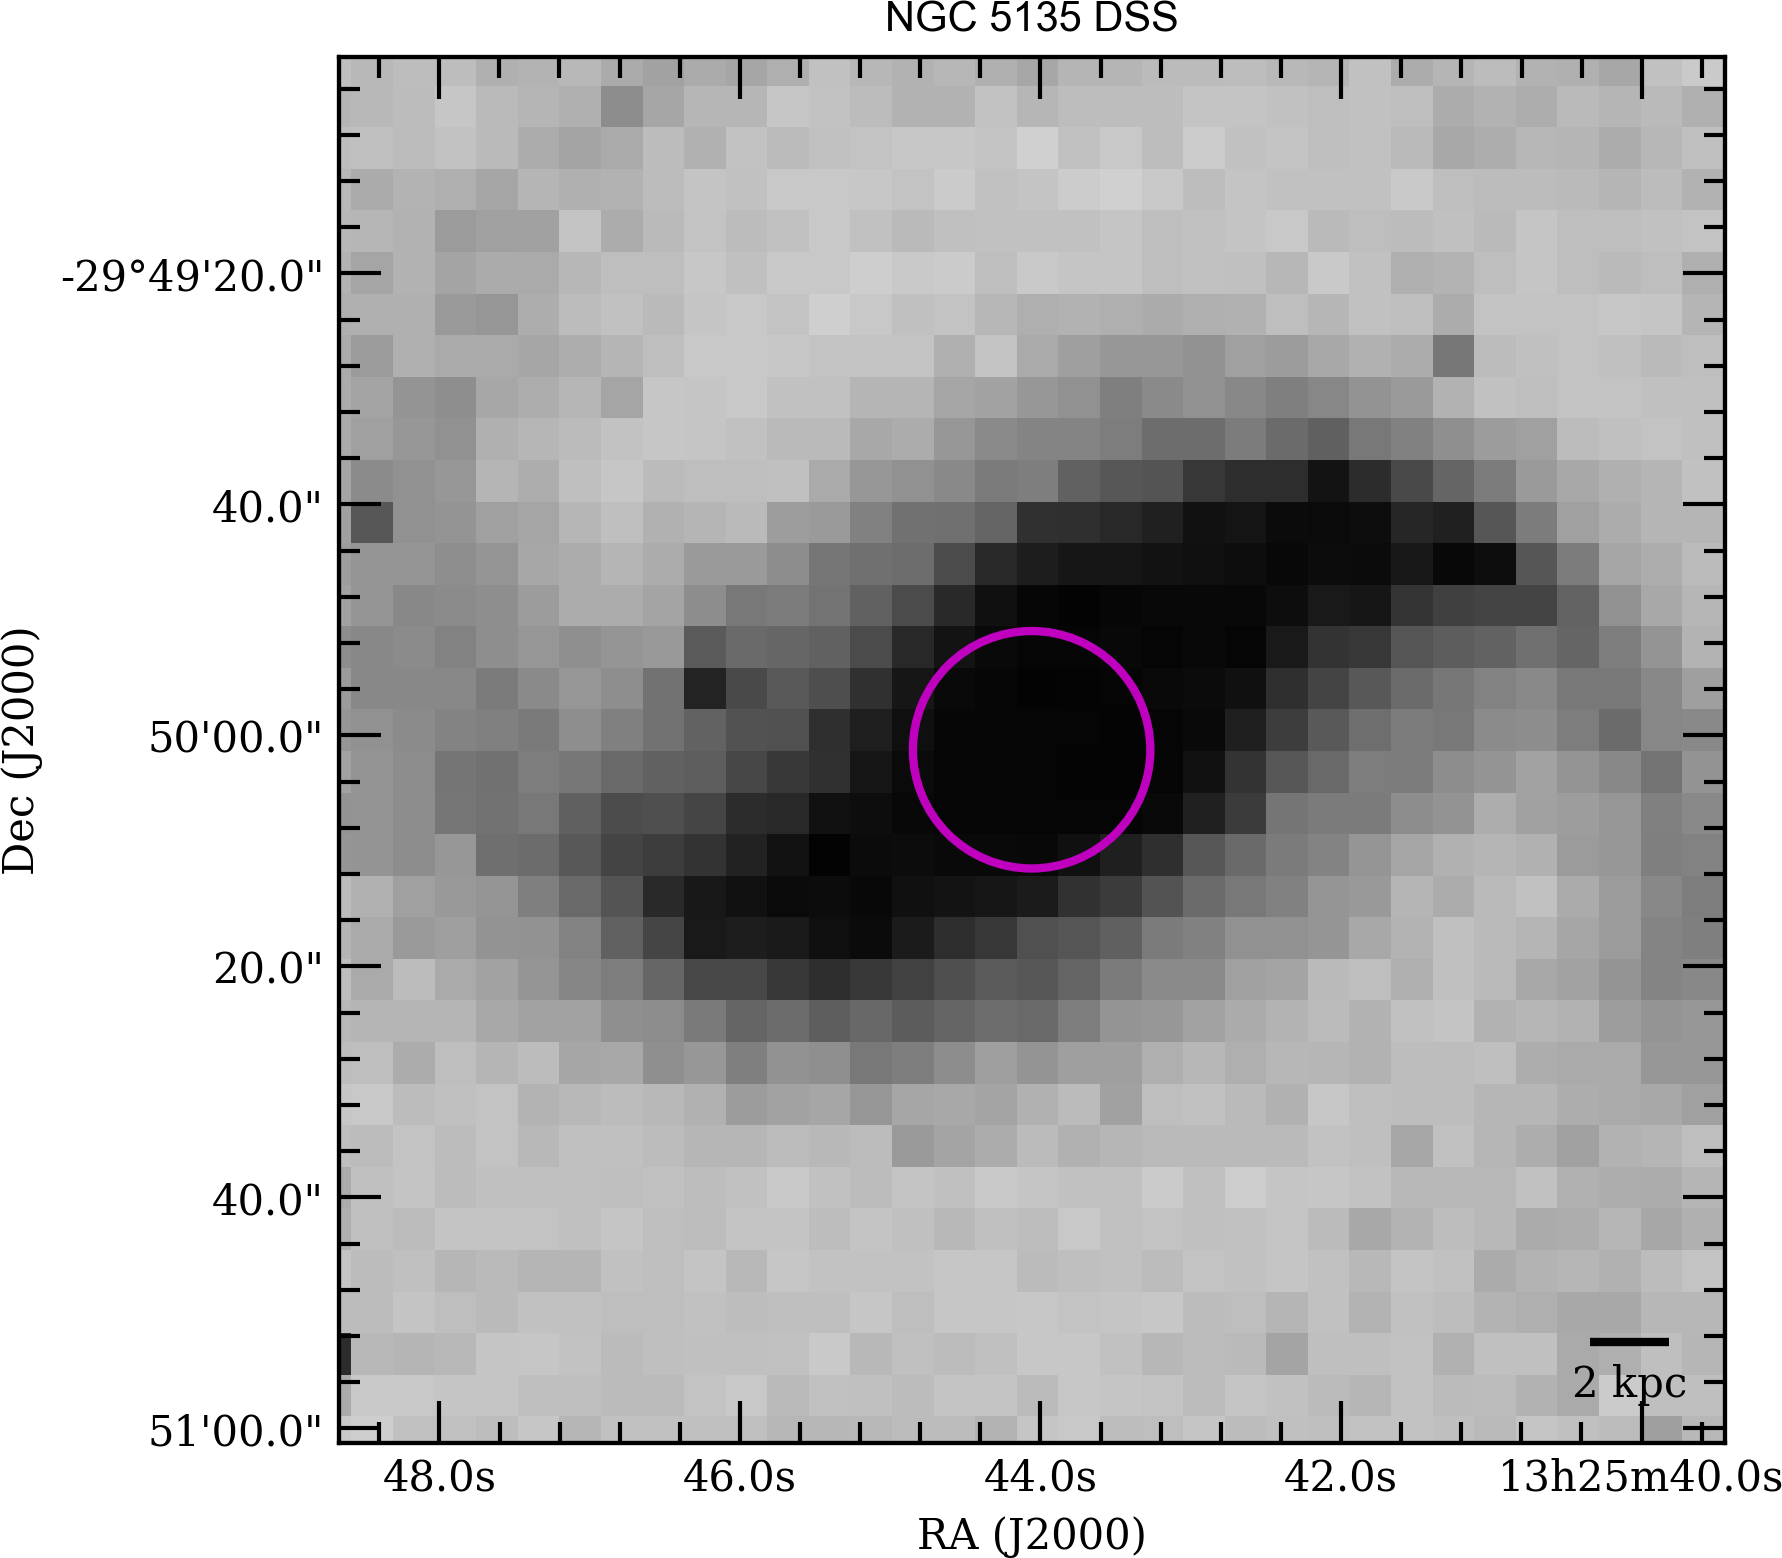
| NGC 5135 | 13h25m44.1s -29d50m01.2s | 0.0137 | 61 | 0.29 | 4050 | 454.8 | 485.5 |
| IC 4280 | 13h32m53.4s -24d12m25.8s | 0.0163 | 73 | 0.34 | 4811 | 453.6 | 484.3 |
| IRAS F14378-3651 | 14h40m59.0s -37d04m32.2s | 0.0681 | 314 | 1.34 | 19112 | 431.8 | 461.0 |
| CGCG 049-057 | 15h13m13.1s +07d13m31.9s | 0.013 | 58 | 0.27 | 3847 | 455.1 | 485.8 |
| NGC 5936 | 15h30m00.8s +12d59m21.6s | 0.0134 | 60 | 0.28 | 3951 | 455.0 | 485.7 |
| Arp 220 | 15h34m57.2s +23d30m11.6s | 0.0181 | 81 | 0.38 | 5337 | 452.8 | 483.4 |
| NGC 5990 | 15h46m16.4s +02d24m55.8s | 0.0128 | 57 | 0.27 | 3791 | 455.2 | 485.9 |
| NGC 6052 | 16h05m12.9s +20d32m32.6s | 0.0158 | 71 | 0.33 | 4665 | 453.9 | 484.5 |
| ESO 069-IG006 | 16h38m11.9s -68d26m09.8s | 0.0464 | 213 | 0.94 | 13304 | 440.6 | 470.3 |
| ESO 069-IG006-2 | 16h38m13.8s -68d27m20.9s | ||||||
| IRAS F17207-0014 | 17h23m22.0s -00d17m00.9s | 0.0428 | 195 | 0.87 | 12307 | 442.1 | 472.0 |
| IRAS F18293-3413 | 18h32m41.1s -34d11m27.2s | 0.0182 | 81 | 0.38 | 5352 | 452.8 | 483.4 |
| IC 4734 | 18h38m25.7s -57d29m25.8s | 0.0156 | 70 | 0.33 | 4608 | 454.0 | 484.6 |
| IRAS 19542+1110 | 19h56m35.4s +11d19m03.0s | 0.0624 | 301 | 1.29 | 17608 | 432.9 | 462.1 |
| ESO 286-IG019 | 20h58m26.8s -42d39m00.3s | 0.043 | 196 | 0.87 | 12359 | 442.0 | 471.9 |
| NGC 7130 | 21h48m19.5s -34d57m04.7s | 0.0162 | 72 | 0.34 | 4765 | 453.7 | 484.3 |
| ESO 467-G027 | 22h14m39.9s -27d27m50.2s | 0.0174 | 78 | 0.37 | 5127 | 453.2 | 483.7 |
| IRAS F22491-1808 | 22h51m49.3s -17d52m24.0s | 0.0778 | 364 | 1.52 | 21630 | 427.8 | 456.7 |
| NGC 7469 | 23h03m15.7s +08d52m25.3s | 0.0163 | 73 | 0.34 | 4813 | 453.6 | 484.3 |
| ESO 148-IG002 | 23h15m46.8s -59d03m15.9s | 0.0446 | 204 | 0.91 | 12800 | 441.4 | 471.1 |
| NGC 7552 | 23h16m10.8s -42d35m05.4s | 0.0054 | 24 | 0.11 | 1600 | 458.6 | 489.5 |
| NGC 7591 | 23h18m16.3s +06d35m08.8s | 0.0165 | 74 | 0.35 | 4875 | 453.5 | 484.2 |
| NGC 7679 | 23h28m46.7s +03d30m41.0s | 0.0171 | 77 | 0.36 | 5052 | 453.3 | 483.9 |
| Mrk 331 | 23h51m26.7s +20d35m10.6s | 0.0185 | 83 | 0.39 | 5441 | 452.7 | 483.2 |
Note. — (1) Target names. If the galaxy is the pair phase of a merger process, the companion’s names are described as “-2” and “-3.” (2) Pointing center of the ACA observation. (3) The redshift is based on NED. In the case of IRAS F14378-3651, NGC 4418, and IRAS 19542+1110, the redshifts are based on Rose et al. (2018), González-Alfonso et al. (2012), and Veilleux et al. (2013), respectively. (4) Luminosity distance. (5) Physical scale corresponding to . (6) The systematic velocity calculated by , where is the speed of light). In the case of a pair of galaxies, we apply the same systematic velocity to identify the line emission. (7), (8) Observed sky frequencies of [C I] (1–0) and CO (4–3).
| Target Name | SFR | AGN | Merger | ||||
|---|---|---|---|---|---|---|---|
| yr-1 | K | ||||||
| NGC 232 | – | – | – | – | Y | Y | – |
| NGC 232-2 (NGC 235) | – | – | – | – | – | – | – |
| NGC 232-3 (PGC 2570) | – | – | – | – | – | – | – |
| IC 1623 | 1.670.02 | 8.270.02 | 27.50.7 | 11.60.02 | N | Y | 50553 |
| UGC 02982 | 1.270.04 | 8.310.09 | 23.60.6 | 11.210.05 | N | Y | 486121 |
| NGC 1614 | 1.760.03 | 7.910.04 | 32.11.0 | 11.70.03 | N | Y | 14335 |
| IRAS F05189-2524 | 1.890.05 | 8.190.05 | 34.41.1 | 11.820.05 | Y | Y | 1173234 |
| IRAS 09022-3615 | 2.280.03 | 8.60.04 | 34.41.0 | 12.220.04 | Y | Y | – |
| IRAS F09111-1007 | 2.070.02 | 8.760.03 | 27.10.7 | 12.020.02 | Y | Y | – |
| NGC 3110 | – | – | – | – | N | Y | 42084 |
| IRAS F10565+2448 | 2.140.03 | 8.450.01 | 31.20.8 | 12.090.01 | N | Y | 853171 |
| IRAS F10565+2448-2 | 2.140.03 | 8.450.01 | 31.20.8 | 12.090.01 | – | – | – |
| IRAS F12112+0305 | 2.330.03 | 8.660.03 | 32.00.9 | 12.280.03 | Y | Y | – |
| NGC 4418 | – | – | – | – | Y | N | – |
| ESO 507-G070 | 1.590.04 | 8.030.05 | 30.10.8 | 11.520.04 | – | Y | 36673 |
| NGC 5104 | 1.320.02 | 8.220.03 | 25.40.6 | 11.270.02 | N | N | 31771 |
| NGC 5135 | 1.340.01 | 8.310.01 | 24.80.6 | 11.280.01 | Y | N | 516103 |
| IC 4280 | 1.210.01 | 8.30.03 | 24.10.5 | 11.150.02 | – | N | 37393 |
| IRAS F14378-3651 | 2.160.06 | 8.440.05 | 32.10.9 | 12.060.07 | Y | Y | – |
| CGCG 049-057 | 1.390.04 | 8.020.06 | 28.00.8 | 11.340.05 | Y | N | 10320 |
| NGC 5936 | 1.20.01 | 8.170.02 | 24.60.6 | 11.140.01 | N | N | 23246 |
| Arp 220 | 2.350.07 | 8.820.08 | 28.61.6 | 12.290.08 | Y | Y | 1065212 |
| NGC 5990 | 1.160.01 | 7.980.02 | 25.30.6 | 11.10.02 | Y | Y | 23959 |
| NGC 6052 | 1.130.02 | 7.910.03 | 25.70.6 | 11.030.02 | N | Y | 18044 |
| ESO 069-IG006 | – | – | – | – | – | Y | 1861372 |
| ESO 069-IG006-2 | – | – | – | – | – | – | – |
| IRAS F17207-0014 | 2.470.07 | 8.820.05 | 31.70.9 | 12.40.05 | Y | Y | 2296460 |
| IRAS F18293-3413 | 1.960.04 | 8.590.08 | 27.80.7 | 11.90.05 | N | Y | 1155231 |
| IC 4734 | 1.430.03 | 8.20.05 | 26.40.6 | 11.360.03 | N | N | 29960 |
| IRAS 19542+1110 | 2.060.04 | 8.360.04 | 33.71.0 | 11.990.04 | Y | N | – |
| ESO 286-IG019 | 1.850.05 | 8.20.05 | 34.61.1 | 11.80.05 | N | Y | 67013 |
| NGC 7130 | 1.480.03 | 8.230.03 | 25.41.3 | 11.370.02 | Y | N | 23126 |
| ESO 467-G027 | 1.130.02 | 8.210.03 | 23.90.5 | 11.070.02 | N | N | 23759 |
| IRAS F22491-1808 | – | – | – | – | – | – | 716142 |
| NGC 7469 | – | – | – | – | Y | Y | 29243 |
| ESO 148-IG002 | 1.930.03 | 8.240.03 | 35.21.2 | 11.880.04 | Y | Y | 44388 |
| NGC 7552 | – | – | – | – | – | – | 777 |
| NGC 7591 | – | – | – | – | Y | N | 30060 |
| NGC 7679 | 1.170.02 | 7.830.04 | 27.10.7 | 11.110.02 | Y | Y | 15225 |
| Mrk 331 | – | – | – | – | Y | Y | 10921 |
Note. — (1) Target names. (2)-(5) SFR, , , and estimated in Shangguan et al. (2019). is for 8 - 1000 m and the AGN contribution has been subtracted. (6) Y and N represent AGN and non-AGN, respectively. (7) Y and N represent mergers and non-mergers, respectively. The classification of AGNs and mergers was from Shangguan et al. (2019). (8) CO (1–0) luminosity measured by Kamenetzky et al. (2016).
| Target Name | date | line | (ave.) | MRS (representative freq.) | |
|---|---|---|---|---|---|
| y/m/d | K | (GHz) | |||
| Arp220, NGC 6052 | 2018/11/15 | [C I] (1–0) | 793 | 10 | 13.81 (484.53) |
| NGC 5104 | 2018/12/3 | CO (4–3) | 429 | 12 | 14.6 (452.66) |
| IRAS F14378-3651 | 2018/12/5 | [C I] (1–0) | 367 | 11 | 14.35 (460.62) |
| IRAS F22491-1808 | 2018/12/5 | CO (4–3) | 1243 | 12 | 15.42 (428.44) |
| IRAS 09022-3615 | 2019/1/12 | [C I] (1–0) | 949 | 11 | 14.23 (464.4) |
| NGC 5990 | 2019/1/13 | CO (4–3) | 1454 | 11 | 14.51 (455.25) |
| IRAS 09022-3615 | 2019/1/13 | CO (4–3) | – | 10 | 15.4 (434.32) |
| NGC 3110 | 2019/3/16 | [C I] (1–0) | 995 | 11 | 13.66 (483.84) |
| IRAS F12112+0305 | 2019/3/16 | [C I] (1–0) | 713 | 11 | 14.12 (458.48) |
| NGC 4418 | 2019/3/16 | CO (4–3) | – | 11 | 14.43 (457.76) |
| IRAS F10565+2448, IRAS F10565+2448-2 | 2019/3/20 | [C I] (1–0) | 525 | 12 | 14.03 (470.88) |
| NGC 4418 | 2019/3/20 | [C I] (1–0) | – | 12 | 13.52 (488.64) |
| IRAS F12112+0305 | 2019/3/20 | CO (4–3) | 470 | 12 | 15.38 (429.6) |
| IRAS 09022-3615 | 2019/3/24 | [C I] (1–0) | 1279 | 12 | 14.19 (465.82) |
| IRAS F14378-3651 | 2019/3/24 | CO (4–3) | – | 12 | 15.31 (431.6) |
| IRAS F18293-3413 | 2019/3/8 | [C I] (1–0) | 900 | 12 | 13.68 (483.16) |
| NGC 7552 | 2019/4/19 | CO (4–3) | – | 11 | 13.8 (458.25) |
| Arp220, NGC 6052 | 2019/4/21 | [C I] (1–0) | 1064 | 11 | 13.06 (484.53) |
| NGC 5990 | 2019/4/27 | [C I] (1–0) | – | 11 | 13.02 (485.96) |
| IRAS F09111-1007 | 2019/4/28 | CO (4–3) | – | 10 | 13.03 (435.72) |
| NGC 5990 | 2019/4/30 | CO (4–3) | 3808 | 9 | 12.47 (455.25) |
| IRAS F05189-2524 | 2019/5/12 | [C I] (1–0) | 325 | 11 | 13.43 (471.06) |
| NGC 1614 | 2019/5/12 | CO (4–3) | 544 | 11 | 13.94 (453.81) |
| CGCG 049-057, NGC 5936 | 2019/5/13 | CO (4–3) | 1014 | 11 | 13.91 (455.01) |
| IC 4734 | 2019/5/24 | [C I] (1–0) | 319 | 11 | 13.06 (484.5) |
| IRAS F09111-1007 | 2019/5/24 | CO (4–3) | – | 10 | 15.16 (435.72) |
| CGCG 049-057, NGC 5936 | 2019/5/24 | [C I] (1–0) | 789 | 11 | 13.03 (485.71) |
| IRAS F18293-3413 | 2019/5/24 | [C I] (1–0) | 264 | 11 | 13.1 (483.16) |
| IRAS F17207-0014 | 2019/5/24 | [C I] (1–0) | 216 | 11 | 13.43 (471.0) |
| IRAS F10565+2448, IRAS F10565+2448-2 | 2019/6/2 | CO (4–3) | 523 | 11 | 14.34 (441.12) |
| NGC 3110 | 2019/6/2 | CO (4–3) | 618 | 11 | 13.96 (453.26) |
| NGC 7469, NGC 7679, NGC 7591 | 2019/6/22 | CO (4–3) | 893 | 10 | 14.56 (453.74) |
| ESO 148-IG002 | 2019/6/22 | CO (4–3) | 680 | 11 | 14.34 (441.15) |
| UGC 02982 | 2019/6/22 | [C I] (1–0) | 587 | 10 | 13.67 (483.47) |
| NGC 1614 | 2019/6/22 | [C I] (1–0) | 702 | 10 | 13.64 (484.42) |
| NGC 1614 | 2019/6/22 | CO (4–3) | 896 | 10 | 14.56 (453.81) |
| UGC 02338 | 2019/6/22 | CO (4–3) | 742 | 10 | 14.55 (454.14) |
| NGC 7771, Mrk 331 | 2019/6/23 | [C I] (1–0) | 663 | 11 | 13.1 (482.96) |
| ESO 069-IG006, ESO_069-IG006-2 | 2019/6/23 | CO (4–3) | 715 | 11 | 14.38 (440.06) |
| NGC 5990 | 2019/6/23 | CO (4–3) | 4403 | 11 | 13.9 (455.25) |
| ESO 069-IG006, ESO 069-IG006-2 | 2019/6/23 | [C I] (1–0) | 600 | 11 | 13.47 (469.75) |
| NGC 7771, Mrk 331 | 2019/6/23 | CO (4–3) | 1079 | 11 | 13.99 (452.44) |
| IC 4734 | 2019/6/23 | CO (4–3) | 1998 | 11 | 13.94 (453.88) |
| NGC 5135, IC 4280, ESO 507-G070 | 2019/6/24 | CO (4–3) | 1256 | 11 | 13.91 (454.75) |
| NGC 5990 | 2019/6/24 | CO (4–3) | 2777 | 11 | 13.9 (455.25) |
| ESO 069-IG006, ESO 069-IG006-2 | 2019/6/24 | [C I] (1–0) | 420 | 11 | 13.47 (469.75) |
| NGC 7771, Mrk 331 | 2019/6/24 | CO (4–3) | 1566 | 11 | 13.99 (452.44) |
| IC 4734 | 2019/6/24 | CO (4–3) | 734 | 11 | 13.94 (453.88) |
| IRAS F18293-3413 | 2019/6/24 | CO (4–3) | 587 | 11 | 13.98 (452.62) |
| ESO 069-IG006, ESO 069-IG006-2 | 2019/6/24 | CO (4–3) | 771 | 11 | 14.38 (440.06) |
| NGC 7771, Mrk 331 | 2019/6/24 | [C I] (1–0) | 1197 | 11 | 13.1 (482.96) |
| NGC 5104 | 2019/6/3 | [C I] (1–0) | 682 | 11 | 13.68 (483.2) |
| NGC 5135, IC 4280, ESO 507-G070 | 2019/6/3 | [C I] (1–0) | 83 | 11 | 13.3 (485.42) |
| IRAS F17207-0014 | 2019/6/3 | CO (4–3) | 410 | 11 | 14.34 (441.24) |
| Arp 220, NGC 6052 | 2019/6/3 | CO (4–3) | 697 | 11 | 13.94 (453.91) |
| ESO 467-G027, NGC 7130 | 2019/6/6 | [C I] (1–0) | 734 | 10 | 11.74 (483.57) |
| IRAS 05442+1732 | 2019/6/6 | [C I] (1–0) | 674 | 9 | 11.75 (483.08) |
| ESO 286-IG019 | 2019/6/7 | CO (4–3) | 607 | 9 | 12.85 (441.99) |
| ESO 467-G027, NGC 7130 | 2019/6/7 | CO (4–3) | 625 | 9 | 12.51 (453.71) |
| ESO 148-IG002 | 2019/6/7 | [C I] (1–0) | 452 | 9 | 12.06 (470.91) |
| ESO 286 IG019 | 2019/6/7 | [C I] (1–0) | 445 | 9 | 12.03 (471.81) |
| IRAS 19542+1110 | 2019/6/8 | CO (4–3) | – | 9 | 13.12 (432.88) |
| NGC 232, NGC 232-2, NGC 232-3, IC 1623 | 2019/6/8 | [C I] (1–0) | 471 | 9 | 11.77 (482.22) |
| IRAS 19542+1110 | 2019/6/8 | [C I] (1–0) | 1062 | 9 | 12.3 (461.99) |
| NGC 7552 | 2019/6/8 | CO (4–3) | – | 9 | 12.38 (458.25) |
| IRAS F22491-1808 | 2019/6/8 | [C I] (1–0) | 417 | 9 | 12.42 (457.25) |
| NGC 7469, NGC 7679, NGC 7591 | 2019/6/8 | [C I] (1–0) | 650 | 9 | 11.74 (483.74) |
| NGC 7552 | 2019/6/8 | [C I] (1–0) | – | 9 | 11.6 (489.45) |
| IC 4734 | 2019/7/28 | CO (4–3) | 1642 | 11 | 13.94 (453.88) |
| IC 4734 | 2019/7/29 | CO (4–3) | 802 | 10 | 14.56 (453.88) |
| NGC 5135, IC 4280, ESO 507-G070 | 2019/7/31 | [C I] (1–0) | 1461 | 11 | 13.3 (485.42) |
| IRAS 05442+1732 | 2019/7/5 | CO (4–3) | 529 | 9 | 12.54 (452.55) |
| NGC 7771, Mrk 331 | 2019/7/5 | CO (4–3) | 739 | 10 | 14.61 (452.44) |
| NGC 5135, IC 4280, ESO 507-G070 | 2019/7/6 | CO (4–3) | 879 | 10 | 10.27 (454.75) |
| NGC 232, NGC 232-2, NGC 232-3, IC 1623 | 2019/7/6 | [C I] (1–0) | 379 | 10 | 9.68 (482.22) |
| NGC 5135, IC 4280, ESO 507-G070 | 2019/8/13 | [C I] (1–0) | 737 | 11 | 13.3 (485.42) |
| IRAS F05189-2524 | 2019/8/20 | CO (4–3) | 559 | 11 | 14.34 (441.29) |
| NGC 232, NGC 232-2, NGC 232-3, IC 1623 | 2019/8/5 | CO (4–3) | 640 | 10 | 12.57 (451.75) |
| NGC 232, NGC 232-2, NGC 232-3, IC 1623 | 2019/8/6 | CO (4–3) | 745 | 10 | 12.57 (451.75) |
Note. — (1) Target names. (2) Date of observation. (3) Observed line. (4) Typical systematic temperature. If the systematic temperature is not shown in QA0 report, the value is shown as “–.” (5) Number of antennas. (6) MRS scale shown in the QA0 report.
| Target Name | Beam | Beam | rms (cube) | rms (cube) | rms | rms | rms | v-range | v-range |
|---|---|---|---|---|---|---|---|---|---|
| CO (4–3) | [C I] (1–0) | CO (4–3) | [C I] (1–0) | CO (4–3) | [C I] (1–0) | cont | CO (4–3) | [C I] (1–0) | |
| ( , ) | ( , ) | *1 | *1 | *2 | *2 | *1 | km s-1 | km s-1 | |
| NGC 232 | 3.42.2 | 3.42.0 | 63 | 29 | 14 | 4 | 3.4,3.2 | [-220,290] | [-190,350] |
| NGC 232-2 (NGC 235) | 3.42.2 | 3.32.0 | 45 | 28 | 4 | 4 | 3.7,2.5 | [-310,-160] | [-280,140] |
| NGC 232-3 (PGC 2570) | 3.42.2 | 3.32.0 | 80 | 35 | 10 | 5 | 6.4,4.2 | ND | ND |
| IC 1623 | 4.02.2 | 3.52.0 | 64 | 25 | 17 | 4 | 4.2,3.5 | [-210,240] | [-190,170] |
| UGC 02982 | – | 3.22.7 | – | 33 | – | 4 | –,5.7 | – | [-150,210] |
| NGC 1614 | 3.52.4 | 3.32.6 | 56 | 47 | 11 | 7 | 4.5,5.4 | [-190,200] | [-160,200] |
| IRAS F05189-2524 | 4.82.2 | 3.52.3 | 58 | 33 | 9 | 3 | 3.5,3.6 | [-20,220] | [100,250] |
| IRAS 09022-3615 | 4.72.1 | 3.82.1 | 31 | 36 | 15 | 8 | 7.0,15.2 | [-450,360] | [-220,260] |
| IRAS F09111-1007 | 3.62.3 | 3.62.1 | 58 | 21 | 10 | 1 | 3.9,3.3 | [-50,190] | [120,240] |
| NGC 3110 | 3.52.3 | 3.51.8 | 46 | 57 | 11 | 8 | 2.4,10.4 | [-130,230] | [-110,220] |
| IRAS F10565+2448 | 3.63.1 | 3.52.8 | 60 | 34 | 12 | 2 | 5.8,2.2 | [-150,180] | [60,150] |
| IRAS F10565+2448-2 | 3.83.0 | 3.42.9 | 45 | 38 | 6 | 4 | 4.1,3.2 | ND | ND |
| IRAS F12112+0305 | 3.62.5 | 3.92.5 | 14 | 28 | 4 | 7 | 4.0,6.3 | [-450,210] | [-350,370] |
| NGC 4418 | 4.12.1 | 3.22.1 | 25 | 33 | 6 | 4 | 2.5,3.0 | [-280,290] | [-100,140] |
| ESO 507-G070 | 5.12.3 | 3.42.1 | 79 | 25 | 28 | 6 | 3.1,5.4 | [-400,260] | [-360,240] |
| NGC 5104 | 3.82.2 | 3.62.0 | 27 | 33 | 4 | 7 | 2.6,5.7 | [-320,340] | [-260,310] |
| NGC 5135 | 3.62.2 | 3.52.1 | 98 | 76 | 13 | 10 | 1.7,3.6 | [-80,160] | [-60,120] |
| IC 4280 | 3.82.2 | 3.32.1 | 60 | 41 | 8 | 6 | 8.0,3.5 | [-120,180] | [-150,180] |
| IRAS F14378-3651 | 3.92.4 | 3.82.0 | 23 | 17 | 5 | 2 | 5.4,2.8 | [-140,220] | [-70,170] |
| CGCG 049-057 | 3.52.6 | 3.12.4 | 30 | 52 | 5 | 8 | 4.7,0.7 | [-310,260] | [-100,230] |
| NGC 5936 | 3.52.8 | 3.12.5 | 52 | 84 | 4 | 9 | 3.9,0.7 | [-50,130] | [-20,130] |
| Arp 220 | 4.42.6 | 3.52.6 | 141 | 101 | 73 | 36 | 9.4,20.7 | [-390,420] | [-300,360] |
| NGC 5990 | 3.62.4 | – | 25 | – | 5 | – | 8.7,– | [-220,290] | – |
| NGC 6052 | 3.73.0 | 3.12.8 | 51 | 67 | 7 | 6 | 7.6,9.4 | [-30,120] | ND |
| ESO 069-IG006 | 3.83.2 | 3.53.0 | 73 | 61 | 18 | 8 | 2.5,2.9 | [-290,280] | [-170,250] |
| ESO 069-IG006-2 | 3.83.2 | 3.53.0 | 49 | 71 | 7 | 9 | 4.8,4.6 | ND | ND |
| IRAS F17207-0014 | 3.52.5 | 3.42.4 | 36 | 16 | 8 | 3 | 2.1,1.4 | [-350,430] | [70,400] |
| IRAS F18293-3413 | 3.62.3 | 3.32.1 | 174 | 31 | 33 | 5 | 3.2,0.5 | [-120,300] | [-120,300] |
| IC 4734 | 3.72.8 | 3.42.4 | 56 | 29 | 10 | 3 | 4.1,0.9 | [-170,190] | [-160,200] |
| IRAS 19542+1110 | 4.12.4 | – | 23 | – | 5 | – | 4.5,– | [-140,220] | – |
| ESO 286-IG019 | 3.62.1 | 3.42.1 | 53 | 32 | 12 | 4 | 2.0,3.5 | [-150,150] | [-140,130] |
| NGC 7130 | 3.62.0 | 3.12.0 | 102 | 75 | 19 | 9 | 6.1,8.4 | [-50,190] | [-20,160] |
| ESO 467-G027 | 3.62.0 | 3.31.7 | 57 | 51 | 6 | 6 | 7.5,10.9 | [-50,130] | ND |
| IRAS F22491-1808 | 3.82.2 | 3.72.0 | 28 | 23 | 4 | 3 | 3.6,3.1 | [-220,170] | [-70,110] |
| NGC 7469 | 3.72.6 | 3.52.1 | 86 | 64 | 25 | 13 | 3.4,2.1 | [-110,250] | [-100,260] |
| ESO 148-IG002 | 3.72.6 | 3.62.5 | 59 | 52 | 8 | 3 | 0.9,1.2 | [-80,160] | [-40,80] |
| NGC 7552 | 3.62.2 | 3.41.9 | 53 | 137 | 7 | 19 | 0.6,7.2 | [-110,160] | [-100,140] |
| NGC 7591 | 3.52.7 | 3.42.0 | 59 | 61 | 11 | 9 | 9.9,5.6 | [-240,270] | [-170,250] |
| NGC 7679 | 3.52.9 | 3.42.1 | 40 | 70 | 5 | 7 | 5.8,6.2 | [-50,220] | ND |
| Mrk 331 | 4.12.6 | 3.92.3 | 45 | 69 | 11 | 13 | 3.3,9.7 | [-320,130] | [-270,90] |
Note. — (1) Target names. (2) and (3) The achieved synthesized beam. (4) and (5) The achieved sensitivity of channel maps in units of mJy beam-1 (*1). (6) and (7) The achieved sensitivity of the velocity integrated intensity map in the unit of Jy beam-1 km s-1 (*2). (8) The achieved sensitivity of continuum emission in units of mJy beam-1 (*1). The left value is for the CO (4–3) scheduling block and the right value is for the [C I] (1–0) scheduling block. (9) and (10) The velocity range for the velocity-integrated intensity map. The values represent relative velocities with respect to the systematic velocity. The “*” means that the emission is on the edge of the spectral window due to incorrect redshift. “ND” indicates the non-detection.
| Target Name | FWHM | FWHM | d | size (FWHM) | size (FWHM) | ||
|---|---|---|---|---|---|---|---|
| CO (4–3) | [C I] (1–0) | CO (4–3) | [C I] (1–0) | CO (1–0) | CO (4–3) | [C I] (1–0) | |
| Jy km s-1 | Jy km s-1 | km s-1 | km s-1 | Jy km s-1 | (,,∘) | (,,∘) | |
| NGC 232 | 905272 | 461138 | 380 | 390 | – | (4.4,2.7,87) | (4.5,2.8,85) |
| NGC 232-2 (NGC 235) | 6922 | 9930 | 100 | 500 | – | (4.0,3.3,104) | (4.3,3.0,92) |
| NGC 232-3 (PGC 2570) | 28 | 12 | ND | ND | – | ND | ND |
| IC 1623 | 1655501 | 632191 | 270 | 270 | 23024 | (9.9,2.9,81) | (12.7,2.9,81) |
| UGC 02982 | – | 18758 | – | 280 | 28972 | – | (7.5,4.0,108) |
| NGC 1614 | 1481447 ([1710,2410]) | 549167 ([505,1080]) | 250 | 250 | 10626 | (4.6,4.0,58) | (4.5,4.1,68) |
| IRAS F05189-2524 | 22167 | 8325 | 150 | 230 | 10320 | (4.8,2.5,106) | (3.9,2.2,88) |
| IRAS 09022-3615 | 780235 | 27483 | 420 | 340 | – | (4.9,2.5,84) | (3.9,2.6,91) |
| IRAS F09111-1007 | 22669 | 18355 | 180 | 170 | – | (3.9,2.6,123) | (4.3,3.1,85) |
| NGC 3110 | 456140 | 24678 | 240 | ND | 27755 | (6.0,4.1,43) | (6.2,3.8,43) |
| IRAS F10565+2448 | 614186 | 24774 | 170 | 110 | 7214 | (3.9,3.3,65) | (3.8,3.0,110) |
| IRAS F10565+2448-2 | 16 | 13 | ND | ND | – | ND | ND |
| IRAS F12112+0305 | 347104 | 18055 | 340 | 340 | – | (4.1,3.1,76) | (4.8,3.0,65) |
| NGC 4418 | 1021306 | 18756 | 140 | 120 | – | (4.2,2.6,97) | (3.6,2.6,102) |
| ESO 507-G070 | 715221 | 357107 | 400 | 440 | 14128 | (5.1,2.6,99) | (4.0,2.4,86) |
| NGC 5104 | 728219 | 369112 | 410 | 360 | 17038 | (4.0,3.3,75) | (4.1,3.3,90) |
| NGC 5135 | 1252385 ([1850,2300]) | 1297392 ([1590,1970]) | 100 | 100 | 526105 | (6.2,4.5,15) | (6.3,4.6,9) |
| IC 4280 | 20468 ([536,1010]) | 11136 ([69,406]) | 240 | 80 | 26466 | (5.4,4.3,61) | (4.9,3.5,75) |
| IRAS F14378-3651 | 19057 | 7121 | 180 | 190 | – | (4.0,2.5,82) | (4.1,2.4,82) |
| CGCG 049-057 | 1079324 ([523,959]) | 364109 ([314,741]) | 280 | 250 | 11823 | (3.7,3.0,81) | (3.7,2.8,67) |
| NGC 5936 | 503152 ([158,575]) | 19259 ([70,426]) | 120 | 120 | 25050 | (4.5,3.6,86) | (4.0,3.1,83) |
| Arp 220 | 2864895 ([2810,3530]) | 975310 ([1110,1630]) | 370 | 400 | 602120 | (4.7,3.2,119) | (3.8,3.2,100) |
| NGC 5990 | 1188357 ([87,553]) | – ([178,680]) | 340 | – | 28069 | (20,20,0)* | – |
| NGC 6052 | 23574 ([1030,1890]) | 18 ([628,1300]) | 90 | ND | 13633 | (9.1,4.2,124) | ND |
| ESO 069-IG006 | 579181 | 342104 | 430 | 390 | 13426 | (5.0,3.4,148) | (4.5,3.5,133) |
| ESO 069-IG006-2 | 17 | 25 | ND | ND | – | ND | ND |
| IRAS F17207-0014 | 1351406 | 522156 | 460 | 370 | 19939 | (3.7,2.9,103) | (3.5,3.0,84) |
| IRAS F18293-3413 | 2955925 ([3180,3650]) | 1724519 ([2100,2500]) | 310 | 300 | 649130 | (6.4,4.6,101) | (6.1,4.4,105) |
| IC 4734 | 970297 | 764229 | 230 | 230 | 23246 | (4.9,3.1,99) | (5.0,3.0,101) |
| IRAS 19542+1110 | 13139 | – | 230 | – | – | (4.0,2.4,111) | – |
| ESO 286-IG019 | 391118 | 9629 | 190 | 210 | 571 | (3.8,2.5,100) | (3.5,2.8,118) |
| NGC 7130 | 784240 ([1880,2610]) | 393125 ([547,1080]) | 90 | 90 | 16719 | (3.8,3.1,75) | (5.0,3.5,5) |
| ESO 467-G027 | 12140 | 19 | 180 | ND | 14636 | (5.2,4.4,5) | ND |
| IRAS F22491-1808 | 15446 | 186 | 300 | 190 | 153 | (3.9,2.3,94) | (3.4,2.0,87) |
| NGC 7469 | 1933585 ([2120,2590]) | 559170 ([1130,1510]) | 240 | 210 | 20630 | (5.3,4.8,112) | (4.6,4.2,73) |
| ESO 148-IG002 | 343105 | 5316 | 160 | 120 | 357 | (20,20,0)* | (20,20,0)* |
| NGC 7552 | 48961487 ([5410,6250]) | 1052346 ([2200,2910]) | 140 | 150 | 54355 | (8.2,6.5,0) | (8.9,5.8,179) |
| NGC 7591 | 492149 ([693,1390]) | 25577 ([199,825]) | 340 | 280 | 20641 | (3.9,2.9,114) | (3.6,2.6,107) |
| NGC 7679 | 550167 ([209,946]) | 40 ([151,799]) | 200 | ND | 9716 | (8.8,7.0,111) | ND |
| Mrk 331 | 1239373 | 483147 | 280 | 310 | 5911 | (5.5,3.7,129) | (5.2,3.6,121) |
Note. — (1) Target names. (2) and (3) the velocity integrated flux. The SPIRE/FTS measurements are shown as ([A,B]), where A and B are the minimum and maximum values within the 3 error. The SPIRE/FTS values were obtained from the study by Kamenetzky et al. (2016). (4) and (5), the FWHM of the spectrum shown in Figure A2.1. (6) CO (1–0) velocity integrated flux density (Kamenetzky et al., 2016). (7) and (8), the source size is base on the FWHM value of the 2D Gaussian fitting by the imfit task. The “*” indicates the manual aperture results (see the Section A.3).
| Target Name | size (FWHM) | size (FWHM) | ||||
|---|---|---|---|---|---|---|
| ACA | SED | ACA | SED | 650 | 609 | |
| mJy | mJy | mJy | mJy | (,,∘) | (,,∘) | |
| NGC 232 | 11235 | – | 15347 | – | (4.5,2.7,75) | (4.5,2.5,78) |
| NGC 232-2 (NGC 235) | 2210 | – | 9831 | – | (3.6,3.0,155) | (5.1,3.4,97) |
| NGC 232-3 (PGC 2570) | (33) | – | (21) | – | – | – |
| IC 1623 | 10938 | [359,384] | 15349 | [447,475] | (10.7,2.7,79) | (10.4,2.8,79) |
| UGC 02982 | – | [340,436] | 9938 | [433,551] | – | (12.1,2.7,97) |
| NGC 1614 | 14850 | [272,322] | 18863 | [337,406] | (4.7,4.1,80) | (4.3,3.9,52) |
| IRAS F05189-2524 | 4916 | [71,89] | 4916 | [89,110] | (4.9,2.3,110) | (3.5,2.1,102) |
| IRAS 09022-3615 | 4918 | [91,116] | 8829 | [113,142] | (7,5,0)* | (7,5,0)* |
| IRAS F09111-1007 | 6121 | [142,162] | 8226 | [178,196] | (4.6,2.3,86) | (3.9,2.2,99) |
| NGC 3110 | 7125 | – | (51) | – | (5.7,3.7,65) | ND |
| IRAS F10565+2448 | 7625 | [140,147] | 9429 | [172,181] | (3.6,3.4,52) | (3.6,3.0,123) |
| IRAS F10565+2448-2 | (21) | – | (16) | – | – | – |
| IRAS F12112+0305 | 5820 | [73,84] | 3515 | [93,104] | (3.7,2.8,62) | (3.5,2.0,67) |
| NGC 4418 | 379114 | – | 402121 | – | (4.1,2.4,98) | (3.4,2.2,94) |
| ESO 507-G070 | 9630 | [191,223] | 14244 | [229,277] | (4.6,2.4,101) | (3.7,2.1,92) |
| NGC 5104 | 12841 | [310,336] | 16053 | [367,409] | (4.6,3.8,74) | (4.3,3.5,72) |
| NGC 5135 | 29594 | [681,730] | 351107 | [849,900] | (5.6,4.8,67) | (5.5,4.0,39) |
| IC 4280 | (33) | [418,462] | 15257 | [514,566] | – | (8.3,5.4,15) |
| IRAS F14378-3651 | 139 | [48,62] | 6021 | [59,74] | (6,6,0)* | (5.0,2.6,93) |
| CGCG 049-057 | 409124 | [470,566] | 432129 | [596,708] | (3.7,2.8,87) | (3.5,2.7,84) |
| NGC 5936 | 7328 | [465,513] | 7021 | [589,637] | (5.6,3.1,126) | (4.4,3.3,94) |
| Arp 220 | 1346430 | [1585,2101] | 1311435 | [1746,2502] | (4.8,2.9,120) | (3.8,2.9,113) |
| NGC 5990 | 6628 | [393,424] | – | [483,525] | (3.4,2.9,173) | – |
| NGC 6052 | (39) | [217,235] | (49) | [265,289] | – | ND |
| ESO 069-IG006 | 11035 | – | 14445 | – | (4.7,3.5,140) | (4.5,3.6,130) |
| ESO 069-IG006-2 | (24) | – | (23) | – | – | – |
| IRAS F17207-0014 | 33099 | [295,380] | 350105 | [364,442] | (3.9,2.7,102) | (3.4,2.5,93) |
| IRAS F18293-3413 | 381129 | [830,1019] | 556168 | [980,1227] | (6.8,4.4,109) | (5.9,3.6,113) |
| IC 4734 | 12439 | [437,520] | 23972 | [522,642] | (4.1,2.7,99) | (4.2,2.7,92) |
| IRAS 19542+1110 | 3413 | [50,59] | – | [62,76] | (5.2,2.4,111) | – |
| ESO 286-IG019 | 3010 | [70,88] | 3212 | [88,109] | (3.6,2.7,98) | (3.5,2.2,82) |
| NGC 7130 | 12744 | [440,489] | 11343 | [544,597] | (4.3,3.2,102) | (3.3,2.6,60) |
| ESO 467-G027 | (39) | [296,333] | (56) | [369,406] | – | ND |
| IRAS F22491-1808 | 3014 | – | 4715 | – | (5.2,2.4,110) | (3.5,2.3,76) |
| NGC 7469 | 18463 | – | 21466 | – | (5.0,4.0,124) | (5.2,3.8,95) |
| ESO 148-IG002 | 11937 | [75,89] | 8029 | [96,111] | (20,20,0)* | (20,20,0)* |
| NGC 7552 | 572175 | – | 1465462 | – | (8.0,5.7,146) | (8.2,5.7,174) |
| NGC 7591 | 6741 | – | 11041 | – | (6.4,2.7,103) | (4.8,2.8,85) |
| NGC 7679 | (30) | [160,176] | (32) | [195,215] | – | ND |
| Mrk 331 | 12138 | – | 17259 | – | (4.8,3.3,139) | (4.9,2.7,138) |
Note. — (1) Target names. (2)-(5) The continuum flux density associated at 650 and 609 m for ACA in this work and SED fitting from infrared data. (6)-(7) The source size was base on the FWHM value of the 2D Gaussian fitting by the imfit task. The “*” means the manual aperture results (see Section A.3).
| Target Name | |||
|---|---|---|---|
| NGC 232 | 1607484 | 718216 | 16652 |
| NGC 232-2 (NGC 235) | 12340 | 15448 | 7626 |
| NGC 232-3 (PGC 2570) | (49) | (19) | (34) |
| IC 1623 | 2272688 | 762230 | 13043 |
| UGC 02982 | – | 17253 | 6827 |
| NGC 1614 | 1249377 | 406124 | 10435 |
| IRAS F05189-2524 | 1579481 | 519158 | 22373 |
| IRAS 09022-3615 | 121323659 | 37441144 | 586203 |
| IRAS F09111-1007 | 2802865 | 1987598 | 511169 |
| NGC 3110 | 432133 | 20565 | 5519 |
| IRAS F10565+2448 | 45021369 | 1591478 | 395126 |
| IRAS F10565+2448-2 | (115) | (84) | (88) |
| IRAS F12112+0305 | 88672672 | 40471252 | 581218 |
| NGC 4418 | 15847 | 257 | 4513 |
| ESO 507-G070 | 1161359 | 508153 | 13743 |
| NGC 5104 | 851256 | 379115 | 12240 |
| NGC 5135 | 768236 | 698211 | 14445 |
| IC 4280 | 18160 | 8628 | 8933 |
| IRAS F14378-3651 | 40511223 | 1329405 | 407168 |
| CGCG 049-057 | 594178 | 17553 | 17352 |
| NGC 5936 | 29388 | 9830 | 3111 |
| Arp 220 | 3168991 | 946301 | 1068348 |
| NGC 5990 | 634190 | – | 2912 |
| NGC 6052 | 19561 | 13 | 26 |
| ESO 069-IG006 | 50291575 | 2612796 | 684217 |
| ESO 069-IG006-2 | (147) | (189) | (130) |
| IRAS F17207-0014 | 97512934 | 3308993 | 1555468 |
| IRAS F18293-3413 | 32891029 | 1684507 | 380120 |
| IC 4734 | 784239 | 541162 | 10833 |
| IRAS 19542+1110 | 2271688 | – | – |
| ESO 286-IG019 | 2848862 | 618190 | 14451 |
| NGC 7130 | 680208 | 29995 | 7627 |
| ESO 467-G027 | 12341 | 16 | 35 |
| IRAS F22491-1808 | 45591383 | 473155 | 541212 |
| NGC 7469 | 1713519 | 434132 | 12942 |
| ESO 148-IG002 | 2718832 | 370117 | 495163 |
| NGC 7552 | 437132 | 8227 | 6921 |
| NGC 7591 | 448135 | 20362 | 5927 |
| NGC 7679 | 540164 | 34 | 22 |
| Mrk 331 | 1429431 | 488149 | 12340 |
| Target Name | ||||
|---|---|---|---|---|
| NGC 232 | 0.540.23 | 2310 | 105 | – |
| NGC 232-2 (NGC 235) | 1.510.69 | 4923 | 6130 | – |
| NGC 232-3 (PGC 2570) | ND | ND | ND | – |
| IC 1623 | 0.410.17 | 178 | 63 | 0.150.05 |
| UGC 02982 | – | 4020 | - | 0.040.01 |
| NGC 1614 | 0.40.17 | 2612 | 84 | 0.280.11 |
| IRAS F05189-2524 | 0.40.17 | 4319 | 146 | 0.040.02 |
| IRAS 09022-3615 | 0.380.16 | 167 | 52 | – |
| IRAS F09111-1007 | 0.860.37 | 2612 | 188 | – |
| NGC 3110 | 0.580.26 | 2713 | 136 | 0.050.02 |
| IRAS F10565+2448 | 0.430.18 | 2511 | 94 | 0.190.07 |
| IRAS F10565+2448-2 | ND | ND | ND | – |
| IRAS F12112+0305 | 0.560.24 | 147 | 73 | – |
| NGC 4418 | 0.20.08 | 18077 | 2912 | – |
| ESO 507-G070 | 0.530.23 | 2712 | 125 | 0.140.05 |
| NGC 5104 | 0.540.23 | 3214 | 146 | 0.120.05 |
| NGC 5135 | 1.110.48 | 219 | 198 | 0.140.05 |
| IC 4280 | 0.580.27 | 10452 | 5025 | 0.020.01 |
| IRAS F14378-3651 | 0.40.17 | 3116 | 105 | – |
| CGCG 049-057 | 0.360.15 | 9942 | 2912 | 0.170.06 |
| NGC 5936 | 0.410.18 | 3215 | 115 | 0.040.02 |
| Arp 220 | 0.360.16 | 11351 | 3415 | 0.090.03 |
| NGC 5990 | – | - | 52 | – |
| NGC 6052 | 0.08 | ND | 14 | 0.007 |
| ESO 069-IG006 | 0.630.28 | 2612 | 146 | 0.140.05 |
| ESO 069-IG006-2 | ND | ND | ND | – |
| IRAS F17207-0014 | 0.410.18 | 4720 | 167 | 0.140.05 |
| IRAS F18293-3413 | 0.620.27 | 2310 | 125 | 0.150.05 |
| IC 4734 | 0.840.36 | 209 | 146 | 0.180.07 |
| IRAS 19542+1110 | – | - | – | – |
| ESO 286-IG019 | 0.260.11 | 2311 | 52 | 0.090.03 |
| NGC 7130 | 0.540.24 | 2612 | 115 | 0.130.04 |
| ESO 467-G027 | 0.16 | ND | 29 | 0.007 |
| IRAS F22491-1808 | 0.130.06 | 11458 | 126 | 0.070.03 |
| NGC 7469 | 0.310.13 | 3013 | 83 | 0.150.05 |
| ESO 148-IG002 | 0.170.07 | 13461 | 188 | 0.080.03 |
| NGC 7552 | 0.230.1 | 8438 | 167 | 0.110.04 |
| NGC 7591 | 0.550.24 | 2916 | 137 | 0.070.02 |
| NGC 7679 | 0.08 | ND | 4 | 0.022 |
| Mrk 331 | 0.420.18 | 2511 | 94 | 0.450.16 |
Note. — (1) Target names. (2)-(5) Ratio between luminosity.
| Target Name | ||||
|---|---|---|---|---|
| [C I] (1–0) | cont | CO(4–3) | CO(1–0) | |
| NGC 232 | 464139 | 670209 | 435131 | – |
| NGC 232-2 (NGC 235) | 9931 | 306108 | 3310 | – |
| NGC 232-3 (PGC 2570) | (12) | (137) | (13) | – |
| IC 1623 | 492148 | 523174 | 615186 | 40442 |
| UGC 02982 | 11134 | 276108 | – | 38897 |
| NGC 1614 | 26280 | 419142 | 338102 | 11428 |
| IRAS F05189-2524 | 335102 | 898296 | 427130 | 938187 |
| IRAS 09022-3615 | 2419739 | 2363818 | 3284990 | – |
| IRAS F09111-1007 | 1284386 | 2058681 | 758234 | – |
| NGC 3110 | 13242 | 22380 | 11736 | 33667 |
| IRAS F10565+2448 | 1028309 | 1593509 | 1219370 | 682136 |
| IRAS F10565+2448-2 | (54) | (355) | (31) | – |
| IRAS F12112+0305 | 2615809 | 2343878 | 2401723 | – |
| NGC 4418 | 164 | 18455 | 4212 | – |
| ESO 507-G070 | 32899 | 555174 | 31497 | 29258 |
| NGC 5104 | 24474 | 492162 | 23069 | 25457 |
| NGC 5135 | 451136 | 583181 | 20863 | 41382 |
| IC 4280 | 5518 | 361136 | 4916 | 29974 |
| IRAS F14378-3651 | 859261 | 1641677 | 1096331 | – |
| CGCG 049-057 | 11334 | 699211 | 16048 | 8316 |
| NGC 5936 | 6319 | 12644 | 7924 | 18637 |
| Arp 220 | 611195 | 43051403 | 858268 | 852169 |
| NGC 5990 | – | 11850 | 17151 | 19147 |
| NGC 6052 | 8 | 108 | 5216 | 14435 |
| ESO 069-IG006 | 1688514 | 2757874 | 1361426 | 1488297 |
| ESO 069-IG006-2 | (122) | (524) | (40) | – |
| IRAS F17207-0014 | 2137641 | 62641888 | 2640794 | 1837368 |
| IRAS F18293-3413 | 1088327 | 1530485 | 890278 | 924185 |
| IC 4734 | 349105 | 435133 | 21264 | 23948 |
| IRAS 19542+1110 | – | – | 615186 | – |
| ESO 286-IG019 | 399123 | 580207 | 771233 | 53610 |
| NGC 7130 | 19361 | 308112 | 18456 | 18521 |
| ESO 467-G027 | 10 | 142 | 3311 | 18947 |
| IRAS F22491-1808 | 306100 | 2181854 | 1234374 | 573114 |
| NGC 7469 | 28085 | 523170 | 463140 | 23334 |
| ESO 148-IG002 | 23976 | 1995660 | 736225 | 35471 |
| NGC 7552 | 5317 | 28087 | 11835 | 626 |
| NGC 7591 | 13140 | 238111 | 12136 | 24048 |
| NGC 7679 | 22 | 90 | 14644 | 12220 |
| Mrk 331 | 31596 | 495163 | 386116 | 8717 |
Note. — (1) Target names. (2)-(4) Molecular gas mass inferred from [C I] (1–0), dust continuum, CO (4–3), and CO (1–0), respectively (See Section A.4).
A.3 Notes for individual galaxies
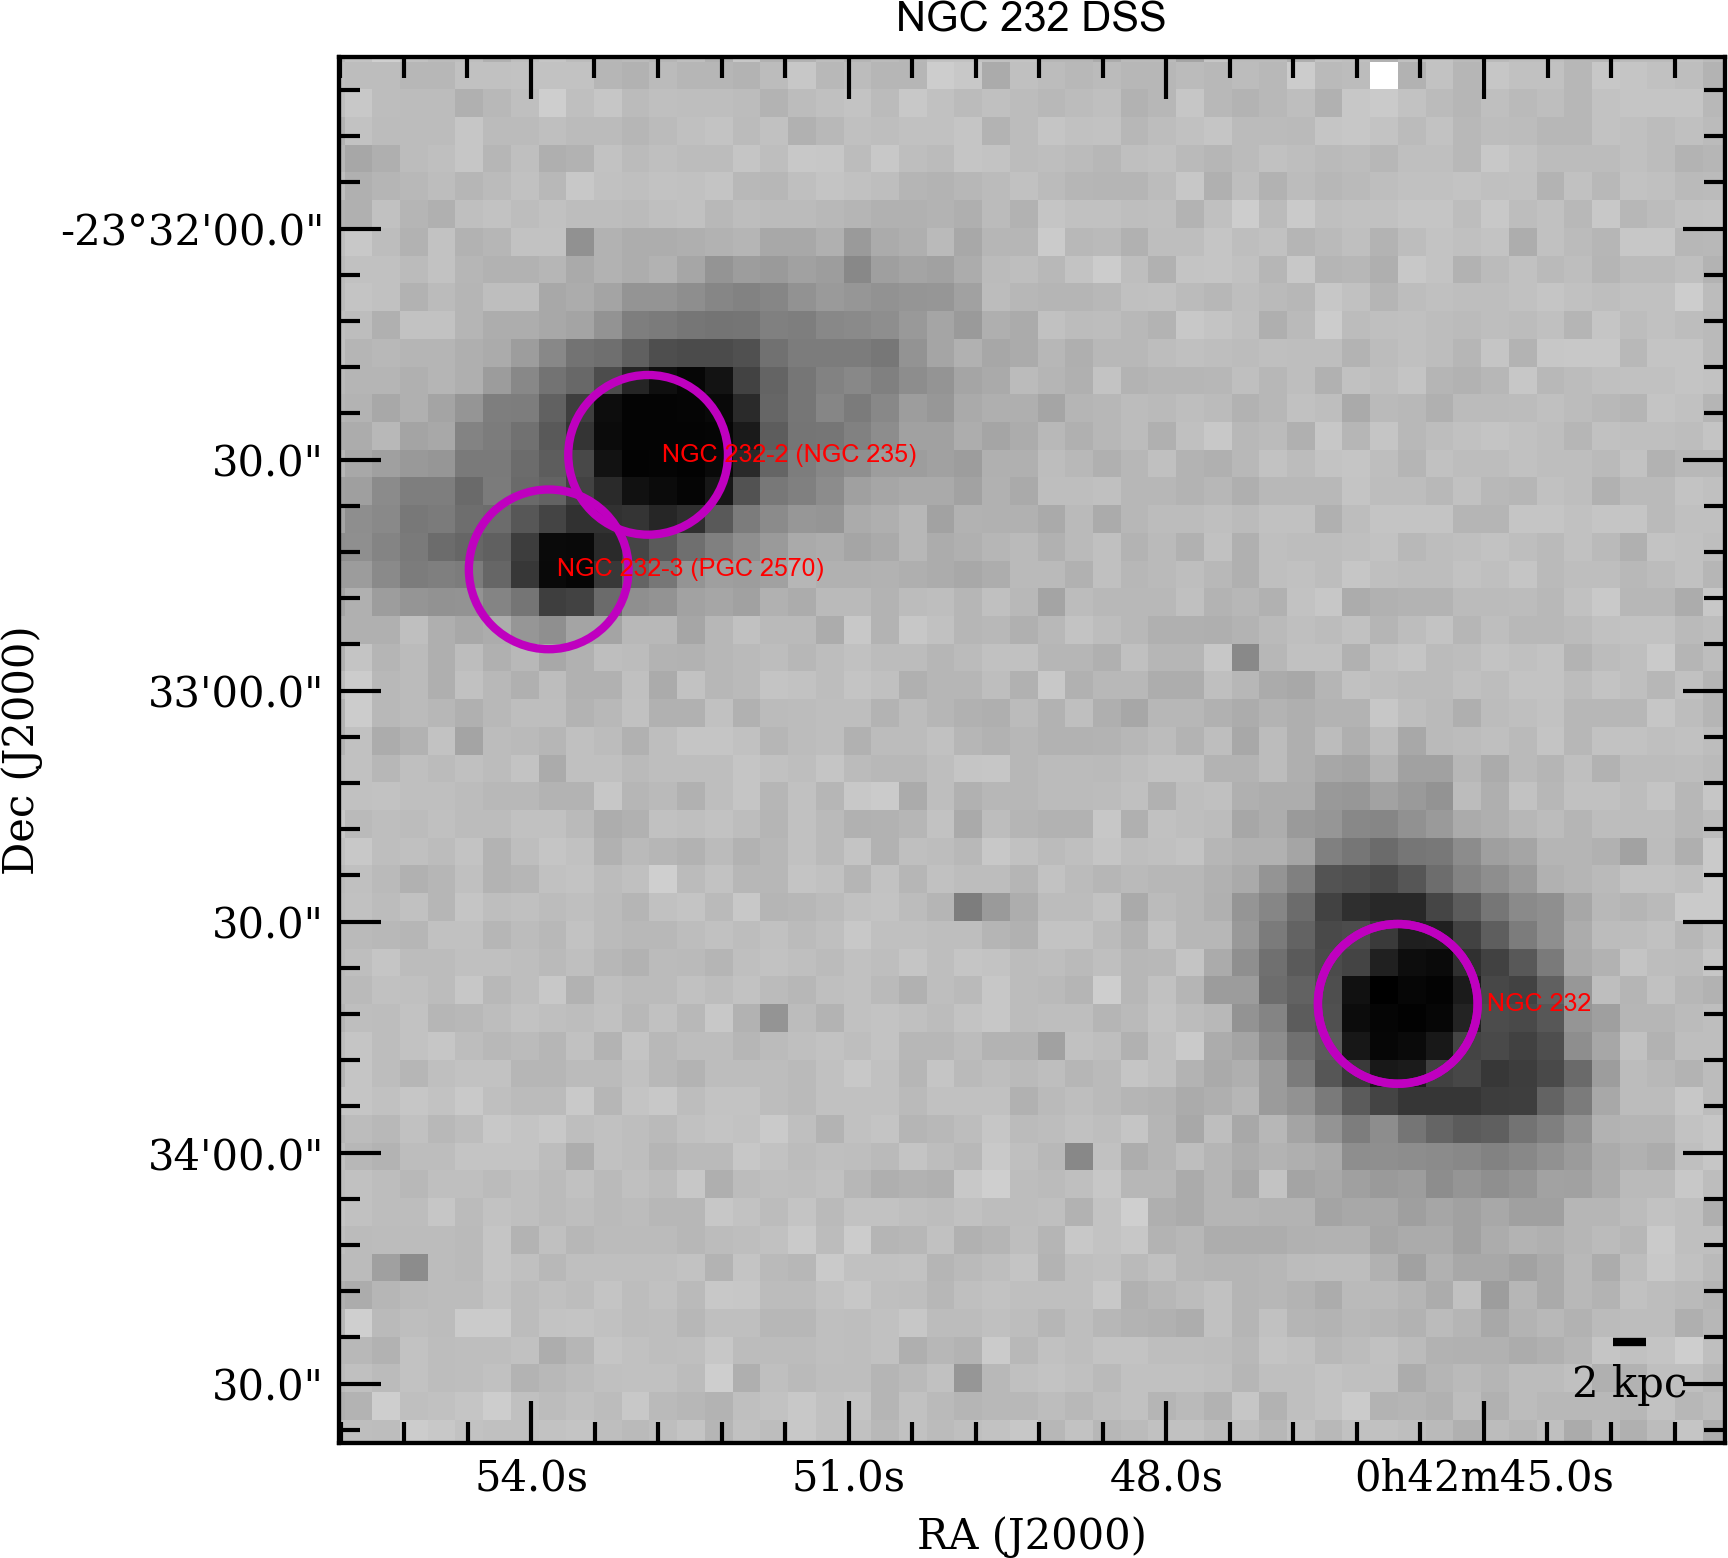
- NGC 232, NGC 235, and PGC 2570
-
NGC 232 interacts with NGC 235, which is located at kpc northeast, with a velocity offset of approximately km s-1 (Larson et al., 2016; Espada et al., 2018). In addition, NGC 235 had a minor interaction pair (PGC 2570). In NGC 232 and NGC 235, CO (4–3), [C I] (1–0), and dust continuum were detected. In NGC 235, CO (4–3) emission was detected only at the blue-shifted components (approximately km s-1 with a systematic velocity of approximately km s-1). Conversely, the [C I] (1–0) emission has a double peak in both the red- and blue-shifted components.
- IC 1623 (VV 114)
-
The FoV centers do not match between CO (4–3) and [C I] (1–0) observations due to artificial mistakes when preparing the observation plans.
- UGC 2982
-
CO (4–3) was not fully observed owing to the ALMA schedule.
- IRAS F05189-2524
-
[C I] (1–0) emission was at the edge of the spectral window.
- IRAS 09022-3615
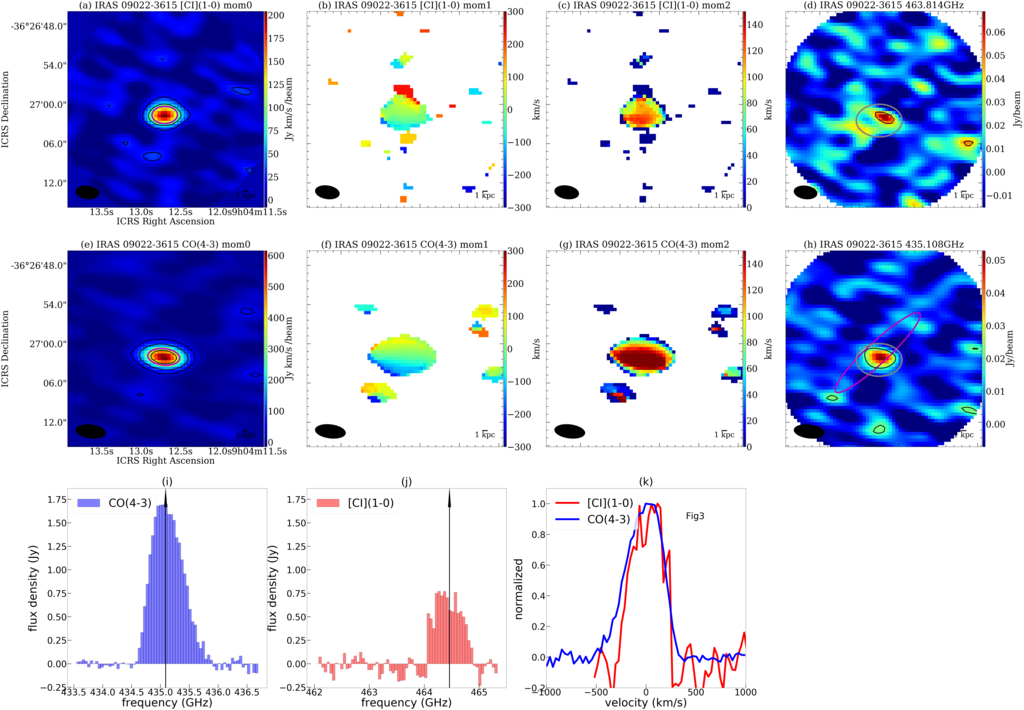
-
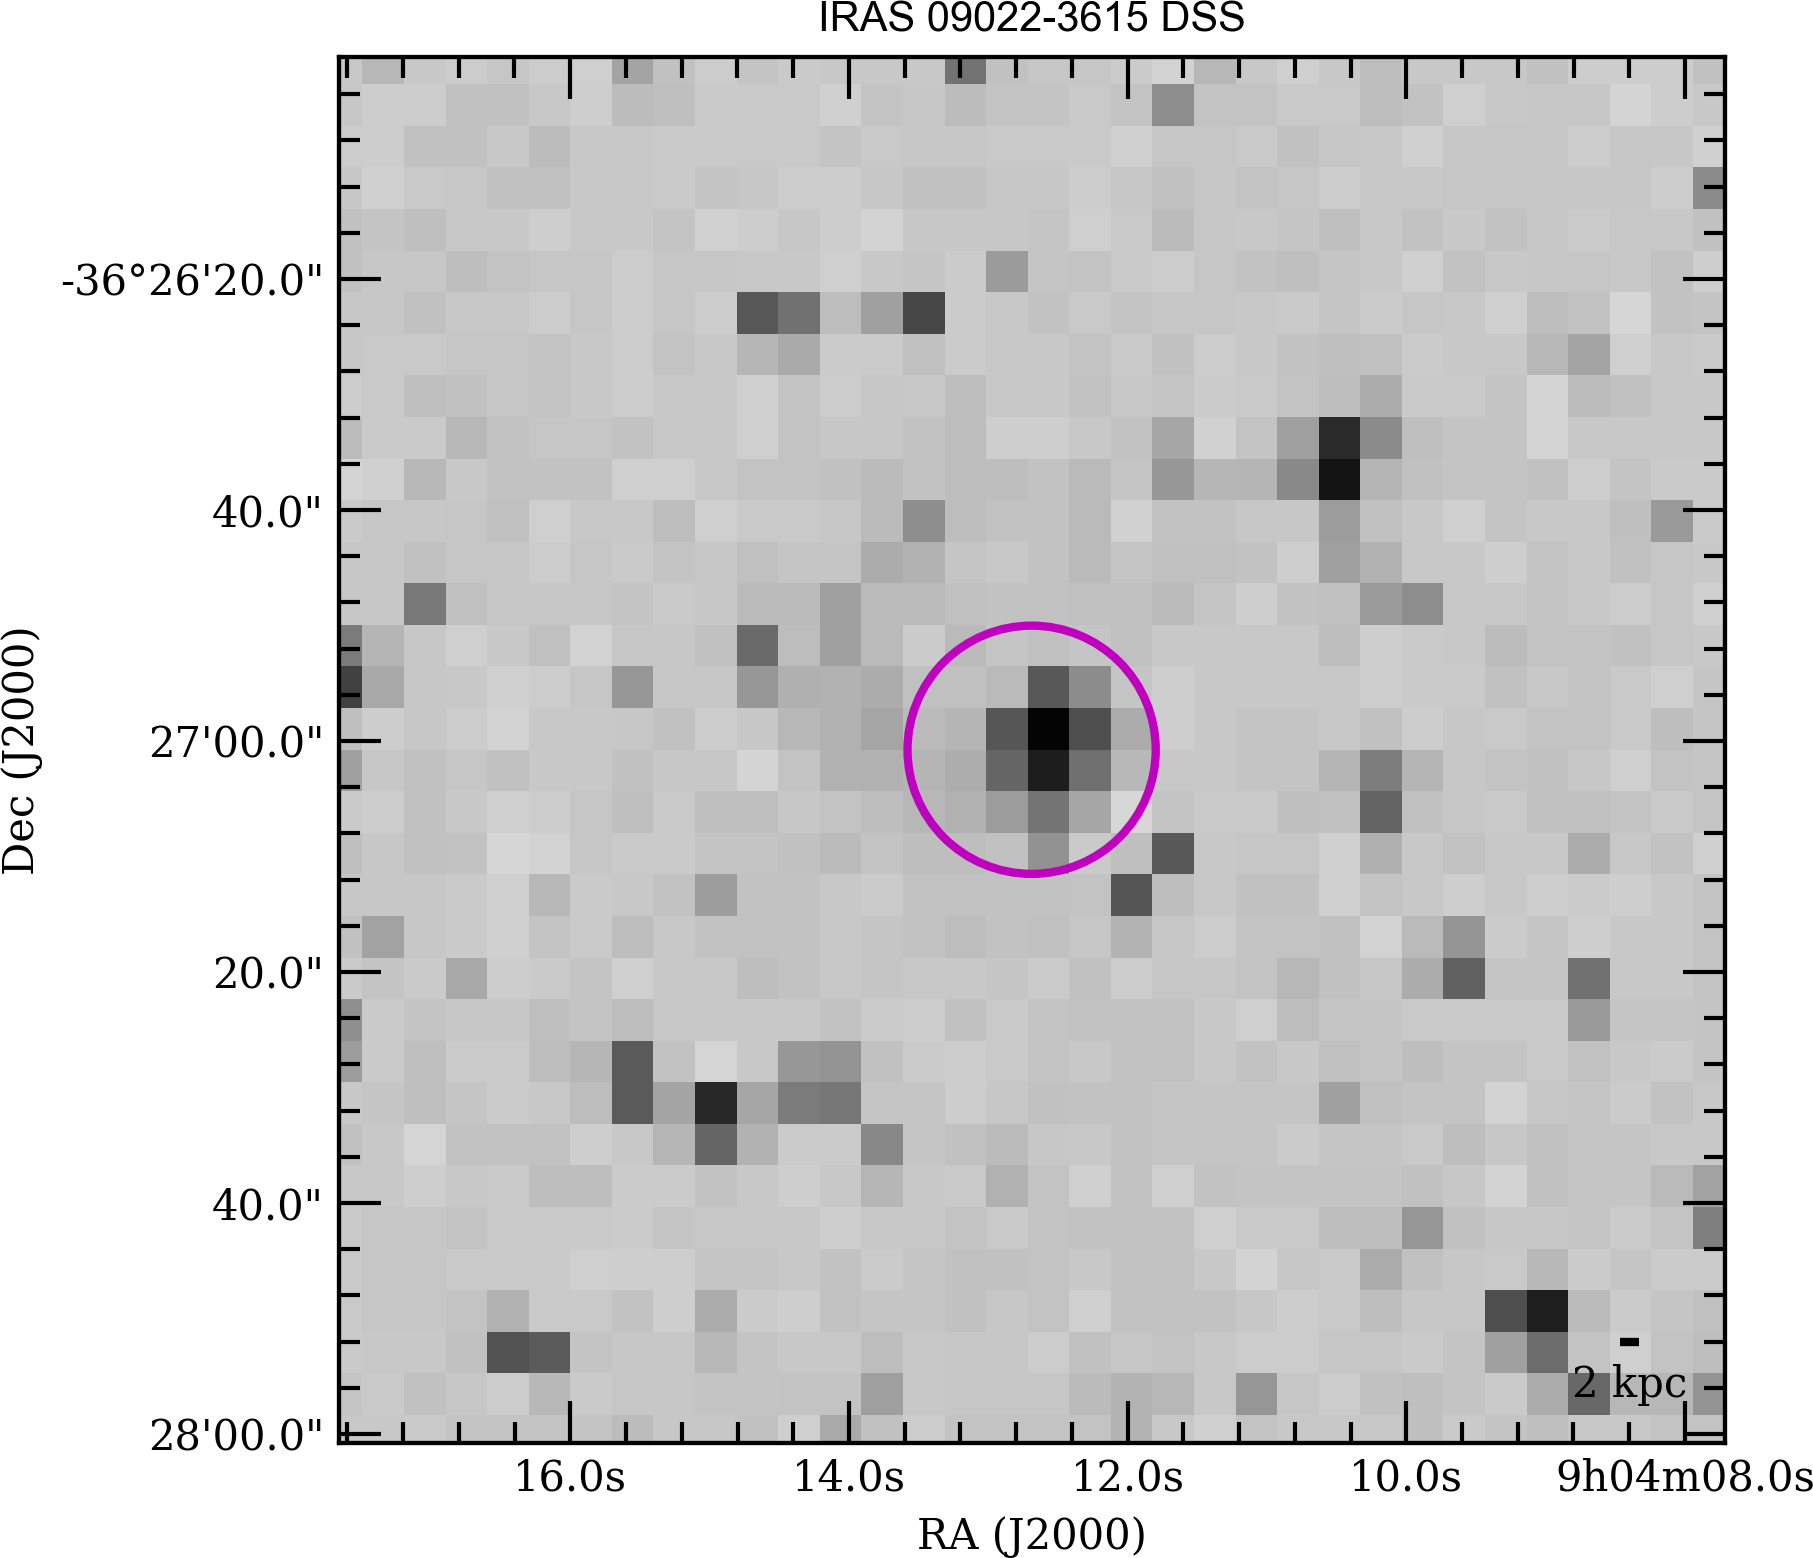
Because the continuum maps are noisy, the “” task does not work correctly. We manually chose a flux aperture of for the continuum photometries.
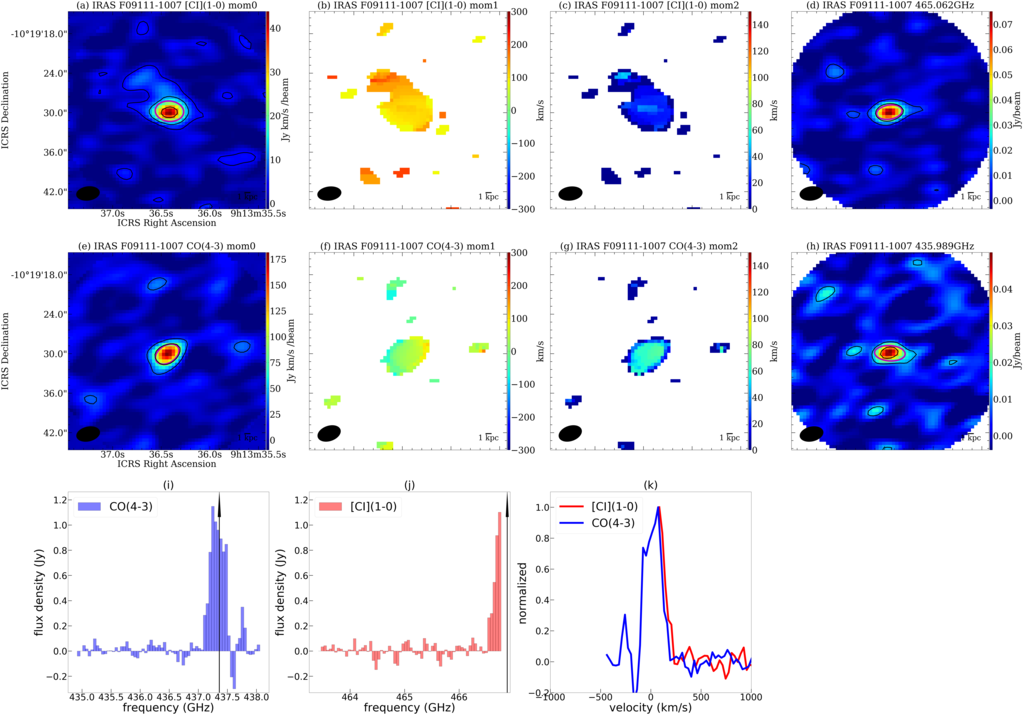
- IRAS F09111-1007
-
[C I] (1–0) emission was at the edge of the spectral window.
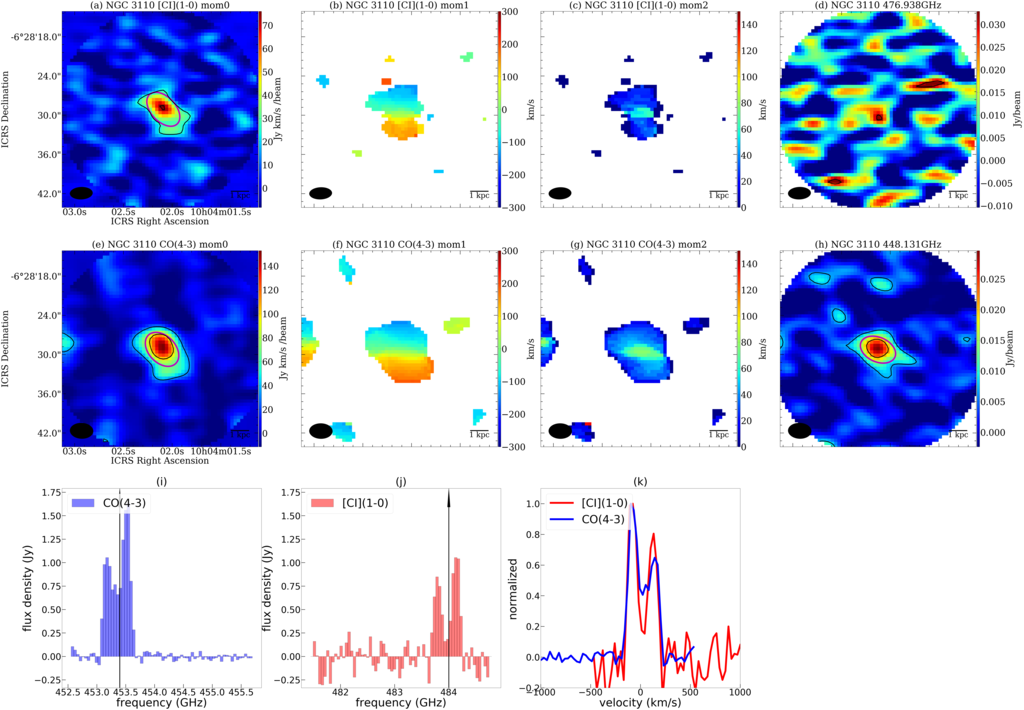
- NGC 3110
-
The 490GHz continuum emission associated with [C I] (1–0) was not detected due to poor observation conditions but a 460 GHz continuum associated with CO(4-3) was detected. This is due to the sky conditions during the observation.
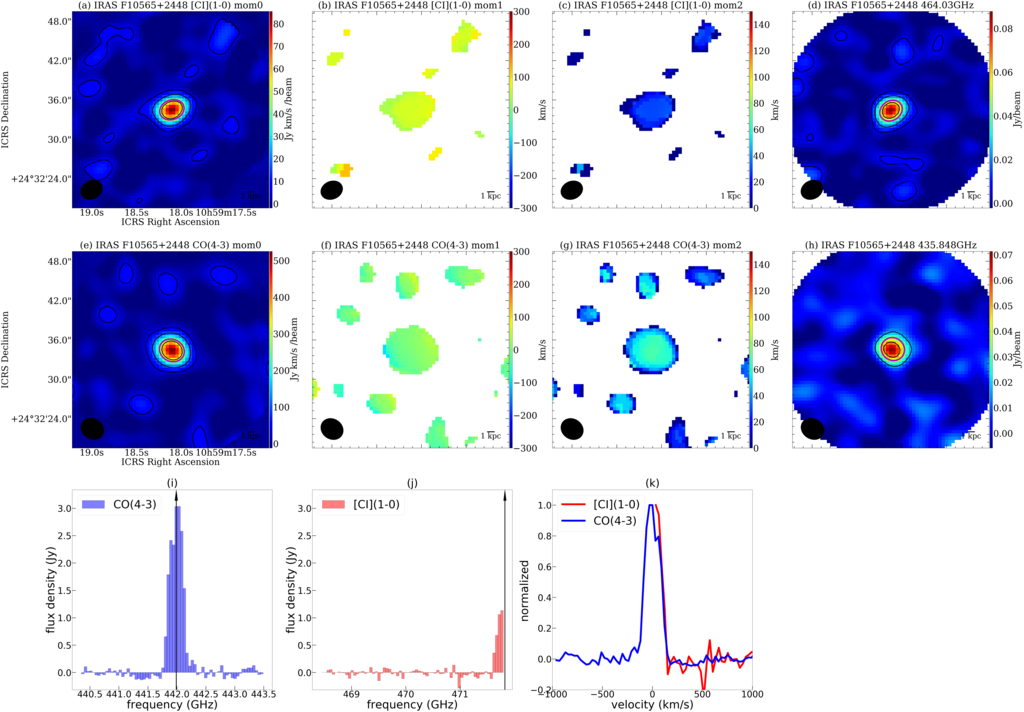
- IRAS F10565+2448
-
IRAS F10565+2448 consists of two colliding galaxies. In the main large galaxy, CO (4–3), [C I] (1–0), and dust continuum were detected. In the smaller pair galaxy (IRAS F10565+2448-2), emission were not detected. [C I] (1–0) emission was observed at the edge of the spectral window.
- NGC 4418
-
The red-shifted emission associated with the [C I] (1–0) emission line is probably fake because of the bad atmospheric window.
- IC 4280
-
Both CO (4–3) and [C I] (1–0) lines were detected. The continuum associated with [C I] (1–0) observation is detected, and the “” shows that spatially extended structure (the FWHM of ) with the continuum flux density of mJy. Because the extended structure is marginal (S/N3), this flux density may be the upper limit of the continuum flux density. However, the continuum emission associated with CO (4–3) emission was not detected, and the upper limit was mJy. The reason for the gap between 650m and 609m flux density by ACA is not clear; it is probably due to bad transmissivity around continuum emission. For this galaxy, the missing flux is difficult to determine. For example, Jy km s-1 for ACA and [531,1010] Jy km s-1 for SPIRE and Jy km s-1 for ACA and [69,406] Jy km s-1 for SPIRE. This means that the line missions do not have a significant missing flux. However, in the case of continuum emission, = mJy for ACA but =[514, 566] mJy from SED fitting, suggesting that RF is approximately . In the case of , the situation is worsened. This means that only continuum emission has a large missing flux in this system, probably suggesting a different spatial structure between gas and dust. However, we do not know the reason for the large difference in RF for line and continuum emission.
- IRAS F14378-3651
-
Both CO (4–3) and [C I] (1–0) lines were detected. Because the continuum maps associated with CO (4–3) emission are noisy, the “” task does not work correctly. We manually chose a flux aperture of for the photometry.
- CGCG 049-057
-
The spurious emission is observed at the edge of the [C I] (1–0) spectral windows but it does not affect the measurements.
- NGC 5936
-
The spectral of the frequency GHz is significantly affected by the bad sky but it does not affect the [C I] (1–0) measurements.
- Arp 220
-
Owing to the strong emission line, the tclean process cannot remove all the sidelobe components, and some components are seen in the residual maps. Therefore, moments 1 and 2 maps have uncertain structures. However, the contribution of these structures to the total integrated intensity was negligible.
- NGC 5990
-
The [C I] (1–0) observation has issues in calibration, and the data are declared as “QA2 semipass”. Because CO (4–3) emission is spatially extended, single 2D Gaussian fitting by the “” underestimates the flux. Therefore, we used the aperture to measure the CO (4–3) continuum.
- NGC 6052
-
While CO (4–3) was clearly detected, [C I] (1–0) was not detected. The details are discussed in Michiyama et al. (2020).
- ESO 069-IG006
-
ESO 069-IG00 consists of two colliding galaxies. In the main galaxy, CO (4–3), [C I] (1–0), and dust continuum were detected. In the smaller pair galaxy (ESO 069-IG00-2), emission were not detected. [C I] (1–0) emission was observed at the edge of the spectral window.
- IRAS F17207-0014
-
[C I] (1–0) emission was observed at the edge of the spectral window.
- IRAS 19542+1110
-
Both CO (4–3) and [C I] (1–0) observations were done, but [C I] (1–0) emission is outside of the spectral window. The CO (4–3) and dust continuum peak consists with optical peak.
- NGC 7130
-
An uncertain structure is seen in the souther part of the [C I] (1–0) emission. However, we use flux derived from the “” which ignores the southern emission.
- ESO 467-G027
-
CO (4–3) was robustly detected but the red-shifted components may have been outside of the spectral window. The [C I] (1–0) was marginally detected in the nuclear region. However, the measured flux is less than the upper limits, and we assume [C I] (1–0) to be non-detection. This galaxy is a candidate of C0-poor/CO-rich galaxy but the data quality is not very good; the upper limit of / is .
- IRAS F22491-1808
-
In CO (4–3) observation, the spectral window does not fully cover the entire line emission. While the S/N of the spectrum spatially integrated within the FoV is not robust, a smaller aperture can boost the S/N.
- NGC 7469
-
No comments regarding the ACA observations.
- ESO 148-IG002
-
A double peak was observed in both CO (4–3) and [C I] (1–0) emission. The uncertain north-south structure is observed in the continuum emission. This could be due to the calibration issues, but the clear reason is unknown. Further sensitive observations are required. To avoid the uncertainty, we use 20″20″aperture to measure continuum flux density.
- NGC 7679
-
While CO (4–3) was clearly detected, [C I] (1–0) was not detected.
A.4 Molecular gas mass
-
•
We use the CO (1–0) to H2 conversion factor of , which is typically applied for U/LIRGs (Bolatto et al., 2013).
(A1) -
•
Papadopoulos & Greve (2004); Bothwell et al. (2017) provided an equation to calculate the total molecular gas mass from [C I] (1–0) luminosity:
(A2) where is the C0/H2 abundance ratio, is the Einstein A coefficient, and is the excitation factor. Jiao et al. (2017) showed that varies from , assuming that the molecular gas density is cm-3 and the kinematic temperature is 2040 K. Papadopoulos & Greve (2004) considered that the typical is , but a relatively higher value () was considered in starburst galaxy M82 (Bothwell et al., 2017). In addition, a relatively smaller value () was reported for main-sequence galaxies at z=1–2 (Valentino et al., 2018). We use , assuming that , , and . We note that the determination of is uncertain because of the unknown , , and . For example, Crocker et al. (2019) modeled the [C I] and CO line emission using large-velocity gradient models and demonstrated that and using the Herschel SPIRE results. In the case of Israel (2020), the [C I] to H2 conversion factor at the central molecular zone in galaxies is calculated as ([C I]) = cm-2/K km s-1, which corresponds to (they also calculate CO (1–0) to H2 conversion factor (CO) = cm-2/K km s-1, which is a factor of ten below the standard solar neighborhood Milky Way factor of cm-2/K km s-1). Conversely, a relatively higher value of and was calculated by Dunne et al. (2021). We note that determining the conversion factor is outside the scope of this study. We fixed the conversion factor and attemted to understand the scatter among each method.
-
•
Scoville et al. (2016) derived an empirical mass to luminosity ratio between 850 m specific luminosity to molecular gas mass ( 6.7e+19 , where ) based on the comparison between CO (1–0) single-dish observations, SPIRE photometry, and SCUBA 850 m photometry. We note that this was experimentally estimated by assuming a single standard Galactic . We convert our observed continuum flux density into using the formulation of Scoville et al. (2016)
We note that the unit of is mJy and the unit of is Gpc in this equation. We assume the dust temperature of K for simple analyses.
-
•
From CO (4–3), we use
(A4) where is the median value of . However, the ratio varies for each galaxy population. For example, is in low excitation galaxies like the Milky Way (Fixsen et al., 1999), in starbursts like M82 (Weiß et al., 2005), and in some high-z SMGs (Carilli & Walter, 2013; Casey et al., 2014).